
On COVID law backing at referendum and COVID incidence in Swiss cantons
Marco Pautasso
A causal link between the proportion of votes to remove the COVID measures and COVID incidence in Swiss cantons is plausible, mediated by vaccination rates and adoption of, for example, distancing and mask wearing rules. The results of the regression model, and the equal strength of the negative correlation of vaccination rates with COVID incidence and the negative correlation of votes to maintain the COVID measures with COVID incidence, confirm the importance of behaviour to reduce the risk of COVID transmission on top of vaccination, which only works well if deployed with other measures such as contact avoidance, tracing and isolation. Spatial variation in compliance with COVID measures can contribute to shaping epidemic patterns and should be included in epidemic models, risk assessment and management.
Switzerland has recently (28 November 2021) held a referendum on whether or not to maintain the government's measures to tackle the COVID pandemic. Nationwide, more than 60% voters opposed the removal of restrictions, including the vast majority of cantons.
However, the proportion of voters in favour of the COVID law varied among cantons (from about 49% in canton Schwyz to about 71% in Canton Basel Stadt). The development of the COVID epidemic also differs among Swiss cantons, with a 7-day incidence (sum of new infections over 7 days per 100,000 inhabitants) varying (as of 7 December 2021) from about 300 in Canton Tessin to more than 1200 in Canton Thurgau (table 1).
Table 1: Data used in the analysis.
| Canton | ID | inc | vax | ref | old | urb |
| AG | 1 | 677.6 | 64.65 | 62.6 | 19.12 | 2.89 |
| AI | 2 | 1215.2 | 54.11 | 50.3 | 20.85 | 1.61 |
| AR | 3 | 1162.6 | 58.65 | 44.2 | 21.17 | 2.26 |
| BL | 4 | 838.9 | 67.54 | 65.0 | 23.40 | 2.90 |
| BS | 5 | 795.5 | 69.11 | 70.6 | 20.84 | 4.27 |
| BE | 6 | 744.4 | 66.64 | 62.5 | 22.28 | 2.00 |
| FR | 7 | 688.5 | 66.40 | 61.6 | 17.03 | 2.23 |
| GE | 8 | 871.1 | 66.13 | 62.9 | 17.35 | 3.55 |
| GL | 9 | 998.8 | 60.15 | 54.2 | 21.67 | 1.13 |
| GR | 10 | 844.1 | 66.39 | 60.9 | 23.00 | 0.73 |
| JU | 11 | 1050.1 | 60.52 | 54.7 | 22.53 | 1.96 |
| LU | 12 | 727.8 | 64.23 | 62.3 | 18.94 | 2.33 |
| NE | 13 | 550.3 | 63.46 | 64.3 | 20.31 | 2.17 |
| NW | 14 | 857.1 | 64.25 | 59.1 | 22.15 | 1.73 |
| OW | 15 | 968.3 | 57.68 | 51.2 | 20.53 | 1.41 |
| SH | 16 | 837.5 | 65.82 | 59.9 | 22.66 | 2.49 |
| SZ | 17 | 1195.1 | 57.30 | 48.6 | 19.35 | 1.87 |
| SO | 18 | 585.7 | 66.03 | 63.4 | 21.08 | 2.69 |
| SG | 19 | 993.8 | 59.79 | 54.7 | 19.65 | 2.31 |
| TI | 20 | 345.0 | 68.89 | 65.3 | 24.15 | 1.77 |
| TG | 21 | 1202.2 | 59.10 | 54.7 | 19.16 | 2.58 |
| UR | 22 | 847.4 | 62.79 | 56.3 | 22.00 | 0.68 |
| VD | 23 | 737.9 | 67.40 | 63.6 | 17.51 | 2.30 |
| VS | 24 | 620.7 | 62.74 | 58.5 | 21.10 | 1.36 |
| ZH | 25 | 658.9 | 67.84 | 66.2 | 18.03 | 3.12 |
| ZG | 26 | 767.1 | 66.14 | 63.6 | 18.38 | 2.70 |
AG: Aargau; AI: Appenzell Innerrhoden; AR: Appenzell Ausserrhoden; BE: Berne; BL: Basel-Landschaft; BS: Basel-Stadt; FR: Fribourg; GE: Geneva; GL: Glarus; GR: Graubünden; JU: Jura; LU: Lucerne; NE: Neuchâtel; NW: Nidwalden; OW: Obwalden; SG: St Gallen; SH: Schaffhausen; SO: Solothurn; SZ: Schwyz; TG: Thurgau; TI: Ticino; UR: Uri; VD: Vaud; VS: Valais; ZG: Zug; ZH: Zürich
“inc” = 7-Day COVID incidence (as of 7 December 2021), “vax” = vaccination rates (at least two doses, as of 24 November 2021), “ref” = % yes votes to maintain the COVID law at the Swiss referendum of 28 November 2021, “old” = proportion of the canton population over 65 (as of 2020), “urb” = proportion of the canton area with human settlements (German: Siedlungsfläche, as of 2013/2018).
The question arises of whether the results of the referendum are correlated with the incidence of the infection. Cantons with a higher proportion of voters opposing the COVID restrictions may also have a lower proportion of vaccinated inhabitants, which can in turn facilitate viral transmission. In addition, these cantons may tend to have fewer citizens following behavioural rules such as avoidance of large gatherings, wearing of masks in indoor settings and isolation in the case of positive tests, again leading to stronger epidemic development, other things being equal.
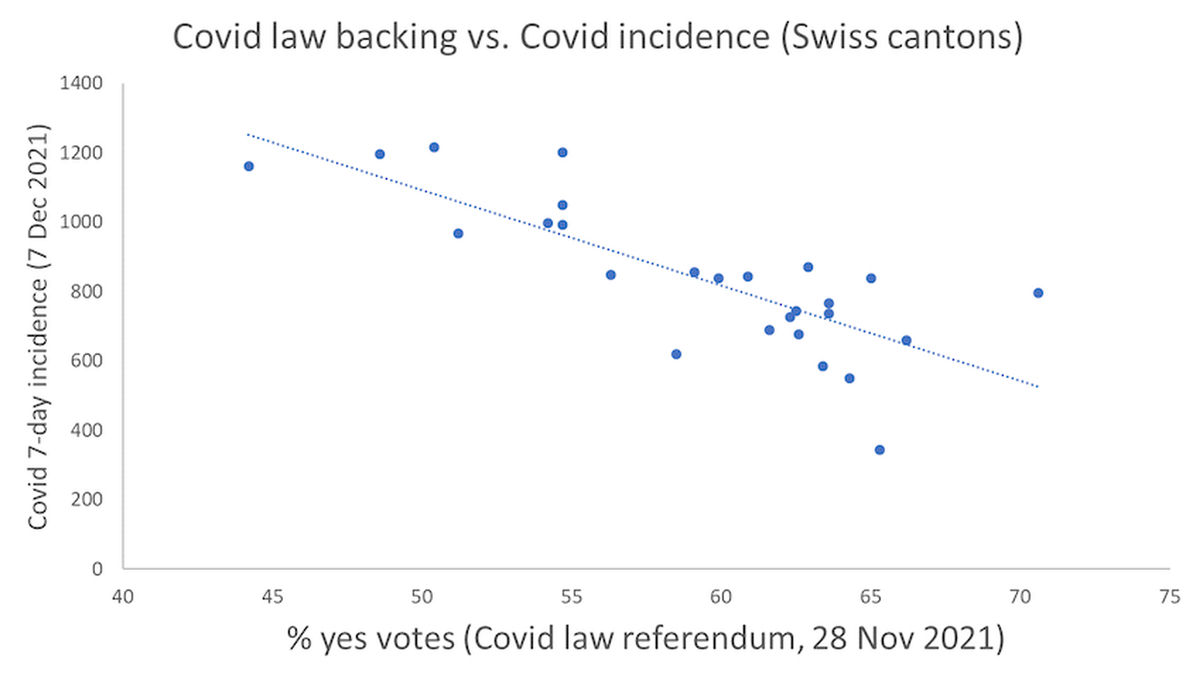
It turns out that the proportion of votes to maintain the COVID measures in the Swiss cantons is negatively (Pearson correlation coefficient –0.79) correlated with the 7-day COVID incidence (as of 7 December 2021; fig. 1).
Figure 1: Correlation of the proportion of yes votes to maintain the COVID law (referendum of 28 November 2021) and 7-day COVID incidence (sum of new infections over 7 days per 100,000 inhabitants, as of 7 December 2021) in Swiss cantons. Data from: https://www.swissinfo.ch/ger/resultat-covid-gesetz-zertifikat/47141410 and https://www.covid19.admin.ch/en/overview
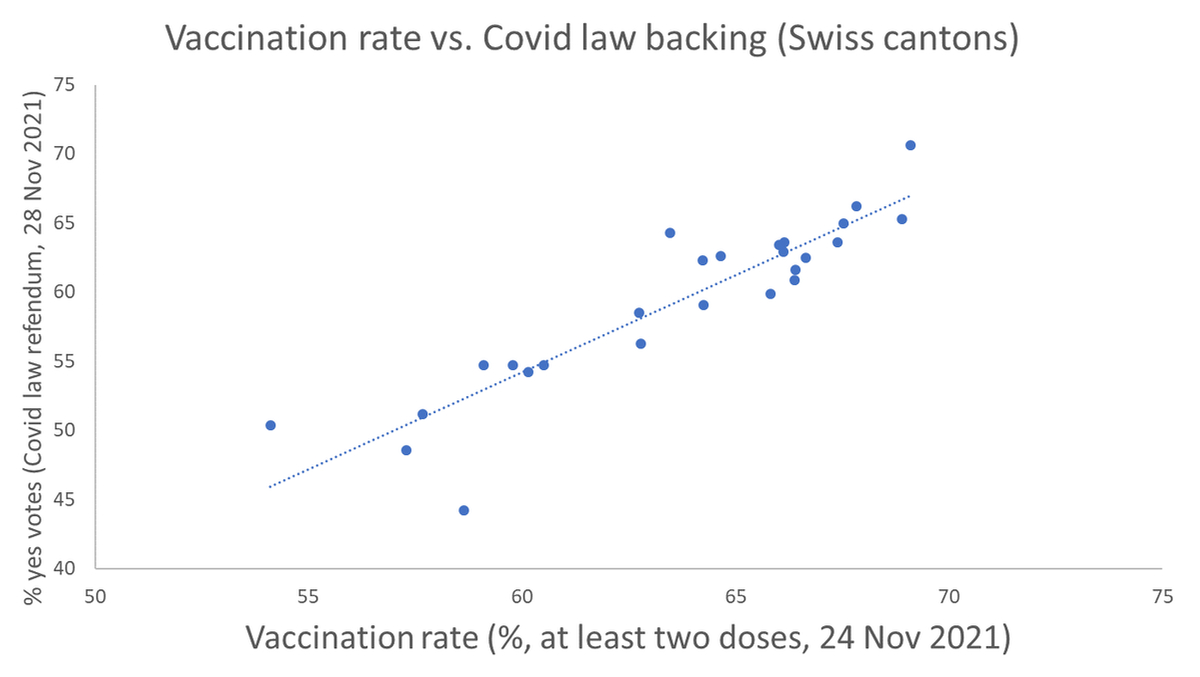
Vaccination rates (at least two doses, as of 24 November 2021) in Swiss cantons are strongly positively correlated (Pearson correlation coefficient 0.91) with the proportion of votes backing the COVID law (fig. 2).
Figure 2: Correlation of the proportion of yes votes to maintain the COVID law (referendum of 28 November 2021) and vaccination rates (at least two doses, as of 24 November 2021) in Swiss cantons. Data as in fig. 1 and from: https://www.covid19.admin.ch/en/vaccination/persons
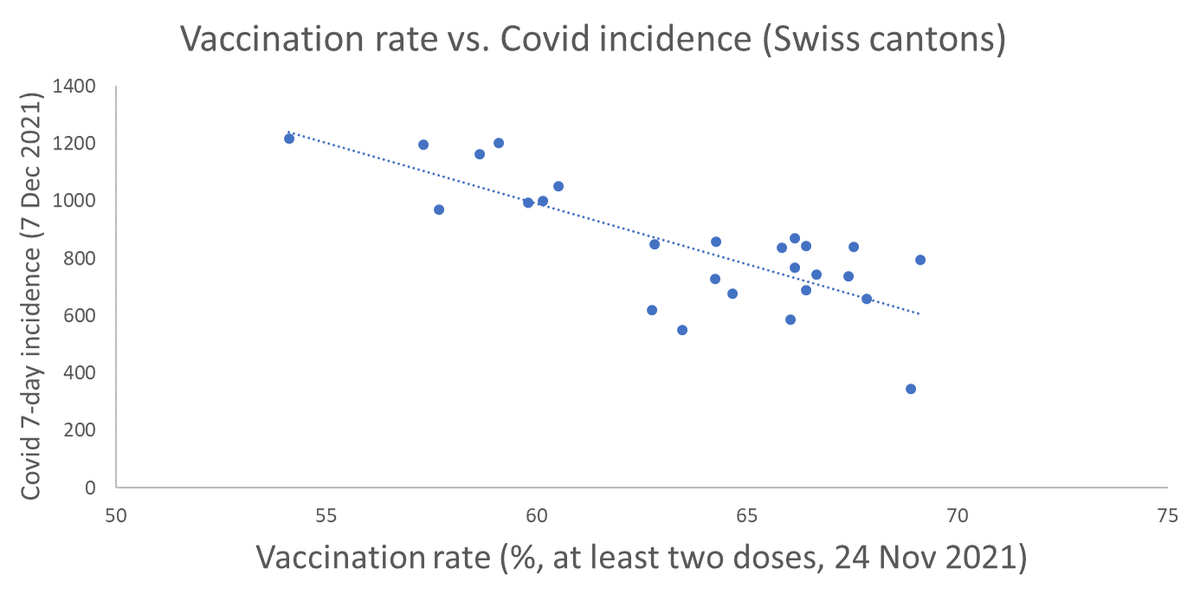
Vaccination rates (at least two doses) in Swiss cantons (as of 7 December 2021) are instead negatively correlated with the 7-day COVID incidence (fig. 3) (Pearson correlation coefficient –0.78).
Figure 3: Correlation of vaccination rates (at least two doses, as of 24 November 2021) and 7-day COVID incidence (as of 7 December 2021) in Swiss cantons. Data as in figures 1 and 2.
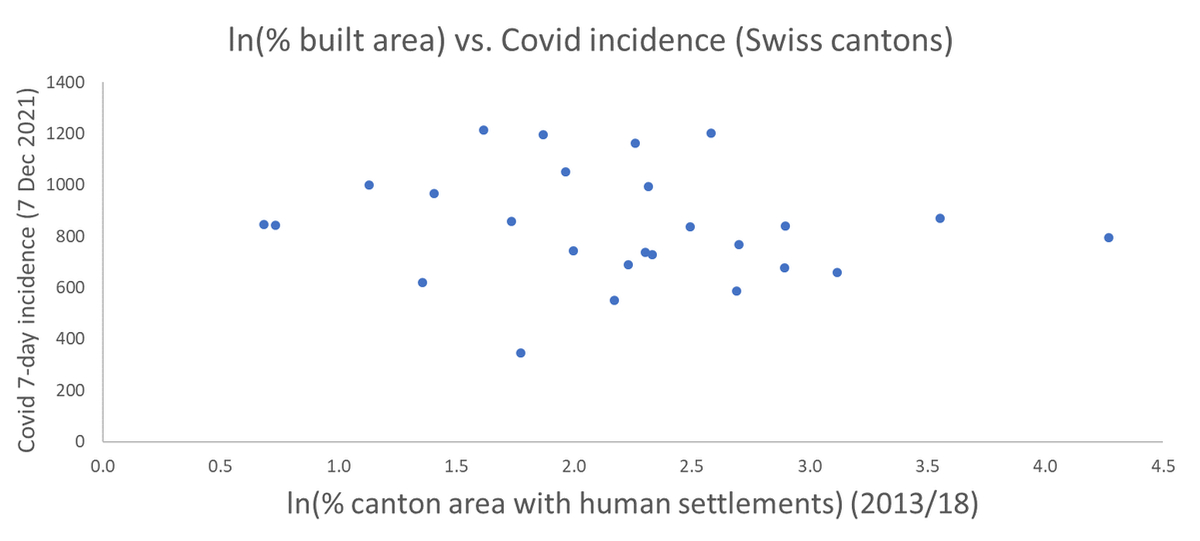
The 7-day COVID incidence (again as of 7 December 2021) is not significantly correlated with, on their own, either the proportion of the population over 65 (fig. 4) or the proportion of canton area with human settlements (fig. 5), two potential confounding factors.
Figure 4: Correlation of 7-day COVID incidence (as of 7 December 2021) and proportion of the population over 65 in Swiss cantons. Data as in figure 1 and from https://www.bfs.admin.ch/bfs/de/home.html
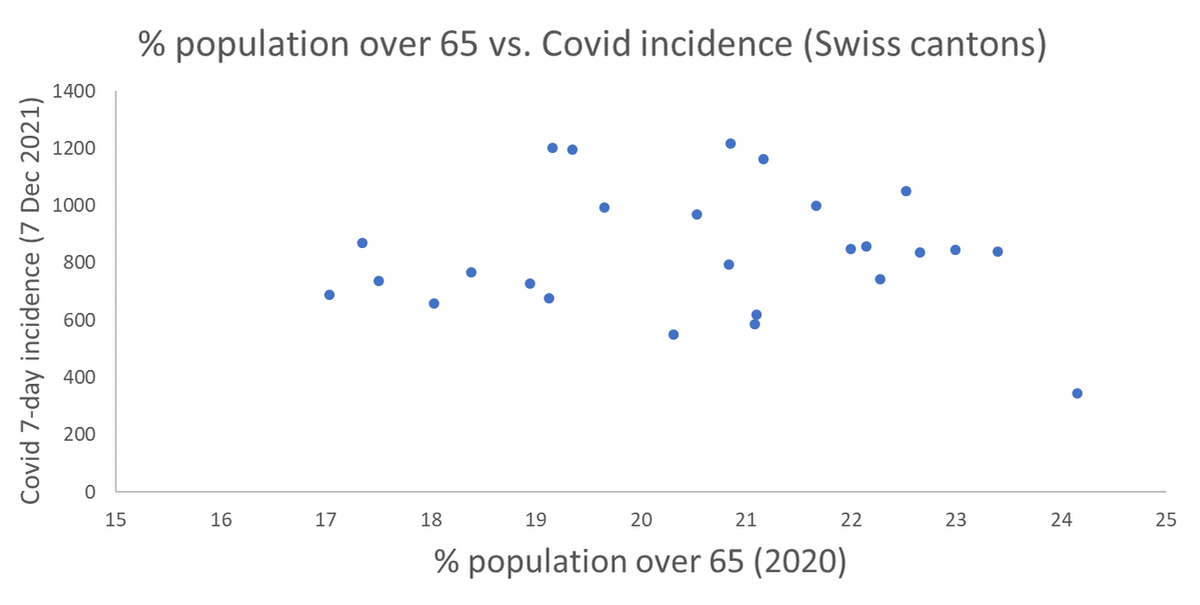
Figure 5: Correlation of 7-day COVID incidence (as of 7 December 2021) and proportion of the canton area with human settlements. Note that the natural logarithm of the proportion of canton area with human settlements was taken because the proportion itself was not normally distributed. Data as in figure 1 and from www.bfs.admin.ch/bfs/de/home.html.
In a multiple linear regression model, the proportion of votes to maintain the COVID measures and the proportion of canton area with human settlements are significant predictors of the 7-day COVID incidence (as of 7 December 2021), whereas vaccination rates and the proportion of the population over 65 are not (table 2).
| Table 2: Results of a multiple linear regression model (obtained using “lm” in R) with 7-Day COVID incidence (“inc”, as of 7 December 2021) as a function of proportion of yes votes to maintain the COVID law (“ref”, referendum of 28 November 2021), vaccination rates (“vax”, at least two doses, as of 24 November 2021), proportion of the population over 65 (“old”, as of 2020), and natural logarithm of the proportion of canton area with human settlements (“urb”, as of 2013/2018). Note that the natural logarithm of the proportion of canton area with human settlements was taken because the proportion itself was not normally distributed. | |||
| Variable | Estimate | Standard error | p-value |
| Intercept | 3266 | 487 | <0.001 |
| ref | –26.530 | 9.644 | 0.01 |
| vax | –14.374 | 14.157 | 0.32 |
| old | –1.076 | 12.187 | 0.93 |
| urb | 6.337 | 1.983 | 0.004 |
Correlation does not imply causation, but a causal link between the proportion of voters opposing the COVID measures and COVID incidence is plausible, mediated by vaccination rates (fig. 2) and adoption of, for example, distancing and mask wearing rules. In the USA, political partisanship has been shown to be associated with lower adoption of mobility restrictions to reduce COVID epidemic development.
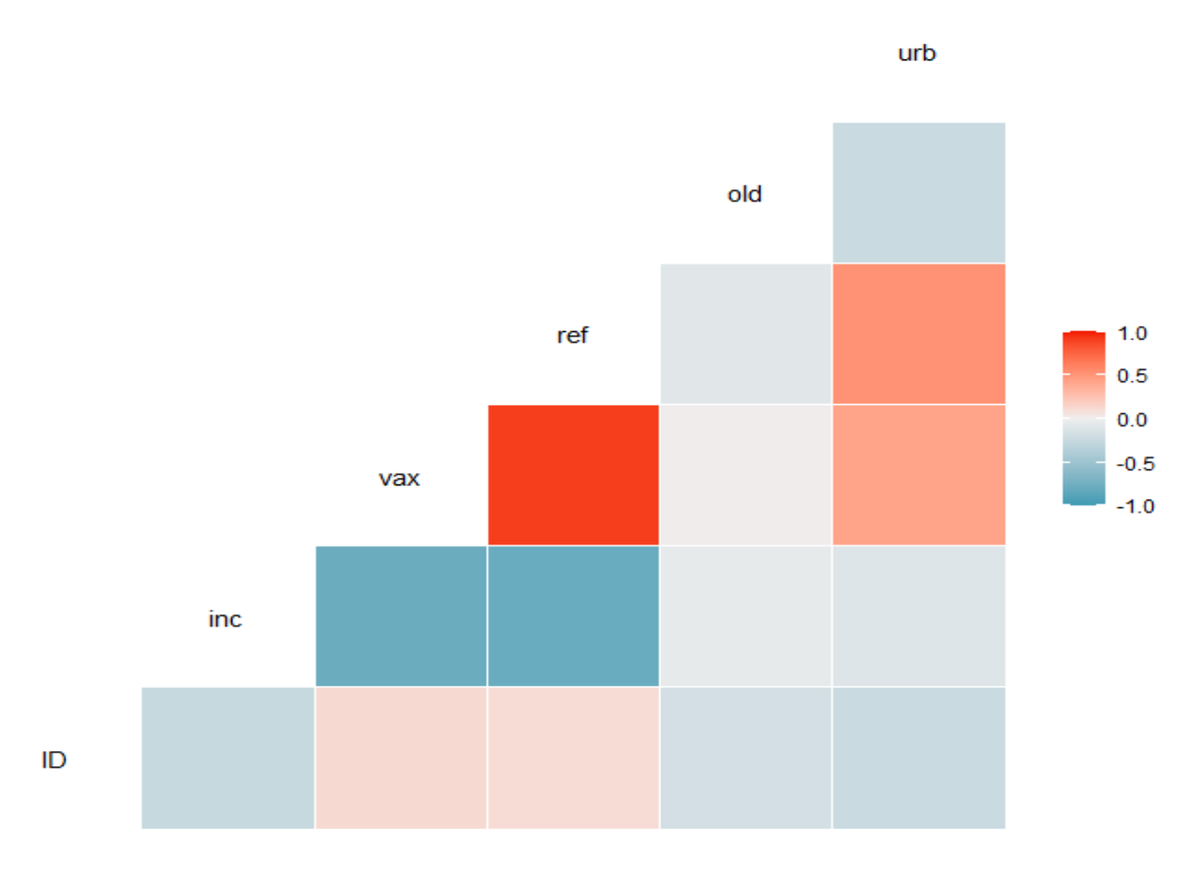
The results of the linear regression model (table 2), and the equal strength of the negative correlation of vaccination rates and COVID incidence and of the negative correlation of votes in favour of the COVID law and COVID incidence (fig. 6), confirm the importance of behaviour to reduce the risk of COVID transmission on top of vaccination, which does not work well on its own, but only if deployed with other measures such as contact avoidance and tracing.
Figure 6: Display of the correlation structure of the studied variables using GGally::ggcorr in R. Note: “ID” = ascending number assigned to each canton (acts as a random variable), “inc” = 7-Day COVID incidence (as of 7 December 2021), “ref” = % yes votes to maintain the COVID law at the Swiss referendum of 28 November 2021, “vax” = vaccination rates (at least two doses, as of 24 November 2021), “old” = proportion of the canton population over 65, “urb” = natural logarithm of the proportion of the canton area with human settlements (a proxy of urbanisation).
These Swiss data are in agreement with observations in Germany of a stronger COVID epidemic in areas with more far-right voters and in Brazil of the second COVID wave mostly affecting municipalities that backed Bolsonaro in the 2018 elections, where scientific denialism among the population was stronger. The correlation of vaccination rates, backing of the measures against the pandemic and reduced epidemic development can be found also at a local level, as shown for the municipalities of Canton Zug, Switzerland. Spatial variation in compliance with vs opposition to COVID measures can contribute to shaping epidemic patterns and should be included in epidemic models, risk assessment and management.
Many thanks to anonymous reviewers for the helpful comments on a previous draft.
The author declares no conflict of interest. The positions and opinions presented in this article are those of the authors alone and are not intended to represent the views or scientific works of EFSA. No funding was received for this study.
Marco Pautasso, European Food Safety Authority, via Carlo Magno 1a, Parma, Italy, marpauta[at]gmail.com