Shortages of paediatric primary care and contributing factors in Switzerland: a nationwide
paediatrician survey and cross-sectional workforce analysis
DOI: https://doi.org/https://doi.org/10.57187/5362
Lorenz M. Leuenberger12,
Fabiën N. Belle1,
Julian Jakob345,
Rotraud K. Saurenmann46,
Oliver Sutter7,
Philipp Jenny48,
Claudia E. Kuehni15
1 Child and Adolescent Health (CAH), Institute of
Social and Preventive Medicine, University of Bern, Switzerland
2 Graduate School for Health Sciences, University
of Bern, Switzerland
3 Institute of Primary Health Care (BIHAM),
University of Bern, Switzerland
4 Swiss Society of Pediatrics, pädiatrie schweiz
5 Department of Pediatrics, Inselspital, Bern
University Hospital, University of Bern, Switzerland
6 Center of Pediatrics, Cantonal Hospital
Winterthur, Switzerland
7 Pediatric primary care practice, Worb,
Switzerland
8 Pediatric primary care practice, Altstätten,
Switzerland
Summary
BACKGROUND
AND AIM OF THE STUDY: Shortages of primary care paediatricians in Switzerland
have been reported by the media, parents, and physicians. We sought to gain a
comprehensive understanding of the paediatric primary care workforce by
quantifying supply density and assessing paediatricians’ views on the shortage
and its contributing factors.
METHODS:
We conducted an online survey from September 2024 to February 2025 among all
board-certified members of the Swiss Society of Paediatrics, excluding retired
members. The questionnaire included questions on perceived shortage, working
conditions, and contributing factors. We estimated the paediatric primary care
workforce in full-time equivalents (FTEs) and calculated the supply density across
Swiss cantons by combining data from our
survey with physician statistics from the Swiss Medical Association and
population statistics from the Federal Statistical Office.
RESULTS:
We contacted 1940 paediatricians, 1155 (60%) of whom answered our survey. Among
respondents, 61% were based in practices, 29% in hospitals, and 10% in both
settings. We estimated that 1017 full-time equivalent (FTE) primary care paediatricians
worked in Switzerland in 2024, resulting in 0.63 FTEs per 1000 children (<18
years). Among primary care paediatricians, two-thirds (70% [95% CI 68–73])
perceived a shortage. Most reported working part-time (87% [86–89]), and respondents
saw a median of 22 [IQR 17, 26] patients per full day. Respondents agreed that
there is an insufficient number of physicians in Switzerland (69% [66–71]) and
a high prevalence of part-time work (65% [62–67]), resulting in insufficient
FTEs in paediatric primary care (79% [77–81]). Marked regional differences in
supply density emerged, and this variability could be partly attributed to
associations with financial disincentives (R2: 0.39) and rural
characteristics (R2: 0.33).
CONCLUSION:
The regional paediatric primary care shortages in Switzerland, which are linked
to a limited workforce, prevalent part-time work, financial disincentives, and
the rural nature of affected regions, highlight the need for regionally
targeted policy solutions.
Abbreviations
- FMH
-
Foederatio Medicorum Helveticorum, Swiss Medical Association
- FTE
-
full-time equivalent
- GDP
-
gross domestic product
- MICE
-
multiple imputation by chained equations
- SSP
-
Swiss Society of Paediatrics, pädiatrie schweiz
- TARMED
-
Swiss billing system for outpatient medical services
Introduction
Primary
health care is fundamental to equitable and cost-efficient health systems
worldwide [1-4]. Yet many European countries, including Switzerland, face
physician shortages in primary care [5, 6]. According to statistics from the Swiss
Medical Association (FMH), the density of primary care physicians in
Switzerland remains relatively low, at approximately 0.8 full-time equivalents
(FTEs) per 1000 inhabitants [6]. Paediatric primary care appears to face similar
challenges [7–9], although Switzerland has a high density of paediatricians
compared with other countries [10]. The situation is likely to worsen as many paediatricians
approach retirement age, and expected immigration of paediatricians will not be
sufficient to address this [6, 11].
Different
health system factors acting on paediatricians and parents likely reduce the paediatric
primary care workforce or limit its productivity. Internationally, the
unattractiveness of primary care, which may be linked to lower financial
reimbursement and prestige, combined with comparatively less focus on paediatrics
in medical school, reduces the workforce [5, 12–14]. Increased parental expectations
might limit productivity [13, 15], and the degree of urbanisation may explain
regional differences in supply density [16-19]. In Switzerland, the overall
physician shortage and administrative burdens, part-time work, the unattractiveness
of primary care, and parental demand and expectations likely have implications
for health policy [6, 15, 20]. Yet these factors remain largely unexplored. Working
conditions in practices, such as the number of patients seen per day and the duration
of consultations, have not been systematically quantified. Furthermore, we do
not know how paediatricians perceive the shortage or what motivates them to
choose primary care, nor is it clear whether these factors vary across regions.
To estimate
the supply density of paediatric primary care, assess paediatricians’
perceptions of shortages, and explore other factors affecting paediatric
primary care, we analysed publicly available national data in combination with
data from a questionnaire surveying all paediatricians in Switzerland.
Materials and methods
Study design and data
collection
We invited all
clinically active, board-certified paediatricians who were members of pädiatrie
schweiz – the Swiss Society of Paediatrics (SSP) – to participate in a
questionnaire-based, cross-sectional survey. In September 2024, we sent a
personalised link to the online survey via email to all board-certified, non-retired
members. We sent three targeted reminders to non-responders at 10 days, 20
days, and 4 months after the initial invitation. We closed the survey in
February 2025. We excluded retired and clinically inactive paediatricians from
our analysis. The study did not fall under the Swiss Human Research Act; therefore,
no ethical approval was needed.
We
developed the questionnaire in collaboration with an advisory group of primary
care paediatricians, hospital paediatricians, representatives of the SSP, and
epidemiologists. We collected basic information from paediatricians, including age,
gender, paediatric training, work setting, district of employment (canton), and
degree of urbanisation. Paediatric training in Switzerland includes six years
of medical school and five years of paediatric residency (supplemental figure 1 in
the appendix). Switzerland is divided into 26 cantons, equivalent to federal states
or districts
in other countries, which serve as the main administrative units. We asked
participants whether they perceived a shortage of primary care paediatricians
in their region, as well as about their working conditions and potential factors
contributing to the shortage. The full questionnaire and information about the
coding of variables are available in the appendix.
Outcome
We
estimated the cantonal supply density (number of FTE practice paediatricians
per 1000 children) using the working percentage from our survey, the number of
practice paediatricians from FMH statistics for 2024 (https://aerztestatistik.fmh.ch/)
[6], and paediatric population data from the Federal Statistical Office (supplemental
methods in the appendix) [21]. We defined the paediatric population as children and
adolescents
aged 0–17 years, consistent with United Nations norms and with the Swiss
Conference of Cantonal Health Directors, which defines paediatric hospital care
as care provided to patients aged <18 years [22, 23]. We also applied alternative
definitions: <16 years, based on the
most common survey response regarding the proposed upper age limit for paediatric
care (47% chose <16 years), and <20 years, based on SSP recommendations
(“until the end of adolescence”) [24]. We imputed the working percentage for
practice paediatricians not reached by our survey using multiple imputation by
chained equations (MICE), based on age, sex, and major region (aggregation of
cantons into seven regions of Switzerland). As sensitivity analyses, we used
additional methods to impute the working percentage and also estimated the
supply density for major regions (supplemental
methods in the appendix). Because nearly all
practice paediatricians (98%, supplemental table 1 in the appendix) performed primary
care
consultations (preventive well-child visits, emergencies), we regarded all practice
paediatricians, including those with or without a further specialisation, as
working in primary care when quantifying the paediatric primary care workforce.
For paediatricians working in both a hospital and a practice, we only counted
their working percentage in the practice towards the paediatric primary care
workforce.
Table 1Characteristics of surveyed
paediatricians.
| |
Total, n (%) |
Work setting, n (%) |
| Practice |
Hospital |
Both settings |
| 1155 (100) |
704 (61.0) |
331 (28.7) |
120 (10.4) |
| Gender, n (%) |
Female |
820 (71.0) |
517 (73.4) |
231 (69.8) |
72 (60) |
| Male |
331 (28.7) |
186 (26.4) |
97 (29.3) |
48 (40) |
| Prefer not to answer |
4 (0.3) |
1 (0.1) |
3 (0.9) |
– |
| Age group (years), n (%) |
30–39 |
241 (20.9) |
117 (16.6) |
106 (32.0) |
18 (15) |
| 40–49 |
402 (34.8) |
252 (35.8) |
107 (32.3) |
43 (36) |
| 50–59 |
346 (30.0) |
212 (30.1) |
88 (26.6) |
46 (38) |
| 60–64 |
131 (11.3) |
95 (13.5) |
28 (8.5) |
8 (8) |
| ≥65 |
32 (2.8) |
27 (3.8) |
1 (0.3) |
4 (3) |
| Prefer not to answer |
3 (0.3) |
1 (0.1) |
1 (0.3) |
1 (<1) |
| Country of medical school, n (%) |
Switzerland |
904 (78.3) |
559 (79.4) |
255 (77.0) |
90 (75) |
| Europe |
239 (20.7) |
137 (19.5) |
73 (22.1) |
29 (24) |
| Germany |
144 (12.5) |
80 (11.4) |
46 (13.9) |
18 (15) |
| Italy |
27 (2.3) |
14 (2.0) |
9 (2.7) |
4 (3) |
| Austria |
18 (1.6) |
10 (1.4) |
5 (1.5) |
3 (3) |
| France |
15 (1.3) |
10 (1.4) |
3 (0.9) |
2 (2) |
| Other European country |
35 (3.0) |
23 (3.3) |
10 (3.0) |
2 (2) |
| Non-European country |
12 (1.0) |
8 (1.1) |
3 (0.9) |
1 (<1) |
| Training in a paediatric practiceb, n (%) |
Yes |
370 (32.4) |
261 (37.5) |
70 (21.3) |
39 (33) |
| No |
773 (67.6) |
435 (62.5) |
258 (78.7) |
80 (67) |
| Missing |
12 (1.0) |
8 (1.1) |
3 (0.9) |
1 (<1) |
| Practice ownership, n (%) |
Owner |
NA |
161 (23.4) |
NA |
23 (20) |
| Co-owner |
NA |
286 (41.6) |
NA |
30 (26) |
| Employee |
NA |
241 (35.0) |
NA |
63 (54) |
| Missing |
NA |
16 (2.3) |
NA |
4 (3) |
| Type of practice, n (%) |
Single practice |
NA |
136 (19.8) |
NA |
15 (13) |
| Group practice (paediatricians only) |
NA |
412 (59.9) |
NA |
69 (59) |
| Joint practice (paediatricians and GPs) |
NA |
117 (17.0) |
NA |
22 (19) |
| Walk-in practice |
NA |
5 (0.7) |
NA |
4 (3) |
| Other type of practice |
NA |
18 (2.6) |
NA |
6 (5) |
| Missing |
NA |
16 (2.3) |
NA |
4 (3) |
| Degree of urbanisationc, n (%) |
Urban municipality |
NA |
412 (58.5) |
NA |
17 (14) |
| Agglomeration municipality |
NA |
146 (20.7) |
NA |
15 (13) |
| Rural municipality |
NA |
146 (20.7) |
NA |
88 (73) |
| Hospital positiond, n (%) |
Resident physician |
NA |
NA |
7 (2.2) |
1 (<1) |
| Consulting physician |
NA |
NA |
148 (46.3) |
56 (48) |
| Senior physician |
NA |
NA |
124 (38.8) |
45 (38) |
| Chief physician |
NA |
NA |
41 (12.8) |
15 (13) |
| Missing |
NA |
NA |
11 (3.3) |
3 (3) |
Statistical analyses
Our target
population of clinically active paediatricians in Switzerland was finite; its
size was known from FMH statistics for 2024 [6]. Hence, we used the finite
population correction for 95% confidence intervals and hypothesis tests. We employed
Korn-Graubard’s survey-adjusted Clopper-Pearson binomial confidence intervals
and survey-adjusted Rao-Scott chi-squared tests for categorical outcomes [25]
and survey-adjusted Kruskal-Wallis tests for continuous outcomes.
We used
linear regression models to assess how the paediatric primary care supply
density by canton depended on the number of practice paediatricians or on
part-time work. We also used linear regression to examine how much of the
cantonal variability in supply density could be attributed to the association
with contextual factors such as tariff point values, urbanisation, or gross
domestic product (GDP) per capita by canton [21, 26, 27]. In the Swiss billing
system for outpatient medical services (TARMED until 2025, TARDOC since 01.01.2026),
each service is assigned a
number of tariff points, which reflect the service’s time and resource use. The
monetary value of each tariff point – the tariff point value – varies by canton
and provider agreement. In our statistical analyses, we used the tariff point
values from 2024 [26]. We used Pearson’s correlation test to assess how the supply
density by canton affected the proportion of paediatricians perceiving a
shortage or accepting new patients, and the number of patients seen per day. For
all analyses, we used RStudio version 2023.3.1 with R version 4.2.0 [28, 29].
Open science
No public
study registration or protocol was necessary for this study. The full
questionnaire is provided in the appendix, and the statistical
analysis code is available on GitHub (https://github.com/LorenzLeuenberger/Shortages-of-Paediatric-Primary-Care-Switzerland_Paediatrician-Survey).
Results
Out of 1940
clinically active, board-certified paediatricians, 1155 (60%) responded to our
survey, 996 (51%) of whom completed all compulsory questions (supplemental figure
2 in the appendix). Respondents were aged 30 to ≥65 years and were predominantly female
(71%),
and most had completed their medical education in Switzerland (78%). A total of
61% worked in practices, 29% in hospitals, and 10% in both settings (table 1).
The primary care paediatricians who responded to our survey were broadly
representative of those in the FMH statistics with respect to age and sex (supplemental
table
2 in the appendix). Our survey included slightly fewer primary care paediatricians
aged ≥65 years (4%)
than did the FMH statistics (11%).
We
estimated that 1017 [95% CI 975–1059] FTE primary care paediatricians were working
in Switzerland in 2024. This resulted in an average of 0.63 [0.60–0.66] FTE
primary care paediatricians per 1000 children (<18 years) across Switzerland.
Marked differences were observed across cantons: in Geneva, there were 134 FTE
primary care paediatricians for 100,168 children, while in Bern, there were
only 95 FTEs for twice as many children (184,497) (supplemental table 3 in the appendix).
The cantonal
supply density ranged from 1.34 [1.19–1.48] in Geneva to 0.21 [0.14–0.24] in
Appenzell Ausserrhoden (figure 1A). These pronounced differences persisted when
using alternative definitions for the paediatric population and at the level of
major regions (supplemental figures 3 and 4A in the appendix). The sensitivity analyses
using additional
imputation methods resulted in FTE estimates very similar to those obtained
using MICE (supplemental table 3 in the appendix).
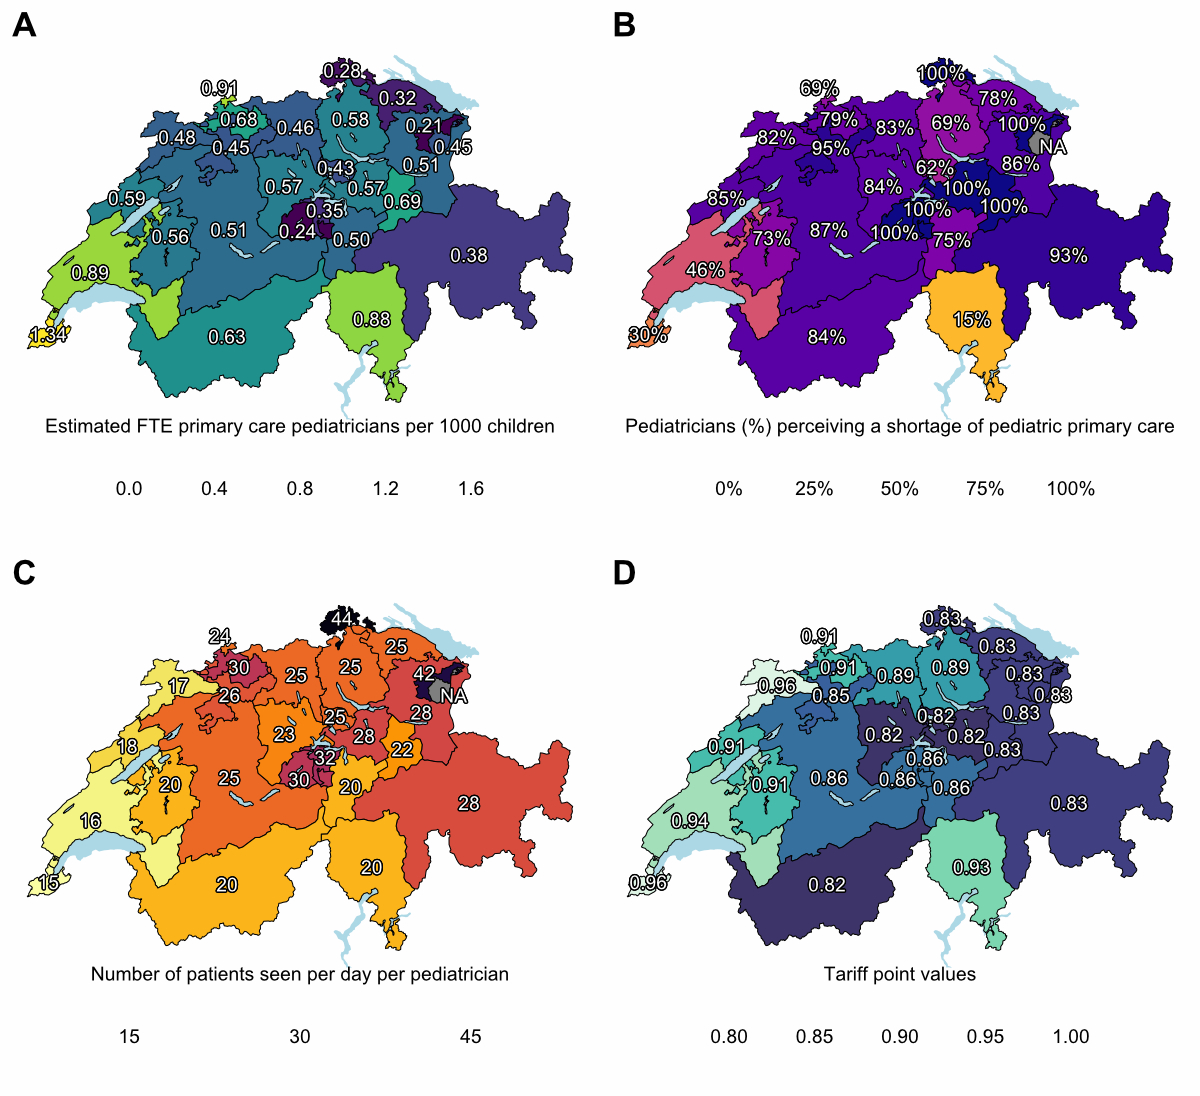
Figure 1A) Paediatric
primary care supply density, B) paediatricians’ perceptions of shortages, C) patients
per day, and D) tariff point values across Swiss cantons. Panel A: The number
of practice paediatricians per canton was obtained from the FMH statistics for 2024
[6]. The population of children (0–17 years) per canton in 2024 was obtained
from the Swiss Federal Statistical Office (FSO). We used multiple imputation by
chained equations (MICE) to estimate the working percentage of paediatricians
not reached by our survey. See supplemental methods and supplemental table 3 in the
appendix for detailed calculations. Panel B: Proportion of paediatricians (%)
who perceived a shortage of primary care paediatricians in their municipality
and neighbouring municipalities. Missing: Three paediatricians (<1%) out of
1155 did not answer the question on perceived shortage. We received no
information from the canton of Appenzell Innerrhoden, as the SSP has no
registered members in this canton. Panel C: Median number of patients seen per full
day per primary care paediatrician, by canton. Panel D: Tariff point values. In
the Swiss billing system for outpatient medical services (TARMED), each service
is assigned a fixed number of tariff points, which reflect the service’s
complexity and resource use. The monetary value of each tariff point – the tariff
point value – varies by canton and provider agreement [26].
Abbreviations: FTE:
full-time equivalent; FMH: Foederatio Medicorum Helveticorum, Swiss Medical
Association. SSP: Swiss Society of Paediatrics – pädiatrie schweiz.
Two-thirds
of paediatricians overall (68% [95% CI 66–70]) perceived a shortage of primary
care paediatricians in their region, 20% [18–21] perceived no shortage, and 12%
[11–14] were unsure. Large cantonal differences were apparent; few paediatricians
perceived a shortage in the cantons of Tessin (15% [9–24]) and Geneva (30% [23–37]),
whereas in Central or Eastern Switzerland, up to 100% of paediatricians
perceived shortages, for example, Schwyz [77–100] and Glarus [86–100] (figure 1B,
supplemental table 4 in the appendix). The regional differences also remained at
the level of major regions
(supplemental figure 4B). Slightly more practice paediatricians (70% [68–73]) perceived
a shortage compared with hospital paediatricians (65% [61–69]) or paediatricians
working in both settings (61% [54–68]). Practice paediatricians (including
those in both settings) from rural areas more often perceived a shortage (86% [82–89])
compared with those in agglomeration (68% [62–73]) or urban (63% [60–66])
areas.
Most
practice paediatricians (87% [95% CI 86–89]) worked part-time, with a median of
35 hours per week [IQR: 27, 40] (table 2). More female and younger practice paediatricians
worked part-time than did their male or older colleagues (both p <0.001, supplemental
tables
5 and 6). Fewer hospital paediatricians worked part-time than practice paediatricians
or those working in both settings (p <0.001, supplemental table 7 in the appendix).
Practice paediatricians
saw a median of 22 patients [17, 26] per full working day, ranging from 15
patients per day in the canton of Geneva to 44 patients per day in Schaffhausen
(figure 1C). Practice paediatricians planned a median of 30 minutes for each preventive
well-child visit [30, 40] and 15 minutes for each emergency consultation [15,
15] (table 2 and supplemental table 1 in the appendix). Among practice paediatricians,
31% [29–33] accepted
all new patients into their practice, 57% [56–59] accepted only selected patients,
and 12% [10–13] did not accept new patients. Among newborns, 98% were accepted
as new patients, as were 98% of siblings of registered patients and 71% of children
living within the municipality or a neighbouring municipality. Compared with those
in higher supply cantons (>0.83 FTEs/1000 children), practice paediatricians
in cantons with lower supply densities (<0.50 FTEs/1000 children) saw more
patients (median 25 [20, 30] vs 17 [14, 20], p <0.001), spent less time per
preventive well-child visit (median 30 minutes [30, 30] vs 40 minutes [30, 45],
p <0.001), and accepted fewer new patients (18% [15–22] vs 51% [46–56], p <0.001)
(table 2 and supplemental figures 5A and B in the appendix).
Table 2Working conditions in paediatric
primary care.
| |
Estimated cantonal supply density (FTEs/1000
children), n (%) |
| <0.50 |
0.50–0.83 |
>0.83 |
P Value |
| All practice paediatricians, n (%) |
824 (100) |
122 (14.8) |
458 (55.6) |
244 (29.6) |
|
| Working percentaged, n (%) [95%CIc] |
Full-time (100%) |
101 (12.6) [11.1–14.2] |
23 (19) [15–24] |
45 (10.0) [8.4–12.0] |
33 (14.0) [11.1–17.4] |
<0.001 |
| Part-time (<95%) |
703 (87.4) [85.8–88.9] |
97 (81) [76–85] |
403 (90.0) [88.0–94.6] |
203 (86.0) [82.6–88.9] |
| 80–95% |
216 (26.9) [24.9–29.0] |
22 (18) [14–23] |
113 (25.2) [22.7–27.9] |
81 (34.3) [30.2–38.7] |
|
| 60–79% |
292 (36.3) [34.1–38.6] |
36 (30) [25–36] |
164 (36.6) [33.8–39.5] |
92 (39.0) [34.7–43.5] |
|
| 40–59% |
154 (19.2) [17.4–21.0] |
33 (28) [23–33] |
98 (21.9) [19.5–24.4] |
23 (9.7) [7.4–12.8] |
|
| 20–39% |
34 (4.2) [3.4–5.3] |
6 (5) [3–8] |
21 (4.7) [3.6–6.1] |
7 (3.0) [1.8–5.0] |
|
| <20% |
7 (0.9) [0.5–1.4] |
- |
7 (1.6) [1.0–2.5] |
- |
|
| Median [IQR] |
70 [60, 80] |
60 [50, 80] |
63 [50, 80] |
75 [60, 80] |
<0.001 |
| Missing |
20 (2.4) |
2 (2) |
10 (2.2) |
8 (3.3) |
|
| Working hours per weeke |
Median [IQR] |
35 [27, 40] |
32 [26, 44] |
34 [26, 40] |
35 [30, 40] |
0.08 |
| Missing |
30 (4) |
2 (2) |
15 (3) |
13 (5) |
|
| FTE working hours per weekf |
Median [IQR] |
50 [45, 56] |
50 [45, 58] |
50 [47, 57] |
50 [43, 51] |
<0.001 |
| Missing |
30 (4) |
2 (2) |
15 (3) |
13 (5) |
|
| Number of patients per dayg |
Median [IQR] |
22 [17, 26] |
25 [20, 30] |
25 [20, 30] |
17 [14, 20] |
<0.001 |
| Missing |
124 (15) |
15 (12) |
68 (15) |
41 (17) |
|
| Time per consultationh, median [IQR], minutes |
Preventive well-child visit |
30 [30, 40] |
30 [30, 30] |
30 [30, 30] |
40 [30, 45] |
<0.001 |
| Emergency visit |
15 [15, 15] |
15 [15, 15] |
15 [15, 15] |
15 [15, 20] |
<0.001 |
| Missing |
172 (21) |
18 (15) |
98 (21) |
56 (23) |
|
| Accepting new patientsi, n (%) [95%CI] |
All new patients |
234 (31.0) [28.9–33.3] |
21 (18) [15–22] |
103 (24.4) [21.9–27.2] |
110 (50.9) [46.2–55.6] |
<0.001 |
| Selected new patients |
432 (57.3) [54.9–59.6] |
78 (67) [63–71] |
262 (62.1) [59.1–65.0] |
92 (42.6) [38.0–47.3] |
| No new patients |
88 (11.7) [10.2–13.3] |
17 (15) [12–18] |
57 (13.5) [11.5–15.8] |
14 (6.5) [4.5–9.2] |
| Missing |
70 (8.5) |
6 (5) |
36 (7.9) |
28 (11.5) |
|
| Accepting emergency patientsj, n (%) [95%CI] |
All emergency patients |
558 (74.1) [72.0–76.1] |
77 (66) [62–70] |
296 (70.3) [67.4–73.0] |
185 (86) [82.0–88.7] |
<0.001 |
| Selected emergency patients |
130 (17.3) [15.5–19.1] |
24 (21) [17–24] |
85 (20.2) [17.8–22.8] |
21 (10) [7.3–12.9] |
| No new patients |
65 (8.6) [7.4–10.1] |
15 (13) [10–6] |
40 (9.5) [7.8–11.5] |
10 (5) [3.0–7.1] |
| Missing |
71 (8.6) |
6 (5) |
37 (8.1) |
28 (11.5) |
|
We investigated
two different explanations for the shortage of primary care paediatricians in
Switzerland: A) insufficient workforce and B) insufficient productivity. Practice
paediatricians generally agreed with explanation A (79% [77–81]) that there are
insufficient FTEs in paediatric primary care and that this contributes to the shortage
(figure 2).
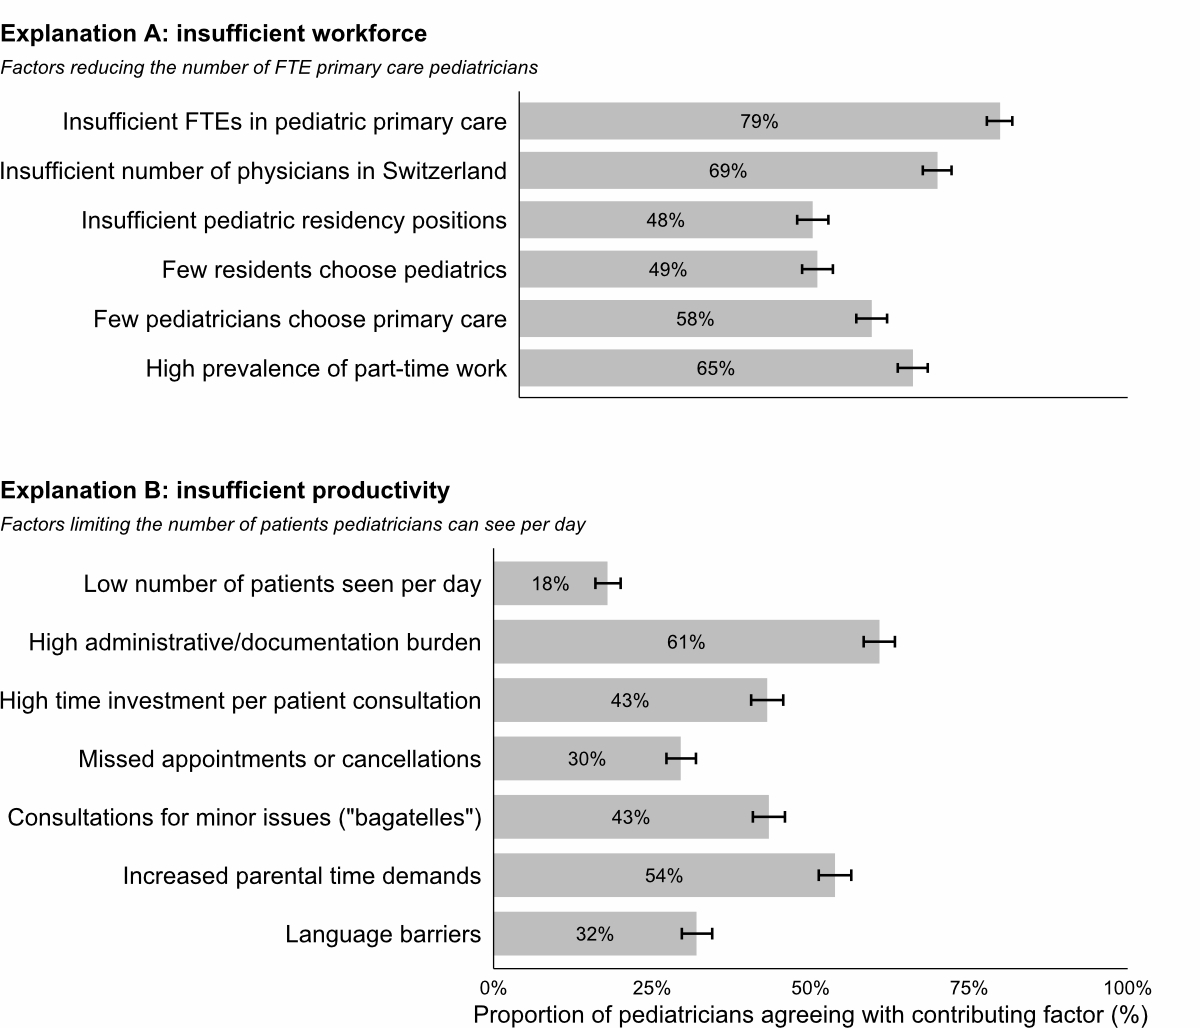
Figure 2Agreement
with factors contributing to paediatrician shortages. Agreement was measured on
a Likert scale from 1 (disagree) to 5 (agree). The bar plot shows the
proportion of practice paediatricians agreeing (≥4) with each statement, along
with the corresponding 95% confidence intervals. We computed Korn-Graubard’s
survey-adjusted Clopper-Pearson binomial confidence intervals accounting for the
finite population size. We defined the finite population based on the FMH
statistics for 2024 [6]. Missing: In total, 57 (7%) out of 824 practice paediatricians
did not answer the questions on the potential factors. Abbreviations: FTE:
full-time equivalent.
The factors
contributing to A that received the most agreement were an insufficient number
of physicians in Switzerland (69% [66–71]), a high prevalence of part-time work
(65% [62–67]), and few paediatricians choosing primary care (58% [55–60]). A
small proportion of paediatricians (18% [16–20]) agreed with explanation B that
a low number of patients seen per day contributes to a shortage. The factors
contributing to explanation B that received the most agreement were a high
administrative/documentation burden (61% [58–63]) and increased parental time
demands (54% [51–56]). Practice paediatricians in cantons with a high supply
density were less likely to perceive increased parental time demands as a
contributing factor to the shortage (40% [35–45]) than those in low-supply
cantons (61% [55–67]) (supplemental figure 6 in the appendix). Motivations for choosing
to work
in primary care were long-term relationships with patients and their families
(76% [74–78]) and flexibility in working hours and the possibility of part-time
work (61% [58–63]). Factors cited as discouraging the choice of primary care were
practice administrative work, for example, finances and personnel (68% [66–71]),
financial risk (64% [62–67]), and a high level of responsibility without
supervision (57% [54–60]). On the cantonal level, the number of practice paediatricians
per 1000 children was associated with the primary care supply density (β-estimate:
0.35
[0.32–0.38] per increment of 0.5 paediatricians/1000 children), which
contributed more to the cantonal differences in supply density (R2
0.96) than the average working percentage of paediatricians (R2
0.00) (table 3). A total of 39% of the cantonal variability of supply density
could be attributed to the univariable association with tariff point values (0.16
[0.08–0.25], per increment of 0.05 tariff points, R2 0.39); 33% to
the association with the proportion of children living in urban municipalities
(0.12 [0.05–0.19], R2 0.33); 11% to the association with GDP per
capita (0.08 [–0.01–0.17], R2 0.11). In the multivariable
regression, 60% of the cantonal variability of supply density could be
attributed to tariff point values, the proportion of children in urban
municipalities, and GDP per capita (adj. R2 0.60). The cantonal
supply density was strongly correlated with the proportion of paediatricians
perceiving a shortage (r −0.75), accepting new patients (r 0.65), and the
number of patients seen per day (r −0.65) (supplemental table 8 in the appendix).
Table 3Association of workforce components and contextual
factors with paediatric primary care supply density across Swiss cantons.
| |
Univariable regression |
Multivariable regression |
| β-estimate [95% CI] FTEs/1000 children |
std. error |
p value |
R2 |
β-estimate [95% CI] FTEs/1000 children |
std. error |
p value |
adj. R2 |
| Model 1: Workforce components |
| Average working percentagec (per increment of 10 percentage
points) |
0.02 [−0.11–0.15] |
0.07 |
0.759 |
0.00 |
0.05 [0.04–0.07] |
0.01 |
<0.001 |
0.99 |
| Number of practice paediatricians per 1000 childrend (per
increment of 0.5 practice paediatricians) |
0.35 [0.32–0.38] |
0.02 |
<0.001 |
0.96 |
0.36 [0.34–0.38] |
0.01 |
<0.001 |
| Model 2: Contextual factors |
| Tariff point valuese (per increment of 0.05 tariff point) |
0.16 [0.08–0.25] |
0.04 |
<0.001 |
0.39 |
0.15 [0.08–0.22] |
0.03 |
<0.001 |
0.60 |
| Children living in urban municipalitiesf (per increment of
20% population) |
0.12 [0.05–0.19] |
0.04 |
0.002 |
0.33 |
0.13 [0.05–0.21] |
0.04 |
0.002 |
| GDP per capitag (per increment of 35,000 CHF per capita) |
0.08 [−0.01–0.17] |
0.05 |
0.090 |
0.11 |
−0.05 [−0.14–0.04] |
0.04 |
0.254 |
Discussion
This study estimated
that 1017 full-time equivalent primary care paediatricians were working in
Switzerland in 2024, yielding an overall supply density of 0.63 FTE primary
care paediatricians per 1000 children (<18 years). Two-thirds of paediatricians
(68%) perceived a shortage of paediatric primary care in Switzerland. Italian-
and French-speaking cantons and Basel-Stadt had a higher supply density than cantons
in Central or Eastern Switzerland. Most practice paediatricians (87%) worked part-time,
worked a median of 35 hours per week, and saw a median of 22 patients per day. Only
31% of practice paediatricians accepted all new patients; 57% accepted only selected
patients, such as newborns and siblings of registered patients, and 12% did not
accept new patients.
Our
estimated nationwide supply density of 0.63 FTEs/1000 children (<18 years) is
below US recommendations for paediatric primary care (0.71–0.83 FTEs/1000) and
below Swiss recommendations for adult primary care (1.0 FTEs/1000) [30, 31]. In
international comparisons, our estimated supply density in Switzerland is lower
than that of the US (0.70) and higher than that of Germany (0.47) [32, 33]. Two
previous Swiss studies estimated 1054 FTE primary care paediatricians in 2018
and 938 FTEs in 2019, with a supply density of 0.70 FTEs/1000 children (<15
years) in 2019 [8, 11]. Both studies were limited to publicly available data and
did not include information on underlying working conditions or contributing
factors. The regional differences reported in our study aligned well with those
reported in 2019 [8]. In a recent Swiss survey, many paediatricians perceived a
shortage in paediatric primary care, with differences by major region (19% in
Tessin, 41% in the Lake Geneva region, 74–97% in German-speaking regions) [9,
34]; similar to the regional shortages perceived in our study (15% in Tessin,
46% in the Lake Geneva region, 69–88% in German-speaking regions).
Paediatrics
has been perceived as less attractive than other specialities due to poorer
working conditions, lower financial reimbursement, reduced prestige, and less exposure
during medical training [12, 13]. In Switzerland, paediatrics accounts for only
6% of specialist titles awarded annually, averaging 108 new paediatricians per
year over the past decade [6]. In the US, only 8% of MD graduates choose a
residency in paediatrics [35]. Paediatricians in our study perceived factors
that may contribute to the paediatric shortage through workforce capacity and
productivity: a relatively low number of physicians, a high administrative
burden, part-time work, and a relatively low interest in primary care were
perceived to play central roles. Part-time work is increasingly common among both
female and male general practitioners and paediatricians [6, 34]. Within paediatric
practices, and in line with a study from five European countries, rising
parental expectations may contribute to over-investigation and overtreatment [15].
Limited financial compensation, high administrative burdens, and rising
parental demands may amplify part-time work and affect interest in primary care,
illustrating the interplay between these factors.
Regional
differences in supply density have been attributed to the rural and
socioeconomic characteristics of regions in the US and Germany [17, 18, 32, 33].
Our study confirms the association with rural characteristics in less well-supplied
regions; predominantly rural cantons (e.g.
Appenzell Innerrhoden, Nidwalden, and Obwalden) have a lower supply density
than urban cantons consisting of a single city (Basel-Stadt and Geneva). Our
study shows that cantons with better financial reimbursement for medical
services (higher tariff point values) have a higher supply density, and that regional
variability in supply density may be partially attributed to this association
with tariff point values. The association with per capita GDP appeared to be
minor, likely due to high incomes across Switzerland and mandatory health
insurance. We also found that primary care paediatricians in less well-supplied
regions responded by seeing more patients per day – up to a median of 44
patients per day in Schaffhausen, compared to the Swiss median of 22 and the older
average (reported in 1999) of 24 patients per day in the US – by planning less
time per preventive well-child visit – median 30 minutes compared to 40 minutes
in well-supplied regions – and by refusing to accept new patients [36, 37].
Strengths and limitations
The
strengths of this study include its high response rate (60%), national reach,
and the use of multiple imputation to estimate the paediatrician workforce [38].
Our results are limited by surveying members of the SSP, the geographical units,
and the FMH statistics that we used to estimate supply densities, as well as by
the self-reported nature of the perceived shortage and contributing factors.
Membership of the SSP is not mandatory for Swiss paediatricians, and the
clinically active SSP members may not be perfectly representative of all paediatricians
in Switzerland. Nevertheless, for our estimations of the primary care
workforce, we reached 824 (75%) of 1106 primary care paediatricians with SSP
membership – 56% of the 1482 primary care paediatricians in the FMH statistics
– and respondents were broadly representative of the FMH statistics regarding
age and sex. We used cantons as geographic units to estimate supply and demand,
resulting in supply densities delimited by cantonal borders, although patients
and physicians can cross those borders. In urban border cantons like Geneva and
Basel-Stadt, the inflow of physicians from neighbouring countries may inflate
supply density, just as the inflow of patients from other cantons may
contribute to a high perceived shortage. Nevertheless, regional differences
persisted at the level of major regions. We chose to focus on cantons because
Swiss health care is organised at this level, which allows our findings to
directly inform policy. Associations between supply density and contextual
factors at the cantonal level are ecological and should be interpreted with
caution at an individual level. Although FMH statistics may have some incomplete
data (e.g. our survey identified more paediatricians in Obwalden), they remain
the most reliable source for paediatrician numbers in Switzerland. Finally,
while the self-reported perceived shortage and contributing factors can depend
on paediatricians’ personal experiences and values, the perceived shortage correlated
well with the objective measures of supply density, in line with previous
studies [39].
Implications
In regions
with a shortage of paediatric primary care, families may face difficulties
finding a provider, longer travel distances, or longer waiting times, which
might shift care to general practitioners or hospital services. US trends show
a decrease in primary care visit rates among children but an increase in urgent
care and emergency department visits [40]. This diversion may disrupt
continuity of care and may increase costs [3]. In 2011, the Swiss government
proposed expanding medical school capacities and improving financial
compensation for primary care physicians [41]. Similar measures have been implemented
in Germany and Austria [42, 43]. However, it is uncertain whether these
financial measures are enough to make primary care more attractive [44].
Training in primary care during both medical school and residency might
increase its attractiveness [45, 46]. In Switzerland, paediatric residents are
not required to train in paediatric primary care, but they may spend up to two
of their five residency years in a paediatric practice [47]. Reducing
administrative burdens and improving parental health literacy could enhance
productivity and retention [48]. Solutions should not rely on recruiting paediatricians
from neighbouring countries, where similar shortages may exist [32]. Further
research on the effectiveness of interventions is needed to inform decision-makers
in developing targeted health policies addressing primary care shortages [49].
The contributing factors presented in our study can serve as targets to inform
policy measures, which may include increasing the duration of paediatric
training and primary care education during medical school; making primary care
training mandatory during paediatric residency; equalising financial
reimbursement across cantons (tariff point values); introducing financial
incentives for practices in cantons with low supply and, especially, in rural
areas; considering halting practice openings in areas with high supply density;
and creating parental education tools to improve health literacy.
Conclusion
Our study
shows that the supply density of paediatric primary care is below recommended
levels in many regions of Switzerland, and more than two-thirds of paediatricians
perceive such a shortage. Financially disadvantaged and rural cantons had the
lowest supply density and the highest perceived shortage. Policy solutions to
the paediatric primary care shortage will need to address regional differences in
workforce capacity, financial incentives, and rural characteristics that affect
both paediatricians and patients.
Data sharing statement
Data from this
survey cannot be shared due to data protection regulations of pädiatrie schweiz
– the Swiss Society of Paediatrics.
Acknowledgments
We thank
Christina Schindera, MD PhD, Sarah Glick, MD MPH, and Beatriz Guerra, MD, from
the Institute of Social and Preventive Medicine, University of Bern, for their
support during questionnaire development. We thank pädiatrie schweiz – the Swiss
Society of Paediatrics, especially the secretariat and Claudia Baeriswyl, for their
collaboration, which enabled us to reach their members with this survey. We
thank Dr Christopher Ritter for manuscript editing.
Prof. Dr. med. Claudia E. Kuehni
Institute of Social and Preventive Medicine
University of Bern
Mittelstrasse
43
CH-3012 Bern
claudia.kuehni[at]unibe.ch
References
1. Hone T, Macinko J, Millett C. Revisiting Alma-Ata: what is the role of primary health
care in achieving the Sustainable Development Goals? Lancet. 2018 Oct;392(10156):1461–72.
10.1016/S0140-6736(18)31829-4
2. World Health Organization. Report of the International Conference on Primary Health
Care, Alma-Ata, USSR, 6-12 September 1978. https://www.who.int/publications/i/item/9241800011
3. Harris E. Review Finds Benefits of Primary Care Continuity. JAMA. 2023 Jun;329(24):2119.
10.1001/jama.2023.9930
4. Bazemore A, Merenstein Z, Handler L, Saultz JW. The Impact of Interpersonal Continuity
of Primary Care on Health Care Costs and Use: A Critical Review. Ann Fam Med. 2023;21(3):274–9.
10.1370/afm.2961
5. Kroezen M, Rajan D, Richardson E. Strengthening primary care in Europe: How to increase
the attractiveness of primary care for medical students and primary care physicians?
Policy Brief 55: https://eurohealthobservatory.who.int/publications/i/strengthening-primary-care-in-europe-how-to-increase-the-attractiveness-of-primary-care-for-medical-students-and-primary-care-physicians
6. Hostettler S, Kraft E. FMH-Ärztestatistik 2024 – tiefe Grundversorgerdichte. Schweiz
Arzteztg. 2025(3):9–15.
7. Jenni OG, Sennhauser FH. Child Health Care in Switzerland. J Pediatr. 2016 Oct;177S:S203–12.
10.1016/j.jpeds.2016.04.056
8. von Rhein M, Hauser J, Haldimann L, Jörg R, Gruebner O. Imbalanced access to pediatric
primary care in Switzerland: geographic differences and modeled future challenges.
Eur J Pediatr. 2025 Sep;184(10):648. 10.1007/s00431-025-06441-w
9. Zeller A, Fischer R, Hernandez LD. [Between workload, job satisfaction and stress
in swiss primary care - results from the 5th Workforce Study 2025]. Praxis (Bern).
2026 Mar;115(3):67–72. 10.23785/PRAXIS.2026.03.002
10. Harper BD, Nganga W, Armstrong R, Forsyth KD, Ham HP, Keenan WJ, et al. Where are
the paediatricians? An international survey to understand the global paediatric workforce.
BMJ Paediatr Open. 2019 Jan;3(1):bmjpo-2018-000397. 10.1136/bmjpo-2018-000397
11. Burla L, Widmer M, Zeltner C. Zukünftiger Bestand und Bedarf an Fachärztinnen und
-ärzten in der Schweiz. Teil 1: Total der Fachgebiete, Hausarztmedizin, Pädiatrie,
Psychiatrie und Psychotherapie sowie Orthopädie. Schlussbericht des Obsan und des
Gremiums «Koordination der ärztlichen Weiterbildung» im Auftrag des Dialogs Nationale
Gesundheitspolitik (Obsan Bericht 04/2022). https://www.obsan.admin.ch/sites/default/files/2022-05/Obsan_04_2022_BERICHT.pdf
12. Russo G, Perelman J, Zapata T, Šantrić-Milićević M. The layered crisis of the primary
care medical workforce in the European region: what evidence do we need to identify
causes and solutions? Hum Resour Health. 2023 Jul;21(1):55. 10.1186/s12960-023-00842-4
13. Hu KJ, Sun ZZ, Rui YJ, Mi JY, Ren MX. Shortage of paediatricians in China. Lancet.
2014 Mar;383(9921):954. 10.1016/S0140-6736(14)60482-7
14. Catenaccio E, Rochlin JM, Simon HK. Association of Lifetime Earning Potential and
Workforce Distribution Among Pediatric Subspecialists. JAMA Pediatr. 2021 Oct;175(10):1053–9.
10.1001/jamapediatrics.2021.1912
15. Jankauskaite L, Grechukha Y, Kjær KA, Mamenko M, Nakstad B, Romankevych I, et al. Overuse
of medical care in paediatrics: A survey from five countries in the European Academy
of Pediatrics. Front Pediatr. 2022 Sep;10:945540. 10.3389/fped.2022.945540
16. WHO. Imbalances in rural primary care. A scoping literature review with an emphasis
on the WHO European Region. 18.04.2018. https://www.who.int/publications/i/item/WHO-HIS-SDS-2018-58
17. Shipman SA, Lan J, Chang CH, Goodman DC. Geographic maldistribution of primary care
for children. Pediatrics. 2011 Jan;127(1):19–27. 10.1542/peds.2010-0150
18. Randolph GD, Pathman DE. Trends in the rural-urban distribution of general pediatricians.
Pediatrics. 2001 Feb;107(2):E18. 10.1542/peds.107.2.e18
19. Turner A, Ricketts T, Leslie LK. Comparison of Number and Geographic Distribution
of Pediatric Subspecialists and Patient Proximity to Specialized Care in the US Between
2003 and 2019. JAMA Pediatr. 2020 Sep;174(9):852–60. 10.1001/jamapediatrics.2020.1124
20. Blunier H, Käser-Michel A. Hausärztemangel hausgemacht. Paediatrica; 2019.
21. Bundesamt für Statistik (BFS). Ständige Wohnbevölkerung 2024. https://www.bfs.admin.ch/bfs/de/home/statistiken/bevoelkerung.html (accessed 11.11.2025).
22. Konferenz der kantonalen Gesundheitsdirektorinnen und -direktoren. Reevaluation Hochspezialisierte
Pädiatrie und Kinderchirurgie. Erläuternder Bericht für die Zuordnung des Bereichs
zur hochspezialisierten Medizin. 26.08.2021. https://www.gdk-cds.ch/fileadmin/docs/public/gdk/themen/hsm/HSM-Bereiche/BT_Pedi_Re1_Zuord_SchlussBT_Pub_20210907_def_d.pdf
23. United Nations. Convention on the Rights of the Child. https://www.ohchr.org/en/instruments-mechanisms/instruments/convention-rights-child
24. pädiatrie schweiz (Swiss Society of Pediatrics). Eltern: pädiatrie schweiz; 2025.
https://www.paediatrieschweiz.ch/eltern/ (accessed 16.10.2025).
25. Korn EL, Graubard BI. Confidence Intervals for Proportions with Small Expected Number
of Positive Counts Estimated from Survey Data. Surv Methodol. 1998;24(2):193–201.
26. Taxpunkt-Service. NewIndex AG; 2024. https://www.newindex.ch/servicebereich/ (accessed 11.11.2025).
27. Bundesamt für Statistik (BFS). Bruttoinlandprodukt pro Kanton und Grossregion 2022.
https://www.bfs.admin.ch/bfs/de/home/statistiken/volkswirtschaft/volkswirtschaftliche-gesamtrechnung/bruttoinlandprodukt-kanton.html (accessed 11.11.2025).
28. Studio R. Integrated Development Environment for R [program]. 2023.3.1 version. Boston,
MA: Posit Software, PBC, 2023.
29. R: A language and environment for statistical computing [program]. 4.2.0 version.
Vienna, Austria: R Foundation for Statistical Computing, 2022.
30. The future of pediatric education II. Organizing pediatric education to meet the needs
of infants, children, adolescents, and young adults in the 21st century. A collaborative
project of the pediatric community. Task Force on the Future of Pediatric Education.
Pediatrics. 2000 Jan;105(1 Pt 2 Supplement_1):157–212. 10.1542/peds.105.S1.163
31. Hostettler S, Kraft E. FMH-Ärztestatistik 2022: Geringe Hausarztdichte und grosse
Auslandabhängigkeit. Schweiz Arzteztg. 2023;104(12):24–9.
32. Neumeier S. Pediatric Care Proximity in Germany: A Comparative Study of Regional Accessibility.
KN J Cartogr Geogr Inf. 2024;74(3-4):185–204. 10.1007/s42489-024-00175-9
33. Ramesh T, Yu H. US Pediatric Primary Care Physician Workforce in Rural Areas, 2010
to 2020. JAMA Netw Open. 2023 Sep;6(9):e2333467. 10.1001/jamanetworkopen.2023.33467
34. Zeller A. 5. Workforcestudie. Der Hausarztmangel verschärft sich weiter! Standpunkte
Online-Magazin von mfe Haus- und Kinderärzte Schweiz 2025; Ausgabe 1/2025:5-8.
35. Vinci RJ. The Pediatric Workforce: Recent Data Trends, Questions, and Challenges for
the Future. Pediatrics. 2021 Jun;147(6):e2020013292. 10.1542/peds.2020-013292
36. Forrest CB, Glade GB, Baker AE, Bocian AB, Kang M, Starfield B. The pediatric primary-specialty
care interface: how pediatricians refer children and adolescents to specialty care.
Arch Pediatr Adolesc Med. 1999 Jul;153(7):705–14. 10.1001/archpedi.153.7.705
37. Pletcher BA, Rimsza ME, Cull WL, Shipman SA, Shugerman RP, O’Connor KG. Primary care
pediatricians’ satisfaction with subspecialty care, perceived supply, and barriers
to care. J Pediatr. 2010 Jun;156(6):1011–1015.e1. 10.1016/j.jpeds.2009.12.032
38. Freed GL. Bias in Physician Workforce Research. Pediatrics. 2019 Sep;144(3):e20190469.
10.1542/peds.2019-0469
39. Stierli R, Rozsnyai Z, Felber R, Jörg R, Kraft E, Exadaktylos AK, et al. Primary Care
Physician Workforce 2020 to 2025 - a cross-sectional study for the Canton of Bern.
Swiss Med Wkly. 2021 Sep;151(3536):w30024. 10.4414/SMW.2021.w30024
40. Ray KN, Shi Z, Ganguli I, Rao A, Orav EJ, Mehrotra A. Trends in Pediatric Primary
Care Visits Among Commercially Insured US Children, 2008-2016. JAMA Pediatr. 2020 Apr;174(4):350–7.
10.1001/jamapediatrics.2019.5509
41. Bericht des Bundesrates. Strategie gegen Ärztemangel und zur Förderung der Hausarztmedizin.
23.11.2023. https://www.bag.admin.ch/dam/de/sd-web/94Rp4kmrdr4w/bericht-br-strat-aerztemangel-foerderung-ha-med.pdf
42. Deutscher Bundestag. Zum Mangel an der fachärztlichen Versorgung in der Kinder- und
Jugendmedizin. https://www.bundestag.de/resource/blob/927138/cd9d4ee27b973afb9ea3b56426fb4288/WD-9-079-22-pdf-data.pdf
43. Mitteilungen der ÖGKJ. Mitteilungen der ÖGKJ. Monatsschr Kinderheilkd. 2020;168(5):474–80.
10.1007/s00112-020-00913-z
44. Kerbl R, Trinkl A, Schweintzger G, Leinich B, Koinig J. „Operation Bergdoktor“: pädiatrische
Primärversorgung außerhalb von Ballungszentren. Monatsschr Kinderheilkd. 2021;169(6):527–33.
10.1007/s00112-021-01142-8
45. Stanley M, O’Brien B, Julian K, Jain S, Cornett P, Hollander H, et al. Is Training
in a Primary Care Internal Medicine Residency Associated with a Career in Primary
Care Medicine? J Gen Intern Med. 2015 Sep;30(9):1333–8. 10.1007/s11606-015-3356-9
46. Erikson CE, Danish S, Jones KC, Sandberg SF, Carle AC. The role of medical school
culture in primary care career choice. Acad Med. 2013 Dec;88(12):1919–26. 10.1097/ACM.0000000000000038
47. Schweizerisches Institut für ärztliche Weiter- und Fortbildung (SIWF) und Berufsverband
der schweizer Ärztinnen und Ärzte (FMH). Fachärztin oder Facharzt für Kinder- und
Jugendmedizin. Weiterbildungsprogramm vom 1. Januar 2022. https://www.siwf.ch/files/pdf2/kinder_und_jugendmedizin_version_internet_d.pdf
48. Verma P, Ford JA, Stuart A, Howe A, Everington S, Steel N. A systematic review of
strategies to recruit and retain primary care doctors. BMC Health Serv Res. 2016 Apr;16(1):126.
10.1186/s12913-016-1370-1
49. Vinci RJ, Degnon L, Devaskar SU. Pediatrics 2025: The AMSPDC Workforce Initiative.
J Pediatr. 2021 Oct;237:5–8.e1. 10.1016/j.jpeds.2021.02.004
Appendix
The appendix is available for download at https://doi.org/10.57187/5362.