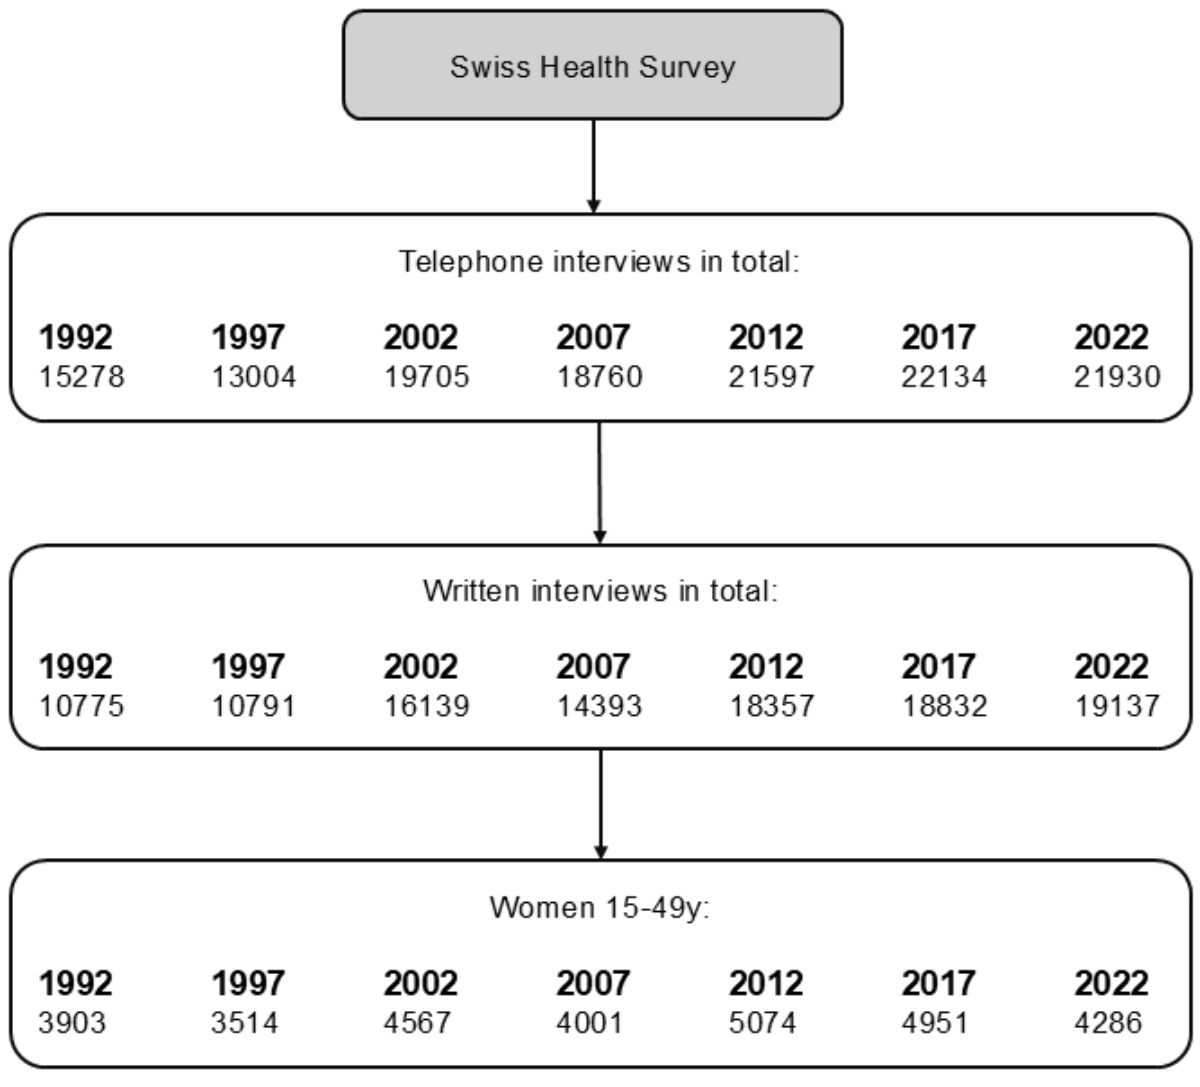
Figure 1 Flowchart of Swiss Health Survey recruitment from 1992 to 2022. Participant numbers in telephone interviews, written interviews and number of female participants aged 15 to 49 years selected for analysis.
DOI: https://doi.org/https://doi.org/10.57187/5069
Obesity, sedentary lifestyles, diabetes, hyperlipidaemia and tobacco smoking are increasing worldwide, challenging the medical system with growing numbers of cardiovascular diseases [1–3]. These developments are also evident in women of childbearing age and are therefore likely to affect the outcomes of their pregnancies and the health status of their offspring [4].
During pregnancy, physiological and metabolic changes impose considerable stress on the maternal body [5]. For women with pre-existing medical conditions or risky behaviours, the additional physiological challenges that occur during pregnancy may elevate the risk of system decompensation or trigger the onset of pregnancy-related metabolic and cardiovascular disorders [6, 7]. Because the rising trend of advanced maternal age is associated with an increased risk of complications, there is a growing focus on the importance of both physical and psychological health in pregnant women [8, 9]. Health status, physical fitness and lifestyle choices not only influence maternal health during pregnancy but also play a crucial role in the development of future generations [4, 10]. Children’s health – including child obesity and the development of cardiometabolic diseases – is strongly influenced by pregnancy conditions [11, 12]. In line with growing physical and mental demands, most women adjust their lifestyle during pregnancy to improve both their own health and that of their unborn child [13]. However, research has shown that a concerning number still engage in risky behaviours, such as smoking and alcohol consumption [14, 15]. In Switzerland, for instance, approximately 14% of mothers consumed alcohol during pregnancy, and more than one in ten pregnant women smoked [13].
Various Swiss organisations have been actively involved in supporting women in navigating the challenges associated with pregnancy. Recommendations, such as those published by the Swiss Society of Gynaecology and Obstetrics in 2025 for preconception counselling, highlight the importance of healthy nutrition, normalisation of weight, replacement of possibly teratogenic medication and abstinence from, or at least reduction of, alcohol, tobacco and illicit drugs [16]. The Swiss Infant Feeding Study, however, has revealed that up to one-third of all pregnant women had not been informed about smoking, alcohol consumption and nutrition during prenatal care [17]. This highlights the importance of further attention to preventive and counselling work within women’s health, not only during pregnancy, but preferably before pregnancy.
Assuming that up to 50% of pregnancies are unplanned, information concerning health and behaviour should not only be provided to pregnant women but to all women of reproductive age before conception [16]. Since lifestyle modifications require time and are more effective when implemented prior to conception, early intervention is essential [18].
Given that most risk factors can be influenced by lifestyle changes, understanding their progression over time is essential for identifying areas where further preventive measures are necessary. Every five years, the Federal Statistical Office (FSO) conducts a nationwide health survey that provides a comprehensive assessment of the public health landscape in Switzerland. The aim of the present study was to characterise data from all Swiss Health Surveys (1992–2022) to explore possible trends in the physical and psychological health status, use of healthcare services, nutrition habits, level of physical activity, medication use including contraception, and alcohol, tobacco and drug consumption among women of reproductive age. By analysing these health dimensions, we sought to identify potential factors that might impact their health during a possible pregnancy, and to understand the broader implications for future generations.
This analysis contains deidentified data from the FSO. Swiss Health Survey data are collected based on voluntary participation and in compliance with data protection laws. Original data are shared with third parties only in anonymised form. A contract with the FSO was signed for the proper handling of the data including regulations on data sharing, methodical standards for statistical analysis and data protection based on Swiss laws and regulations. The data used for this analysis are not publicly available and cannot be shared with third parties. The study followed the revised 2013 Helsinki Declaration and did not require ethics committee approval.
Since 1992, the FSO has conducted nationwide health surveys every five years, generating valuable insights into the relationships between health-related behaviours, health status and healthcare utilisation within the Swiss population. This study analysed data spanning the past three decades, encompassing all seven health surveys conducted to date, specifically in 1992, 1997, 2002, 2007, 2012, 2017 and the most recent survey in 2022 (Bundesamt für Statistik, Schweizerische Gesundheitsbefragung 1992, 1997, 2002, 2007, 2012, 2017, 2022). The basic population consisted of the permanent resident population of Switzerland aged 15 years or over, regardless of nationality. Individuals living in collective households and individuals in the process of seeking asylum as well as individuals currently residing in institutions (e.g. hospitals, nursing homes, prisons, monasteries, military barracks) were not included in the survey. The sampling plan used a simple stratified random sample of individuals and households, with strata based on cantons. The net sample for each survey year consisted of 10,000 telephone interviews, which could be increased by cantons to ensure representative cantonal evaluations (figure 1). For individuals who had difficulty responding to a telephone interview due to hearing or speaking problems, a face-to-face interview was offered. For individuals unable to participate in the initial interview due to age, health or language barriers, a proxy telephone interview with a close contact was allowed. At the end of the telephone interview, participants were asked – except in the case of proxy interviews – to participate in a written follow-up interview. More detailed information on the concept, method and conduct of the survey can be found online [19]. For this study, only individuals who participated in both the telephone and the written survey were included (figure 1). Further, as this study only analysed data from women of reproductive age, an additional filter was applied to the sample. The FSO’s definition of reproductive age was adopted, i.e. females aged 15 to 49 years. Data on participation rate with information on exclusion for all Swiss Health Surveys from 1992 to 2022 are depicted in supplementary methods, table 1 (in the supplementary file available for download at https://doi.org/10.57187/5069). The final selected sample included 3903 participants in 1992, 3514 in 1997, 4567 in 2002, 4001 in 2007, 5074 in 2012, 4951 in 2017 and 4286 in 2022. Certain questions were posed only to a pre-selected subgroup and primarily regarded follow-up questions, resulting in varying sample sizes across different variables. Values defined as missing therefore include “missing due to a filter question” and “no response”.
Figure 1 Flowchart of Swiss Health Survey recruitment from 1992 to 2022. Participant numbers in telephone interviews, written interviews and number of female participants aged 15 to 49 years selected for analysis.
Data from each survey were provided from the FSO in three different files: telephone interview, written survey and calculated indices for more complex variables. Since variables from all three files were selected for analysis, the three files were merged into one dataset for each survey year. The selected variables include data on sociodemographic characteristics, health status and awareness, medical conditions, use of healthcare services, body mass index (BMI), nutritional habits and physical activity, medication use, use of contraceptive methods, alcohol consumption, smoking habits and use of illicit drugs. Results of all variables are documented in the supplementary information (suppl. tables 1–10 in the supplementary file available for download at https://doi.org/10.57187/5069). To allow the visualisation of trends within different variables throughout the last 30 years, only variables having a consistent structure over the years were selected for analysis. Questions with substantial modifications or varying filter functions over time, which would result in differing reference population sizes, were excluded from the analysis. A few variables with small adjustments over the years were recoded into new variables (detailed information in suppl. textbox 1 in the supplementary file).
Statistical analysis was conducted using IBM SPSS Statistics 29.0 (Armonk, NY, USA). A study protocol was not created, nor was there a registration in a public registry. The analysis followed FSO guidelines, which ensured quality assurance in the methodological processing of the data. In line with methods employed in previous studies analysing Swiss Health Surveys [20], a design-based approach was adopted, as the data were collected through a survey employing a complex sampling design. The SPSS Complex Samples module was used for the analysis [21], with the canton designated as the stratification variable for the calculation of 95% confidence intervals. Weights corresponding to either the telephone or written questionnaire were applied, depending on the source of the variable [22]. The respondent counts presented in the tables (suppl. tables) reflect the unweighted absolute survey responses. Counts were computed for categorical variables and means were calculated for continuous variables, both including 95% confidence intervals. This was a descriptive study, with no significance testing in comparing between certain survey years or variables. Due to the large volume of results, only those variables that reflect key questions and address overarching themes have been represented graphically (remaining results on subquestions are listed in supplementary tables). Results based on samples containing fewer than 10 people were, in accordance with the FSO contract, excluded due to insufficient representativeness.
The sociodemographic characteristics of survey participants have remained relatively stable over the last 30 years, with only minimal changes observed in age, language region and nationality (suppl. table 1 in the supplementary file available for download at https://doi.org/10.57187/5069). The mean age of participants varied from 32.9 to 33.8 years. Across all seven surveys, around 70% were from the German-speaking region of Switzerland. The percentage of Swiss participants has decreased from 85.2% to 72.5%. The question regarding current pregnancy was introduced in 2007, with 3.1% of participants responding affirmatively. By 2022, this percentage had decreased to 2.4%. In terms of education, there has been a notable increase in the proportion of participants with a university degree, rising from 5.4% to 35.9% in 2022. Employment status has also evolved, with the percentage of employed participants growing from 63.3% to 82.6%. Among the employed, full-time working decreased from 54.0% to 45.0% by 2022, while working at a 70–89% full-time equivalent has doubled (9.6% to 18.1%).
The majority of participants rated their health status as “good” or “very good”, with the proportion selecting “very good” increasing from 31.4% to 46.2% (figure 2a). The question asking participants how health influenced their lifestyle has been answered consistently over the years. Ranging from “I live without thinking about health” to “thoughts about health affect lifestyle” and “thoughts about health determine lifestyle”, most participants (67.8% to 72.8%) chose the option “thoughts about health affect lifestyle” (suppl. table 2). The proportion of participants who reported having severe physical complaints increased from 25.6% to 34.3%. Moreover, the prevalence of long-lasting medical issues increased from 11.7% to 28.3%. Many of these medical issues were attributed to a physical origin, although the category “both physical and psychological” showed an increase from 13.2% to 20.5% (figure 2d). The proportion of participants reporting a diagnosis of high blood pressure (9.2% to 11.6%), high cholesterol (4.6% to 7.5%) or diabetes (1.1% to 3.3%) has seen a modest increase (figure 2e). Regarding the use of healthcare services, the mean number of reported consultations within the last 12 months with any physician (4.2 to 5.2) or with specialists (1.1 to 1.7) have risen only moderately (figure 2f). The mean number of days spent in hospital declined from 1.2 to 0.7 (suppl. table 2). The use of complementary medicine has seen a substantial increase, rising from 12.5% to 40.6% since 1992 (figure 2g). Regarding mental health, the number of consultations with a psychologist has risen from a mean of 0.5 to 2.2 consultations. In addition, the percentage of participants receiving treatment for mental health issues has more than doubled (figure 2h). The self-reported sense of control – measured by various questions about having influence over one’s everyday life and its events – has remained moderate across all surveys. Over time, however, the percentage of participants reporting a “low” sense of control has increased from 24.3% to 34.2% (figure 2i). Concerning loneliness, indicated on a scale from “never” to “very frequently”, most participants reported feeling lonely either occasionally, rising from 40.4% to 44.7%, or never, declining from 55.7% to 47.2% (suppl. table 3).
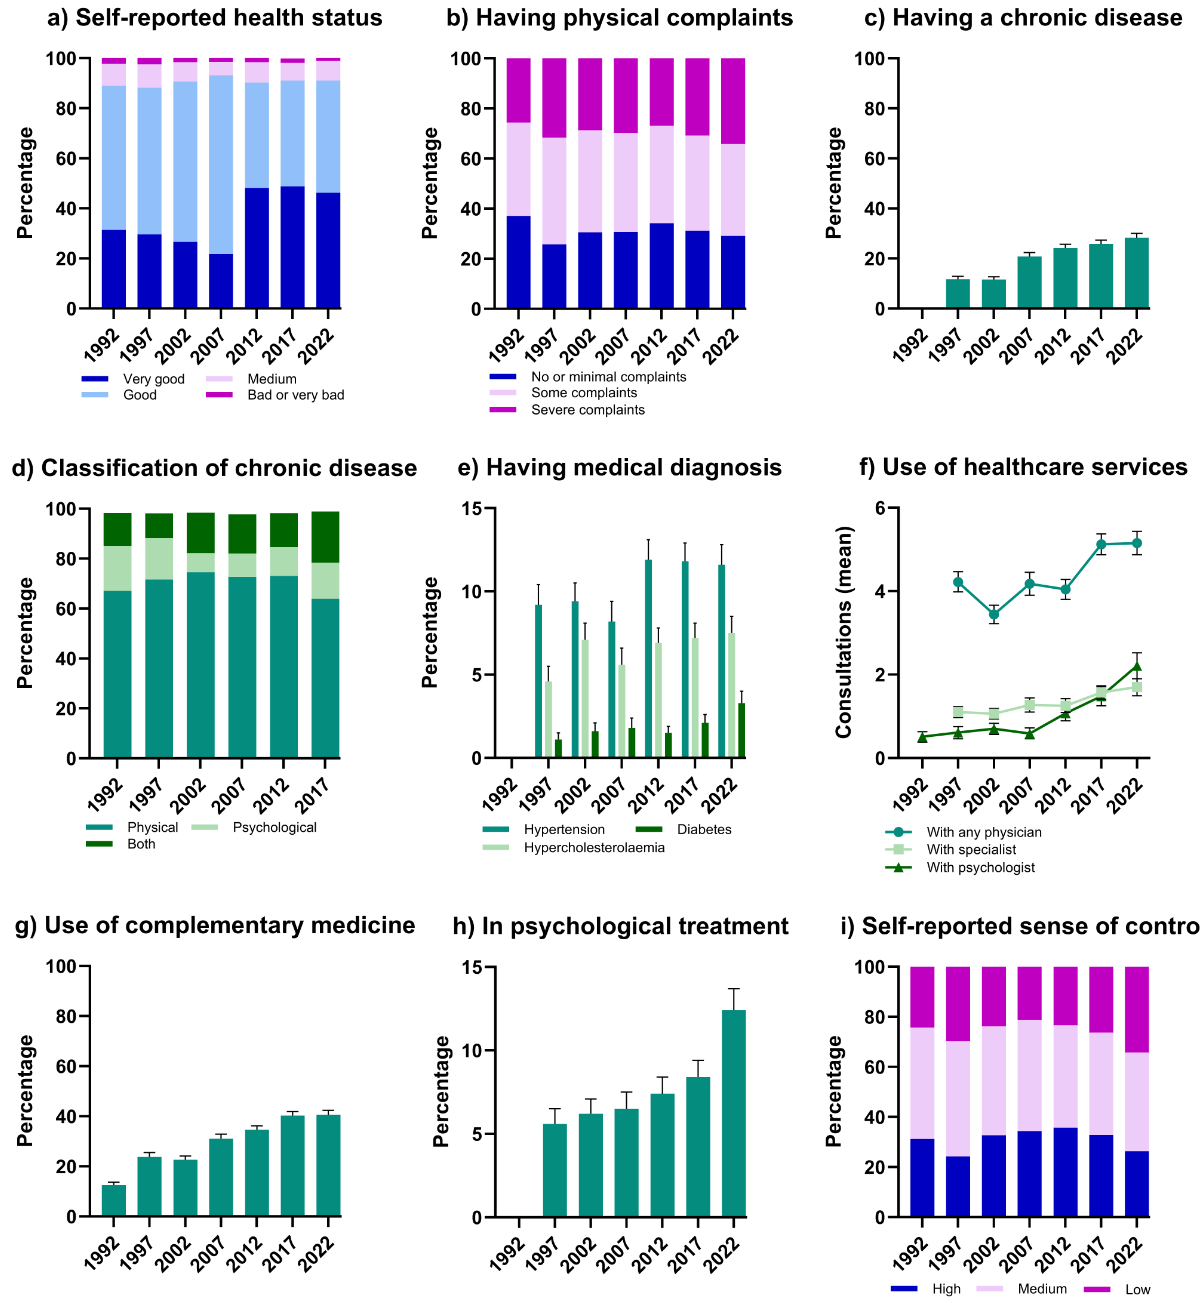
Figure 2 Physical and psychological health status of women of childbearing age of all Swiss Health Surveys from 1992 to 2022. Charts show percentages and means for every survey separately including self-reported health status (a), having physical complaints (b), having a chronic disease (c) and classification of this disease into physical, psychological or both (d). Percentages of participants having a diagnosis of hypertension, hypercholesterolaemia or diabetes (e) are presented. Further usage of healthcare services is shown, including number of consultations with any physician, a specialist or with a psychologist (f) and use of complementary medicine (g), all referring to the last 12 months. The percentage of participants in treatment for a mental issue (h) as well as their sense of control scaled from high to low is presented (i). For graphs with only one category (shades of green), results are shown with 95% confidence intervals.
Analysis of the seven Swiss Health Surveys reveals a gradual increase in the mean BMI, rising from 21.7 in 1992 to 23.2 in 2022. Women within the normal weight range remained the largest group across all years, although their proportion has steadily decreased (figure 3b). At the same time, the prevalence of overweight (11.0% to 17.0%) and obesity (2.5% to 8.0%) has progressively increased. Satisfaction with body weight has generally improved, with approximately two-thirds of participants reporting being either “very satisfied” or “mostly satisfied” (figure 3c). More than half reported a desire to change their body, an observation that has remained stable over the years. Nutritional awareness showed a high level of concern, fluctuating between 71.0% and 77.8% of participants answering “yes, I pay attention” (suppl. table 4). Regarding meat consumption, the percentage of women who never eat meat has increased from 3% to 10.9%, with a corresponding decrease in the category “5 to 7 days per week” (figure 3d). Decreasing trends were also observed for fish consumption, with the percentage of women who “never” eat fish increasing from 10.1% to 20.4% while the category “2 days per week or less” decreased in number. Due to modifications in the survey design over the years, the variable related to milk consumption was only comparable for the years 1992, 1997 and 2002. Over this period, milk consumption on “5 to 7 days per week” decreased from 46.1% to 39.9%. Conversely, the proportion of participants reporting “never” consuming milk increased from 30.3% to 34.6%.
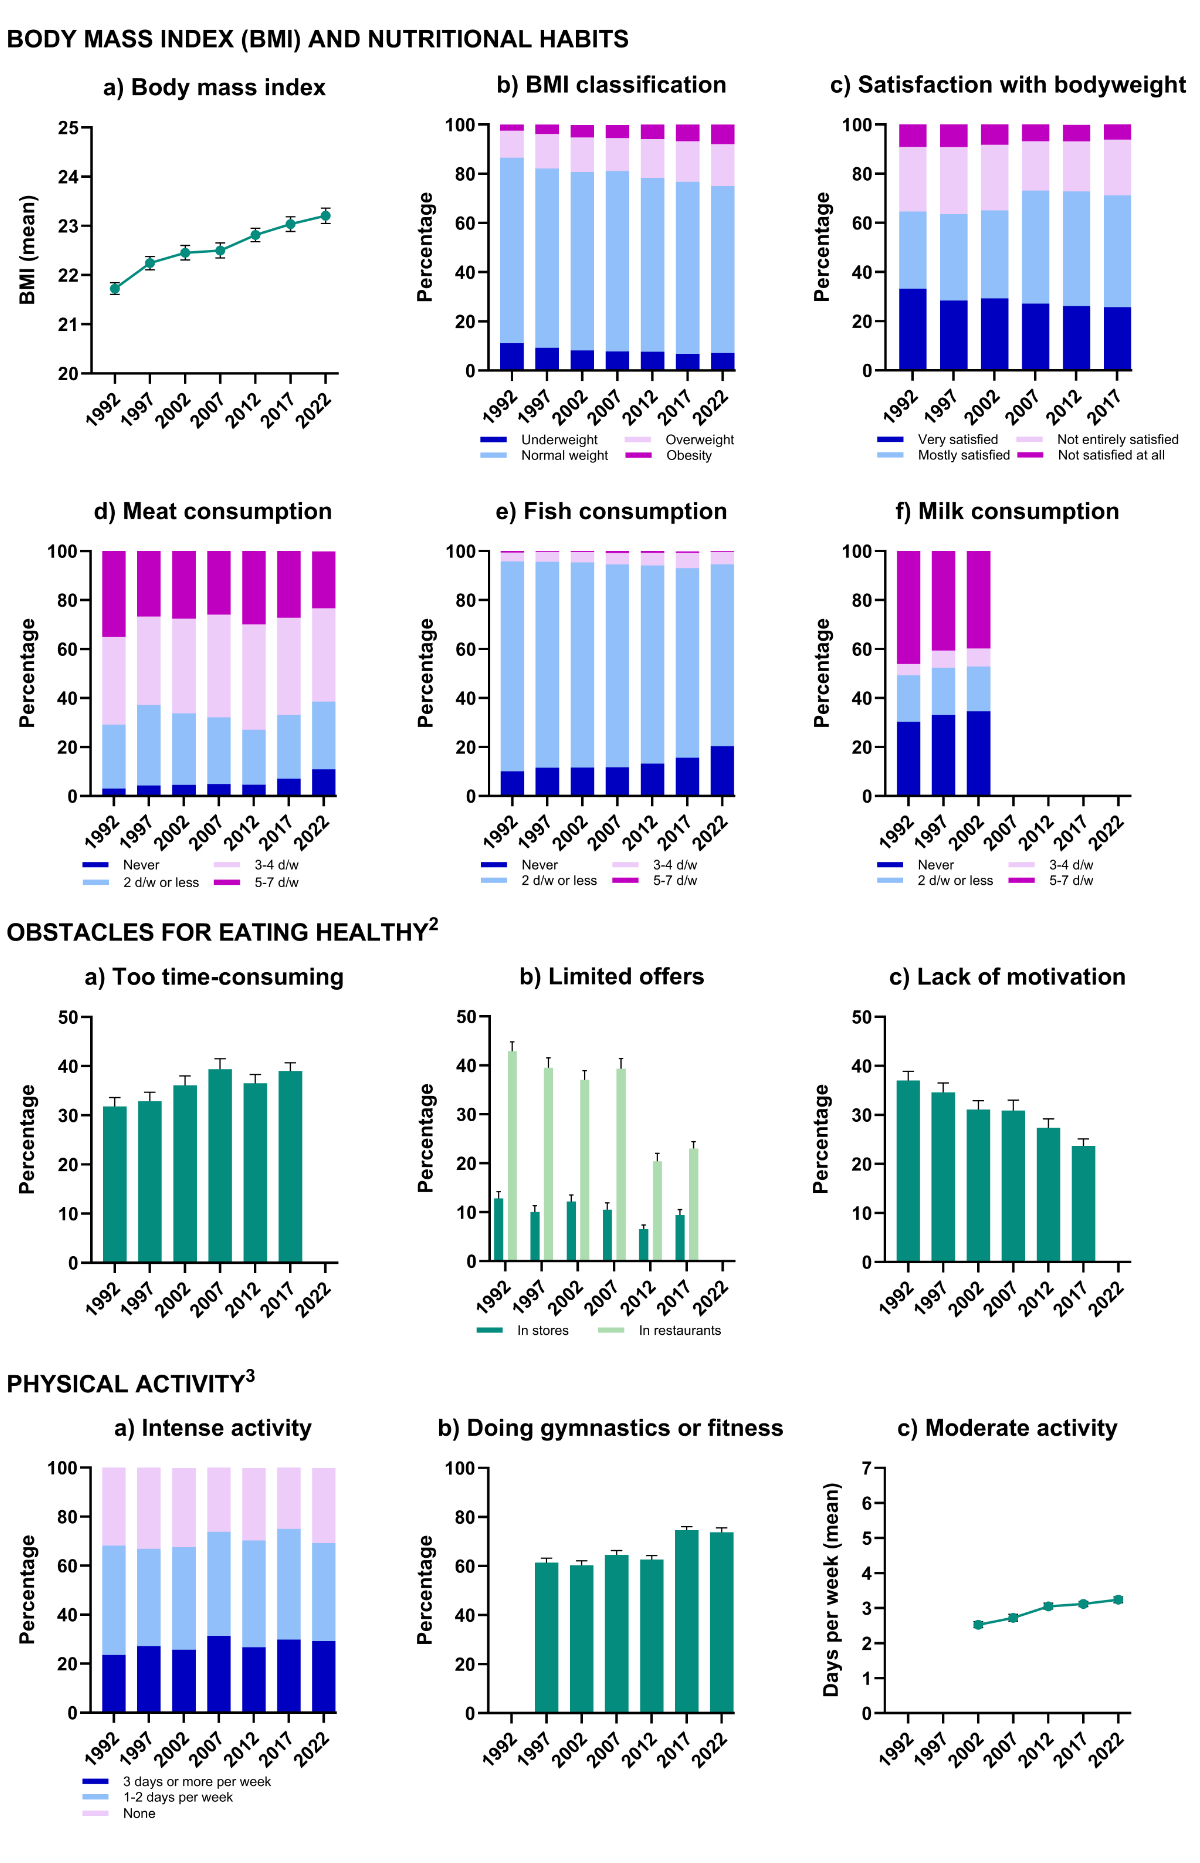
Figure 3 Body mass index (BMI), nutritional habits and physical activity of women of childbearing age from all Swiss Health Surveys from 1992 to 2022. Charts show percentages or means for every survey separately, including the mean BMI (a), ordinal classification of BMI divided into four groups (b), satisfaction with body weight (c), and frequency of meat (d), fish (e) and milk (f) consumption. Percentages of participants confirming obstacles to eating healthily are presented, including too time-consuming (a2), limited offerings in stores and restaurants (b2) and lack of motivation (c2). Physical activity is presented as intense activity (a3), meaning activity which includes sweating, doing gymnastics or fitness (b3) and moderate activity (c3) meaning activity leading to breathlessness. For graphs with only one category (shades of green), results are shown with 95% confidence intervals.
In all surveys except for 2022, participants were asked to identify potential obstacles preventing them from eating healthily, and given several answer options they could agree or disagree with. The answer “too time-consuming” exhibited an increasing percentage of agreement. The option “limited offers” in stores or restaurants and “lack of motivation” both showed decreasing agreement over time (figure 3c2). Information on other responses is listed in supplementary table 4.
Physical activity was assessed in the questionnaires across three categories: intense activity (including sweating), gymnastics and fitness, and moderate activity (including getting out of breath). Many participants engaged in intense physical activity once a week, with participation rates ranging from 67.0% to 75.0% (suppl. table 5). For the question on the frequency of these work-out sessions, the category “3 days or more per week” increased from 23.5% to 29.2% (figure 3a3). The mean number of days per week on which participants were physically active with sweating remained relatively stable at approximately 2.5 (suppl. table 5). Further, an increase in the proportion of women engaging in gymnastics, fitness or other sports was observed (figure 3b3). Concerning frequency, the most common response was “several times per week”, which experienced a decrease since 1992. In contrast, less frequent options, such as “around 1–3 times per month”, saw an increase from 3.1% to 11.8% (suppl. table 5). The mean number of days per week with moderate activity showed a slight increase (figure 3c3).
The percentage of participants who reported taking any medication in the last seven days rose from 31.6% to 49.6% (figure 4a). Among participants taking any medicine, there were proportional decreases in the use of antihypertensive medication (from 5.0% to 3.1%), cardiac medication (from 2.0% to 1.0%) and medication for high cholesterol (from 1.1% to 0.9%). Antidiabetic medication showed an increase from 0.6% (2007) to 2.1% (2022) (suppl. table 6). The proportion of antidepressant use rose from 7.0% to 11.0% (figure 4c). Starting from 45.3% in 1992, the overall use of painkillers, among medication users, rose to 69.4% by 2022. When categorised according to the regularity of medication use, this increase is particularly evident in the categories “once a week” (21.2% to 34.7%) and “several times per week” (11.7% to 26.0%). Correspondingly, the percentages for daily consumption and for no consumption of painkillers showed a decline (figure 4d). Approximately 65% of the participants consistently reported purchasing painkillers without a prescription (suppl. table 6). The use of sleeping pills did not show any trends across the frequency categories, with most participants reporting no consumption of sleeping pills (figure 4e). Ranging from 73.2% to 85.7%, the majority of those reporting sleeping pill use stated that they were prescribed (suppl. table 6). The proportional use of anxiolytics has decreased, with daily intake declining from 6.0% to 2.2%. Among those who reported using anxiolytics, a growing proportion indicated that they obtained them by prescription, rising from 72.4% to 87.6% (suppl. table 6).
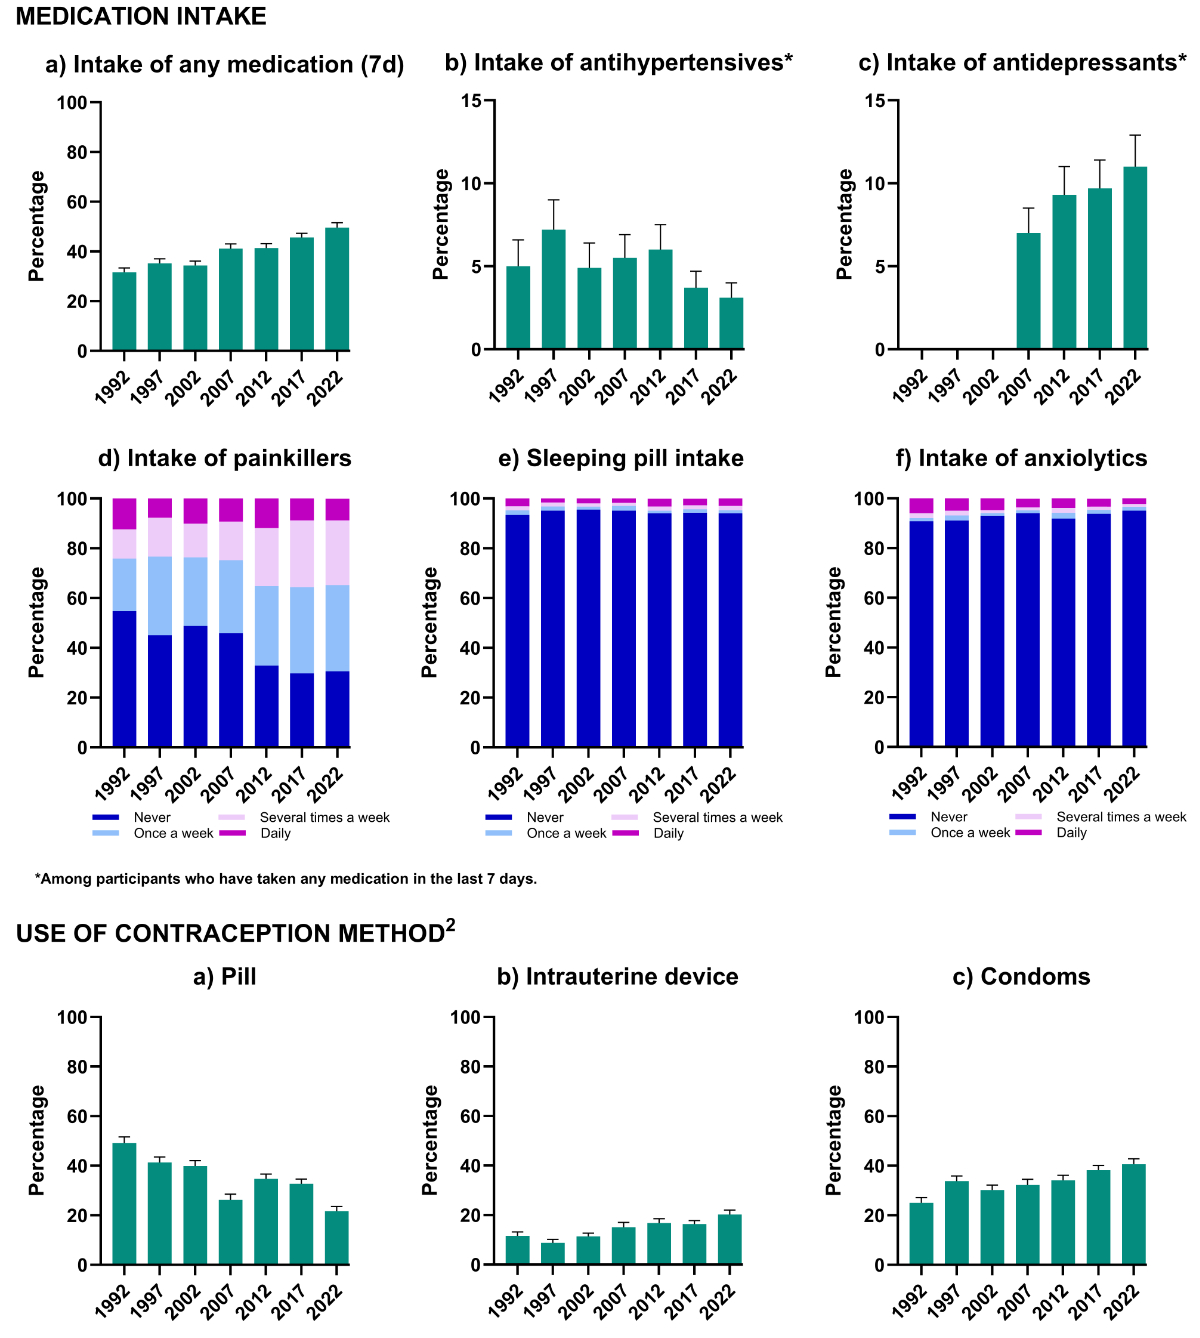
Figure 4 Medication use, including contraception, of women of childbearing age of all Swiss Health Surveys from 1992 to 2022. Charts show percentages for every survey separately, including any medication use in the last 7 days (a) and, within the subgroup of participants taking any medication, the proportional use of antihypertensive medication (b) and antidepressants (c). Frequency of painkiller (d), sleeping pill (e) and anxiolytic (f) use is presented as well as a selection of contraceptive methods including the Pill (a2), intrauterine devices (IUD) (b2) and condoms (c2). For graphs with only one category (shades of green), results are shown with 95% confidence intervals.
The overall use of contraception remained stable at around 70%, except for 1992 which showed 52.5% (suppl. table 7). Among the various contraceptive methods, the Pill exhibited the most notable change, with a decrease from 49.2% to 21.7% (figure 4a2). The contraceptive patch and vaginal ring were introduced in the questionnaire in 2012, and were initially used by 5.4% of participants, but decreased to 4.3% by 2022 (suppl. table 7). The use of IUDs increased from 11.6% to 20.2%. Condoms used as a contraceptive method rose from 25.0% to 40.6% (figure 4c2). Sterilisation and natural methods showed no clear trend over time, accounting for 12.1% of participants using sterilisation and 6.9% using natural methods as contraception in 2022. Less-frequently used contraceptive methods, with percentages of 1% or less – including the morning-after Pill, contraceptive injections or implants, diaphragms, cervical caps and female condoms – showed no change in overall use (suppl. table 7).
The frequency of habitual alcohol consumption was assessed via various categories, with most respondents indicating consumption of alcohol “1–2 times per week” or “less than once per week” (figure 5a). All categories showed a relatively consistent distribution over time with the exception of daily alcohol consumption, which decreased notably from 8.2% to 1.0%. The mean daily intake of pure alcohol was calculated for each survey year and dropped from 7.7 grams to 6.1 grams by 2022. This declining trend in frequency and volume of alcohol use is also reflected in the finding that most participants classified themselves as having “low risk” drinking behaviour (suppl. table 8).
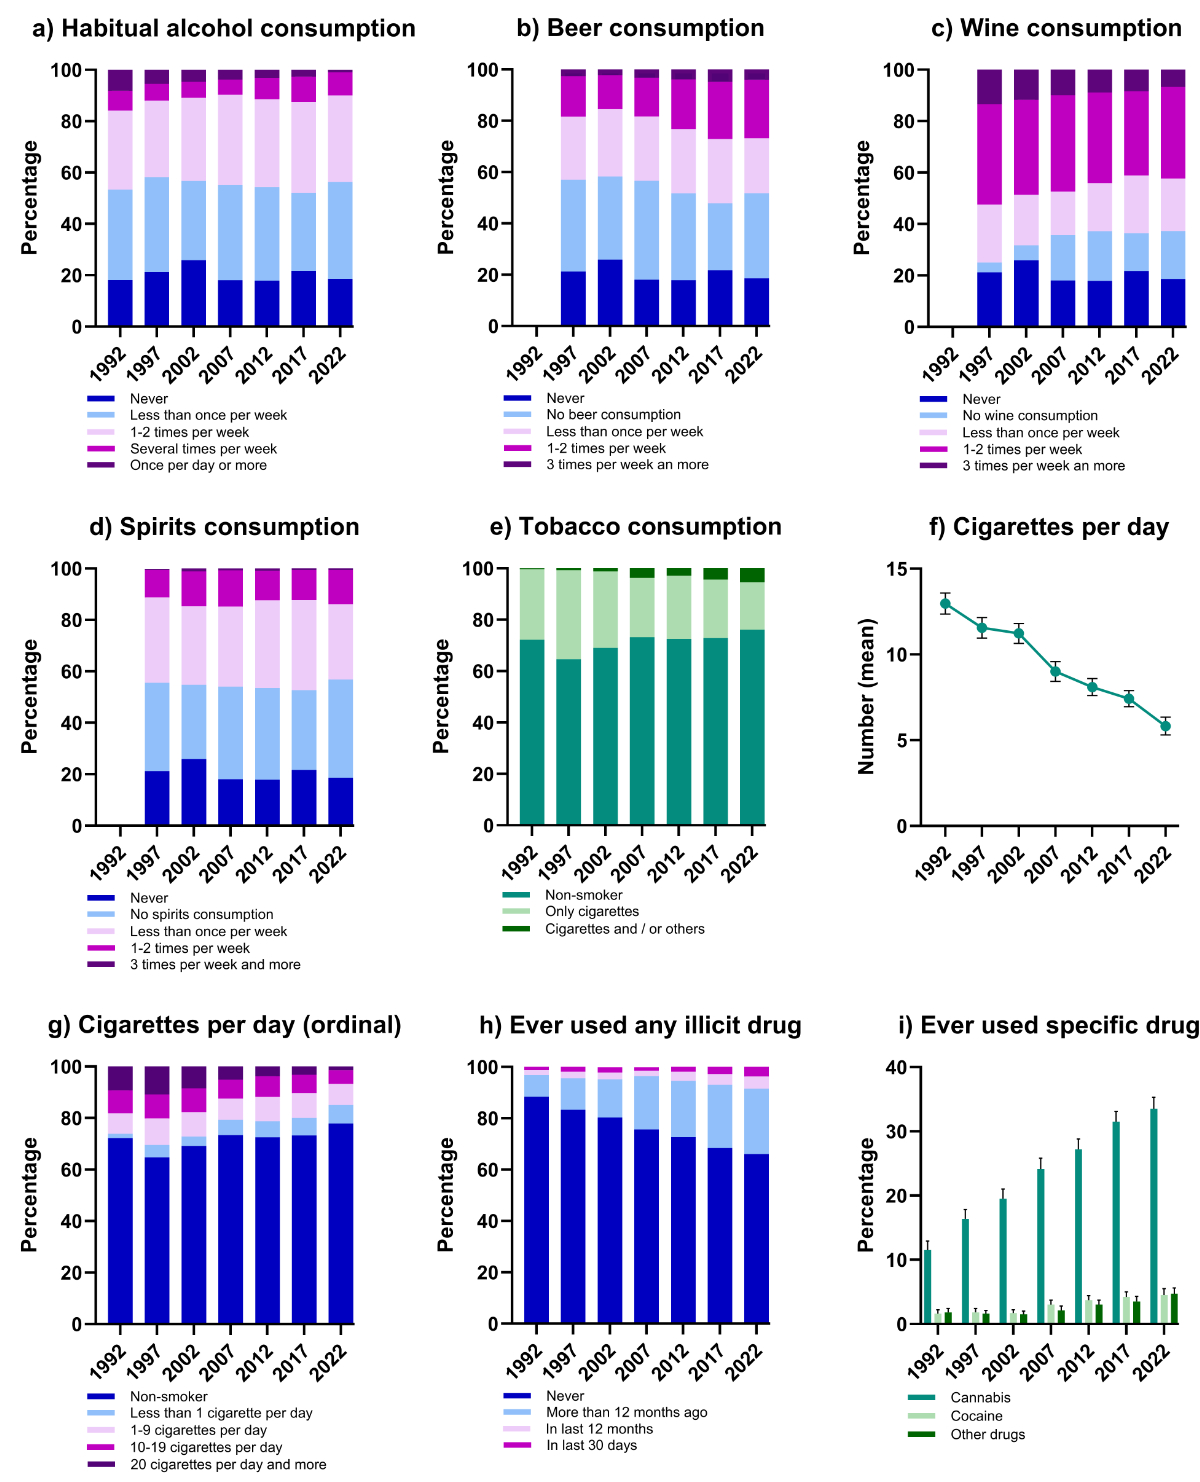
Figure 5 Alcohol consumption, smoking habits and use of illicit drugs among women of childbearing age from all Swiss Health Surveys from 1992 to 2022. Charts show results in percentages and means for every survey separately, including frequency of habitual alcohol consumption (a), frequency of beer (b), wine (c) and spirit (d) consumption, all referring to the last 12 months. Further, current tobacco consumption, including information on the type of tobacco product consumed (e), is shown. Among smokers, the number of cigarettes smoked per day is presented in five categories (f), as well as the mean number of cigarettes smoked (g). Percentages of participants who have ever tried illicit drugs in general, including the time of last consumption (h) as well as the proportion of participants having ever tried specific drugs (i), are presented. For graphs with only one category (shades of green), results are shown with 95% confidence intervals.
For the frequency of beer, wine and spirit consumption in the last 12 months, participants were categorised into several groups, including a category for those who reported abstinence from alcohol and a separate category for those who did not consume a specific alcoholic drink. The percentage of participants reporting abstinence from alcohol fluctuated between 25.9% and 17.9%. Beer consumption frequency demonstrated rising percentages within the category of “1–2 times per week” (15.8% to 22.8%) and “3 times per week and more” (2.6% to 4.0%). Conversely, wine consumption frequency exhibited a decrease in these two categories; in fact, there was a notable rise in the “no wine consumption” category (3.8% to 18.7%), indicating a decline in wine’s favourability (figure 5c). Spirit consumption frequency showed a slight increase in categories with more frequent consumption, namely “1–2 times per week” and “3 times per week and more”, but also in the “no spirit consumption” category (figure 5d). Alcopops, cocktails and other alcoholic drinks, which were added to the questionnaire in later years or are entirely missing, could not be analysed in this study. The number of alcoholic drinks consumed on a particular occasion was not examined in detail.
Between 1992 and 2022, the percentage of participants currently smoking tobacco products decreased from 27.8% to 23.9%. When examining the type of tobacco product smoked, participants were categorised into two groups: smoking “cigarettes only” and smoking “cigarettes and/or other products”. Tobacco products classified as “other” were designated as cigars, cigarillos, a pipe or water pipe and other, non-specified products. The percentage of participants smoking “cigarettes only” dropped, while the combined category of “cigarettes and/or other products” rose from 0.3% to 5.6% (figure 5e). Additionally, among participants who smoke cigarettes, the mean number of cigarettes smoked per day decreased from 13.0 to 5.8. Grouping the number of cigarettes consumed per day, a noticeable shift towards less frequent smoking was apparent, with the proportion of participants smoking “less than 1 cigarette per day” increasing from 1.7% to 7.1%. Accordingly, the percentage of participants smoking “20 or more cigarettes per day” declined from 9.2% to 1.5% (figure 5f). Regarding cessation efforts, the percentage of participants attempting to quit smoking rose from 28.4% to 37.5%. However, the desire to quit smoking decreased slightly, from 43.4% to 39.5% (suppl. table 9).
Regarding consumption of illicit drugs, the percentage of participants reporting having “ever used drugs” has proportionally risen from 9.7% to 34.2%. When the focus was on the most recent use of any illicit drug, all categories – “more than 12 months ago”, “in the last 12 months” and “in the last 30 days” – demonstrated increasing prevalence rates (figure 5h). The percentage of participants having ever tried heroin remained at very low levels, further declining to 0.3% by 2022 (suppl. table 10). Cocaine, on the other hand, showed – still at low percentages – an increase in consumption with 4.5% having ever tried cocaine in 2022. The variable documenting the use of “other drugs” showed an overall increase from 1.6% to 4.7%. The proportion of participants who have ever tried cannabis increased from 11.5% to 33.5% (figure 5i). However, the majority indicated that their last use was “more than 12 months ago” (suppl. table 10).
Overall, this study highlights evolving trends in health behaviours, attitudes and outcomes among women of reproductive age in Switzerland and illustrates how these trends can develop in multiple directions simultaneously. Chronic diseases, as well as physical and mental disorders, are on the rise, yet people feel healthier. BMI is increasing despite considerable awareness of nutrition and more physical activity. Alcohol and tobacco consumption have decreased, while cannabis has become more popular. New products enter the market, and new therapeutic approaches are becoming popular, replacing older ones and changing the behaviour of the population.
A key strength of this study is its large, sociodemographically representative sample, which enables a comprehensive overview of the young female Swiss population. Its extensive coverage of numerous topics provides an insight into societal trends, particularly valuable given the long study period and its focus on a specific subgroup – women of reproductive age – mostly underrepresented in studies [23]. However, the analysis addresses a limited selection of variables per topic, which restricts the potential for deeper insights. This limitation is compounded by the lack of comparability over time due to societal shifts, the emergence of new products on the market and the evolving public discourse – especially in areas such as mental health, contraception, substance use and other formerly taboo subjects. Furthermore, the individual topics were not stratified by specific subgroups such as age or region, which prevented explicit consideration of potential differences within the population examined. It is also important to note that the data were based on self-reported questionnaires, introducing subjectivity and the potential for bias, particularly in sensitive or stigmatised areas. Finally, participation bias might have contributed to the observed longitudinal changes as the participation rate has declined in the last Swiss Health Surveys, with the percentage of contacted persons with unknown/non reachable status increasing from 12.4% in 2007 to the highest value of 52.9% in 2022 (see suppl. methods, table 1 in the supplementary file available for download at https://doi.org/10.57187/5069).
The observed rise in employment was largely concentrated in part-time positions, as reflected by a 9 percentage points decline in the proportion of participants working full-time since 1992. One may speculate that 30 years ago women were more frequently confronted with a binary choice: either full-time employment or full-time domestic responsibilities. In contrast, today’s societal structures offer a broader range of options, allowing for more individualised work-life arrangements. This increased flexibility could have enabled more women to enter the labour force in general, as opportunities for working part-time certainly affect women’s decisions [24]. The main reason why women choose part-time work instead of full-time appears to be childcare and family responsibilities [24, 25]. Women continue to bear a disproportionately large share of household and caregiving duties, leading to a “double burden” that makes balancing family and career particularly challenging [26]. As a result, many women delay childbearing to a life stage that feels professionally and personally more stable, allowing their focus to be shifted to parenthood [27, 28]. Personal considerations – which play an even more decisive role than socioeconomic reasons – include concerns about sacrificing personal freedom, fear of the responsibility associated with raising a child and uncertainties about the future [29]. Yet, regardless of the reasons behind the decision to delay motherhood, the widespread trend of rising maternal age presents clear challenges for prenatal care. Advanced maternal age is associated with an increased risk of complications during pregnancy and can negatively impact both pregnancy outcomes and child health [9]. Age-related risks are no longer the exception but rather a baseline condition, making it all the more important to consider additional health behaviours and risk factors in the care of expectant mothers [8, 30].
Examination of the overall health status of the participants reveals a paradox: on the one hand, there was an increasing self-reported perception of better health; on the other hand, there was a rise in complaints and chronic diseases. One possible explanation for this contradiction could be the high awareness of personal health, as most participants reported that “thoughts about health affect lifestyle”. Additionally, numerous social trends towards striving for a healthy lifestyle to achieve good health are increasingly influencing young adults [31]. As a result, despite the presence of complaints, individuals may perceive their health status more positively, as they are actively addressing these issues and may not always view them as significant health impairments. Further, people with non-communicable chronic conditions often describe themselves as healthy when the disease is under therapeutic control [32]. In our study, the proportion of participants reporting a diagnosis of high blood pressure, high cholesterol or diabetes has seen a modest increase. Higher prevalence of hypertension was observed over the whole female Swiss population; separated into age groups, the rising trend starts in the group of women aged 45–54 years [33]. In our study, the rising trend is therefore most probably in participants aged 45–49 years. Similarly, hypercholesterolaemia exhibits increasing trends in both our study as well as in the whole female Swiss population, showing the most upward trends at ages 45 years and over [34]. Diabetes displays a rising prevalence worldwide [35], a trend that could also be observed in our study. The rising prevalence of high blood pressure, high cholesterol level and diabetes in the female population aged 15–49 years raises questions about the effect of these conditions on pregnancies. Hypertension during pregnancy (HDP), including preeclampsia, and gestational diabetes (GDM) are severe pregnancy-related diseases. HDP affects approximately 6–8% of all pregnancies, while GDM occurs in about 5% [36, 37]. Obesity and pre-existing medical diseases such as diabetes are major risk factors for developing these diseases [38–40]. Therefore, lifestyle modifications play an important role in both prevention and treatment of these diseases and concomitant consequences for their offspring.
The observed rise of long-lasting medical problems would be expected to coincide with an increased use of healthcare services. The mean number of reported consultations within the last 12 months with any physician as well as with specialists have risen only moderately and the mean days spent in hospital even declined. This may be explained by the introduction of the SwissDRG system in 2012, under which inpatient treatments are reimbursed based on case-based lump sums that are generally independent of the length of hospital stay [41]. From a financial perspective, it is therefore more beneficial for hospitals not to keep patients hospitalised for extended periods. However, use of complementary medicine has surged by 28 percentage points, indicating a potential cultural shift towards integrative approaches to health. Complementary medicine is often used as an additional approach to improve quality of life, particularly in cases where conventional medicine cannot fully address the patient’s needs [42]. Other studies confirm that women – especially those with chronic conditions, poorer self-rated health and higher education levels – are more likely to engage in complementary medicine [43, 44]. Given the rising prevalence of chronic diseases and health complaints among women [45], it is not surprising that they are more likely to turn to complementary therapies.
Psychological symptoms and demand for mental health services have notably increased, which may reflect increased awareness and destigmatisation of mental health issues in both society and in the medical system [46]. According to recently published data from the FSO on health and gender, the group most affected by mental health issues comprises women between the ages of 15 and 24 [45].
BMI, nutritional habits and physical activity are modifiable, lifestyle-related factors frequently mentioned when talking about risk factors for cardiovascular and metabolic diseases [2, 47]. On a global scale, lifestyle shifts have contributed to an increase in BMI [48] – a pattern that is also evident within our study population. Obesity presents a challenge for medical care in many areas and complicates numerous diseases. Posing a risk also for pregnancy-related conditions, such as hypertensive disorders, gestational diabetes or macrosomia, elevated BMI leads to more intensive prenatal care and directly influences pregnancy outcomes and the future health of the child [49–51].
More than half of the participants reported a desire to change their weight. Comparing women’s satisfaction with their body weight to that of men shows that women are more frequently dissatisfied, despite higher rates of overweight and obesity among men [45], highlighting that satisfaction does not necessarily correlate directly with actual BMI. Body image is strongly influenced by social factors, particularly among young people, in whom social media plays a significant role – in both negative body image and body positivity [52, 53]. Although the observed parallel trends of rising BMI and decreasing dissatisfaction with body weight may appear paradoxical, they can be understood through the disconnection of the physical body from perceived body image.
Nutritional awareness remained high despite a minor decline over the years, and dietary trends show a reduction in meat, fish and milk consumption, possibly linked to the rise of vegetarianism and veganism [54]. Asking respondents about reasons why eating healthily can be difficult, the answer “too time-consuming” showed increasing agreement, which may be associated with the more demanding lifestyles of women today, balancing private and professional life, as discussed earlier [55]. The option “limited offers” in stores or restaurant showed decreasing percentages, likely due to growing market responses to health and sustainability trends [56].
While more participants reported doing gymnastics or fitness activities, the frequency of these activities was decreasing in the most recent surveys, suggesting a broader but less intensive participation – potentially due to formerly inactive participants adopting less frequent routines. In Switzerland, 70% of all women engage in sufficient physical activity in their free time; the figure shows a positive correlation with rising education levels [45].
General medication use has increased, leading to approximately 50% of participants taking medication in 2022. Among participants taking any medicine, there were proportional decreases in the use of antihypertensive medication, cardiac medication and medication for high cholesterol – despite increasing reports of diagnosis for the same diseases. This may be attributable to the relatively young age of the sample, in which diagnoses were likely recently established. In accordance with clinical guidelines, lifestyle modifications are typically recommended as the first-line treatment for hypertension. Weight loss, adherence to specific diets, engagement in physical activity, and reduction of alcohol consumption and smoking have each been shown to lower blood pressure, with the greatest efficacy observed when these lifestyle modifications are implemented in combination [57, 58]. In the management of hyperlipidaemia in general, changes in lifestyle habits constitute an essential component of treatment, particularly during the early stages of the disease [59, 60]. This highlights the importance and preventive potential of lifestyle modifications. Antidiabetic medication showed an increase, corresponding with the rising diagnosis of diabetes. In Switzerland, screening for GDM is recommended for all pregnant women between the 24th and 28th weeks of pregnancy [61]. The rise in diabetes diagnoses may be linked to the introduction of this screening in 2010 [62]. One possible explanation for the increased medication use could be the growing need for treatment of the observed increasing physical complaints. Painkillers are among the medications typically used symptomatically and on an as-needed basis and are among the medications frequently obtained without a prescription, especially among women [63, 64]. Self-medication of moderate pain is very common in quick symptom management to maintain functionality, with analgesics being the most important group of medication for self-treatment [65]. In our study, around 65% of the participants consistently reported purchasing painkillers over the counter. Interestingly, the proportional use of anxiolytics however, has decreased from 9.2% to 5%, a trend that has been observed in most European countries [66]. A greater reluctance to prescribe anxiolytics due to concerns about probable misuse and the risk of dependency may well be a reason for the declining use [66, 67]. Additionally, treatment guidelines have evolved over the years. While anxiolytics were more commonly prescribed for anxiety disorders in the past, current recommendations now suggest antidepressants as the first-line pharmacological therapy for such conditions [67–69]; this may also have contributed to the observed decrease in anxiolytic use.
The overall rise in medication use among women of reproductive age cannot be discussed without considering contraception. The observed decline in oral contraception use may reflect increased awareness of side effects and a broader societal scepticism towards hormonal interventions [70]. As combined oral contraception is associated with an increased cardiovascular risk [71], this may lead to women with other risk factors, such as smoking or being overweight, being less frequently prescribed the Pill due to a cumulatively high risk profile [72, 73]. In the last 30 years, new contraceptive methods have come onto the market, expanding possibilities. Also, existing methods have further developed and improved. For example, IUD implantation was in the past primarily suggested for women after the birth of their first child [74, 75]. Nowadays – supported by new evidence and methodological adjustments – the IUD is recommended for young nulliparous women and has become a popular method, also reflected in our data, with a doubling of the proportion of users [76, 77]. Condoms used as a contraceptive method rose appreciably from 25.0% to 40.6%. It can be speculated that opposition to hormonal contraception led to an increasing usage of condoms. As condoms not only prevent pregnancy, but are also used to prevent sexually transmitted infections, they are recommended for use in combination with other contraceptive methods, a strategy called dual method use [78]. The rise in usage could therefore also be an effect of preventive and sexual health education work [79, 80].
Lifestyle behaviours related to substance use show both encouraging and concerning trends. Alcohol consumption has declined in frequency and volume. The overall decline in the absolute amount of pure alcohol consumed is reflected in the finding that most participants were classified as having “low risk” drinking behaviour. Focusing on the types of alcoholic beverages consumed by the participants, beer appears to have gained popularity, while the favourability of wine consumption has been declining. Summarising the frequency of alcohol consumption, this study observed a general shift from daily drinking – which considerably decreased – to occasional drinking on a weekly basis. Considering all age groups, daily alcohol consumption appears primarily to be an issue for older women [81], which explains the low proportion of daily alcohol consumers in our cohort of women aged 15 to 49 years. Other studies suggest that the prevalence of binge drinking – defined as 4 drinks or more per occasion – is growing among young women [81, 82].
In Switzerland, alcohol consumption during pregnancy is estimated to have a prevalence of 14–20% [13, 83]. Worldwide, European countries show the highest percentages at around 25%, with Switzerland in a leading position [84]. In most cases, this refers to moderate and occasional alcohol consumption. Binge drinking is particularly associated with severe consequences for the child, yet even low levels of alcohol intake can lead to behavioural disorders in children [85]. There are misconceptions that small amounts of alcohol are not harmful or are even beneficial for mother and child or that alcohol has no effect when consumed in the first few weeks [86]. Clearer communication about the associated risks would certainly be helpful in further reducing alcohol use during pregnancy.
Smoking rates have decreased, alongside a reduction in the number of cigarettes consumed per day among smokers. Looking back at historical patterns, smoking became increasingly popular among women in the 1960s, a trend that was actively promoted by the tobacco industry [87, 88]. This trend of increasing tobacco consumption has plateaued for both women and men and shows declining numbers over the last 30 years in Switzerland, similarly to our findings [89]. One possible explanation for this may be the success of various smoking prevention programmes [90, 91]. Still, one-quarter of the participants reported current tobacco consumption. The alignment of female smoking behaviour with that of men has led to an increase in cardiovascular diseases.
Female smokers face an elevated risk of morbidity and mortality compared with their male counterparts [45, 92], which becomes especially important when a woman wants to become pregnant. Smoking during pregnancy is associated with an increased risk of reduced birth weight and size, preterm birth and a lower 1-minute APGAR score [93]. Despite these risks, the study of Bornhauser et al. found that around 10% of women were smoking during pregnancy [13]. Similar results were found in a systematic review, which additionally showed even higher prevalence of smoking during pregnancy in other European countries [94]. This raises the question of whether these women lacked adequate information or whether cessation was not possible due to nicotine dependency. Smoking cessation is a complex and often unsuccessful endeavour that requires professional support [95]. The fact that 10% of pregnant women continue to smoke, despite the risks to both mother and child, highlights the need for better education and greater investment in primary prevention to reduce tobacco dependence at an early age, especially with new products such as vaping, which are specially designed to attract young buyers [96], coming onto the market. Our study already shows a small shift from exclusive cigarette use to the consumption of cigarettes and/or other products. The use of alternative tobacco products among young women in Switzerland warrants future long-term research.
While the changes in heroin, cocaine and other drug consumption were moderate, the proportion of participants having consumed cannabis has tripled over the last 30 years. However, the majority indicated that their last use was “more than 12 months ago”, suggesting that while cannabis is being tried more frequently, this rise does not necessarily reflect an increase in regular use. The steps towards social acceptance and legalisation of cannabis may be the reason why more young women try this substance [97]. In interpreting these results, one should bear in mind that they are based on self-reported information, making the results less reliable when it comes to controversial topics.
The Swiss expert report provides clear recommendations for preconception counselling. Among the suggested interventions are achieving optimal control of pre-existing medical conditions, normalising weight, abstaining from or at least reducing the use of addictive substances, and optimising lifestyle habits [16]. It is important to emphasise that harmful substances and risky behaviours can already have an impact in the weeks before pregnancy is detected. As mentioned in the introduction, up to 50% of all pregnancies are unplanned [16]. The first appointment for a pregnancy check-up occurs mostly around the 6th–8th week of pregnancy. This means that women may engage in harmful behaviours in the weeks before conception and even in the early weeks of pregnancy, i.e. before the first prenatal examination and health education can take place.
Lifestyle adjustments are processes that take time before they show the desired effect. This raises the question of whether the recommendations simply come too late, especially in cases such as addiction, where such habits cannot be changed within a short timeframe. Such information should therefore also be addressed during routine gynaecological check-ups. In this way, young women could already have the knowledge – prior to a planned or unplanned pregnancy – about which behaviours and medical conditions might potentially lead to complications during pregnancy and how they can change them. Increased awareness, along with public health campaigns promoting healthier lifestyles, could help bridge the gap between the weeks before conception and the first prenatal consultation. However, even among women who do receive counselling, not all are able to avoid risky behaviours during pregnancy or they may have a risk profile that could not be stabilised beforehand. In such cases, early intervention is certainly beneficial – and the situation may also call for more comprehensive professional support.
Our observations reflect the complex interactions between societal norms, health systems and individual wellbeing. As chronic illnesses become more common and mental stress increases, it is even more important that women of childbearing age receive the necessary knowledge and support, especially when it comes to planning a pregnancy. Social trends and changes in health determinants therefore underscore the importance of adapting public health strategies to the emerging needs of this population. Attention should be focused on the factors that can be influenced by lifestyle adjustments to minimise potential risk profiles. Early interventions and prevention measures can lead to better pregnancy outcomes for both mother and child. Future research should focus on more detailed analysis of specific topics, ideally incorporating longitudinal or causal modelling approaches to better understand the relationships between and causes of underlying trends in public health.
A contract with the FSO was signed for the proper handling of the (deidentified) data including regulations on data sharing, methodical standards for statistical analysis and data protection based on Swiss laws and regulations. The data used for this analysis are not publicly available and cannot be shared with third parties by the authors.
We would like to thank the team at the FSO, in particular Dr M. Storni, Head of Social Science Survey (Bereichsleiter Sozialwissenschaftliche Befragungen), for their assistance with data management and methodological questions. Dr H. Murray is gratefully acknowledged for language corrections.
Large Language Models (OpenAI) were used exclusively for linguistic correction and rephrasing. All content and conclusions were independently developed by the authors without AI-generated input.
This study received no external funding.
All authors have completed and submitted the International Committee of Medical Journal Editors form for disclosure of potential conflicts of interest. No potential conflict of interest related to the content of this manuscript was disclosed.
1. Joynt Maddox KE, Elkind MS, Aparicio HJ, Commodore-Mensah Y, de Ferranti SD, Dowd WN, et al.; American Heart Association. Forecasting the Burden of Cardiovascular Disease and Stroke in the United States Through 2050-Prevalence of Risk Factors and Disease: A Presidential Advisory From the American Heart Association. Circulation. 2024 Jul;150(4):e65–88. doi: https://doi.org/10.1161/CIR.0000000000001256
2. Teo KK, Rafiq T. Cardiovascular Risk Factors and Prevention: A Perspective From Developing Countries. Can J Cardiol. 2021 May;37(5):733–43. doi: https://doi.org/10.1016/j.cjca.2021.02.009
3. Nedkoff L, Briffa T, Zemedikun D, Herrington S, Wright FL. Global Trends in Atherosclerotic Cardiovascular Disease. Clin Ther. 2023 Nov;45(11):1087–91. doi: https://doi.org/10.1016/j.clinthera.2023.09.020
4. Ramlakhan KP, Johnson MR, Roos-Hesselink JW. Pregnancy and cardiovascular disease. Nat Rev Cardiol. 2020 Nov;17(11):718–31. doi: https://doi.org/10.1038/s41569-020-0390-z
5. Ouzounian JG, Elkayam U. Physiologic changes during normal pregnancy and delivery. Cardiol Clin. 2012 Aug;30(3):317–29. doi: https://doi.org/10.1016/j.ccl.2012.05.004
6. Morton A. Physiological Changes and Cardiovascular Investigations in Pregnancy. Heart Lung Circ. 2021;30(1):e6–15. doi: https://doi.org/10.1016/j.hlc.2020.10.001
7. Catalano PM, Vargo KM, Bernstein IM, Amini SB. Incidence and risk factors associated with abnormal postpartum glucose tolerance in women with gestational diabetes. Am J Obstet Gynecol. 1991 Oct;165(4 Pt 1):914–9. doi: https://doi.org/10.1016/0002-9378(91)90438-W
8. Bundesamt für Statistik [Federal Statistical Office]. (2022). Demografisches Porträt der Schweiz: Bestand, Struktur und Entwicklung der Bevölkerung im Jahr 2020. Retrieved from https://www.bfs.admin.ch/bfs/de/home/aktuell/neue-veroeffentlichungen.assetdetail.21764558.html
9. Laopaiboon M, Lumbiganon P, Intarut N, Mori R, Ganchimeg T, Vogel JP, et al.; WHO Multicountry Survey on Maternal Newborn Health Research Network. Advanced maternal age and pregnancy outcomes: a multicountry assessment. BJOG. 2014 Mar;121(s1 Suppl 1):49–56. doi: https://doi.org/10.1111/1471-0528.12659
10. Lockwood CJ. Prenatal care: Patient education, health promotion, and safety of commonly used drugs. 2025. Available from www.uptodate.com
11. Agarwal P, Morriseau TS, Kereliuk SM, Doucette CA, Wicklow BA, Dolinsky VW. Maternal obesity, diabetes during pregnancy and epigenetic mechanisms that influence the developmental origins of cardiometabolic disease in the offspring. Crit Rev Clin Lab Sci. 2018 Mar;55(2):71–101. doi: https://doi.org/10.1080/10408363.2017.1422109
12. Boney CM, Verma A, Tucker R, Vohr BR. Metabolic syndrome in childhood: association with birth weight, maternal obesity, and gestational diabetes mellitus. Pediatrics. 2005 Mar;115(3):e290–6. doi: https://doi.org/10.1542/peds.2004-1808
13. Bornhauser C, Quack Lötscher K, Seifert B, Simões-Wüst AP. Diet, medication use and drug intake during pregnancy: data from the consecutive Swiss Health Surveys of 2007 and 2012. Swiss Med Wkly. 2017 Dec;147:w14572.
14. Coleman-Cowger VH, Schauer GL, Peters EN. Marijuana and tobacco co-use among a nationally representative sample of US pregnant and non-pregnant women: 2005-2014 National Survey on Drug Use and Health findings. Drug Alcohol Depend. 2017 Aug;177:130–5. doi: https://doi.org/10.1016/j.drugalcdep.2017.03.025
15. Bergmann KE, Bergmann RL, Ellert U, Dudenhausen JW. Perinatale Einflussfaktoren auf die spätere Gesundheit. Ergebnisse des Kinder- und Jugendgesundheitssurveys (KiGGS) [Perinatal risk factors for long-term health. Results of the German Health Interview and Examination Survey for Children and Adolescents (KiGGS)]. Bundesgesundheitsblatt Gesundheitsforschung Gesundheitsschutz. 2007;50(5-6):670–6. doi: https://doi.org/10.1007/s00103-007-0228-4
16. Krischer BB, Hösli I, Renteria S, Streuli I, Surbek D. (2025). Präkonzeptionsberatung – “Preconception Care”. Retrieved from https://www.sggg.ch/fileadmin/user_upload/Dokumente/3_Fachinformationen/1_Expertenbriefe/De/92_Expertenbrief_Praekonzeptionsberatung_ersetzt_EB33_250620.pdf
17. Dratva JG, Späth A, Zemp Stutz E. (2014). SWIFS – Swiss Infant Feeding Study: Eine nationale Studie zur Säuglingsernährung und Gesundheit im ersten Lebensjahr Retrieved from Basel: https://www.swisstph.ch/fileadmin/user_upload/SwissTPH/Projects/SWIFS/SWIFS_Schlussbericht.pdf
18. Stephenson J, Heslehurst N, Hall J, Schoenaker DA, Hutchinson J, Cade JE, et al. Before the beginning: nutrition and lifestyle in the preconception period and its importance for future health. Lancet. 2018 May;391(10132):1830–41. doi: https://doi.org/10.1016/S0140-6736(18)30311-8
19. Bundesamt für Statistik [Federal Statistical Office] (2023). Die Schweizerische Gesundheitsbefragung 2022 in Kürze. Konzept, Methode, Durchführung. Retrieved from https://www.bfs.admin.ch/bfs/de/home/statistiken/gesundheit/erhebungen/sgb.assetdetail.31646339.html
20. Hänsel M, Steigmiller K, Luft AR, Gebhard C, Held U, Wegener S. Neurovascular disease in Switzerland: 10-year trends show non-traditional risk factors on the rise and higher exposure in women. Eur J Neurol. 2022 Sep;29(9):2851–60. doi: https://doi.org/10.1111/ene.15434
21. West BT. Statistical and methodological issues in the analysis of complex sample survey data: practical guidance for trauma researchers. J Trauma Stress. 2008 Oct;21(5):440–7. doi: https://doi.org/10.1002/jts.20356
22. Bundesamt für Statistik [Federal Statistical Office] (2023). Die Schweizerische Gesundheitsbefragung 2022 in Kürze. Konzept, Methode, Durchführung. Retrieved from https://www.bfs.admin.ch/bfs/de/home/statistiken/gesundheit/erhebungen/sgb.assetdetail.31646339.html
23. Vitale C, Fini M, Spoletini I, Lainscak M, Seferovic P, Rosano GM. Under-representation of elderly and women in clinical trials. Int J Cardiol. 2017 Apr;232:216–21. doi: https://doi.org/10.1016/j.ijcard.2017.01.018
24. Buchmann MC, Sacchi S. Labour market structures and women’s employment levels. Work Employ Soc. 2010;24(2):279–99. doi: https://doi.org/10.1177/0950017010362142
25. Bundesamt für Statistik [Federal Statistical Office]. (2023). SAKE in Kürze 2023 - Schweizerische Arbeitskräfteerhebung. Retrieved from www.statistik.ch
26. Booth AL, van Ours JC. Part-time jobs: what women want? J Popul Econ. 2013;26(1):263–83. doi: https://doi.org/10.1007/s00148-012-0417-9
27. Mills M, Rindfuss RR, McDonald P, te Velde E; ESHRE Reproduction and Society Task Force. Why do people postpone parenthood? Reasons and social policy incentives. Hum Reprod Update. 2011;17(6):848–60. doi: https://doi.org/10.1093/humupd/dmr026
28. Waldenström U. Postponing parenthood to advanced age. Ups J Med Sci. 2016 Nov;121(4):235–43. doi: https://doi.org/10.1080/03009734.2016.1201553
29. Szcześniak M, Timoszyk-Tomczak C, Łoś J, Grzeczka M. Future anxiety and the motives for postponing parenthood: generational time perspective and life satisfaction as mediators. Front Psychol. 2025 Feb;15:1441927. doi: https://doi.org/10.3389/fpsyg.2024.1441927
30. Martin JA, Hamilton BE, Osterman MJ, Driscoll AK. Births: final Data for 2018. Natl Vital Stat Rep. 2019 Nov;68(13):1–47.
31. Easton S, Morton K, Tappy Z, Francis D, Dennison L. Young People’s Experiences of Viewing the Fitspiration Social Media Trend: qualitative Study. J Med Internet Res. 2018 Jun;20(6):e219. doi: https://doi.org/10.2196/jmir.9156
32. Bhor N, Nadh PO. Interfaces of ‘being healthy and being Ill’: how is health being perceived by individuals with non-communicable chronic conditions? Int J Equity Health. 2024 May;23(1):108. doi: https://doi.org/10.1186/s12939-024-02188-2
33. Bluthochdruck (Alter: 15+). Schweizer Monitoring-System Sucht und nichtübertragbare Krankheiten (MonAM). Available from https://ind.obsan.admin.ch/indicator/monam/bluthochdruck-alter-15
34. Erhöhter Cholesterinspiegel. Schweizer Monitoring-System Sucht und nichtübertragbare Krankheiten (MonAM). Available from https://ind.obsan.admin.ch/indicator/monam/erhoehter-cholesterinspiegel-alter-15
35. Zhou B, Rayner AW, Gregg EW, Sheffer KE, Carrillo-Larco RM, Bennett JE, et al.; NCD Risk Factor Collaboration (NCD-RisC). Worldwide trends in diabetes prevalence and treatment from 1990 to 2022: a pooled analysis of 1108 population-representative studies with 141 million participants. Lancet. 2024 Nov;404(10467):2077–93. doi: https://doi.org/10.1016/S0140-6736(24)02317-1
36. Umesawa M, Kobashi G. Epidemiology of hypertensive disorders in pregnancy: prevalence, risk factors, predictors and prognosis. Hypertens Res. 2017 Mar;40(3):213–20. doi: https://doi.org/10.1038/hr.2016.126
37. Orecchio A, Periard D, Kashef A, Magnin JL, Hayoz D, Fontana E. Incidence of gestational diabetes and birth complications in Switzerland: screening in 1042 pregnancies. Gynecol Endocrinol. 2014 Aug;30(8):561–4. doi: https://doi.org/10.3109/09513590.2013.879853
38. Wu P, Green M, Myers JE. Hypertensive disorders of pregnancy. BMJ. 2023 Jun;381:e071653. doi: https://doi.org/10.1136/bmj-2022-071653
39. Deutsche Gesellschaft für Gynäkologie und Geburtshilfe (DGGG) e. V. ÖGfGuGO, Schweizerische Gesellschaft für Gynäkologie und Geburtshilfe (SGGG), u. a. (2024). Hypertensive Erkrankungen in der Schwangerschaft (HES) – Diagnostik und Therapie. S2k-Leitlinie der DGGG, OEGGG und SGGG (AWMF-Registernummer 015/018). Retrieved from https://register.awmf.org/assets/guidelines/015-018l_S2k_Hypertensive-Erkrankungen-Schwangerschaft-HES-Diagnostik-Therapie_2024-07.pdf
40. Chen P, Wang S, Ji J, Ge A, Chen C, Zhu Y, et al. Risk factors and management of gestational diabetes. Cell Biochem Biophys. 2015 Mar;71(2):689–94. doi: https://doi.org/10.1007/s12013-014-0248-2
41. L M. (2024). Grundwissen SwissDRG und Glossar. Retrieved from https://www.sgaim.ch/fileadmin/user_upload/Blogartikel_01_Grundwissen_SwissDRG_Einleitung_und_Glossar_als_PDF.pdf
42. Tangkiatkumjai M, Boardman H, Walker DM. Potential factors that influence usage of complementary and alternative medicine worldwide: a systematic review. BMC Complement Med Ther. 2020 Nov;20(1):363. doi: https://doi.org/10.1186/s12906-020-03157-2
43. Klein SD, Torchetti L, Frei-Erb M, Wolf U. Usage of Complementary Medicine in Switzerland: Results of the Swiss Health Survey 2012 and Development Since 2007. PLoS One. 2015 Oct;10(10):e0141985. doi: https://doi.org/10.1371/journal.pone.0141985
44. Meier-Girard D, Lüthi E, Rodondi PY, Wolf U. Prevalence, specific and non-specific determinants of complementary medicine use in Switzerland: Data from the 2017 Swiss Health Survey. PLoS One. 2022 Sep;17(9):e0274334. doi: https://doi.org/10.1371/journal.pone.0274334
45. Bundesamt für Statistik [Federal Statistical Office]. (2025). Schweizerische Gesundheitsbefragung 2022 - Gesundheit und Geschlecht. Retrieved from www.statistik.ch
46. Martino HR, Koch U, Attinger-Andreoli Y, Michel K, Gassmann J, Berger S, et al. (2012). Arbeitspapier Entstigmatisierung: Grundlagen für eine nationale Kampagne zur Entstigmatisierung von psychischen Krankheiten und von Menschen mit Störungen der psychischen Gesundheit. Retrieved from https://public-health.ch/documents/232/Entstigmatisierung_Arbeitspapier_DEF.pdf
47. Marengoni A, Rizzuto D, Fratiglioni L, Antikainen R, Laatikainen T, Lehtisalo J, et al. The Effect of a 2-Year Intervention Consisting of Diet, Physical Exercise, Cognitive Training, and Monitoring of Vascular Risk on Chronic Morbidity-the FINGER Randomized Controlled Trial. J Am Med Dir Assoc. 2018 Apr;19(4):355–360.e1. doi: https://doi.org/10.1016/j.jamda.2017.09.020
48. (WHO) WHO. (2018). Noncommunicable diseases country profiles 2018. Retrieved from https://iris.who.int/handle/10665/274512
49. Stubert J, Reister F, Hartmann S, Janni W. The Risks Associated With Obesity in Pregnancy. Dtsch Arztebl Int. 2018 Apr;115(16):276–83. doi: https://doi.org/10.3238/arztebl.2018.0276
50. Agarwal P, Morriseau TS, Kereliuk SM, Doucette CA, Wicklow BA, Dolinsky VW. Maternal obesity, diabetes during pregnancy and epigenetic mechanisms that influence the developmental origins of cardiometabolic disease in the offspring. Crit Rev Clin Lab Sci. 2018 Mar;55(2):71–101. doi: https://doi.org/10.1080/10408363.2017.1422109
51. Catalano PM, Shankar K. Obesity and pregnancy: mechanisms of short term and long term adverse consequences for mother and child. BMJ. 2017 Feb;356:j1. doi: https://doi.org/10.1136/bmj.j1
52. Vandenbosch L, Fardouly J, Tiggemann M. Social media and body image: recent trends and future directions. Curr Opin Psychol. 2022 Jun;45:101289. doi: https://doi.org/10.1016/j.copsyc.2021.12.002
53. Revranche M, Biscond M, Husky MM. Lien entre usage des réseaux sociaux et image corporelle chez les adolescents : une revue systématique de la littérature [Investigating the relationship between social media use and body image among adolescents: A systematic review]. Encephale. 2022 Apr;48(2):206–18. doi: https://doi.org/10.1016/j.encep.2021.08.006
54. Leitzmann C. Vegetarian nutrition: past, present, future. Am J Clin Nutr. 2014 Jul;100 Suppl 1:496S–502S. doi: https://doi.org/10.3945/ajcn.113.071365
55. Welch N, McNaughton SA, Hunter W, Hume C, Crawford D. Is the perception of time pressure a barrier to healthy eating and physical activity among women? Public Health Nutr. 2009 Jul;12(7):888–95. doi: https://doi.org/10.1017/S1368980008003066
56. Willer HL, editor. (2015). The World of Organic Agriculture: Statistics and Emerging Trends 2015. Frick and Bonn: Research Institute of Organic Agriculture (FiBL) and IFOAM – Organics International.
57. Carey RM, Moran AE, Whelton PK. Treatment of Hypertension: A Review. JAMA. 2022 Nov;328(18):1849–61. doi: https://doi.org/10.1001/jama.2022.19590
58. Bundesärztekammer (BÄK) KBK, Arbeitsgemeinschaft der Wissenschaftlichen Medizini, (AWMF) sF. (2023). Nationale VersorgungsLeitlinie Hypertonie – Kurzfassung, Version 1.0 (AWMF-Register-Nr. nvl-009). Retrieved from www.leitlinien.de/hypertonie
59. Rosemann AR, Beise U, Huber F. (2020). Dyslipidämie. Retrieved from https://www.hausarztmedizin.uzh.ch/dam/jcr:2d09551e-e3a9-4c54-8f11-aa926f3bb3c8/IHAMZ-Guidelines_Dyslipid%C3%A4mie.pdf
60. Giani AS, Schönberger J. (2019). Guideline Hyperlipidämie im Kontext des kardiovaskulären Risikos von Erwachsenen bis zum 65. Lebensjahr. Retrieved from https://www.mednetbern.ch/publications/hyperlipidaemie-guideline.pdf
61. Hösli IA, Althof G, Brändle M, Hamza A, Honegger C, Jornayvaz F, et al. (2023). Screening und Management der Gestationsdiabetes Retrieved from https://www.sggg.ch/fileadmin/user_upload/Dokumente/3_Fachinformationen/1_Expertenbriefe/De/81_Screening_und_Management_der_Gestationsdiabetes_deutsch.pdf
62. Dłuski DF, Ruszała M, Rudziński G, Pożarowska K, Brzuszkiewicz K, Leszczyńska-Gorzelak B. Evolution of Gestational Diabetes Mellitus across Continents in 21st Century. Int J Environ Res Public Health. 2022 Nov;19(23):15804. doi: https://doi.org/10.3390/ijerph192315804
63. Sánchez-Sánchez E, Fernández-Cerezo FL, Díaz-Jimenez J, Rosety-Rodriguez M, Díaz AJ, Ordonez FJ, et al. Consumption of over-the-Counter Drugs: Prevalence and Type of Drugs. Int J Environ Res Public Health. 2021 May;18(11):5530. doi: https://doi.org/10.3390/ijerph18115530
64. Bäckryd E. Gender differences in dispensed analgesics in Sweden during 2006-2015 - an observational, nationwide, whole-population study. Int J Womens Health. 2018 Jan;10:55–64. doi: https://doi.org/10.2147/IJWH.S142052
65. Azami-Aghdash S, Mohseni M, Etemadi M, Royani S, Moosavi A, Nakhaee M. Prevalence and Cause of Self-Medication in Iran: A Systematic Review and Meta-Analysis Article. Iran J Public Health. 2015 Dec;44(12):1580–93.
66. Martella M, Minutiello E, Gianino MM. Patterns of Antidepressant and Anxiolytic Use and Spending in 14 European Countries (2012-2021): A Comprehensive Time Series Analysis. Health Serv Insights. 2024 Oct;17:11786329241282526. doi: https://doi.org/10.1177/11786329241282526
67. Bystritsky A, Khalsa SS, Cameron ME, Schiffman J. Current diagnosis and treatment of anxiety disorders. P&T. 2013 Jan;38(1):30–57.
68. Bandelow B, Werner AM, Kopp I, Rudolf S, Wiltink J, Beutel ME. The German Guidelines for the treatment of anxiety disorders: first revision. Eur Arch Psychiatry Clin Neurosci. 2022 Jun;272(4):571–82. doi: https://doi.org/10.1007/s00406-021-01324-1
69. Seifritz EH, Hemmeter UM, Bondolfi G, Preisig M, Rennhard S, Hatzinger M, et al. (2024). Die Behandlung der Angsterkrankungen: Panikstörung, Agoraphobie, generalisierte Angststörung, soziale Angststörung, spezifische Phobien. Retrieved from SGAD, SGPP, SGBP, SCAP, SGKJPP: https://www.psychiatrie.ch/fileadmin/SGPP/user_upload/Fachleute/Empfehlungen/240328_Behandlungsempfehlungen_DE.pdf
70. Hellström A, Gemzell Danielsson K, Kopp Kallner H. Trends in use and attitudes towards contraception in Sweden: results of a nationwide survey. Eur J Contracept Reprod Health Care. 2019 Apr;24(2):154–60. doi: https://doi.org/10.1080/13625187.2019.1581163
71. Fabunmi OA, Dludla PV, Nkambule BB. Investigating cardiovascular risk in premenopausal women on oral contraceptives: systematic review with meta-analysis. Front Cardiovasc Med. 2023 Apr;10:1127104. doi: https://doi.org/10.3389/fcvm.2023.1127104
72. Rosano GM, Rodriguez-Martinez MA, Spoletini I, Regidor PA. Obesity and contraceptive use: impact on cardiovascular risk. ESC Heart Fail. 2022 Dec;9(6):3761–7. doi: https://doi.org/10.1002/ehf2.14104
73. Hannaford P. Cardiovascular events associated with different combined oral contraceptives: a review of current data. Drug Saf. 2000 May;22(5):361–71. doi: https://doi.org/10.2165/00002018-200022050-00004
74. Highly effective copper IUD will hit U.S. market in 1988. Contracept Technol Update. 1987 Dec;8(12):149–52.
75. Lyus R, Lohr P, Prager S; Board of the Society of Family Planning. Use of the Mirena LNG-IUS and Paragard CuT380A intrauterine devices in nulliparous women. Contraception. 2010 May;81(5):367–71. doi: https://doi.org/10.1016/j.contraception.2010.01.010
76. Lohr PA, Lyus R, Prager S. Use of intrauterine devices in nulliparous women. Contraception. 2017 Jun;95(6):529–37. doi: https://doi.org/10.1016/j.contraception.2016.08.011
77. Committee Opinion No. Committee Opinion No. 642: Increasing Access to Contraceptive Implants and Intrauterine Devices to Reduce Unintended Pregnancy. Obstet Gynecol. 2015 Oct;126(4):e44–8. doi: https://doi.org/10.1097/AOG.0000000000001106
78. Bastow B, Sheeder J, Guiahi M, Teal S. Condom use in adolescents and young women following initiation of long- or short-acting contraceptive methods. Contraception. 2018 Jan;97(1):70–5. doi: https://doi.org/10.1016/j.contraception.2017.10.002
79. Evans WD, Ulasevich A, Hatheway M, Deperthes B. Systematic Review of Peer-Reviewed Literature on Global Condom Promotion Programs. Int J Environ Res Public Health. 2020 Mar;17(7):2262. doi: https://doi.org/10.3390/ijerph17072262
80. Algur E, Wang E, Friedman HS, Deperthes B. A Systematic Global Review of Condom Availability Programs in High Schools. J Adolesc Health. 2019 Mar;64(3):292–304. doi: https://doi.org/10.1016/j.jadohealth.2018.11.013
81. Bundesamt für Statistik [Federal Statistical Office]<. (2024). Schweizerische Gesundheitsbefragung - Alkoholkonsum von 1992 bis 2022. Retrieved from www.statistik.ch
82. Grant BF, Chou SP, Saha TD, Pickering RP, Kerridge BT, Ruan WJ, et al. Prevalence of 12-Month Alcohol Use, High-Risk Drinking, and DSM-IV Alcohol Use Disorder in the United States, 2001-2002 to 2012-2013: Results From the National Epidemiologic Survey on Alcohol and Related Conditions. JAMA Psychiatry. 2017 Sep;74(9):911–23. doi: https://doi.org/10.1001/jamapsychiatry.2017.2161
83. Mårdby AC, Lupattelli A, Hensing G, Nordeng H. Consumption of alcohol during pregnancy-A multinational European study. Women Birth. 2017 Aug;30(4):e207–13. doi: https://doi.org/10.1016/j.wombi.2017.01.003
84. Popova S, Lange S, Probst C, Gmel G, Rehm J. Global prevalence of alcohol use and binge drinking during pregnancy, and fetal alcohol spectrum disorder. Biochem Cell Biol. 2018 Apr;96(2):237–40. doi: https://doi.org/10.1139/bcb-2017-0077
85. Flak AL, Su S, Bertrand J, Denny CH, Kesmodel US, Cogswell ME. The association of mild, moderate, and binge prenatal alcohol exposure and child neuropsychological outcomes: a meta-analysis. Alcohol Clin Exp Res. 2014 Jan;38(1):214–26. doi: https://doi.org/10.1111/acer.12214
86. Hammer R, Rapp E. Women’s views and experiences of occasional alcohol consumption during pregnancy: A systematic review of qualitative studies and their recommendations. Midwifery. 2022 Aug;111:103357. doi: https://doi.org/10.1016/j.midw.2022.103357
87. Amos A, Haglund M. From social taboo to “torch of freedom”: the marketing of cigarettes to women. Tob Control. 2000 Mar;9(1):3–8. doi: https://doi.org/10.1136/tc.9.1.3
88. Carpenter CM, Wayne GF, Connolly GN. Designing cigarettes for women: new findings from the tobacco industry documents. Addiction. 2005 Jun;100(6):837–51. doi: https://doi.org/10.1111/j.1360-0443.2005.01072.x
89. Bundesamt für Statistik [Federal Statistical Office]. (2020). Schweizerische Gesundheitsbefragung 2017 - Gesundheit und Geschlecht [Swiss Health Survey 2017: health and gender]. Retrieved from https://www.bfs.admin.ch/bfs/en.assetdetail.15284969.html
90. Meienberg AM, Vischer A, et al. Smoking prevention in adolescents: a cross- sectional and qualitative evaluation of a newly implemented prevention program in Switzerland. BMJ Open. 2021;11(12):e048319. doi: https://doi.org/10.1136/bmjopen-2020-048319
91. S H. Swiss Smoking Prevention Policies. Network Management and Governance in Policy Implementation: The Case of Smoking Prevention Programs. Cham: Springer International Publishing; 2022.
92. Jandíková H, Dušková M, Stárka L. The influence of smoking and cessation on the human reproductive hormonal balance. Physiol Res. 2017 Sep;66 Suppl 3:S323–31. doi: https://doi.org/10.33549/physiolres.933724
93. Hamadneh S, Hamadneh J. Active and Passive Maternal Smoking During Pregnancy and Birth Outcomes: A Study From a Developing Country. Ann Glob Health. 2021 Dec;87(1):122. doi: https://doi.org/10.5334/aogh.3384
94. Lange S, Probst C, Rehm J, Popova S. National, regional, and global prevalence of smoking during pregnancy in the general population: a systematic review and meta-analysis. Lancet Glob Health. 2018 Jul;6(7):e769–76. doi: https://doi.org/10.1016/S2214-109X(18)30223-7
95. Vangeli E, Stapleton J, Smit ES, Borland R, West R. Predictors of attempts to stop smoking and their success in adult general population samples: a systematic review. Addiction. 2011 Dec;106(12):2110–21. doi: https://doi.org/10.1111/j.1360-0443.2011.03565.x
96. Health NCfCDPaHPUOoSa. E-Cigarette Use Among Youth and Young Adults: A Report of the Surgeon General. Atlanta (GA). US: Centers for Disease Control and Prevention; 2016.
97. Cannabis Regulation in Europe: Country Report Switzerland. Retrieved from https://www.tni.org
The supplementary file is available for download at https://doi.org/10.57187/5069.