DOI: https://doi.org/https://doi.org/10.57187/5052
Mortality is a fundamental indicator of a country’s general state of health and its evolution over time [1]. During the COVID-19 years, excess all-cause mortality rapidly became the gold standard for measuring the impact of the pandemic, being considered a more reliable and informative indicator than COVID-19-specific mortality itself [2]. Using overall mortality, an excess of 15 to 18 million deaths worldwide for the period 2020–21 has been estimated [3, 4], around three times the number of deaths officially attributed to COVID-19. The impact of the pandemic on overall mortality in Europe and the US has also been quantified in terms of life expectancy losses induced by excess mortality [5, 6], highlighting great variability between countries, with some Western European countries recovering their pre-pandemic life expectancy levels by 2021 (e.g. Switzerland and Sweden), other countries recovering the loss of the first pandemic year only partially by 2021 (e.g. Italy and the UK), and others cumulating a loss in 2020 and a further worsening in 2021, notably Eastern European countries and the US.
In more recent years, there is evidence of a general recovery to pre-pandemic mortality levels and trends in Europe. For example, the European mortality monitoring system EuroMOMO [7] stated that “By spring 2023, overall European mortality had returned to expected levels in all age groups”, where expected levels are estimated on the basis of pre-pandemic trends, and the Eurostat agency [8] pointed to an overall recovery of pre-pandemic life expectancy levels in Europe. However, the situation seems less optimistic in the US, where a recent study estimated for 2023 a significant excess mortality among young Americans aged 25 to 44 [9]. Also in Europe, some countries appear to have experienced less favourable mortality trends for certain age groups. In the UK, for example, an increase in all-cause mortality rates for middle-aged adults (30–54 years) has been observed since 2012 [10].
The impact of the COVID-19 pandemic on mortality in Switzerland was studied for the years 2020–22 [11–13] using standardised mortality rates to account for changes over time in the population size and age structure [14, 15]. An overall excess of about 7000 deaths was estimated for 2020. While the year 2021 was characterised by an approximate recovery to pre-pandemic levels in terms of life expectancy [6], the year 2022 was marked by a new worsening, mainly attributable to the summer heatwave that year, with nearly 2000 deaths in excess compared to 2019. This estimate is higher than the number of additional deaths recorded during the heatwaves of 2003 (approximately 1000) [16] and 2015 (approximately 800) [17], possibly due to a combination of the effects of a hot summer and the vulnerability associated with COVID-19, both phenomena mainly affecting people over the age of 75 [11, 18].
Mortality by cause of death is also an important piece of information when seeking to understand overall mortality trends. In Switzerland, cause-of-death statistics are one of the oldest federal statistics, dating back to 1876. Diagnoses are classified according to World Health Organization (WHO) ICD-10 codes [19], focusing on the underlying cause of death, i.e. “the disease or injury that initiated the train of morbid events leading directly to death, or the circumstances of the accident or violence which produced the fatal injury” [20]. There are a few studies that analyse mortality by cause in Switzerland. Two atlases of the leading causes of death have been produced, covering the period from 2008 to 2020 in 5-year increments and highlighting disparities between French-/Italian-speaking regions and German-speaking regions for several causes of death, such as cardiovascular disease, diabetes, cancer and COVID-19-related mortality [21, 22]. Mortality trends and their changes over time have also been studied for specific causes of death, ages and geographic areas, such as stroke among people aged 18–52 years [23], lung cancer [24] and cancer in the canton of Zürich [25]. An analysis of trends in the leading causes of death in the whole of Switzerland has been done [26], showing notably an accelerated reduction in traffic accident mortality in men from 2004, while not identifying trend changes for lung and breast cancer in women. The study only covered the period 1995–2006 and no analysis by age group was performed.
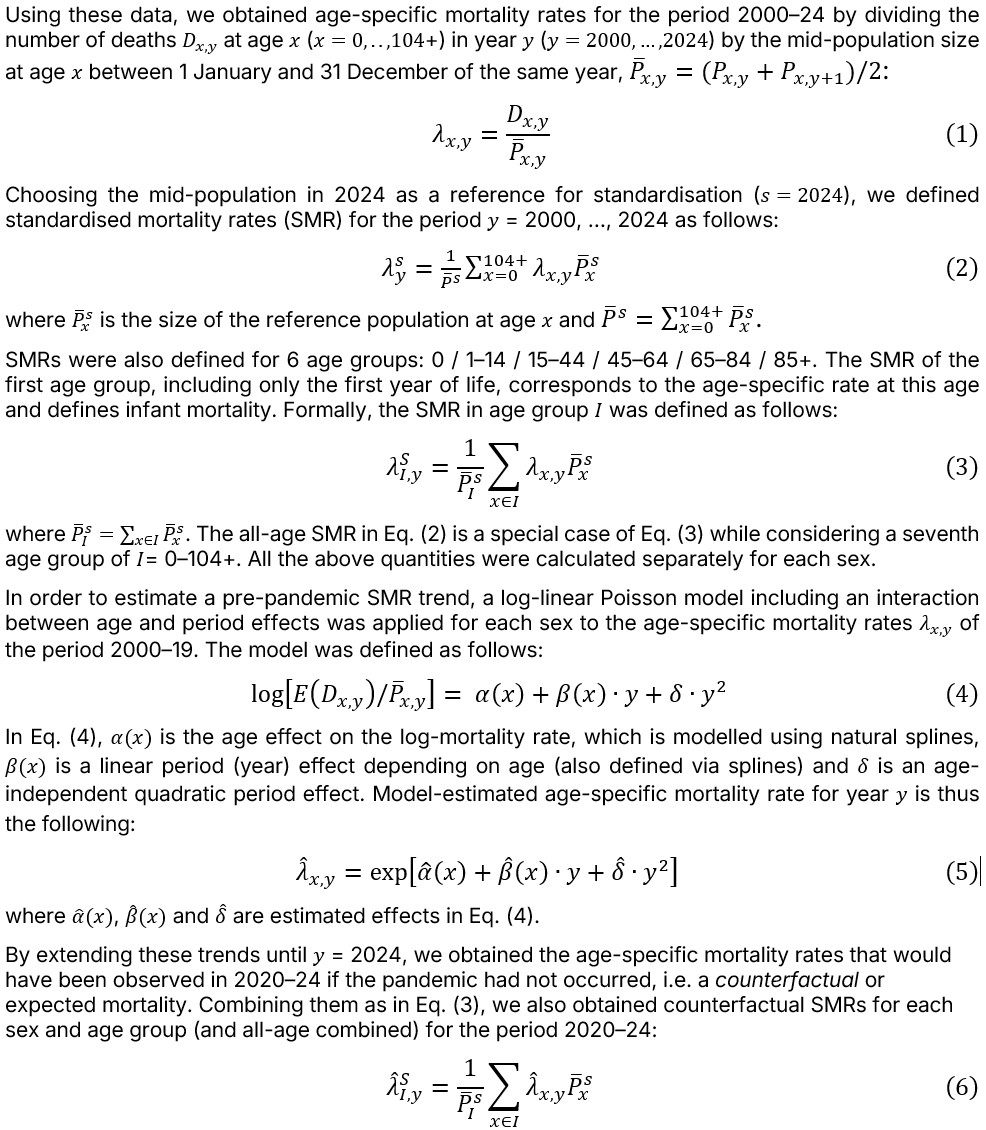
In the present study, we analysed standardised mortality rates for the post-pandemic years 2023–24 in Switzerland to determine whether pre-pandemic trends, estimated from modelling age-specific mortality over the previous 20 pre-pandemic years, have now been restored five years after the start of the pandemic. The same question was also examined by age group to see whether the overall trend is the one observed at each age or whether it results from a combination of heterogeneous trends across age groups. For a better understanding of trends in all-cause mortality, we also analysed official statistics of causes of death by age group to identify any trend changes in the leading causes that might explain overall mortality patterns at specific ages.
We considered data by the Swiss Federal Statistical Office (FSO), as reported by the Human Mortality Database [27], on annual numbers of deaths by age, in 1-year increments, and sex for the period 2000–24 and on the size of the Swiss population by age, in 1-year increments, and sex at 1 January of each year for the period 2000–25. Both population and deaths are available until the age of 110+, but to avoid years with empty populations at extreme ages, we considered 104+ as the last age group.
These SMRs were compared to the observed SMRs (3) to obtain an estimate of the absolute excess death (ED) and the % excess mortality (EM) for the years 2020–24, by age group and all-age combined. EDs (and EMs) were considered statistically significant for a given year if observed SMRs fell outside the limits of a 95% prediction interval (95% PI). Details about the method used to calculate the 95% PI around each predicted SMR (Eq. 6) can be found in appendix 1.
For each age group, we also analysed mortality by cause of death using data from the FSO (Causes spécifiques de décès [28]). They include the number of deaths and the standardised mortality rates (reference population: European population – WHO 1976 [29]) for the six available age groups (0 / 1–14 / 15–44 / 45–64 / 65–84 / 85+) and for each of the following causes of death: “infectious diseases”, “COVID-19”, “cancers”, “diabetes”, “dementia”, “cardiovascular diseases”, “respiratory diseases”, “cirrhosis”, “urinary organs”, “congenital anomalies”, “perinatal mortality”, “accidents and trauma”. We considered separately the two subcategories of “accidents and trauma” represented by “accidents all form” and “suicides”, which resulted in 13 different causes of death. For each age group, we plotted the four leading causes of death over the considered period 2000–24. Following a similar approach to that used in [25, 26], a Joinpoint model [30] was then applied to detect trend changes in leading causes of death in each age group. All analyses were performed within the software R [31]. The segmented package was used for the Joinpoint analysis [32].
Observed and expected SMRs per 1000 inhabitants over the period 2000–24 are presented in figures 1–3 separately for the two sexes, for all-age combined (figure 1) and for the six age groups 0 / 1–14 / 15–44 / 45–64 / 65–84 / 85+ (figures 2 and 3), while table 1 contains the corresponding estimates of ED (absolute numbers) and EM (%) for years 2020–24.
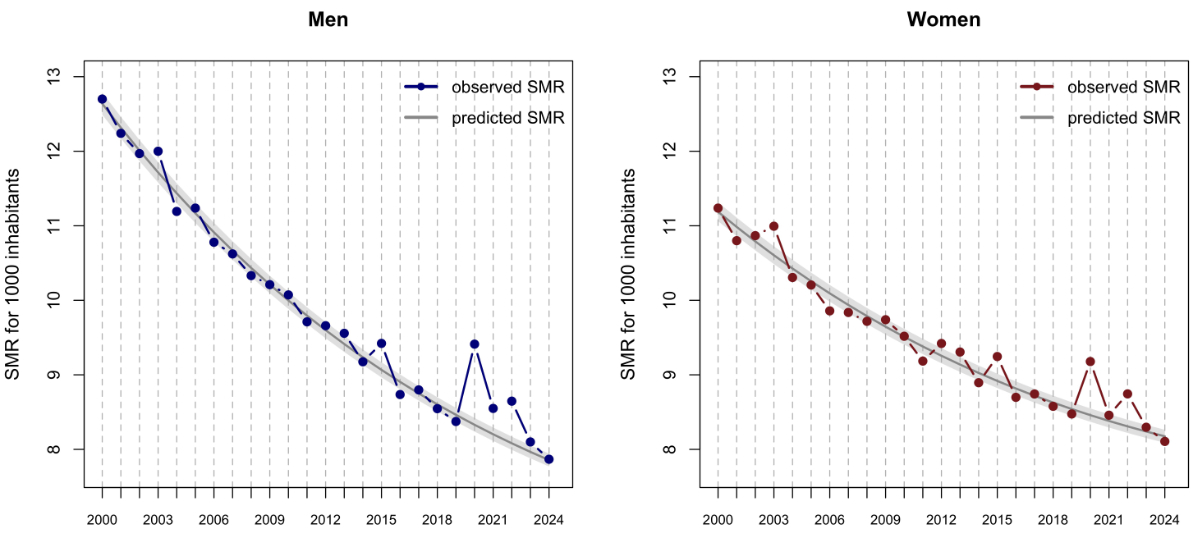
Figure 1Standardised mortality rates (SMR) per 1000 inhabitants in Switzerland by sex (FSO data), along with predicted SMRs via a log-linear Poisson model. Shadowed areas represent 95% prediction intervals around predictions.
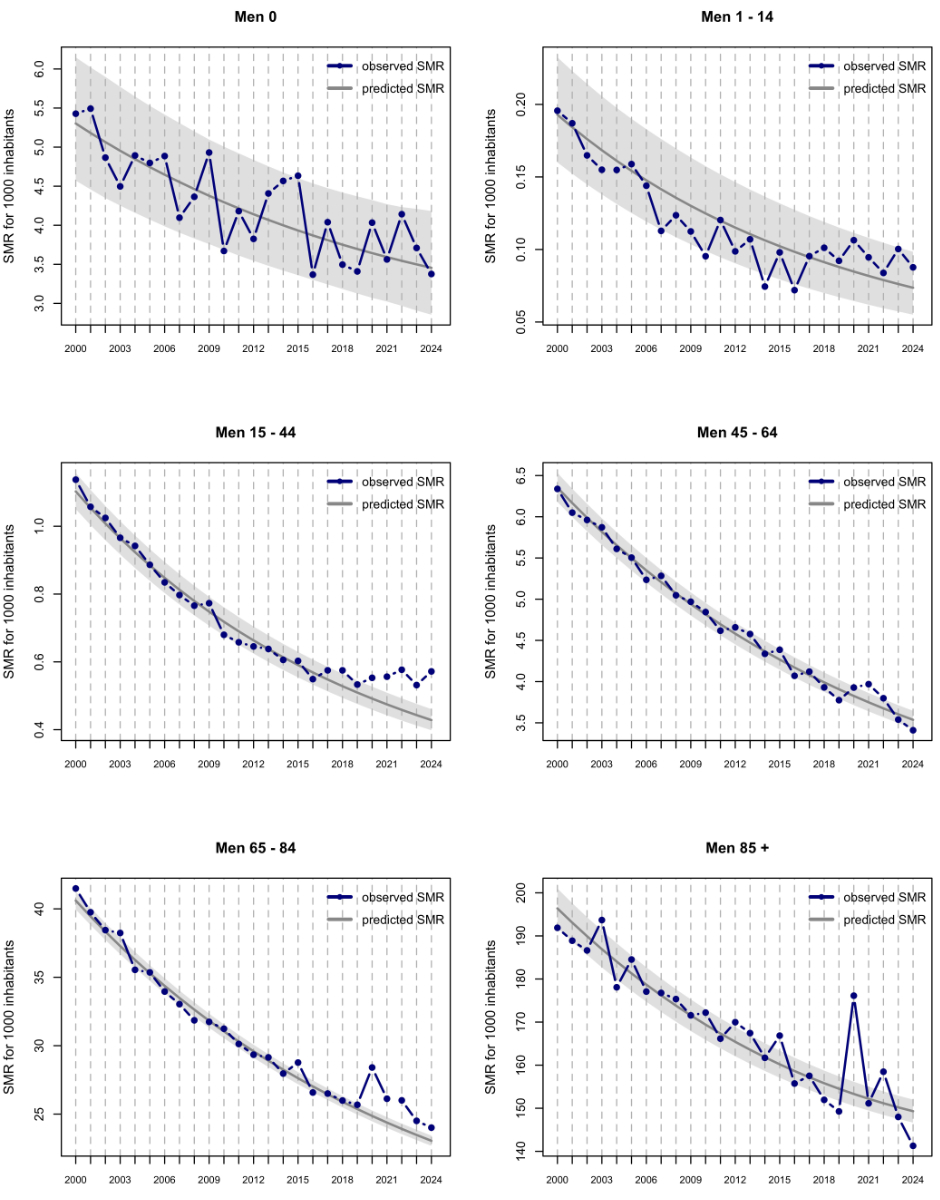
Figure 2Standardised mortality rates (SMR) per 1000 inhabitants in Switzerland by six age groups for men (FSO data), along with predicted SMRs via log-linear Poisson models. Shadowed areas represent 95% prediction intervals around predictions.
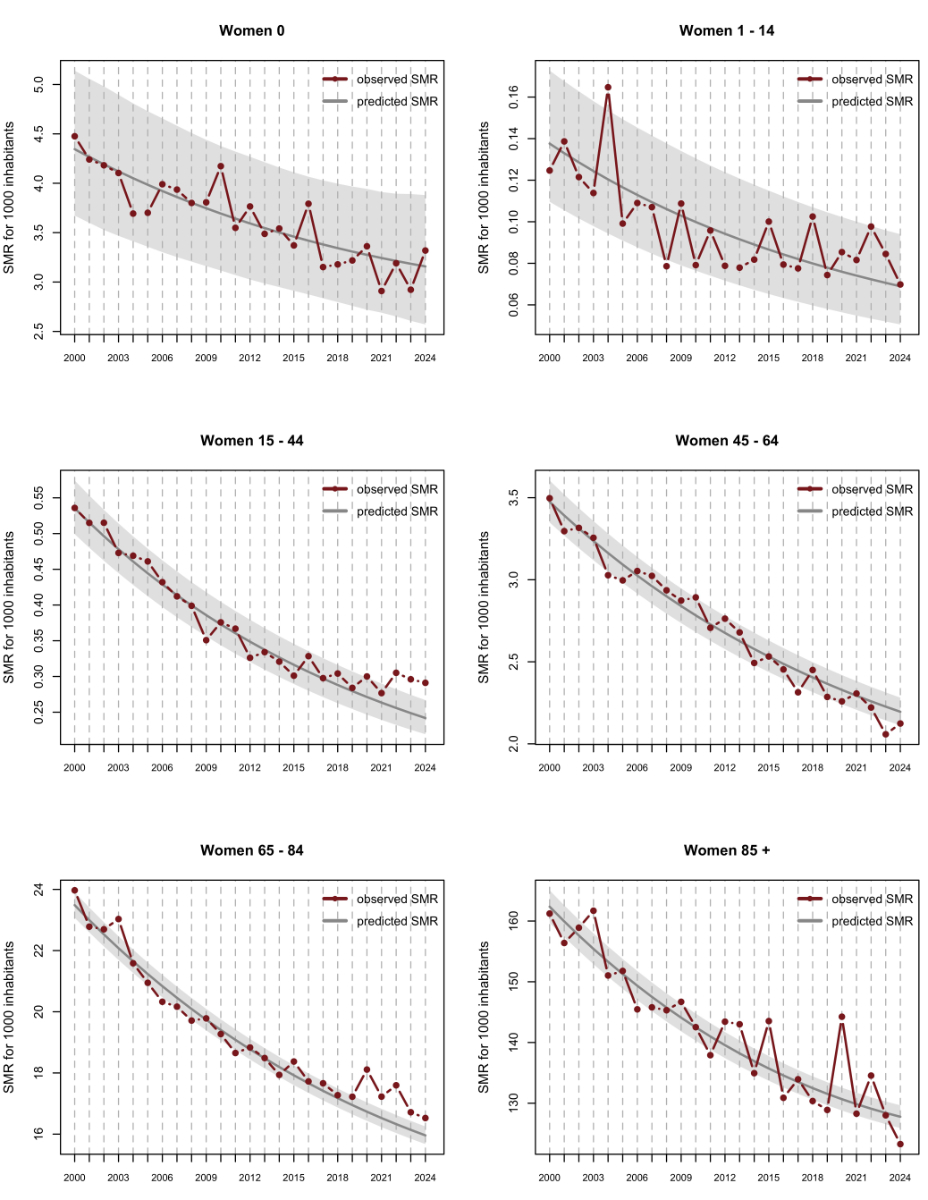
Figure 3Standardised mortality rates (SMR) per 1000 inhabitants in Switzerland by six age groups for women (FSO data), along with predicted SMRs via log-linear Poisson models. Shadowed areas represent 95% prediction intervals around predictions.
Table 1Excess death (ED, as absolute numbers) and excess mortality (EM, as %) for men and women, by six age groups and all-age combined between 2020 and 2024 in Switzerland (FSO data). Bolded values indicate significant deviations from expected mortality.
| 2020 | 2021 | 2022 | 2023 | 2024 | |||||||
| ED | EM | ED | EM | ED | EM | ED | EM | ED | EM | ||
| Men | Overall | 4844 | 13.0% | 1553 | 4.2% | 2532 | 7.0% | 598 | 1.7% | 50 | 0.1% |
| 0 | 15 | 10.3% | –1 | –0.7% | 24 | 17.0% | 8 | 5.8% | –3 | –2.2% | |
| 1–14 | 14 | 25.5% | 8 | 15.1% | 3 | 5.9% | 16 | 32.0% | 9 | 18.8% | |
| 15–44 | 108 | 12.5% | 143 | 17.2% | 207 | 25.8% | 155 | 20.0% | 252 | 33.6% | |
| 45–64 | 127 | 2.7% | 273 | 5.9% | 153 | 3.4% | –81 | –1.8% | –157 | –3.6% | |
| 65–84 | 2483 | 14.2% | 1221 | 7.1% | 1462 | 8.7% | 723 | 4.4% | 674 | 4.2% | |
| 85+ | 2053 | 14.9% | –96 | –0.7% | 659 | 4.8% | –199 | –1.5% | –724 | –5.4% | |
| Women | Overall | 3259 | 8.5% | 348 | 0.9% | 1975 | 5.2% | 259 | 0.7% | –312 | –0.8% |
| 0 | 3 | 2.4% | –13 | –10.7% | –1 | –0.8% | –10 | –8.3% | 6 | 5.0% | |
| 1–14 | 6 | 12.8% | 5 | 10.9% | 16 | 35.6% | 9 | 20.9% | 1 | 2.4% | |
| 15–44 | 48 | 10.5% | 22 | 5.0% | 83 | 19.3% | 80 | 19.1% | 83 | 20.4% | |
| 45–64 | –87 | –3.0% | 17 | 0.6% | –47 | –1.7% | –208 | –7.5% | –89 | –3.3% | |
| 65–84 | 1100 | 8.2% | 560 | 4.2% | 1013 | 7.8% | 460 | 3.6% | 452 | 3.5% | |
| 85+ | 2139 | 10.4% | –248 | –1.2% | 859 | 4.2% | –62 | –0.3% | –710 | –3.5% | |
Looking first at mortality all-age combined (figure 1), although men suffered a greater impact from the pandemic in 2020, SMR trends were largely the same for both sexes. After a relatively strong impact in 2020, with more than 8000 EDs (EM = 13.0% for men and EM = 8.5% for women), followed by a complete recovery in 2021 for women and a near-complete recovery for men, both sexes, but especially women, experienced a worsening in 2022, a year marked by the summer heatwave and marginally by a “final” COVID-19 tail stroke. On the other hand, the years 2023 and 2024 saw a complete return to the pre-pandemic trend, with ED (and EM) close to zero in 2024.
If we look at mortality trends by age group, we see marked differences (figures 2 and 3). The 85+ age group shows a quite similar pattern as the all-age mortality, except that the trend was fully recovered in 2021 and the worsening was similar in 2022 for both sexes. The trend was again recovered in 2023, and the observed mortality was even significantly lower than expected in 2024, with almost 1500 saved deaths across both sexes. Each age group under 85 shows a very specific mortality pattern, similar for both sexes, but more pronounced for men than for women. The 65–84 age group, after suffering a relatively sharp increase in mortality in 2020 (ED = 2483, EM = 14.2% for men; ED = 1100, EM = 8.2% for women), showed a slow and gradual recovery in the following years, which was not yet completed in 2024 (ED = 674, EM = 4.2% for men; ED = 452, EM = 3.5% for women). Mortality in the 45–64 age group was slightly affected in 2020–22 for men and unaffected for women, who never deviated from the trend during the pandemic. In contrast, the 15–44 age group experienced a mortality stabilisation, which began just before the start of the pandemic, and which resulted in significantly more deaths than expected in recent years (in 2024, ED = 252, EM = 33.6% for men; ED = 83, EM = 20.4% for women). Mortality in the age groups 0 and 1–14, although already low, did not significantly deviate from the declining trend, also in recent years.
The SMRs associated with the four main causes of death (along with COVID-19) for each sex and age group are shown graphically in appendix 2 for the period 2000–24, while the absolute numbers of deaths for each of the leading causes by sex and age group are given in table 2 for the year 2024. In absolute terms and all ages combined, cancer was the main cause of death for men in 2024 (27.6% of the 35,214 deaths that year), closely followed by cardiovascular mortality (26.7%). The leading cause for women was cardiovascular mortality (28.9% of the 36,728 deaths that year), followed by cancer mortality (22.3%). Dementia and respiratory diseases, the third and fourth leading causes, were substantially less prevalent in both sexes (table 2). Almost 15% of deaths were attributed to one of the other recorded causes (see Methods section), while nearly 20% causes of death were not reported. Looking at age groups, cancer was the main cause of death between the ages of 15 and 84 for women and between 45 and 85 for men, while cardiovascular mortality was the leading cause in those aged over 85 for both sexes. Accidents were the leading cause of death among women aged 1 to 14 and men aged 1 to 44. Infant mortality (259 deaths over the 78,453 newborns in 2024, which corresponds to 3.3 per 1000 newborns) was almost entirely attributable to perinatal mortality and congenital anomalies.
Table 2Distribution of absolute numbers of deaths by age group and the four leading causes of death in 2024 in Switzerland.
| Cause I | Cause II | Cause III | Cause IV | Other | Unknown | Total | ||
| Men | 0 | Perinatal | Congenital | – | – | 1 (0.7%) | 18 (13.4%) | 134 (100%) |
| 77 (57.5%) | 38 (28.4%) | |||||||
| 1–14 | Cancers | Accidents | Congenital | CVD | 10 (17.5%) | 12(21.1%) | 57 (100%) | |
| 14 (24.6%) | 12 (21.1%) | 7 (12.3%) | 2 (3.5%) | |||||
| 15–44 | Accidents | Suicides | Cancers | CVD | 86 (8.6%) | 260 (25.9%) | 1002 (100%) | |
| 222 (22.2%) | 219 (21.9%) | 132 (13.2%) | 83 (8.3%) | |||||
| 45–64 | Cancers | CVD | Suicides | Accidents | 549 (13.0%) | 958 (22.6%) | 4236 (100%) | |
| 1480 (34.9%) | 770 (18.2%) | 242 (5.7%) | 237 (5.6%) | |||||
| 65–84 | Cancers | CVD | Respiratory | Dementia | 1924 (11.4%) | 3075(18.3%) | 16,838 (100%) | |
| 5863 (34.8%) | 3936 (23.4%) | 1214 (7.2%) | 826 (4.9%) | |||||
| 85+ | CVD | Cancers | Dementia | Respiratory | 1757 (13.6%) | 2084 (16.1%) | 12,947 (100%) | |
| 4611 (35.6%) | 2239 (17.3%) | 1373 (10.6%) | 883 (6.8%) | |||||
| All ages | Cancers | CVD | Respiratory | Dementia | 5144 (14.6%) | 6407(18.2%) | 35,214 | |
| 9728 (27.6%) | 9403 (26.7%) | 2305 (6.5%) | 2227 (6.3%) | |||||
| Women | 0 | Perinatal | Congenital | CVD | – | 1 (0.8%) | 20 (16.0%) | 125 (100%) |
| 70 (56.0%) | 33 (26.4%) | 1 (0.8%) | ||||||
| 1–14 | Accidents | Cancers | Congenital | Infectious | 3 (7.0%) | 9 (20.9%) | 43 (100%) | |
| 12 (27.9%) | 11 (25.6%) | 5 (11.6%) | 3 (7.0%) | |||||
| 15–44 | Cancers | Suicides | Accidents | CVD | 40 (8.2%) | 134 (27.4%) | 489 (100%) | |
| 168 (34.4%) | 78 (16.0%) | 45 (9.2%) | 24 (4.9%) | |||||
| 45–64 | Cancers | CVD | Suicides | Respiratory | 280 (10.6%) | 531(20.2%) | 2632 (100%) | |
| 1367 (51.9%) | 230 (8.7%) | 108 (4.1%) | 116 (4.4%) | |||||
| 65–84 | Cancers | CVD | Dementia | Respiratory | 1340 (10.2%) | 2492 (18.9%) | 13,201 (100%) | |
| 4510 (34.2%) | 2798 (21.2%) | 1075 (8.1%) | 986 (75%) | |||||
| 85+ | CVD | Dementia | Cancers | Respiratory | 2401 (11.9%) | 3712 (18.3%) | 20,238 (100%) | |
| 7571 (37.4%) | 3282 (16.2%) | 2134 (10.5%) | 1147 (5.7%) | |||||
| All ages | CVD | Cancers | Dementia | Respiratory | 4376 (11.9%) | 6889 (18.8%) | 36,728 | |
| 10,626 (28.9%) | 8190 (22.3%) | 4389 (12.0%) | 2258 (6.1%) | |||||
CVD: cardiovascular disease.
Looking at SMRs for the leading causes of death since 2000 (appendix 2), we see that most causes continued to decline until recent years. The 15–44 age group is a notable exception, with a recent stagnation in mortality. Using Joinpoint models, we identified a significant change of trend in 2019 for accidents among men (p = 0.031) and even earlier (2013–2014) for suicides and both sexes (p = 0.005 for men and p = 0.001 for women), shifting from a significant decline before these years to an overall stabilisation afterwards (figure 4 and tables 3 and 4). No such stabilisation but a slowdown has been observed in other age groups, particularly in cardiovascular and respiratory mortality between 65 and 84 (tables 3 and 4). Cancer mortality has declined more steadily among men aged over 85 since 2014 (table 3) but has begun to rise among women of the same age since 2007 (table 4). The cause of death “dementia” was first introduced by the FSO in 1995 and increased over the following two decades among people over 65, and particularly over 85, before stabilising or even declining thereafter.
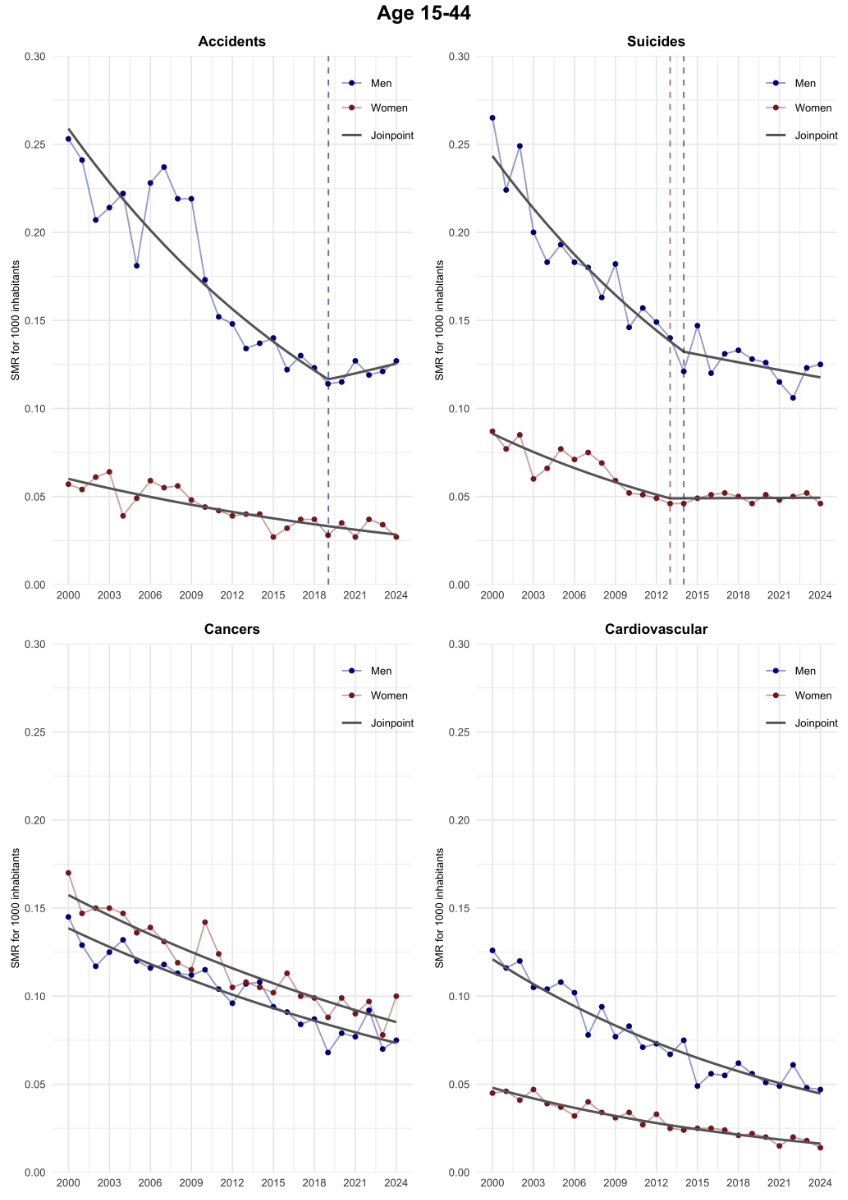
Figure 4Standardised mortality rates (SMR) per 1000 inhabitants in Switzerland for the four leading causes of death in the 15–44 age group (FSO data), along with trends estimated by Joinpoint regression models.
Table 3Summary of Joinpoint regression analyses for the leading causes of death by age group for men. Effects are expressed in annual percentage changes before (APC1) and after (APC2) the eventual changes in trends. Bolded values denote significant changes in trend.
| Age | Causes | APC1 [95% CI] | p-value | Year | APC2 [95% CI] |
| 0 | Perinatal | –1.05 [–1.60; –0.49] | 0.716 | ||
| Congenital | –1.11 [–2.25; 0.05] | 0.675 | |||
| 1–14 | Cancers | –3.62 [–5.31; –1.89] | 0.484 | ||
| Accidents | –5.51 [–6.96; –4.04] | 0.072 | |||
| Congenital | –4.33 [–6.92; –1.66] | 0.024 | 2019 | 15.0 [–1.72; 34.5] | |
| CVD | –0.67 [–4.03; 2.82] | 0.643 | |||
| 15–44 | Accidents | –4.11 [–4.89; –3.33] | 0.031 | 2019 | 1.51 [–5.01; 8.49] |
| Suicides | –4.26 [–5.24; –3.28] | 0.005 | 2014 | –1.16 [–2.61; 0.31] | |
| Cancers | –2.61 [–3.04; –2.18] | 0.580 | |||
| CVD | –4.06 [–4.62; –3.50] | 0.067 | |||
| 45–64 | Cancers | –1.88 [–2.82; –0.93] | 0.009 | 2007 | –3.07 [–3.29; –2.84] |
| CVD | –3.57 [–3.77; –3.37] | 0.150 | |||
| Suicides | –2.45 [–2.76; –2.14] | 0.622 | |||
| Accidents | –1.99 [–2.36; –1.63] | 0.794 | |||
| 65–84 | Cancers | –1.80 [–1.90; –1.70] | 0.766 | ||
| CVD | –4.47 [–4.69; –4.24] | <0.001 | 2016 | –2.80 [–3.36; –2.25] | |
| Respiratory | –4.00 [–5.12; –2.87] | 0.005 | 2011 | –1.26 [–2.28; –0.23] | |
| Dementia | 1.56 [0.79; 2.35] | 0.002 | 2013 | –0.72 [–1.58; 0.14] | |
| 85+ | CVD | –2.31 [–2.44; –2.18] | 0.685 | ||
| Cancers | –0.23 [–0.57; 0.12] | 0.020 | 2014 | –1.23 [–1.86; –0.60] | |
| Dementia | 4.81 [3.97; 5.67] | <0.001 | 2013 | –2.42 [–3.56; –1.28] | |
| Respiratory | –2.40 [–2.89; –1.91] | 0.633 |
APC: annual percentage change; CI: confidence interval; CVD: cardiovascular disease.
Table 4Summary of Joinpoint regression analyses for the leading causes of death by age group for women. Effects are expressed in annual percentage changes before (APC1) and after (APC2) the eventual changes in trends. Bolded values denote significant changes in trend.
| Age | Causes | APC1 [95% CI] | p-value | Year | APC2 [95% CI] |
| 0 | Congenital | –1.14 [–1.82; –0.45] | 0.436 | ||
| Perinatal | –1.24 [–1.92; –0.56] | 0.125 | |||
| 1–14 | Accidents | –3.27 [–5.26; –1.23] | 0.099 | ||
| Cancers | –0.71 [–2.75; 1.38] | 0.712 | |||
| Congenital | –1.35 [–3.57; 0.92] | 0.631 | |||
| Infectious | –3.27 [–6.06; –0.40] | 0.055 | |||
| 15–44 | Cancers | –2.52 [–2.94; –2.10] | 0.344 | ||
| Suicides | –4.22 [–5.39; –3.03] | 0.001 | 2013 | 0.07 [–1.69; 1.85] | |
| Accidents | –3.07 [–3.87; –2.27] | 0.582 | |||
| CVD | –4.40 [–4.93; –3.87] | 0.485 | |||
| 45–64 | Cancers | –2.17 [–2.35; –1.99] | 0.108 | ||
| CVD | –3.64 [–3.95; –3.33] | 0.545 | |||
| Suicides | –2.98 [–3.54; –2.41] | 0.241 | |||
| Respiratory | –0.88 [–1.56; –0.19] | 0.869 | |||
| 65–84 | Cancers | –0.46 [–0.68; –0.24] | 0.029 | 2016 | –1.18 [–1.70; –0.65] |
| CVD | –4.36 [–4.52; –4.19] | <0.001 | 2019 | –2.22 [–3.57; –0.86] | |
| Dementia | 2.96 [1.61; 4.34] | <0.001 | 2010 | –0.68 [–1.59; 0.24] | |
| Respiratory | –0.61 [–1.15; –0.08] | 0.053 | |||
| 85+ | CVD | –2.23 [–2.36; –2.09] | 0.194 | ||
| Dementia | 5.01 [4.23; 5.79] | <0.001 | 2013 | –1.12 [–1.95; –0.29] | |
| Cancers | –1.75 [–2.78; –0.72] | <0.001 | 2007 | 0.30 [0.05; 0.55] | |
| Respiratory | –1.63 [–2.34; –0.92] | 0.203 |
APC: annual percentage change; CI: confidence interval; CVD: cardiovascular disease.
Excess mortality related to the COVID-19 pandemic in Switzerland has been previously described [11–13]. The main question of the present study was whether this excess mortality has now been “resorbed” five years after the start of the pandemic. The same question was investigated for different age groups. Using data from the Swiss Federal Statistical Office (FSO), we were able to report a full recovery by 2024 of the pre-pandemic downward mortality trend for both sexes, but when examining the different age groups, we observed remarkably heterogeneous mortality patterns.
While people aged 85 and over, after a spike in mortality during the pandemic and the heatwave of summer 2022, have now returned to their pre-pandemic trend, with mortality even lower than expected, the same cannot be said for the 65–84 age group, whose mortality is still struggling to return to its downward trend in 2024. At present, it is not yet clear whether this phenomenon represents merely a further delay in recovery or a more structural change in the mortality trend in this age group. However, the most worrying results concern young adults aged 15 to 44. In this group, the long-standing downward trend in mortality appears to have been completely lost over the past decade, with mortality beginning to stagnate a few years before the pandemic. This result is consistent with what has been observed in the US and the UK, where a departure from previous downward trends has also been reported for young adults [9, 10].
To attempt to understand why mortality has returned to the downward trend for some age groups and deviated for others, we examined the official statistics on mortality by cause of death. As mentioned earlier, official FSO statistics focus on the “underlying” cause of death, i.e. the single cause that triggered the pathological process leading to death [20]. Despite the limitations of the official definition, which does not take into account multiple causes of deaths [33–35], examination of FSO statistics enabled us to gain a better understanding of recent mortality trends.
In the 15–44 age group, the reason for the unprecedented stagnation in mortality cannot be directly attributed to COVID-19, as this age group was virtually unaffected by the pandemic. Also, it cannot be considered an indirect consequence of the pandemic or its management, since it had already begun a few years before, between 2013 and 2019. Finally, and importantly, this change of trend is not due to the increase in some causes of death during this period, but to a stagnation in some major causes of death in this age group, namely accidents and suicides, contrary to cancer, which keeps on declining. In the 65–84 age group, the resorption of the COVID-19 mortality by 2024 was offset by a slowdown in other causes of death, such as cardiovascular and respiratory diseases. This prevented, for the time being, a complete recovery to pre-pandemic trends. Concerning the 85+ age group, whose mortality is by now even below the trend, some diverging trajectories in specific causes of death were observed. While cardiovascular mortality continues to follow a steady downward trend, cancer mortality has accelerated its decline among men, while it began to increase in the late 2000s among women, likely reflecting the increase in lung mortality among women (but not men) in Switzerland [24]. The upward trend followed by a stabilisation or even decline in mortality due to dementia is not easy to interpret as a “true” mortality pattern, as dementia was only introduced as a new cause of death in 1995. Furthermore, the sudden appearance and the increasing importance of this cause of death certainly explains in part the decline in other causes. The inherent complexity of determining the underlying cause of death and, consequently, of examining trends in cause-specific mortality, is also highlighted by the fact that nearly one-fifth of causes of death were not reported in 2024. All these considerations confirm that an analysis of all-cause mortality remains a priority, as it is free of subjectivity and less prone to uncertainty due to the larger numbers involved. This is why all-cause mortality remains the main focus of our study.
Recently, a question was raised as to whether mortality during the COVID-19 pandemic should be compared with previous levels (e.g. the year 2019) or with previous trends in order to estimate excess mortality [13]. Given that pre-pandemic trends were downward, a comparison with mortality trends will result in more “pessimistic” estimates of excess mortality than a comparison with mortality levels. Despite the speculative aspects inherent in a comparison with previous trends, which might be strongly model-dependent [36], as opposed to the entirely factual nature of a comparison with previous levels, five years after the onset of the pandemic, we have opted here for the second approach. However, the stagnation of mortality in some age groups suggests that it might be important to re-estimate some trends using more recent data.
As major demographic studies have pointed out, mortality rates have been falling in developed countries since the mid-1800s [37, 38]. For several decades, most of the progress in mortality, and the consequent increase in life expectancy, was due to improvements in mortality among children and young people. Since the middle of the last century, improvements among people over 60, and then over 80, have begun to contribute significantly to progress in life expectancy [39], leading to very optimistic claims about the prospect of unlimited human lifespans [40]. The present study shows for Switzerland what has already been shown for other countries such as the US and the UK: if mortality among the oldest people continues to fall, mainly due to downward trends in cardiovascular mortality [41], progress slows or even halts at younger ages, where all-cause and cause-specific mortality seem to have reached some kind of minimum. This finding should be taken into account when considering appropriate preventive measures. If it is confirmed over the next few years, it will also need to be incorporated into forecasts of future mortality and life expectancy, one important piece of information for the FSO’s demographic scenarios. Realistic life expectancy and population scenarios are themselves essential for decision-making in the areas of insurance, retirement plans and healthcare cost management.
All data are publicly available and can be accessed on the websites mentioned in the Materials and Methods section.
Funding: Swiss National Science Foundation (SNSF) Grant 10002701 “Projecting life expectancies for real populations”.
All authors have completed and submitted the International Committee of Medical Journal Editors form for disclosure of potential conflicts of interest. No potential conflict of interest related to the content of this manuscript was disclosed.
1. Choi J, Ki M, Kwon HJ, Park B, Bae S, Oh CM, et al. Health Indicators Related to Disease, Death, and Reproduction. J Prev Med Public Health. 2019 Jan;52(1):14–20.
2. Beaney T, Clarke JM, Jain V, Golestaneh AK, Lyons G, Salman D, et al. Excess mortality: the gold standard in measuring the impact of COVID-19 worldwide? J R Soc Med. 2020 Sep;113(9):329–34.
3 COVID-19 Excess Mortality Collaborators. Estimating excess mortality due to the COVID-19 pandemic: a systematic analysis of COVID-19-related mortality, 2020–21 (2022). Lancet 16: 399(10334):1513–1536. https://doi.org/
4. Msemburi W, Karlinsky A, Knutson V, Aleshin-Guendel S, Chatterji S, Wakefield J. The WHO estimates of excess mortality associated with the COVID-19 pandemic. Nature. 2023 Jan;613(7942):130–7.
5. Aburto JM, Schöley J, Kashnitsky I, Zhang L, Rahal C, Missov TI, et al. Quantifying impacts of the COVID-19 pandemic through life-expectancy losses: a population-level study of 29 countries. Int J Epidemiol. 2022 Feb;51(1):63–74.
6. Schöley J, Aburto JM, Kashnitsky I, Kniffka MS, Zhang L, Jaadla H, et al. Life expectancy changes since COVID-19. Nat Hum Behav. 2022 Dec;6(12):1649–59.
7. EuroMOMO. Internet : https://www.euromomo.eu/
8. eurostat. Mortality and life expectancy statistics. Internet: https://ec.europa.eu/eurostat/statistics-explained/index.php?title=Mortality_and_life_expectancy_statistics
9. Wrigley-Field E, Raquib RV, Berry KM, Morris KJ, Stokes AC. Mortality Trends Among Early Adults in the United States, 1999-2023. JAMA Netw Open. 2025 Jan;8(1):e2457538.
10. Pérez-Reche FJ. (2024). Age-specific all-cause mortality trends in the UK: Pre-pandemic increases and the complex impact of COVID-19, Public Health, 236, ISSN 0033-3506, https://doi.org/
11. Locatelli I, Rousson V. A first analysis of excess mortality in Switzerland in 2020. PLoS One. 2021 Jun;16(6):e0253505.
12. Locatelli I, Rousson V. Mortality in Switzerland in 2021. PLoS One. 2022 Sep;17(9):e0274295.
13. Locatelli I, Rousson V. Two complementary approaches to estimate an excess of mortality: the case of Switzerland 2022. PLoS One. 2023 Aug;18(8):e0290160. doi: https://doi.org/10.1371/journal.pone.0290160
14. Neison F. On a method recently proposed for conducting inquiries into the comparative sanatory condition of various districts [now the Royal Statistical Society]. J Stat Soc Lond. 1844;7(1):40–68. doi: https://doi.org/10.2307/2337745
15 Fleiss JL, Levin B, Cho PaikM (2003). Statistical methods for rates and proportions. Wiley Series in Probability and Statistics Eds
16. Grize L, Huss A, Thommen O, Schindler C, Braun-Fahrländer C. Heat wave 2003 and mortality in Switzerland. Swiss Med Wkly. 2005 Apr;135(13-14):200–5.
17. Vicedo-Cabrera AM, Ragettli MS, Schindler C, Röösli M. Excess mortality during the warm summer of 2015 in Switzerland. Swiss Med Wkly. 2016;146(4950):w14379. doi: https://doi.org/10.4414/smw.2016.14379
18. Ragettli MS, Flückiger B, Vienneau D, Domingo-Irigoyen S, Koschenz M, Röösli M. Vulnerability to heat-related mortality and the effect of prevention measures: a time-stratified case-crossover study in Switzerland. Swiss Med Wkly. 2024 Oct;154(10):3410. doi: https://doi.org/10.57187/s.3418
19. EDITORIAL. ICD-10: there’s a code for that. Lancet. 2015 Oct;386(10002):1420. doi: https://doi.org/10.1016/S0140-6736(15)00453-5
20. World Health Organization WHO. Geneva (1977). Manual of the International Statistical Classification of Diseases, Injuries, and Causes of Death. Vol. 1
21. Chammartin F, Probst-Hensch N, Utzinger J, Vounatsou P. Mortality atlas of the main causes of death in Switzerland, 2008-2012. Swiss Med Wkly. 2016 Feb;146(708):w14280. doi: https://doi.org/10.4414/smw.2016.14280
22. Sunghal T, Widmer K, Beloconi A, Dhaini S, Schwenkglenks M, Blohm C, et al. Mortality atlas of the main causes of death for the elderly population (≥75 years) in Switzerland during 2010–2020. Swiss Med Wkly. 2025;155(5):3433. doi: https://doi.org/10.57187/s.3433
23. Arslani K, Tontsch J, Todorov A, Gysi B, Kaufmann M, Kaufmann F, et al.; Swiss Society of Intensive Care Medicine. Temporal trends in mortality and provision of intensive care in younger women and men with acute myocardial infarction or stroke. Crit Care. 2023 Jan;27(1):14. doi: https://doi.org/10.1186/s13054-022-04299-0
24. Frisone D, Sandoval J, Friedlaender A, Olivier T, Addeo A. Trends in incidence and mortality of lung cancer in Switzerland: possible explanations and open questions. Cancer Epidemiol. 2022 Oct;80:102232. doi: https://doi.org/10.1016/j.canep.2022.102232
25. Wanner M, Matthes KL, Karavasiloglou N, Limam M, Korol D, Rohrmann S. 37-year incidence and mortality time trends of common cancer types by sex, age, and stage in the canton of Zurich. Swiss Med Wkly. 2020 Dec;150(5153):w20388. doi: https://doi.org/10.4414/smw.2020.20388
26. Savidan A, Junker C, Cerny T, Ess S. Premature deaths in Switzerland from 1995-2006: causes and trends. Swiss Med Wkly. 2010 Aug;140(3334):w13077. doi: https://doi.org/10.4414/smw.2010.13077
27. Human Mortality Database. Internet: https://www.mortality.org/
28. Swiss Federal Statistical Office. Specific causes of death. Internet: https://www.bfs.admin.ch/bfs/en/home/statistics/health/state-health/mortality-causes-death/specific.html
29. Revision of the European Standard Population - Report of Eurostat's task force - 2013 edition. doi:
30. Muggeo VM. Estimating regression models with unknown break-points. Stat Med. 2003 Oct;22(19):3055–71. doi: https://doi.org/10.1002/sim.1545
31. R Core Team. R: A Language and Environment for Statistical Computing. Vienna, Austria: R Foundation for Statistical Computing; 2024.
32. Muggeo VM. Segmented: An R Package to Fit Regression Models with Broken-Line Relationships. R News. 2008;8:20–5.
33. Israel RA, Rosenberg HM, Curtin LR. Analytical potential for multiple cause-of-death data. Am J Epidemiol. 1986 Aug;124(2):161–79. doi: https://doi.org/10.1093/oxfordjournals.aje.a114375
34. Lindahl BI, Johansson LA. Multiple cause-of-death data as a tool for detecting artificial trends in the underlying cause statistics: a methodological study. Scand J Soc Med. 1994 Jun;22(2):145–58. doi: https://doi.org/10.1177/140349489402200211
35. Durán N D, Kaufman JS, Chiolero A, Carmeli C. Multiple causes of death data to track trends of mortality from chronic diseases: insights from the COVID-19 pandemic in Switzerland. Ann Epidemiol. 2026 Jan;113:23–9. doi: https://doi.org/10.1016/j.annepidem.2025.12.002
36. Ferenci T. (2023). Comparing methods to predict baseline mortality for excess mortality calculations–unravelling ‘the German puzzle’ and its implications for spline-regression. MedRxiv https://doi.org/
37. Christensen K, Doblhammer G, Rau R, Vaupel JW. Ageing populations: the challenges ahead. Lancet. 2009 Oct;374(9696):1196–208.
38. Oeppen J, Vaupel JW. Demography. Broken limits to life expectancy. Science. 2002 May;296(5570):1029–31.
39. Vallin J, Meslé F. The segmented trend line of highest life expectancies. Popul Dev Rev. 2009;35(1):35. doi: https://doi.org/10.1111/j.1728-4457.2009.00264.x
40. Vaupel JW. Biodemography of human ageing. Nature. 2010 Mar;464(7288):536–42.
41. Beltrán-Sánchez H, Preston SH, Canudas-Romo V. An integrated approach to cause-of-death analysis: cause-deleted life tables and decompositions of life expectancy. Demogr Res. 2008 Jul;19:1323–50.
The appendix is available in the pdf version of the article at https://doi.org/10.57187/5052.