Age-based medical screening of drivers in Switzerland: an ecological study comparing accident rates with Austria and Germany
DOI: https://doi.org/https://doi.org/10.57187/smw.2022.40005
Patrizia
Hertacha, Karin
Huwilera, Eva
Aigner-Breussb, Tina
Gehlertc, Kristina
Gasterc, Hardy
Holted, Leon
Straβgütld, Steffen
Niemanna
aSwiss Council for Accident Prevention (BFU), Bern, Switzerland
bAustrian Road Safety Board (KFV), Vienna, Austria
cGerman Insurers Accident Research (UDV), Berlin, Germany
dFederal Highway Research Institute, Bergisch Gladbach, Germany
Summary
BACKGROUND: In Switzerland, as in various other countries throughout the world, elderly drivers have to pass a medical screening assessment every two years to keep their driver’s licence. The scientific literature shows no clear evidence that these policies improve road safety. This study evaluated the effects of the Swiss screening policy by comparing the accident and injury rates of elderly road users in Switzerland with those in Austria and Germany, two neighbouring countries without systematic age-based screening policies. The aims of this study were to examine if the screening policy is associated with a reduced risk of elderly car drivers causing serious accidents (research question 1) or with an increased risk of elderly pedestrians or (e-)cyclists being seriously or fatally injured (research question 2).
METHODS: In all three countries, data on accidents were taken from official statistics based on police reports and mileage data from national mobility surveys. An accident was defined as serious if at least one person is seriously or fatally injured in it. Accident and injury rates were calculated using distances driven and population size as measurement of exposure. Multiple Poisson regression models were used to examine the association between the Swiss policy and the accident or injury risk of elderly persons.
RESULTS: We found no association between the screening policy for elderly drivers in Switzerland and their risk of causing a serious accident (incidence rate ratio [IRR] 1.24, 95% confidence interval [CI] 0.79–1.94). Contrary to other studies, however, the Swiss policy was not associated with an increased risk of elderly pedestrians (IRR 1.16, 95% CI 0.80–1.68) and (e-)cyclists (IRR 0.79, 95% CI 0.56–1.12) being seriously or fatally injured.
CONCLUSIONS: The intended positive effect of the Swiss screening policy on accident rates of elderly drivers could not be demonstrated in this study. These findings serve as a basis for discussion on how to proceed with the policy in the future.
Introduction
With increasing age, drivers may experience difficulties when driving a motor vehicle due to limitations in cognitive, sensory and motor skills, but also due to the higher prevalence of many diseases in elderly people and associated drug therapies [1]. For this reason, in many countries, various screening policies for elderly drivers have been introduced [1, 2]. The aim of such policies is to maintain and improve traffic safety, for example by revoking the driver's licenses of individuals who are no longer fit to drive. The measures vary widely between countries or states. Examples of such measures are in-person licence renewals or comprehensive medical examinations.
Most reviews and individual studies looking into the effects of age-based screening procedures have failed to provide clear evidence of a benefit for the safety of elderly drivers [e.g., 2–7]. On the contrary, there are some studies that found negative safety effects for elderly road users [8–10]. A possible explanation is that the screening process might have led to a modal shift among some older persons from being car drivers to being unprotected road users (e. g., pedestrians, cyclists). These unprotected modes of transport are, however, significantly less safe for them [2]. Even though several studies have investigated the effects of such age-based screening procedures, drawing general conclusions on this subject is in our view only possible to a limited extent. The screening procedures applied and the contextual factors they are embedded in are heterogeneous, thus limiting the comparability of these studies.
In Switzerland, elderly drivers must undergo a mandatory medical examination every two years to keep their driver's licence. This measure was introduced in the 1970s. Until 1 January 2019, the age limit was 70 years, since then it has been 75 years. In these examinations, approved physicians assess whether the person still meets the minimum medical requirements for driver's licence holders (e.g., regarding vision). If the requirements are no longer met, the driver's licence is usually revoked. Based on the registers of driver’s licence holders and of administrative measures (ADMAS), only a small proportion of driver’s licence holders have their licence revoked due to reduced fitness to drive [11] The effects of the Swiss system on traffic safety have been evaluated in a previous study, comparing Swiss accident rates with those in Germany, where elderly drivers are not systematically screened [12]. Due to the use of non-comparable mileage data for the two countries [13], however, the results of this study are of limited value.
The aim of the present study was to analyse whether there is an association between the screening policy for elderly driver's licence holders in Switzerland and their distance-related risk of causing serious accidents as car drivers (research question 1). Furthermore, we investigated if the screening policy is associated with the population-related risk of serious or fatal injuries among elderly pedestrians and (e-)cyclists (research question 2). To address these two research questions, accident and injury rates in Switzerland were compared with those in Austria and Germany, two neighbouring countries without systematic age-based screening policies.
Materials and methods
Data sources and definitions
Table 1 provides an overview of the data sources and definitions used for the current analysis. In all three countries, accident data were taken from official statistics based on police reports, and mileage data were taken from national mobility surveys. While the definitions of traffic fatalities are identical in the three countries, those of serious injuries differ somewhat. In Switzerland and Germany, a person is seriously injured if she or he is hospitalised for at least 24 hours. In Austria, an injury is considered serious if it causes a health problem or occupation disability longer than 24 days, or if it "causes personal difficulty" (table 1).
Table 1Data sources and definitions in the three countries.
|
|
Switzerland
|
Austria
|
Germany
|
|
Data sources for:
|
| Accidents (years included) |
Federal Roads Office FEDRO (2014-2016) |
Statistics Austria (2013-2015) |
Federal Statistical Office (2016-2018) |
| Mileage (sample size)1
|
Mobility and transport microcensus 2015 (n = 57,090 persons) [33] |
Österreich unterwegs 2013/2014 (n = 17,070 households; 38,220 persons) [34] |
Mobility in Germany 2017 (n = 156,420 households; 316,361 persons) [35] |
|
Definitions of:
|
| Serious injury |
Up to 2014: Hospitalised for ≥24 hours or preventing the person from doing his/her daily activity for 24 hours. Since 2015: Hospitalised for ≥24 hours. Severity scale was linked to NACA2 scores used by Swiss emergency services.3
|
An injury that causes a health problem or occupation disability longer than 24 days, or one that "causes personal difficulty". |
Hospitalised for ≥24 hours. |
| Traffic fatality |
Person killed immediately or dying within 30 days because of a traffic accident |
Statistical methods
To address the two research questions, we calculated the accident rates of car drivers (research question 1) and injury rates of pedestrians and (e-)cyclists (research question 2) for 15 age groups (table 2) in each country and used them as dependent variables in regression models. The rates of the younger age groups were included to take into account general differences in accident and injury levels between the countries (e.g., resulting from different speed limits). "(E-)cyclists" are riders of conventional bicycles and of e-bikes with a pedal support up to 25 km/h. The latter are also called pedelecs in Austria and Germany.
Calculation of accident and injury rates
Accident/injury data: years included: The years from which the accident and injury numbers were taken for the present study were determined by the period in which the most recent mobility survey was conducted in each country (see table 1). We used the average accident and injury numbers of three consecutive years, with the middle year approximately corresponding to the period in which the mobility survey was conducted. This was done to compensate for yearly random variation in the number of accidents.
Serious accidents caused by car drivers (research question 1): We calculated per-distance accident rates for each age group of car drivers i and country j. Only serious accidents were included, i.e., accidents in which at least one person was seriously or fatally injured (table 1). Moreover, only accidents in which the car causing the accident had a domestic licence plate were considered. This was done to mainly include drivers who are subject to the system (age-based screening or not) in the country where the accident took place. The rates were calculated using the following formula:
Accident rateij = [number of serious accidents (3 year average)]ij / [mean daily mileage (km), extrapolated to population size (3 year average) × 365]ij × 100,000,000
In Austria and Switzerland, the denominator was calculated by multiplying the mean daily mileage reported by the participants of the mobility survey with the population size in the respective age group. In Germany, an extrapolation factor was used to calculate the absolute values extrapolated to the total population. This extrapolation factor consisted of a weighting factor (to compensate for different selection probabilities in sampling as well as to equalise the distribution of relevant characteristics with that of the total population) multiplied by a factor to get from the number of cases in the sample to the number of cases in the population.
Seriously or fatally injured pedestrians and (e-)cyclists (research question 2): Rates of seriously and fatally injured pedestrians and (e-)cyclists per 100,000 inhabitants were calculated. We used per-population instead of per-distance rates. This was done because a potential modal shift from driving to these unprotected modes of transport due to the screening policy would lead to an increase in the distances travelled as pedestrians and (e-)cyclists, resulting in more injuries in relation to the population size. For pedestrians and (e-)cyclists, the following formula was used for each age group i and country j:
Injury rateij = [number of seriously or fatally injured persons (3 year average)]ij / [population size (3 year average)]ij × 100,000
Regression analyses
Using Poisson regression models, we examined the association between the Swiss screening policy and the accident or injury risk of elderly persons. We also tested negative binomial models, which are more flexible in terms of the distribution of the outcome variable. Since in those models a Poisson distribution was assumed, the results were virtually the same. Therefore, we decided to proceed with the less complex Poisson models. Regarding research question 1, two dependent variables were used: firstly, serious accidents caused by a car driver (analysis 1) and secondly, serious accidents in which the car driver causing the accident was seriously or fatally injured (analysis 1a), both per distance driven. The latter subgroup was chosen because of the high comparability between the countries: A car driver is always present in those accidents, whereas injuries of car passengers or collision opponents depend on their presence and on their age (higher frailty at higher age [14]). The dependent variables used to address research question 2 were the per-population rates of seriously or fatally injured pedestrians (analysis 2) and (e-)cyclists (analysis 3).
In all regression models, we included the following independent variables: driver age group (see table 2), country (Switzerland, Austria, Germany), and age-based screening policy. The latter variable represents the variable of interest in this study, coded as "yes" for the age groups above 70 years in Switzerland, and coded as "no" for the younger age groups in Switzerland and all age groups in Austria and Germany. The incidence rate ratios (IRRs) obtained for this variable therefore indicate whether the accident or injury risk differs for elderly persons in Switzerland compared to those in Austria and Germany.
Model selection
For each dependent variable, a basic regression model including the independent variables listed in the previous paragraph was calculated. Due to the nonlinear relationship between age group and accident or injury rate, the basic model (model 1) included an additional quadratic age term (age group^2). Using the Akaike information criterion (AIC), we tested for each regression model whether it significantly improved with an additional cubic (age group^3; model 2) and biquadratic age term (age group^4; model 3).
Regarding analyses 1 and 1a (research question 1), two more independent variables were tested in the regression model: the proportion of drivers with a low mileage (model 4), and the proportion of distance driven by men (model 5), both per age group and country. The proportion of drivers with a low mileage was included because of the so-called "low-mileage bias", corresponding to an increased accident risk of occasional drivers compared to frequent drivers. The cut-off between low and high mileage was set at an annual mileage of 3000 km, as in other studies [15–19]. The proportion of mileage by men was tested in the model because gender might be a potentially confounding factor [20]. There is for example evidence that mainly elderly women decide for driving cessation if they are subject to a screening procedure [21]. We tested whether the inclusion of these variables improved the model fit (based on the AIC) or whether it changed the statistical significance (p-value) of the IRRs of the variable "age-based screening policy".
Sensitivity analyses
We conducted several sensitivity analyses to examine how the results changed using slightly different assumptions or with a somewhat different database. The models were recalculated under the assumptions described below, and we checked whether this had an impact on the statistical significance (p-value) of the IRRs of the variable "age-based screening policy".
For all analyses, we examined if the effect of the screening policy was different for specific subgroups of elderly drivers. By coding the variable "age-based screening policy" binary (1 = yes/0 = no) in the regular analyses, the effect is assumed to be the same for all age groups above 70 years. However, since an effect might only become apparent, for example, from the age of 85 [2, 22], the original variable was further subdivided by age (70–74 years = 1, 75–79 years = 2, 80–84 years = 3, 85+ years = 4). This new variable was included and tested both linearly and categorically in the regression models (sensitivity analysis 1).
Regarding the analyses addressing research question 1, we performed two additional sensitivity analyses. Firstly, drivers younger than 25 years were excluded because of different regulations in the three countries (accompanied driving of under 18-year-olds in Austria and Germany, but not in Switzerland in the years considered in this study) (sensitivity analysis 2). Secondly, we calculated the accident rates in Austria with weighted instead of unweighted mileage data (sensitivity analysis 3). In the regular analyses, the unweighted data were used because of the very large range of the weighting factors.
Data were analysed using IBM SPSS 24.0 (IBM Corp, Armonk, NY, USA) and STATA version 14.0 (StataCorp., College Station, TX, USA).
Results
For each country, population sizes as well as accident and injury numbers by adult age group are presented in table 2. The adult population size is similar in Switzerland and Austria, and about 10 times smaller than in Germany. The proportions of people aged 70 years and older in the adult population lie between 15% (Switzerland) and 19% (Germany). Similarly, the proportions of elderly car drivers (aged 70 years or older) causing serious accidents and of elderly pedestrians who are seriously or fatally injured within the adult population are similarly high in the three countries (between 14% in Austria and 17% in Switzerland and between 36% in Austria and 38% in Germany, respectively). In contrast, the proportion of seriously or fatally injured (e-)cyclists who are 70 years or older among all injured (e-)cyclists is higher in Germany (23%) than in Austria (20%) and Switzerland (15%).
Table 2Population sizes, numbers of accidents and injuries per age group and country.
|
Switzerland (Ø 2014–2016)
|
Austria (Ø 2013–2015)
|
Germany (Ø 2016–2018)
|
| Age group |
Population size (n) |
Car drivers causing serious accidents (n) |
Seriously or fatally injured pedestrians (n) |
Seriously or fatally injured (e-)cyclists (n) |
Population size (n) |
Car drivers causing serious accidents (n) |
Seriously or fatally injured pedestrians (n) |
Seriously or fatally injured (e-)cyclists (n) |
Population size (n) |
Car drivers causing serious accidents (n) |
Seriously or fatally injured pedestrians (n) |
Seriously or fatally injured (e-)cyclists (n) |
| 18–20 |
275,027 |
125 |
22 |
28 |
302,546 |
305 |
39 |
33 |
2,630,220 |
3309 |
282 |
458 |
| 21–24 |
404,262 |
163 |
29 |
34 |
439,171 |
320 |
42 |
48 |
3,694,844 |
3169 |
306 |
547 |
| 25–29 |
551,746 |
152 |
34 |
59 |
560,849 |
256 |
40 |
78 |
5,350,839 |
3337 |
316 |
763 |
| 30–34 |
580,822 |
123 |
25 |
66 |
571,094 |
225 |
39 |
84 |
5,226,396 |
2661 |
269 |
735 |
| 35–39 |
568,500 |
108 |
27 |
68 |
546,595 |
194 |
34 |
87 |
5,057,664 |
2355 |
255 |
741 |
| 40–44 |
597,746 |
120 |
23 |
81 |
631,031 |
216 |
39 |
122 |
4,866,810 |
2116 |
223 |
747 |
| 45–49 |
661,533 |
136 |
28 |
95 |
710,267 |
239 |
54 |
163 |
6,242,301 |
2472 |
330 |
1111 |
| 50–54 |
640,621 |
136 |
37 |
118 |
671,798 |
226 |
65 |
192 |
6,969,039 |
2781 |
394 |
1448 |
| 55–59 |
543,629 |
131 |
42 |
95 |
559,104 |
175 |
71 |
176 |
6,221,094 |
2550 |
432 |
1420 |
| 60–64 |
463,726 |
102 |
26 |
76 |
472,242 |
136 |
55 |
129 |
5,286,130 |
2016 |
432 |
1183 |
| 65–69 |
430,525 |
98 |
37 |
81 |
419,269 |
123 |
73 |
118 |
4,535,626 |
1566 |
411 |
1051 |
| 70–74 |
356,349 |
95 |
34 |
60 |
434,067 |
149 |
88 |
129 |
3,745,346 |
1425 |
428 |
920 |
| 75–79 |
269,484 |
82 |
49 |
39 |
276,494 |
116 |
79 |
92 |
4,284,959 |
1914 |
681 |
1214 |
| 80–84 |
208,186 |
63 |
49 |
28 |
216,948 |
71 |
78 |
56 |
2,701,531 |
1267 |
616 |
693 |
| 85+ |
199,911 |
41 |
55 |
11 |
209,169 |
56 |
63 |
25 |
2,239,068 |
650 |
514 |
305 |
Car drivers causing serious accidents (research question 1)
Mileage
Figure 1 shows the average daily distances travelled as car drivers for all age groups in the three countries. The three curves are similarly shaped, with the lowest mileages in the oldest age groups and the highest for those aged between 25 and 59 years. Across the entire age spectrum (18 years and older), the average daily distances driven by car are somewhat shorter in Switzerland (20 km/day) than in Austria and Germany (both 22 km/day). This is also true when the individual age groups between 70 years and 84 years are considered. For drivers aged 85 years and older, however, the distances driven by car are longest in Switzerland (2.5 km/day vs 2.3 km/day in Austria and 2.0 km/day in Germany).
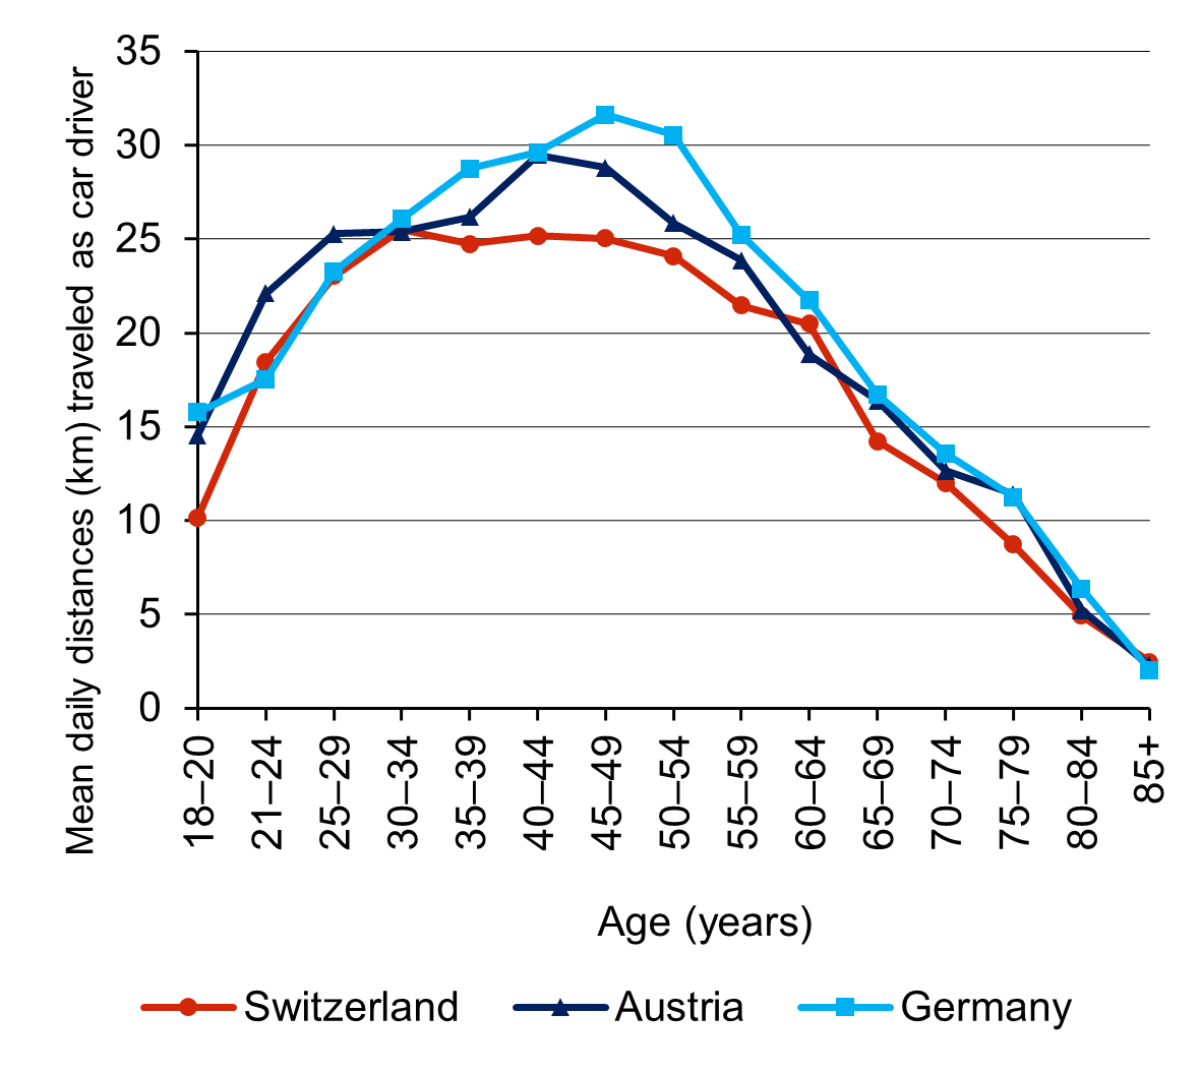
Figure 1 Mean daily distances (km) travelled as car drivers on the day(s) of reference by country and age group, based on national mobility survey data (see table 1). When calculating the mean values, persons with no driving exposure on the reporting date were also considered.
Accident rates
Figure 2 shows the distance-related rates of car drivers causing a serious accident, and figure 3 shows the rates of serious accidents in which the car driver causing the accident was seriously or fatally injured, both by country and age group. The curves show a well-known U-shape [23], with the highest rates for the youngest and oldest age groups and lower rates for the age groups in between.
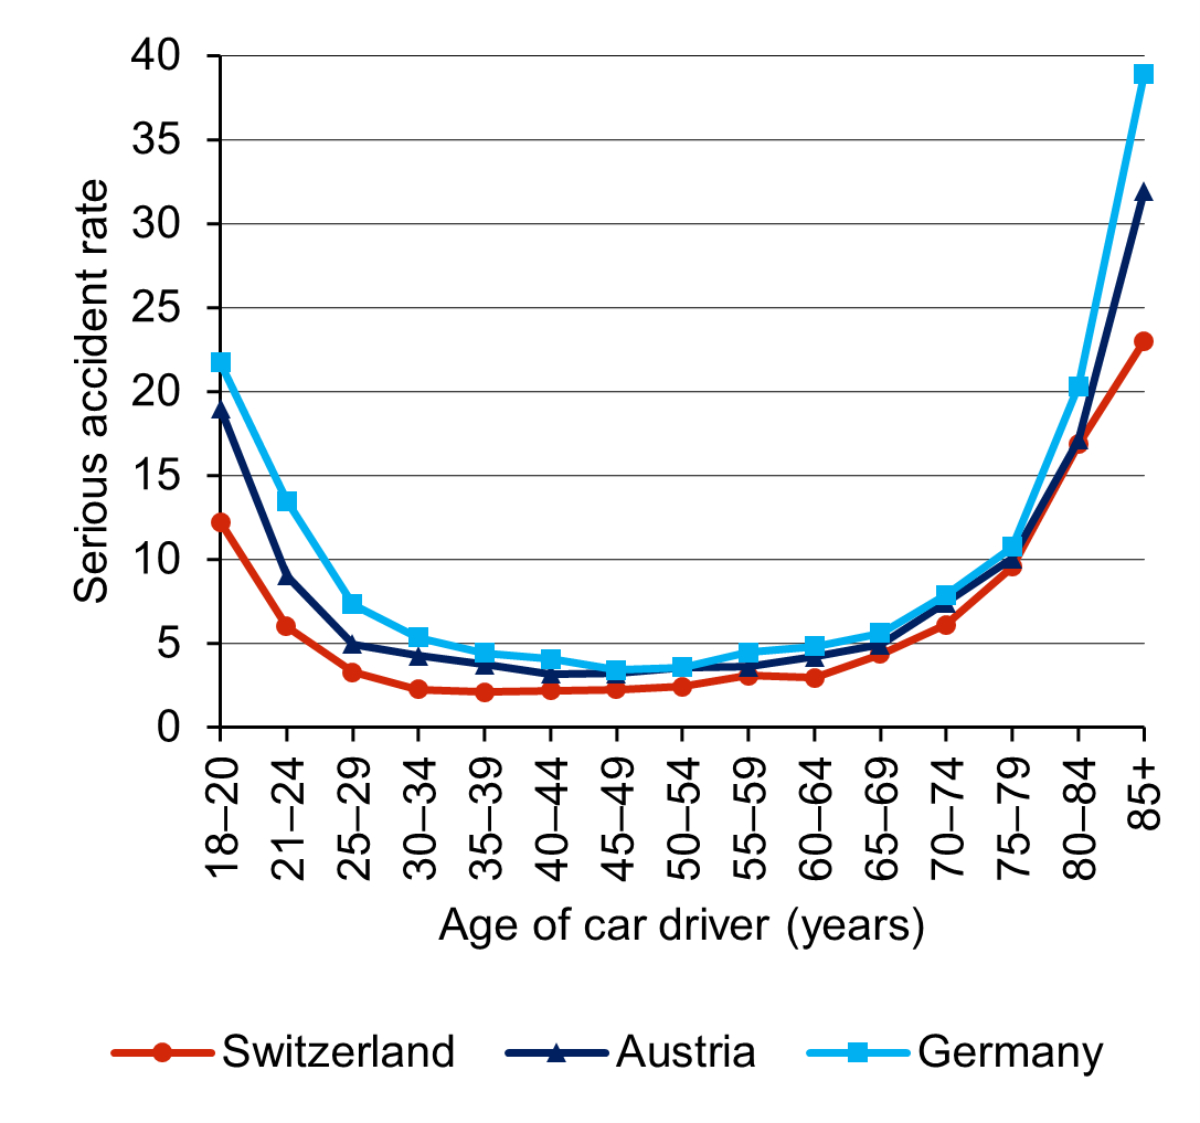
Figure 2 Serious accidents (at least one person seriously or fatally injured) caused by car drivers, per 100 million person kilometres driven, by age group of car driver and country (analysis 1). The corresponding numerical values including 95% confidence intervals can be found in the appendix (supplementary table S1).
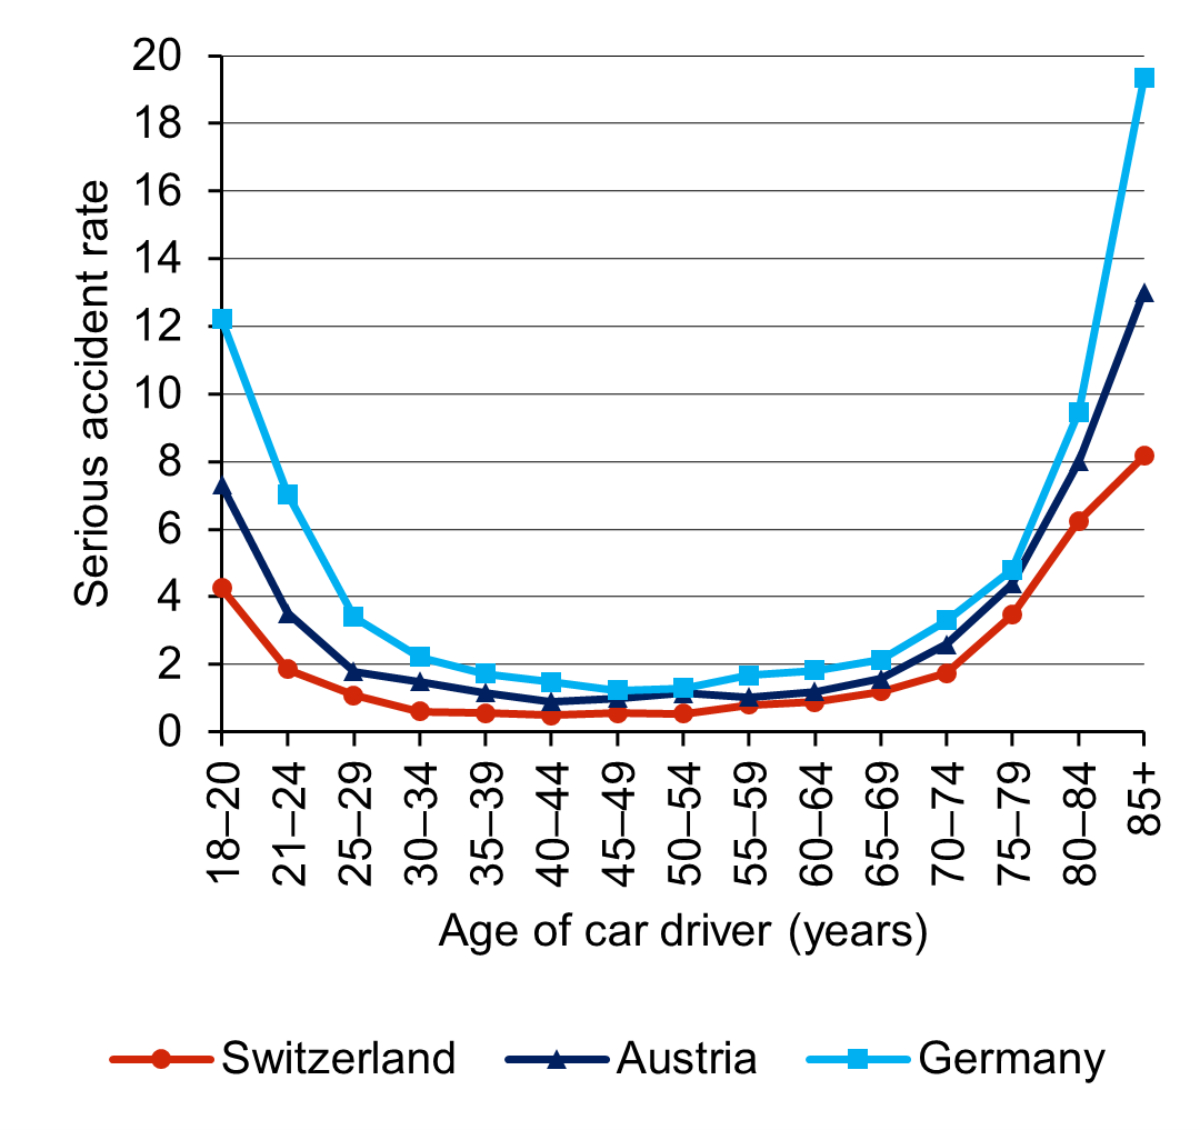
Figure 3 Accidents in which the car driver causing the accident was seriously or fatally injured, per 100 million person kilometres driven, by age group of car driver and country (analysis 1a). The corresponding numerical values including 95% confidence intervals can be found in the appendix (table S1).
Model selection and results of the regression analyses
Model 1 turned out to be the best fitting model for the two analyses. Neither the inclusion of a cubic or biquadratic age term (models 2 and 3) nor the proportion of drivers with a low mileage (model 4) nor the proportion of distances driven by men (model 5) improved the models (AIC) or considerably changed the p-value of the IRRs of the variable "age-based screening policy". Table 3 shows the IRRs of the variable of interest and all other independent variables resulting from the Poisson regression analyses. We found no statistically significant association between the screening policy for elderly drivers in Switzerland and their risk of causing a serious accident: for analysis 1, the IRR of the variable “age-based screening policy” is 1.24 (95% confidence interval [CI] 0.79–1.94) and for analysis 1a, it is 1.38 (95% CI 0.64–3.01).
Table 3Results of the Poisson regression analyses related to research question 1: IRRs for the independent variables with corresponding 95% confidence intervals and p-values. The variable of interest is written in bold.
|
Analysis Nr: dependent variable
|
Independent variable
|
IRR
|
95% CI
|
p-value IRR
|
p-value model
|
| Analysis 1: serious accidents caused by car drivers, per Mio. person kilometres |
Age-based screening policy
|
1.24
|
(0.79–1.94)
|
0.35
|
<0.001 |
| Age group |
0.54 |
(0.49–0.59) |
<0.001 |
| Age group^2 |
1.04 |
(1.04–1.05) |
<0.001 |
| Country: Switzerland |
1 |
– |
– |
| Country: Austria |
1.48 |
(1.03–2.12) |
<0.05 |
| Country: Germany |
1.78 |
(1.25–2.53) |
<0.01 |
| Analysis 1a: accidents in which the car driver causing the accident was seriously or fatally injured, per Mio. person kilometres |
Age-based screening policy
|
1.38
|
(0.64–3.01)
|
0.41
|
<0.001 |
| Age group |
0.48 |
(0.41–0.56) |
<0.001 |
| Age group^2 |
1.05 |
(1.04–1.06) |
<0.001 |
| Country: Switzerland |
1 |
– |
– |
| Country: Austria |
1.86 |
(0.98–3.52) |
0.06 |
| Country: Germany |
2.71 |
(1.46–5.04) |
<0.01 |
Seriously or fatally injured pedestrians and (e-)cyclists (research question 2)
Injury rates
The population-related injury rates by age group and country per 100,000 inhabitants are shown in figure 4 for pedestrians and in figure 5 for (e-)cyclists. The rates of seriously or fatally injured pedestrians increase with age, especially from the age of 70 years. The corresponding rates for (e-)cyclists increase with age as well but decline again in the oldest age groups. This can be mainly explained by the decreasing exposures in these age groups.

Figure 4 Seriously or fatally injured pedestrians per 100,000 inhabitants, by age group and country. The corresponding numerical values including 95% confidence intervals can be found in the appendix (table S1).
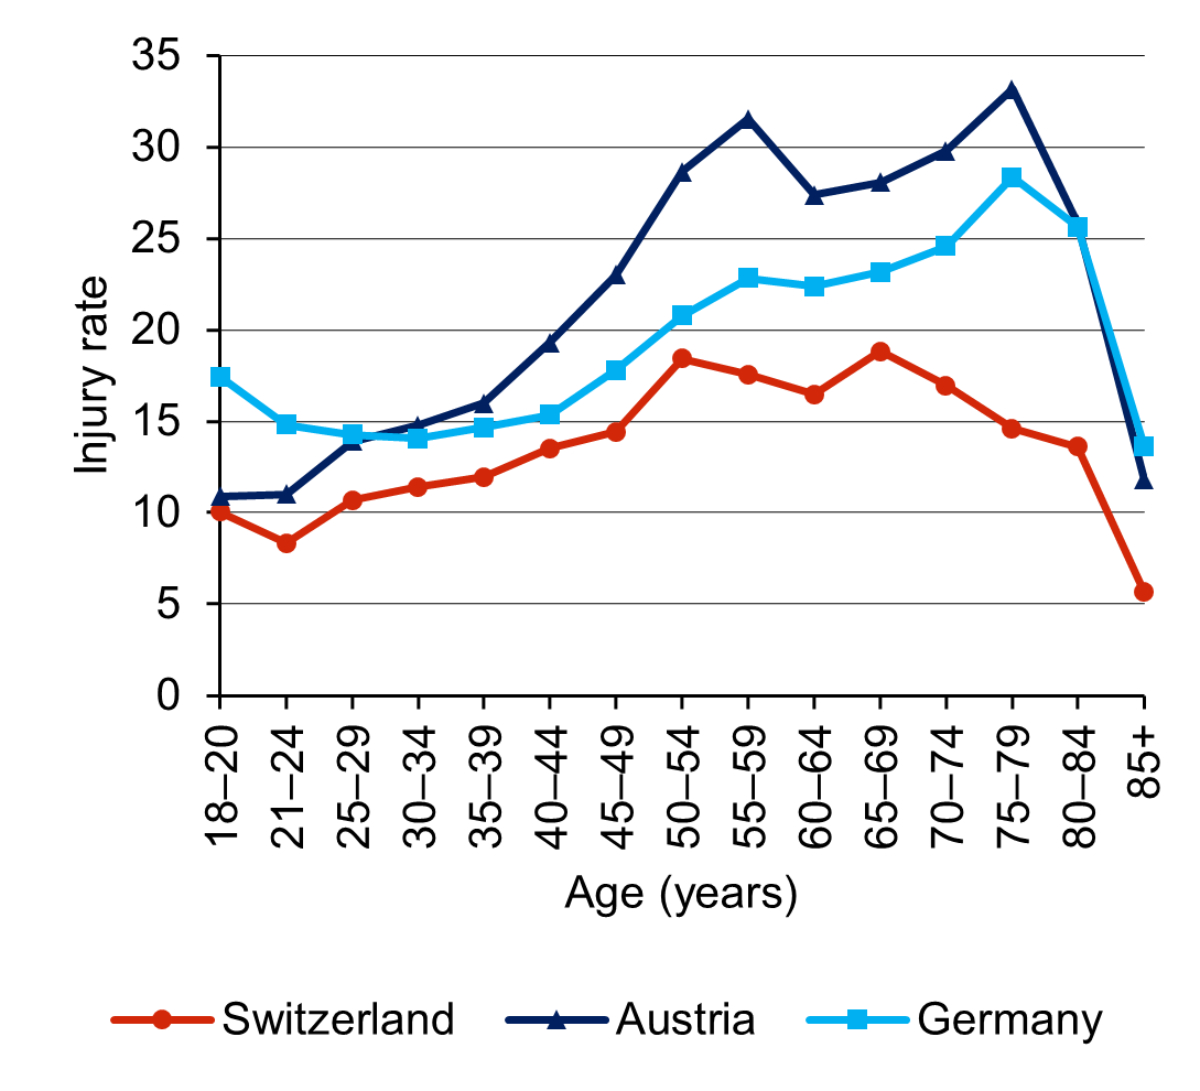
Figure 5 Seriously or fatally injured (e-)cyclists per 100,000 inhabitants, by age group and country. The corresponding numerical values including 95% confidence intervals can be found in the appendix (table S1).
Model selection and results of the regression analyses
Model 2 (with an additional cubic age term) was the best fitting model for the two analyses. The results of the regression analyses are shown in table 4. There were no statistically significant associations between the age-based screening policy in Switzerland and the risk of elderly pedestrians (IRR 1.16, 95% CI 0.80–1.68) or elderly (e-)cyclists (IRR 0.79, 95% CI 0.56–1.12) being seriously or fatally injured.
Table 4Results of the Poisson regression analyses relating to research question 2: IRRs for the independent variables with corresponding 95% confidence intervals and p-values. The variable of interest is written in bold.
|
Analysis Nr: dependent variable
|
Independent variable
|
IRR
|
95% CI
|
p-value IRR
|
p-value model
|
| Analysis 2: Seriously or fatally injured pedestrians per 100,000 inhabitants |
Age-based screening policy
|
1.16
|
(0.8–1.68)
|
0.43
|
<0.001 |
| Age group |
0.60 |
(0.46–0.77) |
<0.001 |
| Age group^2 |
1.07 |
(1.03–1.11) |
<0.001 |
| Age group^3 |
0.998 |
(0.997–1) |
<0.01 |
| Country: Switzerland |
1 |
– |
– |
| Country: Austria |
1.66 |
(1.24 - 2.22) |
<0.001 |
| Country: Germany |
1.10 |
(0.81 - 1.49) |
0.53 |
| Analysis 3: Seriously or fatally injured (e-)cyclists per 100,000 inhabitants |
Age-based screening policy
|
0.79
|
(0.56–1.12)
|
0.19
|
<0.001 |
| Age group |
0.83 |
(0.68–1.03) |
0.09 |
| Age group^2 |
1.05 |
(1.02–1.08) |
<0.01 |
| Age group^3 |
0.998 |
(0.997–0.999) |
<0.001 |
| Country: Switzerland |
1 |
– |
– |
| Country: Austria |
1.51 |
(1.24–1.84) |
<0.001 |
| Country: Germany |
1.34 |
(1.1–1.64) |
<0.01 |
Sensitivity analyses
The results did not change fundamentally in any of the sensitivity analyses (the results are presented in table S2 of the appendix). There was no indication of a linear trend or of an association only for specific age groups of elderly drivers, pedestrians or (e-)cyclists. Excluding young drivers from analysis 1 and 1a did not yield different results, except of wider confidence intervals due to the smaller number of age groups included. When using the weighted mileage data for Austria, the IRRs of the variable "age-based screening policy" approached the value of 1, corresponding to no association. The IRRs remained statistically non-significant.
Discussion
In the present study, we found no effect of the screening policy for elderly drivers in Switzerland on their risk of causing a serious accident. Moreover, the Swiss screening policy was not associated with higher serious or fatal injury rates of elderly pedestrians and (e-)cyclists.
Elderly car drivers causing serious accidents (research question 1)
Our results are in line with international reviews and individual studies on this subject, in which no clear evidence of a benefit of mandatory age-based screening policies on the safety of elderly drivers could be demonstrated [2–7]. Various reasons for the lack of beneficial effects of such screenings have been discussed in the literature. Some of them relate to the system in general, others to the procedures used in the screening. One general argument is that it is difficult or even impossible to reliably predict the risk of an individual for rare and multicausal events such as road traffic accidents [2, 3, 24]. It is further discussed that the instruments used in the screening procedures – e.g., cognitive tests – are not suitable for assessing the accident risk or the fitness to drive [25]. In addition, studies have shown that individuals with impairments often drive less or voluntarily hand in their driver's licence (e.g. [26, 27]). If people with impairments drive less and/or compensate their impairments by avoiding difficult situations (e.g., driving during night-time), they cause fewer accidents in absolute terms. Removing these occasional drivers from the driver population will therefore have a limited impact on accident numbers [2]. Another reason discussed is that passing the screening test could lead to a false sense of security [7]. According to a recent survey among elderly current and former car driver's license holders in Switzerland, however, passing the screening test had at most a small influence on the self-confidence of elderly drivers [28]. Finally, we are not aware of traffic safety measures addressing elderly drivers in Germany or Austria that could have weakened or even neutralised a potentially positive effect of the Swiss screening policy on accident risk.
Seriously or fatally injured pedestrians and (e-)cyclists
No association was found in this study between the age-based screening policy in Switzerland and the population-related risk of elderly pedestrians or (e-)cyclists being seriously or fatally injured. Only few studies have investigated this issue so far, with inconclusive results. In one study, pedestrian fatality rates in several European countries with and without age-based screening policies were compared and no negative effects of the screening on pedestrian mortality were found [7]. Other studies, however, have observed negative effects: one study found higher fatality rates among pedestrians and cyclists in Finland (with age-based screening policy) compared with Sweden (no such policy) [10]. Two studies found higher injury and mortality rates of pedestrians and cyclists, respectively, after a cognitive test was added to the existing licensing renewal procedure [6, 9]. It is hypothesised that elderly persons who have had their driver's licence revoked or voluntarily handed it in due to the screening procedure may switch to the unprotected modes of transport, which are significantly less safe for them [2, 8]. The switch to the unprotected modes of transport is possibly less pronounced in the Swiss context: according to the above-mentioned Swiss survey, only a small proportion (15%) of the former car drivers stated that they more frequently rode a two-wheeler compared with when they were still driving. However, a large proportion of them reported that they travelled more often as car passengers (60%) and used public transport more frequently (50%) [28]. Owing to the reliable and dense public transport system in Switzerland and resulting short distances to public transport stops in many places in Switzerland, this might be associated with shorter additional distances travelled on foot or by bicycle than in other countries.
Strengths and limitations
The use of per-distance accident rates of car drivers is an improvement over previous studies, in which rates were usually calculated in relation to population size or to the number of driver's licence holders (e.g. [6, 29, 30]). Using distance-related rates made it possible to take into account differences in driving performance between the countries. This is important because the existence of a screening policy by itself can influence the mobility behaviour of elderly persons. For example, elderly licence holders who are still fit to drive might give up driving prematurely and switch to other modes of transport [2].
Another strength of this study is the high comparability of the data used for the three countries. Data on accidents were taken from national statistics based on police reports. Data on distances travelled as car drivers were taken from surveys in large random national samples. An extensive non-responder analysis in the German mobility survey, where the participation rate was quite low (6%), showed that the willingness to participate did not depend on the mobility behaviour [31]. Although the mobility surveys took place in different years in the three countries, leading to a comparison of accident numbers from different years, it can be assumed that this fact did not have a significant effect on the results. Distances travelled by car and accident occurrence are relatively constant over a period of a few years (no dependence on weather effects as, for example, in the case of cycling). Moreover, any temporal trends would presumably also affect the younger age groups, thus leading to different accident levels which were controlled for in the analyses. Including the younger age groups and a variable indicating the country in the regression models made it possible to control for general differences between the countries, which could lead to different accident or injury rate levels. For instance, accident levels could vary due to different speed limits, which are, for example, on rural roads 80 km/h in Switzerland and 100 km/h in Austria and Germany. To check the plausibility and robustness of the results, we additionally tested models including other potentially relevant factors and carried out sensitivity analyses. These additional analyses did not yield fundamentally different results.
A limitation of this study is that (accidents with) serious and fatal injuries had to be combined. This was done due to the low rates of fatal accidents (research question 1) and fatalities (research question 2). Rates of fatal accidents and fatalities, respectively, would have been most comparable between the countries due to identical definitions and thus the corresponding results would have been most informative. In contrast to fatal injuries, the definitions of a serious injury differ somewhat between countries (table 1). Particularly the definition in Austria differs from the other two countries. Despite these differences in definition, we can assume that the injury severity of seriously injured persons is reasonably comparable between the countries: an additional analysis yielded comparable proportions of fatally injured persons within all seriously and fatally injured persons in the three countries (Switzerland: 6.2%, Austria: 6.6%, Germany: 4.9%). The definitions have also been judged to be similar by the European Transport Safety Council (ETSC) [32]. Nevertheless, we also conducted separate analyses on fatal accidents and fatalities. This expectedly resulted in considerably wider confidence intervals. The results, however, did not substantially differ from the ones reported (they can be found in table S3 of the appendix). As another limitation, because this study is based on aggregated data, potentially confounding factors could not be controlled for at an individual level.
Significance of the results
With regard to the generalisability of the results of this study, we think that they cannot be simply transferred to other contexts, as screening methods and contextual factors differ substantially between countries. Nevertheless, our study adds a piece to the puzzle regarding the question on what impact mandatory age-based screening procedures have on road safety.
Regarding Switzerland, the findings of this study serve as a basis for discussion on how to proceed with the policy in the future. One thing to consider is that because the latest mobility survey was conducted in 2015, the accident data used for Switzerland in this analysis cover the time period from 2014 to 2016. The results therefore only partially represent the system currently in force. In 2016, for example, measures to harmonise the examinations were introduced. On 1 January 2019, the age limit for the medical screening examination was raised from 70 to 75 years. To investigate the effect of these measures on accident numbers, we looked at the development of these numbers (absolute as well as relative to the population size) over time. We did not find a tendency for a more favourable development of accidents caused by the elderly age groups compared with the other age groups from 2016 on. With regard to the raise of the age limit in 2019, we found no increase in accidents for those aged 70–74 years as of 2019. Based on the data available so far, we therefore assume that these measures do not have a large effect on the accident rate of elderly drivers. It must be kept in mind though that the latter analysis is based on data from only three years, during which a part of the age group of interest (70–74 years) still has been subject to the screening.
Conclusions
One aim of the present study was to evaluate whether the mandatory age-based screening policy in Switzerland for elderly drivers has an effect on their accident risk. In relation to the distances driven, and considering differences in accident levels between the countries, the risk of elderly drivers in Switzerland causing a serious accident does not statistically significantly differ from that of elderly drivers in Austria and Germany, two neighbouring countries without such a system. The intended positive effect of the Swiss screening system on accident rates of elderly drivers could therefore not be demonstrated in this study. This finding is supported by the existing literature on various age-based screening measures. Contrary to other studies, however, no negative effects of the Swiss system on the population-related risk of elderly pedestrians and (e-)cyclists being seriously or fatally injured were found. The reliable and dense public transport system in Switzerland is one possible explanation for this latter finding.
Since our analysis showed no benefit of the age-based screening policy in Switzerland on road safety, the question arises whether the considerable effort related to the policy is justified. The findings of this study serve as a basis for discussion on how to proceed with the policy in the future. Ultimately, it is a political decision which measures need to be taken.
Acknowledgements
The authors would like to thank Martin Donabauer for preparing and sending the Austrian data. Also, we wish to thank Uwe Ewert for his contribution in the conceptualisation of the study. Thanks also go to Martin Röösli for statistical support. This research did not receive any specific grant from funding agencies in the public, commercial, or not-for-profit sectors.
Patrizia Hertach, PhD
Swiss Council for Accident Prevention (BFU)
Hodlerstrasse 5a
CH-3011 Bern
p.hertach[at]bfu.ch
References
1.
Fastenmeier W,
Gstalter H.
Fahreignung älterer Kraftfahrer im internationalen Vergleich: Teil 2: Analyse und Bewertung von Massnahmen und Evaluationsstudien zur Überprüfung der Fahr-eignung älterer Fahrer. Institut mensch-verkehr-umwelt mvu. Forschungsbericht GDV. Mün-chen; 2014. Nr. 25. German.
2.
Siren A,
Haustein S. Driving licences and medical screening in old age: review of literature and European licensing policies. J Transp Health. 2015;2(1):68–78. https://doi.org/10.1016/j.jth.2014.09.003
3.
Fastenmeier W. Fahreignung bei Senioren. Altersbezogene Pflichtuntersuchungen: Schaden oder Nutzen? In: 55. Verkehrsgerichtstag. Berlin; 2017. 73–89. German.
4.
Koppel S,
Bugeja L,
Stephens A,
Cartwright A,
Osborne R,
Williams G, et al.
The safety benefits of older drivers attending an in-person licence renewal. J Transp Health. 2020;17:100845. https://doi.org/10.1016/j.jth.2020.100845
5.
Kahvedžić A. International re-licensing models of older drivers. National Programme Office for Traffic Medicine. Dublin; 2013.
6.
Ichikawa M,
Inada H,
Nakahara S. Effect of a cognitive test at license renewal for older drivers on their crash risk in Japan. Inj Prev. 2020 Jun;26(3):234–9. https://doi.org/10.1136/injuryprev-2018-043117
7.
Martensen H,
Diependale K. Comparison of European Countries with and without age based screening of older drivers. Belgian Road Safety Institute (BRSI). Brüssel; 2014.
8.
Ichikawa M,
Inada H,
Nakahara S. Increased traffic injuries among older unprotected road users following the introduction of an age-based cognitive test to the driver’s license renewal procedure in Japan. Accid Anal Prev. 2020 Mar;136:105440. https://doi.org/10.1016/j.aap.2020.105440
9.
Siren A,
Meng A. Cognitive screening of older drivers does not produce safety benefits. Accid Anal Prev. 2012 Mar;45:634–8. https://doi.org/10.1016/j.aap.2011.09.032
10.
Hakamies-Blomqvist L,
Johansson K,
Lundberg C. Medical screening of older drivers as a traffic safety measure—a comparative Finnish-Swedish evaluation study. J Am Geriatr Soc. 1996 Jun;44(6):650–3. https://doi.org/10.1111/j.1532-5415.1996.tb01826.x
11.
Bundesamt für Strassen ASTRA. Auszug aus der ADMAS-Statistik 2020 (Mehrjahresvergleich). ASTRA. Bern; 2021 [cited 2021 May 18]. Available from: https://www.astra.admin.ch/astra/de/home/dokumentation/daten-informationsprodukte/statistik-administrativmassnahmen.html. German.
12.
Casutt G,
Jäncke L. Strassenverkehrsunfälle im Ländervergleich: unterschiedliche Unfallrate bei Senioren zwischen Deutschland und der Schweiz [German.]. ZVS. 2015;61(1):7–20.
13.
Ewert U. Leserbrief zu: Casutt, G. und Jäncke, L. (2015). Strassenverkehrsunfälle im Ländervergleich: Unterschiedliche Unfallraten bei Senioren zwischen Deutschland und der Schweiz. Zeitschrift für Verkehrssicherheit, 61. Jahrgang, Heft 1, S. 7-20 [German.]. ZVS. 2016;62(1):38.
14.
Li G,
Braver ER,
Chen LH. Fragility versus excessive crash involvement as determinants of high death rates per vehicle-mile of travel among older drivers. Accid Anal Prev. 2003 Mar;35(2):227–35. https://doi.org/10.1016/s0001-4575(01)00107-5 https://doi.org/10.1016/S0001-4575(01)00107-5
15.
Langford J,
Methorst R,
Hakamies-Blomqvist L. Older drivers do not have a high crash risk—a replication of low mileage bias. Accid Anal Prev. 2006 May;38(3):574–8. https://doi.org/10.1016/j.aap.2005.12.002
16.
Hakamies‐Blomqvist L,
Raitanen T,
O’Neill D. Driver ageing does not cause higher accident rates per km. Transp Res, Part F Traffic Psychol Behav. 2002;5(4):271–4. https://doi.org/10.1016/S1369-8478(03)00005-6
17.
Crowe CL,
Kannoth S,
Andrews H,
Strogatz D,
Li G,
DiGuiseppi C, et al.
Associations of frail-ty status with low-mileage driving and driving cessation in a cohort of older drivers. Geriatrics (Basel). 2020 Mar;5(1):19. https://doi.org/10.3390/geriatrics5010019
18.
Langford J,
Koppel S,
McCarthy D,
Srinivasan S. In defence of the ‘low-mileage bias’. Accid Anal Prev. 2008 Nov;40(6):1996–9. https://doi.org/10.1016/j.aap.2008.08.027
19.
Keall MD,
Frith WJ. Characteristics and risks of drivers with low annual distance driven. Traffic Inj Prev. 2006 Sep;7(3):248–55. https://doi.org/10.1080/15389580600672836
20.
Langford J,
Fitzharris M,
Koppel S,
Newstead S. Effectiveness of mandatory license testing for older drivers in reducing crash risk among urban older Australian drivers. Traffic Inj Prev. 2004 Dec;5(4):326–35. https://doi.org/10.1080/15389580490509464
21.
Siren A,
Haustein S. Driving cessation anno 2010: which older drivers give up their license and why? Evidence from Denmark. J Appl Gerontol. 2016 Jan;35(1):18–38. https://doi.org/10.1177/0733464814521690
22.
Tefft BC. Driver license renewal policies and fatal crash involvement rates of older drivers, United States, 1986-2011. Inj Epidemiol. 2014 Dec;1(1):25. https://doi.org/10.1186/s40621-014-0025-0
23.
Langford J,
Koppel S. Epidemiology of older driver crashes – identifying older driver risk factors and exposure patterns. Transp Res, Part F Traffic Psychol Behav. 2006;9(5):309–21. https://doi.org/10.1016/j.trf.2006.03.005
24.
Hakamies‐Blomqvist L. Are there safe and unsafe drivers? Transp Res, Part F Traffic Psychol Behav. 2006;9(5):347–52. https://doi.org/10.1016/j.trf.2006.06.004
25.
Fastenmeier W,
Gstalter H,
Rompe K,
Risser R. Selektion oder Befähigung: Wie kann die Mobilität älterer Fahrer aufrechterhalten werden? Stellungnahme namens des Vorstandes der Deutschen Gesellschaft für Verkehrspsychologie e.V. (DGVP) [Ger-man.]. ZVS. 2015;61(1):33–42.
26.
Lyman JM,
McGwin G Jr,
Sims RV. Factors related to driving difficulty and habits in older drivers. Accid Anal Prev. 2001 May;33(3):413–21. https://doi.org/10.1016/s0001-4575(00)00055-5 https://doi.org/10.1016/S0001-4575(00)00055-5
27.
Rimmö PA,
Hakamies‐Blomqvist L. Older drivers’ aberrant driving behaviour, impaired activity, and health as reasons for self-imposed driving limitations. Transp Res, Part F Traffic Psychol Behav. 2002;5(1):47–62. https://doi.org/10.1016/S1369-8478(02)00005-0
28.
Huwiler K,
Uhr A,
Hertach P.
Altersbasierte verkehrsmedizinische Kontrolluntersuchungen - Evaluation des Schweizer Systems [Age-based medical screening of driver's license holders - evaluation of the Swiss system]. BFU, Beratungsstelle für Unfallverhütung. Bern. German. Forthcoming.
29.
Langford J,
Bohensky M,
Koppel S,
Newstead S. Do age-based mandatory assessments reduce older drivers’ risk to other road users? Accid Anal Prev. 2008 Nov;40(6):1913–8. https://doi.org/10.1016/j.aap.2008.08.010
30.
McGwin G Jr,
Sarrels SA,
Griffin R,
Owsley C,
Rue LW 3rd. The impact of a vision screening law on older driver fatality rates. Arch Ophthalmol. 2008 Nov;126(11):1544–7. https://doi.org/10.1001/archopht.126.11.1544
31.
Eggs J,
Follmer R,
Gruschwitz D,
Nobis C,
Bäumer M,
Pfeiffer M. Mobilität in Deutschland – MiD Methodenbericht: Studie von infas, DLR, IVT und infas 360 im Auftrag des Bundesmi-nisters für Verkehr und digitale Infrastruktur (FE-Nr. 70.904/15). Bonn; 2018. Available from: www.mobilitaet-in-deutschland.de. German.
32.
Adminaité-Fodor D,
Heilpern C,
Jost G. Ranking EU progress on road safety: 13th Road safety performance index report. European Transport Safety Council ETSC. Brussels; 2019.
33.
Federal Statistical Office FSO, Federal Office for Spatial Development OSD. Population’s transport behaviour 2015. FSO. 11 Mobility and transport. Berne; 2017. 1967-1500. Available from: www.statistics.admin.ch
34.
Tomschy R,
Herry M,
Sammer G,
Klementschitz R,
Riegler S,
Follmer R, et al.
Österreich un-terwegs 2013/2014: Ergebnisbericht zur österreichweiten Mobilitätserhebung "Österreich unterwegs" 2013/2014. Bundesministerium für Verkehr, Innovation und Technologie BMVIT. Wien; 2016. German.
35.
Follmer R,
Gruschwitz D. Mobility in Germany – short report. Edition 4.0 of the study by infas, DLR, IVT and infas 360 on behalf of the Federal Ministry of Transport and Digital In-frastructure (BMVI) (FE no. 70.904/15). Bonn; 2019. Available from: www.mobilitaet-in-deutschland.de
Appendix: supplementary data
The appendix is available in the pdf version of the article.