Automated external defibrillator accessibility and overcoverage across the urban-rural
gradient: a national cross-sectional geospatial analysis
DOI: https://doi.org/https://doi.org/10.57187/4928
Sarah Maria Esther Jerjena,
Armin Gemperlia
a University
of Luzern, Faculty of Health Sciences and Medicine
Summary
STUDY AIMS: Timely defibrillation is a critical
determinant of survival in out-of-hospital cardiac arrests, yet public access
to automated external defibrillators (AEDs) remains spatially and temporally
uneven, particularly in decentralised health systems. This study aimed to quantify
AED accessibility and spatial overcoverage across the urban–rural gradient
using high-resolution geospatial data from Switzerland as a model system.
METHODS: We conducted a national
cross-sectional geospatial analysis using AED locations (n = 14,446) from
Defikarte.ch (December 2024), hectare-level population grids from the Federal
Statistical Office (2023) and the 9-category municipality typology. The primary
outcome was AED accessibility, defined as the proportion of the population
within a 300-metre retrieval buffer of a 24-hour-accessible AED. Secondary
outcomes included population coverage gain, comparing current 24-hour AED access
with a hypothetical scenario in which all AEDs are accessible 24-hours, and spatial
overcoverage, defined as overlapping AED buffers, indicating redundancy. Population
exposure quantified the share of residents within these zones. Differences
across municipality types were tested using the chi-squared test, paired t-test
and Kruskal–Wallis test with Dunn’s post-hoc comparison.
RESULTS: Expanding all AEDs to 24-hour access
significantly increased national coverage from 28.9% to 51.6% (t = 3.96, p <0.005)
but failed to resolve persistent deficits in agricultural and tourist communes.
Statistical tests confirmed significant variation in accessibility (chi-squared
test, p <0.001) and overcoverage (Kruskal–Wallis test, p <0.001) across
municipality types. Overcoverage was concentrated in urban cores, while rural
areas exhibited predominantly single-device coverage. Population exposure
analysis indicated that overlap zones accounted for 28.6% of the covered
population and 8.3% of the total population.
CONCLUSION: This national analysis identified
major spatial and temporal inequities in AED accessibility across Switzerland.
Expanding all AEDs to 24-hour availability improves coverage but does not
resolve structural gaps, with persistent undercoverage in rural areas and
clustering in urban cores. Equitable access will require coordinated planning,
mandatory 24-hour availability, and spatial redistribution aligned with
population needs.
Introduction
Defibrillation is a critical link in the Chain
of Survival and one of the few proven interventions that
improve outcomes in cardiac arrests with shockable rhythms [1,
2]. Without defibrillation, survival chances in
witnessed shockable rhythms decrease by 3–4% per
minute even if cardiopulmonary
resuscitation (CPR) is provided; rapid intervention is therefore essential [3]. Recognising
the time-critical nature of defibrillation, the Swiss
Resuscitation Council (SWISSRECA) has set a national target: defibrillation
within five minutes in at least 90% of out-of-hospital cardiac arrests (OHCA) [4].
Emergency medical services (EMS) in Switzerland
are widely regarded for their reliability and speed, aiming to reach 90% of
emergencies within 15 minutes [5]. Yet this benchmark still fails to
meet the temporal demands of OHCA care. Even under optimal conditions, EMS
response alone is rarely fast enough to intervene within this narrow treatment window
[3]. This misalignment demonstrates the
need for public access interventions that can bridge the gap between collapse
and professional care.
Automated external defibrillators (AED) are
central to this early response strategy, enabling bystanders to deliver
potentially life-saving shocks before EMS arrival. When combined with CPR, AED
use by laypersons can double
survival rates with good neurological outcomes if applied in a timely fashion [6].
However,
the effectiveness of this approach depends not only on public training and
awareness but, critically, on the spatial and temporal accessibility of devices
[7–9].
In Switzerland, there is no centralised regulatory framework governing
AED deployment. Devices are typically installed at the discretion of private
entities or local actors, without national coordination or oversight [10]. Compounding
this challenge, many
AEDs remain inaccessible outside of business hours [11, 12]. This decentralised and
unregulated model has
produced a fragmented network, raising concerns about the equity, efficiency
and strategic logic of AED accessibility across the country.
This study harnesses Switzerland’s advanced EMS system as a reference model
to examine how AEDs are distributed across space and time, and how decentralised
deployment affects equity and efficiency. Specifically, it aims to:
- Assess
coverage gaps by quantifying the population within 300 metres of a 24-hour-accessible
AED, disaggregated by municipality type.
- Evaluate
the effect of converting restricted-hour AEDs to 24-hour access on national and municipal
coverage levels.
- Identify
patterns of overcoverage under both current and expanded AED availability
scenarios.
By quantifying these dimensions, the study
provides evidence to inform more equitable and strategic AED deployment, not
only in Switzerland, but in other health systems characterised by decentralised
infrastructure and limited regulatory oversight.
Methodology
This study used a
national cross-sectional observational design applying spatial analytical
methods to assess AED accessibility and overcoverage across Switzerland.
Data sources and analytical tools
AED location
data were sourced from Defikarte.ch, a public, continuously updated registry of
AEDs. As of December 2024, the dataset comprised 14,446 AEDs, of which 5666
were accessible on a 24-hour basis and 8780 with restricted hours of
availability [11]. Population
data were obtained from the Federal Statistical Office’s (FSO) 2023
hectare-level population grids [13]. Municipalities
were classified according to the 2014 FSO typology, which delineates nine
distinct categories in descending order of urbanisation: Big Centres, Secondary
Centres, Crown Big Centres, Medium Centres, Crown Medium Centres, Small Centres,
Peri-Urban Rural Communes, Agricultural Communes and Tourist Communes. This
classification incorporates employment structure, commuting patterns,
population density and accessibility, thereby providing a functional, rather
than purely morphological, urban–rural distinction that accounts for daytime
population flux and workplace clustering [14]. The study covered all
Swiss municipalities and used a complete census of registered AEDs together
with the national population grid. No sampling or sample size calculation was
required.
All spatial analyses were performed using QGIS
3.32 and R 4.3.2 (EPSG:2056). Both software environments are distributed under
GNU General Public License. Geospatial processing used the sf, terra
and exactextractr packages. Statistical modelling and visualisation were
performed using tidyverse, car and ggspatial. Statistical
significance was set at p <0.05.
Spatial accessibility analysis
The primary
outcome was to quantify AED accessibility, defined as the proportion of the
population within a 300-metre Euclidean retrieval buffer of a 24-hour available
AED (“24-hour AEDs” scenario). This threshold represents a feasible retrieval distance
for bystanders, corresponding to a round trip travel time of ~4
minutes at an average emergency walking speed, and thus falls well within the
critical 10-minute defibrillation window [11, 15]. Buffers were
intersected with population grids to calculate the number of individuals with access.
Accessibility was first calculated for each municipality to enable detailed
mapping and spatial visualisation and then aggregated by municipality type for
comparative statistical analysis. Both covered and uncovered populations were
quantified, and an absolute and relative difference metric, expressed as
percentage deviation from the national mean, were calculated to standardise
comparisons of accessibility disparities across municipality types. Statistical
significance of differences in AED accessibility by municipality type was tested
using a chi-squared test of independence. The chi-squared test used a 2 × 9 contingency
table (covered/uncovered
residents × municipality
types).
Population coverage gains under full AED accessibility assumption
To assess the
potential impact of universal 24-hour AED accessibility, two scenarios were
compared: (1) the status quo, considering only current 24-hour AEDs, and (2) a
hypothetical scenario in which all AEDs, including those with restricted access
hours, are assumed to be accessible 24-hours (“All AEDs” scenario). For each
scenario, population coverage was recalculated, and absolute as well as
percentage gains in accessibility were determined. The difference in coverage
between the two scenarios, referred to as population coverage gain, served as a
secondary outcome. The statistical significance of expanded coverage was tested
via a paired t-test, comparing population coverage between the scenarios across
the nine municipality types. Resultant percentage increases were mapped to
visualise spatial variation in accessibility gains.
Quantification of spatial overcoverage
To assess for
potential AED redundancy, a raster-based overlap analysis was conducted. AED
buffers were rasterised at 10-metre resolution, with each cell recording the
number of overlapping buffers. Cells with two or more overlaps were classified
as overcovered, indicating possible spatial inefficiency, while single-buffer
cells served as the baseline for comparison. These metrics formed the basis for
additional analysis, included extreme overlap (cells with three or more AED
buffers) and population exposure to overcoverage, expressed as both the
proportion of the total population and the AED-covered population located
within overlapping zones. Municipality types were assigned to each raster cell
via spatial join, enabling stratified analysis by urbanisation level. National-
and municipality-level summary statistics, including mean, maximum, standard
deviation and coefficient of variation, were computed for both scenarios (24-hour
AEDs and All AEDs). Single coverage cells were additionally reported as an
indicator of unique AED reach to contextualise coverage efficiency.
Differences in raster-based overlap intensity
across municipality types were tested using the Kruskal–Wallis test, followed
by Dunn’s pairwise comparisons with Bonferroni correction.
Results
AED coverage by municipality typology
At the
national level, 28.9% of the population resides within 300 metres of a 24h AED
(table 1). A statistically significant association is observed between
municipality type and AED accessibility (χ² = 18,034.35, p = 0.001), indicating
that coverage differences are unlikely to be attributable to random variation. Coverage
is lower than the national average in Big Centres (25.5%) and Agricultural
Communes (25.7%). Secondary Centres (28.4%) and Tourist Communes (28.8%) report
values close to the national mean. Higher coverage is observed in Crown Big
Centres (29.6%), Medium Centres (29.6%), Small Centres (30.0%), Crown Medium
Centres (30.9%) and Peri-Urban Rural Communes (31.1%).
Table 1Population
distribution in relation to 24-hour AED accessibility, by municipality type.
Values indicate the percentage of the population within and beyond a 300-metre
buffer of a 24h AED. Absolute and relative differences were calculated with
respect to the national mean, shown in percentage points (pp) and percent
deviation. Each municipality type’s share of the total population is also
provided (Population share). Municipality
categories follow the Federal Statistical Office functional urban–rural
typology, which classifies municipalities into nine types in descending order
of urbanisation based on employment structure, commuting intensity,
population density and accessibility.
| Municipality
type |
Population share
(%) |
Population not
covered (%) |
Population covered
(%) |
Absolute difference
vs national value (pp) |
Relative difference
vs national value (%) |
| Aggregate
national value |
100.0% |
71.07% |
28.93% |
0.00 |
0.00% |
| Big
Centres |
16.0% |
74.54% |
25.46% |
–3.47 |
–11.99% |
| Secondary
Centres |
10.8% |
71.64% |
28.36% |
–0.57 |
–1.97% |
| Crown
Big Centres |
17.9% |
70.43% |
29.57% |
0.64 |
2.21% |
| Medium
Centres |
12.7% |
70.41% |
29.59% |
0.66 |
2.28% |
| Crown
Medium Centres |
15.9% |
69.05% |
30.95% |
2.02 |
6.99% |
| Small
Centres |
2.5% |
69.98% |
30.02% |
1.09 |
3.77% |
| Peri-urban
Rural Communes |
14.6% |
68.94% |
31.06% |
2.13 |
7.36% |
| Agricultural
Communes |
7.3% |
74.32% |
25.68% |
-3.25 |
–11.23% |
| Tourist
Communes |
2.3% |
71.19% |
28.81% |
-0.12 |
–0.42% |
Figure 1
shows AED accessibility for each individual municipality across Switzerland,
expressed as the percentage of residents within 300 metres of a 24-hour-accessible
AED. Unlike table 1, which reports averages by municipality type, the map
displays the distribution of accessibility at full municipal resolution.
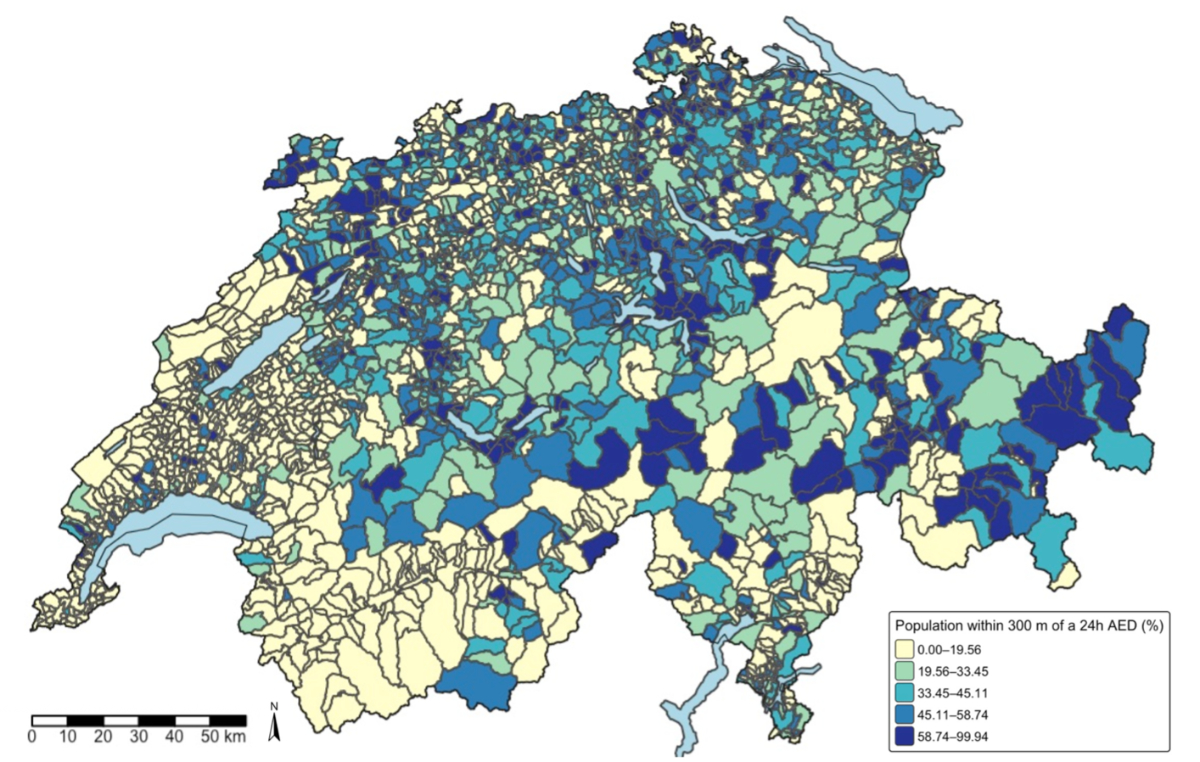
Figure 1Each polygon
represents a single municipality, shaded by the percentage
of residents located within 300 metres of a 24-hour-accessible AED. Values were
derived by intersecting hectare-level population grids with 300-metre AED
buffers. Classification intervals follow quantile breaks (EPSG:2056). Ranges are lower-bound
inclusive and upper-bound
exclusive; boundary values belong to the lower class.
Population coverage gains under universal 24h AED accessibility
Expanding all
AEDs to 24-hour accessibility increases the national number of continuously
available AEDs from 5666 to 14,446 and raises population coverage from 28.9% to
51.6%, corresponding to an absolute gain of 8780 devices and a 22.7 percentage
point (pp) increase in coverage (table 2). Coverage gains vary across
municipality types. The largest increases are observed in Big and Secondary
Centres, with a 507.7% and 260.0% increase, respectively, in AED availability,
and a 39.5 pp and 33.7 pp increase in population coverage. In contrast,
Agricultural and Tourist Communes register smaller increases in AEDs, 54.1% and
100.2% respectively, and remain below the national post-expansion population
coverage average (8.1 pp and 12.3 pp, respectively). A map visualising these coverage
increases by municipality is shown in the appendix (figure S1).
A
statistically significant increase in AED coverage is observed between the 24-hour
AEDs and All AEDs scenarios (t = 3.9594, df = 8, p <0.005). On average,
229,914 additional individuals gained coverage following the extension to 24-hour
AED availability (95% confidence interval: [96,010– 363,818]).
Table 2AED availability and population coverage
under expanded 24-hour access, by municipality type. Counts reflect the
number of AEDs in each scenario: currently 24-hour-accessible devices
(“24-hour AEDs”) and all registered devices (“All AEDs”). “Absolute increase”
and “Percentage increase” measure the numerical and proportional growth in
devices under universal 24-hour accessibility. “Population covered (%)”
indicates the proportion of residents within a 300-metre retrieval buffer,
and “Population coverage increase (pp)” indicates the absolute gain in
coverage, expressed as the difference in percentage points between the
current and expanded scenarios.
| Municipality type |
24-hour AEDs count |
All AEDs count |
Absolute increase |
Percentage increase |
Population not covered (%) |
Population covered (%) |
Population coverage increase (pp) |
| Aggregate national value |
5666 |
14,446 |
8780 |
154.97% |
48.36% |
51.64% |
22.71 |
| Big Centres |
337 |
2048 |
1711 |
507.71% |
35.02% |
64.98% |
39.52 |
| Secondary Centres |
430 |
1548 |
1118 |
260.00% |
37.93% |
62.07% |
33.71 |
| Crown Big Centres |
855 |
2005 |
1150 |
134.50% |
51.54% |
48.46% |
18.93 |
| Medium Centres |
559 |
1898 |
1339 |
239.54% |
41.14% |
58.86% |
29.27 |
| Crown Medium Centres |
909 |
2160 |
1251 |
137.65% |
50.11% |
49.89% |
18.94 |
| Small Centres |
171 |
471 |
300 |
175.44% |
49.21% |
50.79% |
20.78 |
| Peri-urban Rural Communes |
1214 |
2305 |
1091 |
89.84% |
55.46% |
44.54% |
13.48 |
| Agricultural Communes |
811 |
1250 |
439 |
54.13% |
66.24% |
33.76% |
8.08 |
| Tourist Communes |
380 |
761 |
381 |
100.26% |
58.92% |
41.08% |
12.29 |
AED overcoverage by municipality type
Under the
current 24-hour AED availability scenario, the national mean buffer overlap is
1.3 with municipality-level means ranging from 1.1 (Agricultural Communes) to 1.5
(Secondary Centres). The median overlap across all types remains 1.0. The
maximum observed overlap is 41, while standard deviations range from 0.4 to 2.1,
and the coefficient of variation spans 0.3 to 1.3. In Big Centres, 70% of AEDs have
single coverage; in Agricultural Communes it is 90%. The proportion of extreme
overlap (three or more overlapping AEDs) relative to area with any overlapping coverage
ranges from 1% (Agricultural Communes) to 11% (Medium Centres). In terms of
population exposure, 28.6% of the AED-covered population resides in areas with
overcoverage (≥2 AEDs), with values ranging from 19.4%
(Agricultural Communes) to 36.8% (Medium Centres). As a share of the total
population, overcoverage ranges from 5.0% to 10.9% with a national average of
8.3% (table 3).
Table 3AED coverage density and population overcoverage
under “24-hour AEDs” accessibility, by municipality type. Zone-based
indicators quantify AED buffer overlap for the existing network of currently 24-hour-accessible
devices.
AED coverage was modelled using 300-metre buffers rasterised at 10-metre
resolution. “Mean”, “Median”, “Max”, “Standard deviation (Std. Dev.)” and
“Coefficient of variation (CV)” describe the distribution and variability of
overlap intensity. “Single coverage” and “Extreme overlap” represent the
proportion of raster cells with exactly one AED or with three or more
overlapping AEDs, respectively, relative to all cells within AED-covered
areas. Population-based indicators quantify residents located in overcovered
zones (two or more overlapping buffers), expressed as a percentage of the
AED-covered population (“Overcoverage within covered areas (%)”) and of the
total national population (“Overcoverage of total population (%)”).
| Municipality type |
Zones |
Population |
| Mean coverage |
Median coverage |
Max coverage |
_Hlk202977826Std. dev. coverage |
CV coverage |
Single coverage |
Extreme overlap |
Overcoverage within
covered areas (%) |
Overcoverage of total
population (%) |
| Aggregate national
value |
1.26 |
1 |
41 |
0.80 |
0.63 |
0.82 |
0.05 |
28.61% |
8.28% |
| Big Centres |
1.47 |
1 |
11 |
1.00 |
0.68 |
0.70 |
0.09 |
28.73% |
7.34% |
| Secondary Centres |
1.53 |
1 |
41 |
2.09 |
1.33 |
0.74 |
0.09 |
30.17% |
8.57% |
| Crown Big Centres |
1.27 |
1 |
8 |
0.62 |
0.49 |
0.80 |
0.05 |
27.24% |
8.04% |
| Medium Centres |
1.46 |
1 |
10 |
0.92 |
0.63 |
0.72 |
0.11 |
36.84% |
10.88% |
| Crown Medium Centres |
1.27 |
1 |
8 |
0.63 |
0.50 |
0.81 |
0.05 |
29.34% |
9.08% |
| Small Centres |
1.32 |
1 |
7 |
0.71 |
0.54 |
0.77 |
0.06 |
31.27% |
9.37% |
| Peri-urban Rural Communes |
1.18 |
1 |
6 |
0.50 |
0.43 |
0.86 |
0.03 |
24.00% |
7.45% |
| Agricultural Communes |
1.11 |
1 |
6 |
0.37 |
0.34 |
0.90 |
0.01 |
19.42% |
4.99% |
| Tourist Communes |
1.24 |
1 |
6 |
0.62 |
0.50 |
0.84 |
0.05 |
34.25% |
9.87% |
Figure 2
presents the same indicators, illustrating the relationship between mean
overlap intensity, maximum overlap, extreme overlap proportion and population
overcoverage.
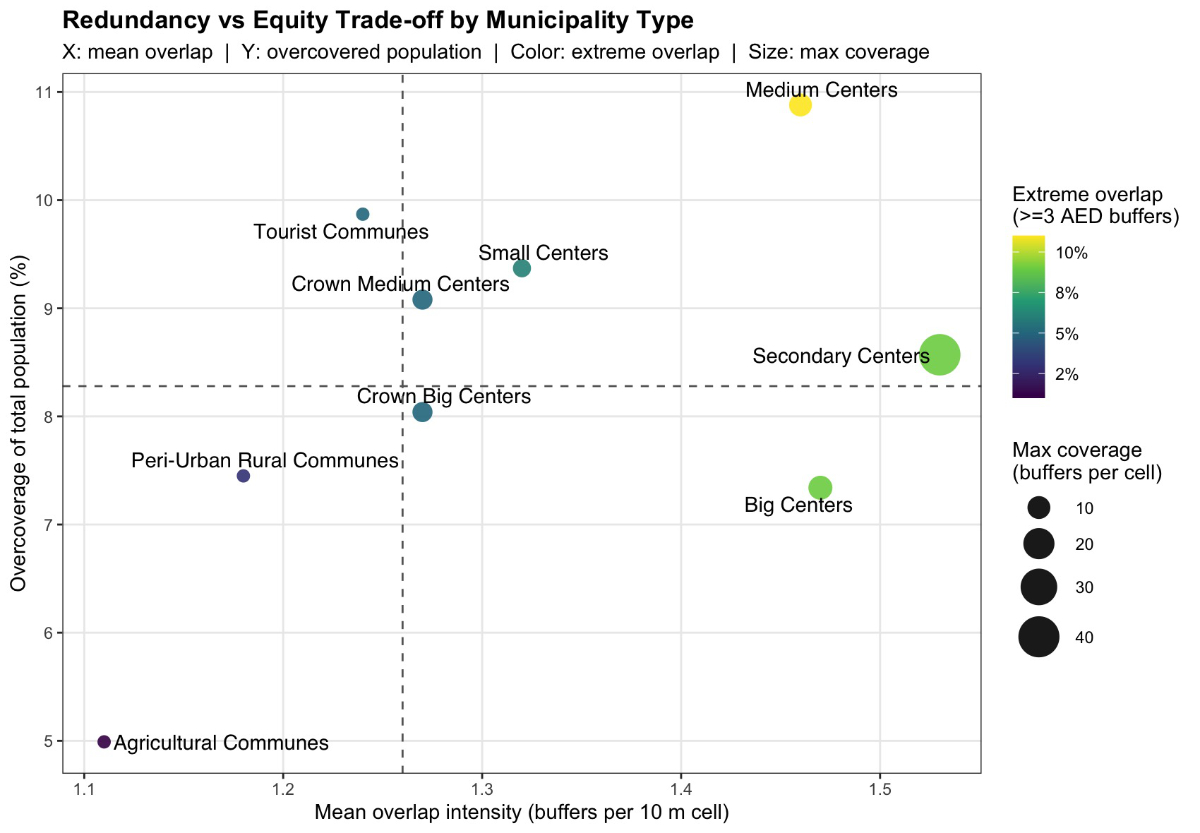
Figure 2Scatterplot showing the relationship between mean AED overlap
intensity (x-axis) and the proportion of the total population living in
overcovered zones (y-axis) across Swiss municipality types under the 24-hour
AEDs scenario. Circle size indicates the maximum number of overlapping AED
buffers per 10-metre raster cell, and colour represents the proportion of AED-covered
area exhibiting extreme overlap (≥3 AED
buffers). Dashed lines mark national mean values for both axes. The figure
illustrates the spatial trade-off between redundancy (multiple overlapping AED
zones) and equity (population share with access), showing that redundancy is
concentrated in urban zones while rural and agricultural communes remain
predominantly single-covered.
With expanded
24-hour accessibility for all AEDs, the national mean overlap increases to 1.8
with a range from 1.3 (Agricultural Communes) to 3.7 (Big Centres). The median
remains 1.0, while the maximum overlap rises to 44. Standard deviations now
range from 0.6 to 4.4, and coefficients of variation from 0.5 to 1.2. The share
of single AED coverage declines, ranging from 34% (Big Centres) to 82%
(Agricultural Communes). Extreme overlap becomes more pronounced, with values
spanning 4% (Agricultural Communes) to 45% (Big Centres). Overcoverage within
the covered population increases to a national average of 54.3%, with
municipality values ranging from 32.2% (Agricultural Communes) to 69.7% (Big
Centres). When considering the total population, overcoverage ranges from 10.9%
(Agricultural Communes) to 45.3% (Big Centres) with a national mean of 28.5% (table
4).
Table 4AED coverage density and population overcoverage
under expanded “All AEDs” accessibility, by municipality type. Zone-based indicators
quantify AED buffer overlap under a
modelled scenario in which all registered AEDs are assumed to be accessible
24 hours. AED coverage was modelled using 300-metre buffers rasterised at
10-metre resolution. “Mean”, “Median”, “Max”, “Standard deviation (Std. Dev.)”
and “Coefficient of variation (CV)” describe the distribution and variability
of overlap intensity. “Single coverage” and “Extreme overlap” represent the
proportion of raster cells with exactly one AED or with three or more
overlapping AEDs, respectively, relative to all cells within AED-covered
areas. Population-based indicators quantify residents located in overcovered
zones (two or more overlapping buffers), expressed as a percentage of the
AED-covered population (“Overcoverage within covered areas (%)”) and of the
total national population (“Overcoverage of total population (%)”).
| Municipality type |
Zones |
Population |
| Mean coverage |
Median coverage |
Max coverage |
Std. Dev coverage |
CV coverage |
Single coverage |
Extreme overlap |
Overcoverage within covered areas (%) |
Overcoverage of total population (%) |
| Aggregate national value |
1.82 |
1 |
44 |
1.91 |
1.05 |
0.65 |
0.17 |
54.30% |
28.50% |
| Big Centres |
3.74 |
1 |
43 |
4.42 |
1.18 |
0.34 |
0.45 |
69.65% |
45.33% |
| Secondary Centres |
2.44 |
1 |
44 |
2.34 |
0.96 |
0.46 |
0.31 |
61.64% |
38.27% |
| Crown Big Centres |
1.64 |
1 |
16 |
1.21 |
0.74 |
0.66 |
0.15 |
46.86% |
22.75% |
| Medium Centres |
2.39 |
1 |
28 |
2.25 |
0.94 |
0.49 |
0.30 |
61.70% |
36.36% |
| Crown Medium Centres |
1.68 |
1 |
19 |
1.34 |
0.80 |
0.65 |
0.15 |
48.75% |
24.35% |
| Small Centres |
2.03 |
1 |
15 |
1.70 |
0.84 |
0.58 |
0.24 |
58.83% |
29.83% |
| Peri-urban Rural Communes |
1.41 |
1 |
18 |
1.00 |
0.70 |
0.76 |
0.08 |
38.46% |
17.20% |
| Agricultural Communes |
1.25 |
1 |
9 |
0.63 |
0.51 |
0.82 |
0.04 |
32.15% |
10.92% |
| Tourist Communes |
1.44 |
1 |
22 |
1.15 |
0.80 |
0.76 |
0.09 |
51.88% |
21.41% |
Figure 3 presents the corresponding
distribution for the All AEDs scenario, illustrating the intensified overlap
patterns and expansion of overcovered population areas.
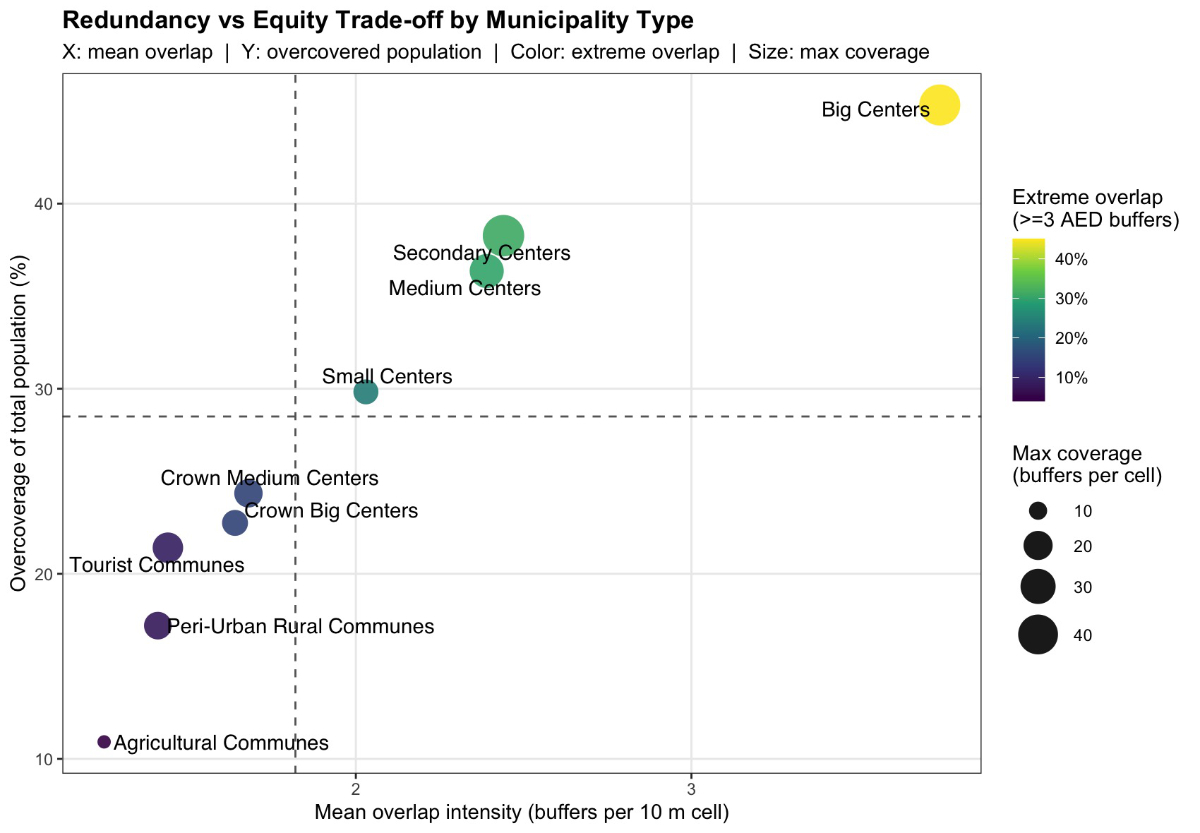
Figure 3Scatterplot showing the relationship between mean AED overlap
intensity (x-axis) and the proportion of the total population living in
overcovered zones (y-axis) across Swiss municipality types under the “All AEDs”
scenario. Circle size indicates the maximum number of overlapping AED buffers
per 10-metre raster cell, and colour represents the proportion of AED-covered area
exhibiting extreme overlap (≥3 AED
buffers). Dashed lines mark national mean values for both axes. The figure
illustrates the spatial trade-off between redundancy (multiple overlapping AED
zones) and equity (population share with access), showing that redundancy is
concentrated in urban zones while rural and agricultural communes remain
predominantly single-covered.
Non-parametric tests indicate statistically
significant differences in AED buffer overlap across municipality types in both
scenarios (χ² = 318,052 and χ² = 2,320,102; p <0.001). All pairwise
comparisons are statistically significant based on Bonferroni-adjusted Dunn’s
tests (adjusted p <0.001). Figure S2 in the appendix illustrates this distribution
of AED coverage density by municipality type.
Discussion
Key findings
This study identified
spatial and temporal inequities in AED accessibility across Switzerland. Nationally,
fewer than one-third of the population resides within 300 metres of a 24-hour AED.
Accessibility varied by municipality type, with the lowest access observed in
both highly urbanised centres and rural/agricultural communes. This dual
underperformance challenges the assumption that population concentration
ensures coverage and suggests structural deficiencies in current deployment
practices. Peri-urban and mid-density municipalities performed best, combining
moderate density with favourable spatial layouts that support broad coverage
without excessive overlap. Their patterns offer a practical model for optimising
AED deployment in underserved areas.
Scenario modelling
showed that converting all AEDs to 24-hour availability would increase population
coverage from 28.9% to 51.6%. However, gains were concentrated in Big and
Secondary Centres, while Agricultural and Tourist Communes remained well below
the national average. This indicates that expanding access hours improves
coverage mostly where devices are already present. In areas lacking AEDs, temporal
expansion alone offers limited benefit. Spatial redistribution remains
essential to address persistent deficits.
Overcoverage analysis revealed extreme
clustering in urban areas, with up to 44 AEDs overlapping, while rural zones exhibited
almost exclusively single-device coverage. This imbalance reflects overcoverage
where coverage is sufficient and exclusion where availability is most
constrained. Extreme urban overlap appears driven by logistical convenience or
institutional presence rather than strategy. In rural areas, the lack of overlap
points to basic shortage of devices, not deliberate planning. Without
oversight, both redundant deployment and systemic exclusion persist. These
findings expose a clear disconnect between AED deployment and population need. The
network remains fragmented and inefficient, shaped by local discretion rather
than coordinated public health strategy.
Implications
The spatial
and temporal disparities identified in this study are not incidental. They are
shaped by the absence of coordinated governance, binding regulation, and continued
reliance on voluntary local initiative. Deployment is often left to firms, municipalities
or civil societies based on the assumption that each actor will service its own
population. This model of self-regulation has led to inconsistent coverage and
uneven deployment. Switzerland’s federalist structure enables regional
flexibility, but in the absence of binding regulation, placement decisions
remain uncoordinated and misaligned with population needs. This interpretation
is directly grounded in the observed pattern of undercoverage in both highly
urbanised and rural/agricultural municipalities, where current self-regulated
deployment fails to align with exposure risk. Other countries have recognised
this challenge: England introduced centralised AED placement strategies based
on population need [16];
France
identified major regional disparities and called for coordinated planning [17]; and
Denmark established a national
AED registry with real-time data integration and systematic oversight [18]. In line
with these developments,
Switzerland must prioritise a coordinated deployment strategy that aligns AED
placement with population needs. A legal mandate for 24-hour accessibility could
form part of this broader effort to guarantee accessibility regardless of
ownership or location [9, 16, 18].
Expanding all AED availability to 24 hours
improves temporal access; however, it does not fill spatial gaps where devices
were never installed. Prior studies confirm the benefit of 24-hour availability,
particularly in urban areas: Hansen et al. showed
that over half of OHCAs near AEDs occurred when the devices were inaccessible [7],
and Sun et al. found that accounting
for temporal availability improved modelled coverage by over 25% compared to
spatial-only approaches [9]. Nevertheless, our findings show that this
strategy has limited effect in structurally underserved areas. In rural and
agricultural communes, where AEDs are largely absent, making all existing devices
24-hour-accessible does little to improve the population coverage. Redistribution
of devices is therefore essential. AEDs bridge the critical time until EMS
arrives, a function most vital in regions with prolonged response times. Swiss data
confirm persistent EMS delays in rural areas despite system improvements [19], and
English models link sparse
coverage and delayed arrivals to higher mortality [20]. Our results, coupled with
these
findings, highlight a misalignment: the areas that benefit least from expanded
availability are precisely those where rapid defibrillation is most urgently
needed.
This disparity between exclusion in underserved
areas and excessive overlap urban cores is compounded by inefficient device
concentration in other areas. Our analysis showed excessive overlap in urban
cores, with some locations covered by over 40 AEDs. While a certain level of redundancy
may improve system reliability, overlaps beyond two AEDs offer diminishing
returns and undermine overall efficiency. These patterns were clearly visible
in the buffer overlap results, where extreme overcoverage in some areas
contrasted with coverage gaps in others, confirming earlier national findings
of clustered AED distribution [12]. Prior studies have raised similar
concerns: Aeby et al. showed that retrospective analysis of OHCA locations in parts
of Switzerland can identify inefficient AED clustering, and enable cost-neutral
relocations to expand effective coverage [21]. Sun et al. similarly found that
clustering in high-traffic areas generates spatial inefficiencies and proposed equity-based
optimisation models [9]. Overcoverage persists due to the absence
of regulatory mechanisms to limit oversupply or evaluate whether device
concentration yields meaningful gains in coverage or survival. Without such
evaluation, clustering can create the illusion of accessibility while leaving
other areas underserved. The coexistence of extreme overlap and population
segments entirely excluded from AED coverage stresses the need for
redistribution, not just expansion.
Not all areas
perform poorly. Peri-urban and mid-density municipalities consistently outperformed
others in both accessibility and overlap metrics. Their moderate density and
favourable spatial form supported broad coverage without excessive clustering. This
suggests that spatial configuration and functional layout may matter more than
population size or simple urban-rural distinction. In other words, geographic
typology and not just density shapes coverage potential. This perspective is
supported by prior research that has moved beyond binary urban-rural classifications:
Brown et al. optimised AED placement in England using walking distance and land
use-based points of interest [16], while others have integrated
infrastructure-sensitive variables such as pedestrian networks, road
connectivity and built environment intensity to better align deployment with
actual access potential [22, 23]. Our typology-based findings align
with these insights. Mid-density municipalities, with their favourable built
form and functional layout, outperform both urban and rural areas without
formal optimisation, offering a practical, transferable model for improving AED
distribution through typology-informed planning. This highlights the strategic
value of incorporating structural and functional context into deployment
decisions.
Improving AED
access requires integration between public and private stakeholders. Many
devices are installed by private entities but are relied upon as part of the
public response system. Defikarte.ch has advanced centralisation efforts and
offers a functional model for registry-based coordination [11]. But for true system
reliability, its
continued support and expansion are essential. To be fully effective,
participation must be mandatory. Formal coordination mechanisms, legal
registration requirements and shared accountability frameworks are needed to
ensure that all devices, regardless of ownership, contribute to a reliable and
equitable emergency network [24].
The methods in this study provide a foundation
for strategic planning. Typology-based disaggregation, buffer overlap and
population-weighted accessibility offer actionable indicators of both
inefficiency and exclusion. These tools should be embedded in regular spatial
audits to guide deployment decisions. For example, identifying areas with
extreme overlap or complete coverage gaps provides direct targets for intervention
and risk mitigation. Unless guided by structured oversight and deliberate
reallocation, future AED expansion will likely perpetuate existing geographic
imbalances. The methodological approach used here integrates empirical
statistical metrics, typology analysis and accessibility modelling and can be
adapted for use in other decentralised systems facing similar coordination
challenges.
Limitations and strengths
Several limitations should be considered when
interpreting these findings. AED data were sourced from a community-driven,
continuously updated registry based on OpenStreetMap infrastructure. Although
it represents the most extensive dataset currently available, registration is
voluntary and unvalidated so completeness cannot be verified. Regional
participation may vary, and results should therefore be interpreted as
conservative lower-bound estimates of AED accessibility. The analysis used hectare-level
residential population
grids, which do not capture daytime mobility or non-residential activity
and may underestimate accessibility in workplace or transit areas. Nonetheless,
this proxy remains epidemiologically justified, as approximately 67% of OHCAs in Switzerland
occur in private
residences [25]. The municipality typology
partly compensates for this limitation by integrating commuting and employment
characteristics. Accessibility
was modelled using uniform 300-metre Euclidean buffers, representing standardised
potential retrieval ranges rather than confirmed real-world reach, which would
need to account for barriers such as building configurations, terrain or
vertical access. While this simplification may overestimate reach, it ensures
reproducibility and comparability across municipalities and countries. The
resulting bias is conservative, reinforcing confidence in the persistence of
identified coverage gaps. Overcoverage likewise quantifies spatial redundancy,
not functional inefficiency, considering that multiple AEDs within a high-traffic
facility may be appropriate. These definitions are intentionally structural,
providing transparent, reproducible measures of spatial equity rather than
behavioural performance indicators of how devices are used. Accordingly, the
results reflect infrastructure efficiency and do not directly measure clinical
effectiveness or survival outcomes.
This study also brings several strengths.
Unlike most AED research, which is often limited to individual cities or broad
urban–rural comparisons, this analysis covers the entire country at high
spatial resolution. It uses a functional municipality typology that reflects
commuting patterns, density and access, allowing for more precise analysis of
equity. The study also combines spatial and temporal availability,
distinguishing between currently accessible AEDs and those that could be made
available at all hours. While most studies treat expanded 24-hour availability
as a sufficient solution, this analysis demonstrates that time-based access
alone does not resolve underlying spatial gaps, particularly in rural and
underserved areas. In addition, the analysis
explicitly addresses AED overcoverage, a rarely examined aspect in the
literature. By quantifying the extent and variation of spatial redundancy, the
study sheds light on inefficiencies in heavily serviced urban zones and stresses
the need for more coordinated deployment strategies. The focus on
underserved areas, paired with policy-relevant scenario modelling, helps move
beyond description and points to concrete options for improving emergency
preparedness.
Conclusion
This national
analysis revealed pronounced spatial and temporal disparities in public AED
accessibility across Switzerland, shaped by the country’s decentralised and
voluntary deployment model. Expanding all AEDs to 24-hour availability improves
overall coverage but leaves structural inequities largely unchanged, with
persistent undercoverage in rural and tourist areas and inefficient clustering
in urban cores. These findings point to systemic inefficiencies in both
accessibility and coverage balance. To strengthen equity and reliability in
defibrillation access, national efforts should prioritise spatial
redistribution of devices, mandate 24-hour accessibility and establish
coordinated planning frameworks that align AED deployment with population needs
and emergency response capacity.
Data sharing statement
This study used publicly available, geospatial
datasets. AED location data, as of 14 December 2024, were obtained from the
Defikarte.ch repository maintained by Christian Nüssli and the OpenBrackets
Association, accessible at https://github.com/OpenBracketsCH/defi_data.
These data are licensed under the MIT License and updated daily via Overpass
API automation. Population grids and municipality typologies were obtained from
the Swiss Federal Statistical Office (FSO) and are available at https://www.bfs.admin.ch
and https://www.geo.admin.ch.
All spatial and statistical
analyses were performed under open-source environments and general public
license (GPL). Geospatial processing was conducted in QGIS 3.32 (EPSG:2056) and R
4.3.2 using the following packages: sf (v1.0-20, GPL-2 |
GPL-3), terra (v1.8-21, GPL-3), exactextractr (v0.10.0, GPL-3), ggspatial (v1.1-10, GPL-3), car (v3.1-3, GPL-2 |
GPL-3) and the tidyverse collection (GPL-2 | GPL-3) for
data management and visualisation.
All code was written in R using reproducible
workflows and standardised syntax for spatial operations and statistical
testing. The analysis pipeline relied exclusively on open-source tools and does
not contain proprietary software or licensed algorithms. Analytical code can be
made available upon reasonable request; no new or unpublished software
libraries were developed for this study.
Acknowledgments
The authors thank Christian Nüssli for his work in
developing and maintaining https://defikarte.ch/, the national AED registry that served
as the primary data source for this study. His contributions to improving AED
transparency and accessibility in Switzerland are gratefully acknowledged.
Sarah Maria Esther Jerjen
University of Lucerne
Faculty of Health Sciences and Medicine
Alpenquai 4
CH–6005 Luzern
sarah.jerjen[at]unilu.ch
References
1. Deakin CD, Nolan JP; European Resuscitation Council. European Resuscitation Council
guidelines for resuscitation 2005. Section 3. Electrical therapies: automated external
defibrillators, defibrillation, cardioversion and pacing. Resuscitation. 2005 Dec;67 Suppl
1:S25–37. doi: https://doi.org/10.1016/j.resuscitation.2005.10.008
2. Weisfeldt ML, Sitlani CM, Ornato JP, Rea T, Aufderheide TP, Davis D, et al.; ROC Investigators.
Survival after application of automatic external defibrillators before arrival of
the emergency medical system: evaluation in the resuscitation outcomes consortium
population of 21 million. J Am Coll Cardiol. 2010 Apr;55(16):1713–20. doi: https://doi.org/10.1016/j.jacc.2009.11.077
3. Ibrahim WH. Recent advances and controversies in adult cardiopulmonary resuscitation.
Postgrad Med J. 2007 Oct;83(984):649–54. doi: https://doi.org/10.1136/pgmj.2007.057133
4. Swiss Resuscitation Council. Jahresbericht 2023. Annual Report, Bern: Swiss Resuscitation
Council SRC.
5. Strauss C, Bildstein G, Efe J, Flacher T, Hofmann K, Huggler M, et al. Optimizing
Emergency Medical Service Structures Using a Rule-Based Discrete Event Simulation-A
Practitioner’s Point of View. Int J Environ Res Public Health. 2021 Mar;18(5):2649.
doi: https://doi.org/10.3390/ijerph18052649
6. Lee SG, Park JH, Ro YS, Hong KJ, Song KJ, Shin SD. Time to first defibrillation and
survival outcomes of out-of-hospital cardiac arrest with refractory ventricular fibrillation.
Am J Emerg Med. 2021 Feb;40:96–102. doi: https://doi.org/10.1016/j.ajem.2020.12.019
7. Hansen CM, Wissenberg M, Weeke P, Ruwald MH, Lamberts M, Lippert FK, et al. Automated
external defibrillators inaccessible to more than half of nearby cardiac arrests in
public locations during evening, nighttime, and weekends. Circulation. 2013 Nov;128(20):2224–31.
doi: https://doi.org/10.1161/CIRCULATIONAHA.113.003066
8. Karlsson L, Malta Hansen C, Wissenberg M, Møller Hansen S, Lippert FK, Rajan S, et
al. Automated external defibrillator accessibility is crucial for bystander defibrillation
and survival: A registry-based study. Resuscitation. 2019 Mar;136:30–7. doi: https://doi.org/10.1016/j.resuscitation.2019.01.014
9. Sun CL, Demirtas D, Brooks SC, Morrison LJ, Chan TC. Overcoming Spatial and Temporal
Barriers to Public Access Defibrillators Via Optimization. J Am Coll Cardiol. 2016 Aug;68(8):836–45.
doi: https://doi.org/10.1016/j.jacc.2016.03.609
10. Moens E, Degraeuwe E, Caputo Maria L, Cresta R, Arys R, Van Moorter N, et al. A roadmap
to building first responder networks: lessons learned and best practices from Belgium
and Switzerland. Resusc Plus. 2023 Sep;16:100469. doi: https://doi.org/10.1016/j.resplu.2023.100469
11. Nüssli C. https://defikarte.ch/.
12. Jerjen SM, Gemperli A. Spatiotemporal disparities in automated external defibrillator
access: identifying national deficits. Resusc Plus. 2025 Oct;26:101135. 10.1016/j.resplu.2025.101135; Epub ahead of print.
13. Federal Statistical Office. Population and Households (STATPOP) 2023, https://www.bfs.admin.ch/bfs/en/home/services/geostat/swiss-federal-statistics-geodata/population-buildings-dwellings-persons/population-housholds-from-2010.html
14. Federal Office of Spatial Development. Typology of Municipality, https://www.bfs.admin.ch/bfs/en/home/statistics/territory-environment/nomenclatures/gemtyp.html (2014).
15. Basanta Camiño S, Navarro Patón R, Freire Tellado M, Barcala Furelos R, Pavón Prieto MP,
Fernández López M, et al. Assessment of knowledge and skills in using an Automated
External Defibrillator (AED) by university students. A quasi-experimental study. Med
Intensiva. 2017;41(5):270–6. doi: https://doi.org/10.1016/j.medine.2017.04.005
16. Brown TP, Andronis L, El-Banna A, Leung BK, Arvanitis T, Deakin C, et al. Optimisation
of the deployment of automated external defibrillators in public places in England.
Health Soc Care Deliv Res. 2025 Feb;13(5):1–179. doi: https://doi.org/10.3310/HTBT7685
17. Karam N, Narayanan K, Bougouin W, Benameur N, Beganton F, Jost D, et al. Major regional
differences in Automated External Defibrillator placement and Basic Life Support training
in France: further needs for coordinated implementation. Resuscitation. 2017 Sep;118:49–54.
doi: https://doi.org/10.1016/j.resuscitation.2017.07.002
18. Karlsson L, Hansen CM, Wissenberg M, Hansen SM, Lippert F, Rajan S, et al. Implementation,
Temporal Changes, and Follow up of a Nationwide AED-Network. Resuscitation. 2016;106:e10.
doi: https://doi.org/10.1016/j.resuscitation.2016.07.024
19. Strauss C, Schmid M, Kliem D, Müller M. Insights from a Decade of Optimizing Emergency
Medical Services Across Three Major Regions in Switzerland. Emerg Care Med. 2024;1(4):368–81.
doi: https://doi.org/10.3390/ecm1040036
20. Harries M, Ushakova A. Modelling emergency response times for Out-of-Hospital Cardiac
Arrest (OHCA) patients in rural areas of the North of England using routinely collected
data. BMC Emerg Med. 2025 Jan;25(1):8. doi: https://doi.org/10.1186/s12873-025-01170-7
21. Aeby D, Staeger P, Dami F. How to improve automated external defibrillator placement
for out-of-hospital cardiac arrests: A case study. PLoS One. 2021 May;16(5):e0250591.
doi: https://doi.org/10.1371/journal.pone.0250591
22. Despoina K, Evangelos K, Yiannis B; Science IJ of SR in C. Ijsrcseit E and IT. Strategic
Mapping and Optimised Allocation of Automated External Defibrillators in Urban Areas.
Int J Sci Res Comput Sci Eng Inf Technol. 2020 Jan;1:138–45. 10.32628/CSEIT206617; Epub ahead of print.
23. Wu C, Wu Y, Qiao L. Revealing the decision-making practices in automated external
defibrillator deployment: insights from Shanghai, China. BMC Public Health. 2025 Jan;25(1):152.
doi: https://doi.org/10.1186/s12889-025-21341-2
24. Centers for Disease Control and Prevention. Public Access Defibrillation (PAD) State
Law Fact Sheet. Cardiovascular Disease Data, Tools, and Evaluation Resources, https://www.cdc.gov/cardiovascular-resources/php/pad-slfs/index.html (2024, accessed 3 July 2025).
25. Schweizerische Register Ausserklinischer Kreislaufstillstände. Kurzbericht 2023. Kurzbericht
2023, Schweizerische Register Ausserklinischer Kreislaufstillstände.
Appendix
The appendix is available in the pdf version of the article at https://doi.org/10.57187/4928.