Energy consumption of cardiology intervention units: a comparative study of operational
modes and procedure types
DOI: https://doi.org/https://doi.org/10.57187/4873
Hannah Stauba,
Christophe A. Wyssab,
Oliver Gämperliab,
Peter Wenaweserb,
Diana Reserab,
Jürg Grünenfelderab,
Roberto Cortiab,
Patric
Biaggiab
a University of Zurich,
Zurich, Switzerland
b Heart
Clinic Zurich, Zurich, Switzerland
Summary
BACKGROUND: The healthcare sector is a major
contributor to climate change, mainly due to greenhouse gas emissions from
electricity generation. Radiology imaging devices account for considerable
energy consumption, but there is limited knowledge of the energy consumption of
cardiac catheterisation units and of specific cardiac interventions.
OBJECTIVES: To
quantify energy consumption in kilowatt-hours (kWh) during diagnostic and
therapeutic cardiac procedures and to identify potential areas for saving energy.
METHODS: Current
transformers measured true power in three cardiac catheterisation units in May
and June 2024. The data were matched to system operational modes ‘off’, ‘idle’
and ‘intervention’. Clinical software provided information about the intervention
type, operators and dose-area product.
RESULTS: The
total energy consumption was 6647.62 kWh, 76.5% of which was used for
non-productive modes (62.8% ‘idle’ and 13.7% ‘off’). Interventions accounted
for 23.5% of energy consumption and 9.1% of total time. The median (IQR) energy
consumption of 564 performed interventions was 2.20 (2.02) kWh. Coronary
interventions with ≥4 stents (4.86 [1.48] kWh) and mitral valve edge-to-edge
repair (4.37 [2.59] kWh) used the most, while diagnostic coronary angiograms
(0.91 [0.74] kWh) used the least energy from first to last scanning action. Energy
consumption correlated significantly with intervention time (r = 0.98, p <0.001)
and dose-area product (r = 0.62, p <0.001).
CONCLUSION: Non-productive operational modes accounted
for more than ¾ of overall energy consumption. Reducing ‘idle’ energy consumption appears to
have the largest energy-saving potential.
Introduction
Human-induced greenhouse gas emissions have caused an
unprecedented global temperature rise, reaching mean global temperatures of 1.5
°C above pre-industrial levels in recent years [1]. The resulting climate
change has serious consequences for humans and the environment [1]
and jeopardises healthcare systems on a global scale [2].
The combustion of fossil fuels to generate electricity and
heat accounts for 68% of total greenhouse gas emissions, making it the largest
contributor to climate change [3]. Reducing electricity consumption,
increasing energy efficiency and transitioning to renewable energy sources are therefore
sustainable approaches to inhibit the progression of global warming [4].
The healthcare sector itself accounts for 4.4% of net global
greenhouse gas emissions, over half of which result from electricity production [2]. Radiology imaging devices are associated with high energy
consumption and cause up
to 10% of total emissions in healthcare [5, 6]. Computed tomography
and magnetic resonance imaging devices alone account for up to 12.5% of total
hospital energy consumption [7].
Interventional cardiology uses fluoroscopy with potentially
high energy consumption. The environmental impact of catheter units has been
studied in previous research [8, 9]. However, quantitative data on electricity
demand is limited, especially for specific cardiac interventions. This study
aims to quantify energy consumption during cardiac catheter procedures and to
identify potential areas for energy-saving measures.
Methods
The study was performed by Heart Clinic Zurich at Hirslanden
hospital in Zurich, Switzerland, in cooperation with local electricians as well
as InterSys AG (InterSys AG, Zuchwil, Switzerland). InterSys AG provided both
the technical equipment and the corresponding online software. The study was
granted a full waiver of informed consent by the ethics committee of the canton
of Zurich KEK ZH, Switzerland (BASEC-Nr. Req-2023-01484).
Study setting and design
Hirslanden hospital is a tertiary care medical centre with
advanced imaging technology, with three catheter units performing
cardiology interventions. For two months, installed power meters logged energy
measurements in real time for all three units, which were then matched to
patient records for further analysis. A prospective comparative study was
performed to compare energy consumption of operational modes (‘off’, ‘idle’, ‘intervention’),
different catheter units and procedure types. The primary objective was to
identify operational modes and times where energy efficiency could be optimised
without impairing patient safety or procedure quality. As a secondary objective,
we aimed to provide comparative data on the energy consumption of individual
interventional cardiology procedures. The months May and June were selected
based on calculations of the caseload of previous years. Multiplying the
measured cases by a factor of six matched the annual caseload (error of ±5%).
Current transformers (Shelly Pro 3EM-400; ID-nr.
3800235268117; Shelly Europe Ltd, Sofia, Bulgaria) were installed in three
intervention rooms measuring the electricity consumed by the representative
fluoroscopy system. The ‘system’ consisted of all electricity used for the
C-arm itself, the intervention table, the large intervention monitor, the power
injector for contrast agent as well as computers and screens in the control
room used for intervention guidance as well as pre- and postprocessing of
images and clinical data. Due to technical limitations, we were not able to
separately measure electricity used for light, air conditioning, additional
equipment such as ultrasound machines or ventilators, or independent
electricity plugs. The intervention rooms were each equipped with catheterisation
units by Philips (Philips Healthcare, Netherlands): monoplane Azurion 7M12C in
catheter laboratory (CL) 1, biplane Azurion 7B12 in CL2, monoplane Allura
Clarity FD20 ORT in the hybrid operating room. Monoplane imaging units are
equipped with a single C-arm X-ray, making them more space-efficient and
suitable for general cardiovascular procedures. Repositioning the C-arm may
lead to longer procedure duration and higher contrast use. Biplane scanning
units use dual C-arms, allowing for simultaneous multi-angle imaging, thus
using less contrast and producing 3-dimensional images. They require more
infrastructure and space, but may be suitable for more complex procedures [10].
The monoplane scanning unit in the hybrid operating room was used to treat all
vascular and structural heart diseases, as well as a few non-cardiovascular interventions
without any scanning actions.
The current transformers measured current [A = ampere], voltage [V = volt],
true [W = watt] and apparent [VA = volt-ampere] power at 1-second intervals for 61
consecutive days
(1 May to 30 June 2024). Only true power data are reported in this study. The
mean power consumption was measured in watts [W]. The energy consumption per
second was calculated as kilowatt-hours [kWh] (kWh = W / [3.6 × 10⁶]). The data were
stored in large Excel files and displayed as a continuous bar graph in the software
program Ivaluation (non-licenced, developed by InterSys AG, using telemetry data transmitted
via MQTT-Broker
to an IoT platform [ThingsBoard, ThingsBoard Inc.]), which allowed real-time
comparison of measured data and procedures performed.
Definition of operational modes
We defined operational modes ‘off’, ‘idle’ and
‘intervention’. The ‘off’ mode was defined as continuous power with the systems
turned off. The ‘idle’ mode was defined as continuous power at baseline level
with the catheter unit turned on. During ‘idle’, the unit was fully functional
but no intervention was being performed. The periods from patient entry into
the lab to the beginning of scanning actions and from the last scanning actions
to patient exit from the lab were classified as ‘idle’. Failed procedures were
classified as ‘intervention’. Cut-off values for ‘off’ and ‘idle’ modes were
identified individually per intervention room using Ivaluation. The start of the
‘intervention’ mode was defined as power exceeding baseline power for the first
time in at least 10 minutes and followed by comparable peaks. The end of the ‘intervention’
mode was defined as the absence of power peaks for at least 10 minutes. Ten minutes
was considered the minimal change time between interventions. As the exact
times of patient entry/exit into/from the operating rooms were not recorded
consistently in patient charts, each intervention was defined as the period
between the first and last scanning actions. As the preparation and
deinstallation of the patients did not increase energy consumption, they were
not considered part of intervention energy.
Interventions, dose-area product, operators, costs
The dose-area product (DAP) is calculated as the product of
dose and beam area (mGy × cm2),
an indication of the radiation dose received by a patient [11]. Performed
intervention types, the corresponding DAP and operators were identified using the
clinic’s software (Krankenhausinformationssystem M-KIS, Meierhofer, Germany;
IntelliSpace Cardiovascular, Philips Healthcare). We included all procedures
logged in the cardiovascular image management program in this study. Power
peaks without corresponding entries in the program were reclassified from
‘intervention’ to ‘idle’ and retrospectively identified as function testing
periods. Information about pricing of energy consumption for the time mentioned
was provided by the clinic management. The cost calculation was based on
hospital reference data (1 kWh equals 0.30 CHF), and the Swiss
energy mix was used to calculate CO2 emissions per kWh energy (112 g
CO2 per kWh) [12].
Statistical analysis
We analysed two datasets. The first consisted of daily
records, including number of interventions, operational mode duration, energy
consumption and power per laboratory. No missing values were detected for operational
mode duration, energy consumption, power per laboratory or number of
interventions. Thus, all daily data were analysed. The Shapiro-Wilk test indicated
non-normal distribution of power consumption within each laboratory and operational
mode. Therefore, medians and interquartile ranges (IQR) are reported.
The second dataset comprised individual procedures with
their associated type, duration, energy consumption, DAP, operator and
laboratory. Procedures lacking information on intervention type (e.g. failed
procedures) or without any scanning actions were excluded from type-specific
analysis. Outliers among successful interventions were retained. For all other
variables, missing data were minimal and not imputed. The Shapiro-Wilk test revealed
non-normality. Consequently, statistics are reported as medians and IQRs. For every
intervention type, Spearman’s rank
correlation was applied to assess the associations between energy consumption
and the variables dose-area product (DAP) and duration. A Kruskal-Wallis test was
used for specific
intervention types to assess whether energy consumption differed between
monoplane CL1 and biplane CL2. We applied the one-sample Wilcoxon signed-rank
test to evaluate whether energy consumption values for individual operators
differed from the overall operator median. The sample size precluded comparison
of operators for individual intervention types. Energy consumption differences between
intervention types were not assessed, as clinical indication and not energy
efficiency determines which procedure is applied.
We defined a p-value of <0.05 as statistically
significant. Statistical analysis was performed using RStudio 2024.09.0+375 and
Microsoft Excel version 2501.
Results
Overall energy consumption
During the two months of data collection, the energy
consumption in the three intervention rooms was 6647.62 kWh (table 1). Most of
the energy was used for the non-productive mode ‘idle’ (62.8%), while
interventions contributed to 23.6% of total energy consumption (figure 1). 37.1%
of time was spent with the catheter unit ready for scanning action (‘idle’ or
‘intervention’ mode), equivalent to 8.9 hours per day. The least time was spent
during interventions (9.1% or 2.2 hours, figure 1).
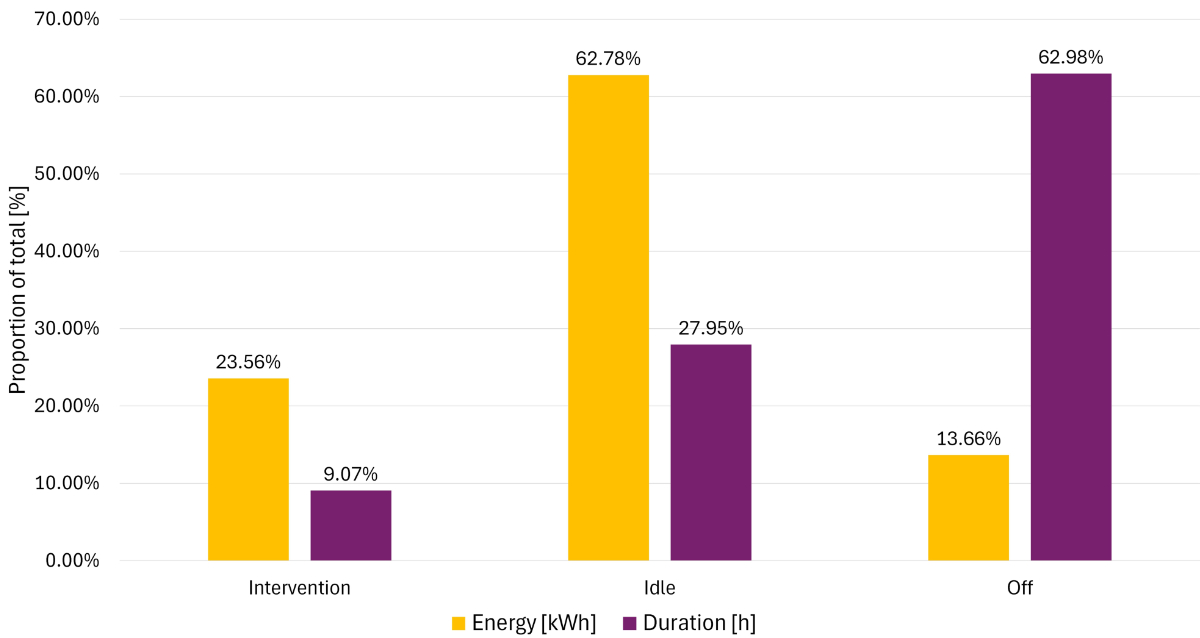
Figure 1Total
proportions of energy [kWh] and duration [h]. Total proportion of energy
consumption (kWh) and operating time (h) for ‘intervention’, ‘idle’ and ‘off’ modes
in catheter laboratories. The majority of energy is consumed during the ‘idle’ mode.
Energy per intervention room
For monoplane CL1, the median power output was lower in
‘intervention’ and ‘idle’ compared to biplane CL2 and monoplane hybrid
operating room (figure 2). Switching from ‘off’ to ‘idle’ increased power
output by 2500–3400 W (an increase of 860–1501%), depending on the catheter
unit. The power needed for image generation during interventions further
increased median power consumption by about 600 W in all three systems (17–21%
increase compared to ‘idle’ mode).
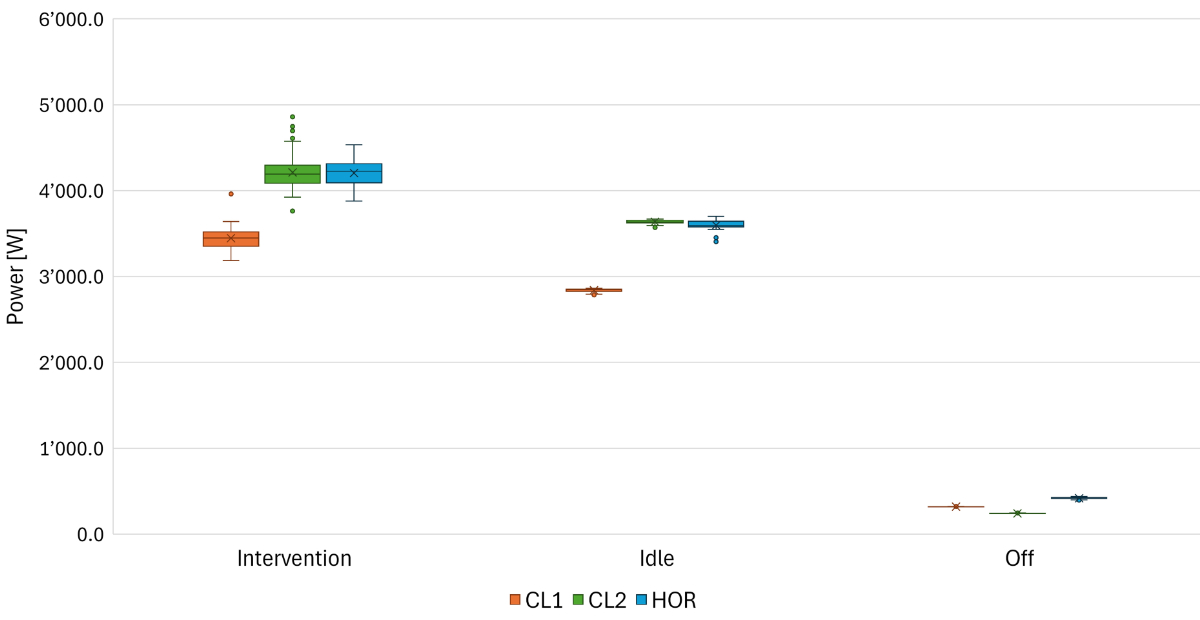
Figure 2Median power [W]
by operational mode. Boxes represent interquartile range (IQR), depicting
central 50% of data points between first and third quartiles. The horizontal
line in each box marks the median. Whiskers extend to the most extreme data
points with 1.5 times the IQR and dots indicating outliers. Median power (IQR) by
operational mode (intervention / idle / off) was 3448.09 W (163.79) / 2844.32 W
(23.56) / 318.73 W (1.10) for catheter laboratory 1 (CL1); 4190.79 W (168.80) /
3635.76 W (28.27) / 240.78 W (2.28) for catheter laboratory 2 (CL2); and 4225.74
W (215.20) / 3593.95 W (59.46) / 418.14
W (1.07) for the hybrid operating room (HOR).
Biplane CL2 had the highest total energy consumption (37.6%
of combined total energy, table 1) and the highest energy consumption for
interventions (figure 3), while also having the longest active state (‘idle’
and ‘intervention’ time). In all three rooms, the largest amount of energy was
consumed during the ‘idle’ mode (figure 3).
| Total number of
interventions, n |
564 |
| ... Coronary, n
(%) |
449 (79.61%) |
| ... Structural heart
disease, n (%) |
90 (15.96%) |
| ... Other, n (%) |
25 (4.43%) |
| Total number of
operators, n |
21 |
| ... Operators with
>10 interventions, n (%) |
11 (52.38%) |
| Days analysed, n |
183 |
| ... Days with
interventions, n (%) |
133 (72.68%) |
| ... Days without
interventions, n (%) |
50 (27.32%) |
| Total energy
consumed in kWh |
6647.62 |
| Energy per
operating room in kWh (%) |
|
| ... CL1 |
1747.38 (26.29%) |
| ... CL2 |
2496.42 (37.55%) |
| ... Hybrid operating
room |
2403.96 (36.16%) |
| Energy per operational
mode in kWh (%) |
|
| ... ‘Intervention’ |
1566.30 (23.56%) |
| ... ‘Idle’ |
4173.54 (62.78%) |
| ... ‘Off’ |
907.78 (13.66%) |
| Median energy per
intervention in kWh (IQR) |
2.20 (2.02) |
| Total time in h |
4392 |
| Total intervention
time in h (% total time) |
398.33 (9.07%) |
| ... CL1 |
140.41 (9.59%) |
| ... CL2 |
161.97 (11.06%) |
| ... Hybrid operating
room |
95.96 (6.55%) |
| Median time per
intervention in h (IQR) |
0.57 (0.48) |
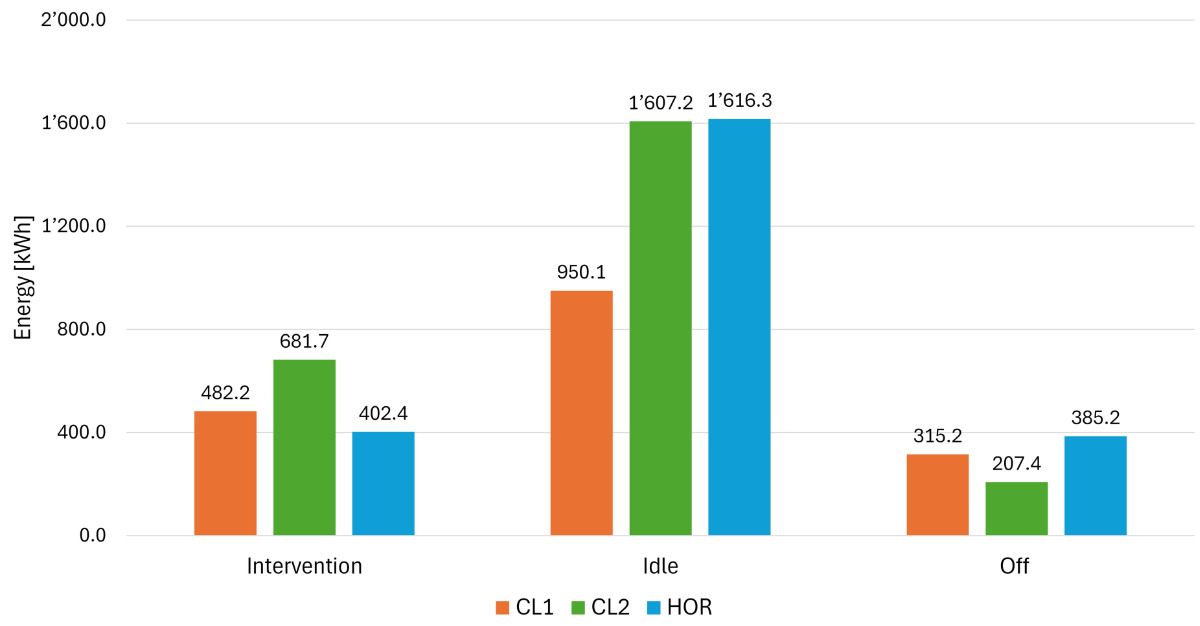
Figure 3Median power [W]
Total energy
consumption [kWh] in two months. The total energy consumption (EC) for two
months was highest in catheter laboratory (CL) 2, followed by the hybrid
operating room (HOR) and CL1. CL2 had the highest energy consumption during the
energy-intense ‘intervention’ mode and the lowest energy consumption during the
‘off’ mode.
Energy per intervention
Of 183 days, procedures were carried out on 133 days. Of the
50 days without interventions using a scanning unit (public holidays, weekends),
24 occurred in the hybrid operating room, which is primarily used for elective structural
coronary and vascular interventions and therefore never used for emergencies. During
the 61 days analysed in three operating rooms, 564 interventions were
conducted, with the majority (79.6%) being coronary procedures, followed by
procedures for structural heart disease (16.0%, table 1). For each intervention
type, median DAP, duration and energy consumption from first to last scanning
action per intervention type are reported in table 2.
Table 2Median duration, dose-area product (DAP) per intervention
type; Spearman’s rank correlation coefficients between energy and duration/DAP,
and stratified by intervention type.
| Procedure type |
n |
Duration [h] |
Energy [kWh] |
DAP [mGy × cm] |
Spearman’s rank correlationEnergy - Duration |
Spearman’s rank correlationEnergy - DAP |
| Median |
IQR |
Median |
IQR |
Median |
IQR |
Correlation coefficient |
p-value |
Correlation coefficient |
p-value |
| Diagnostic coronary angiogram |
144 |
0.24 |
0.20 |
0.91 |
0.74 |
14.08 |
12.40 |
0.975 |
<0.001 |
0.547 |
<0.001 |
| Combined left and right heart catheterisation |
44 |
0.43 |
0.16 |
1.60 |
0.68 |
17.01 |
19.71 |
0.921 |
<0.001 |
0.417 |
0.005 |
|
| PCI with 1 DES |
73 |
0.59 |
0.31 |
2.25 |
1.02 |
27.61 |
20.84 |
0.939 |
<0.001 |
0.333 |
0.004 |
| PCI with 2 DES |
63 |
0.74 |
0.53 |
2.97 |
2.01 |
34.64 |
48.58 |
0.947 |
<0.001 |
0.434 |
<0.001 |
| PCI with 3 DES |
24 |
0.75 |
0.34 |
2.79 |
1.06 |
33.41 |
26.94 |
0.943 |
<0.001 |
0.234 |
0.271 |
| PCI with ≥4 DES |
25 |
1.29 |
0.57 |
4.86 |
1.48 |
42.37 |
35.31 |
0.898 |
<0.001 |
0.608 |
0.002 |
|
| PTCA with drug-eluting balloon DEB |
19 |
0.67 |
0.30 |
2.53 |
0.96 |
34.16 |
26.50 |
0.960 |
<0.001 |
0.756 |
<0.001 |
| PCI with 1 DES and ≥1 DEB |
28 |
0.96 |
0.58 |
3.63 |
2.35 |
48.41 |
63.03 |
0.961 |
<0.001 |
0.472 |
0.011 |
| PCI with 2 DES and ≥1 DEB |
18 |
0.82 |
0.55 |
3.35 |
2.15 |
31.61 |
42.69 |
0.861 |
<0.001 |
0.309 |
0.212 |
| PCI with 3 DES and ≥1 DEB |
5 |
0.86 |
0.29 |
3.14 |
0.98 |
36.92 |
13.47 |
1.000 |
0.017 |
0.300 |
0.683 |
|
| Transcatheter arterial valve implantation (TAVI) |
54 |
0.65 |
0.25 |
2.86 |
1.19 |
31.97 |
53.83 |
0.992 |
<0.001 |
0.557 |
<0.001 |
| Mitral transcatheter edge-to-edge repair |
18 |
1.01 |
0.62 |
4.37 |
2.59 |
22.56 |
35.60 |
0.995 |
<0.001 |
0.614 |
0.008 |
| Tricuspid transcatheter edge-to-edge repair |
8 |
0.97 |
0.67 |
3.95 |
2.83 |
33.33 |
24.53 |
1.000 |
<0.001 |
0.833 |
0.015 |
| Percutaneous patent foramen ovale closure |
8 |
0.41 |
0.15 |
1.41 |
0.62 |
7.07 |
5.25 |
0.994 |
<0.001 |
0.595 |
0.132 |
| Percutaneous left atrial appendage closure |
2 |
0.74 |
0.41 |
2.89 |
1.51 |
9.84 |
1.75 |
NA |
NA |
NA |
NA |
|
| Pacemaker implantation |
6 |
0.48 |
0.17 |
1.89 |
0.68 |
14.79 |
4.29 |
1.000 |
0.003 |
0.200 |
0.783 |
| Non-coronary mixed interventionsc |
8 |
0.51 |
0.99 |
1.84 |
3.32 |
14.98 |
44.20 |
0.976 |
<0.001 |
0.690 |
0.069 |
| EVAR; CERAB |
17 |
0.83 |
0.72 |
3.36 |
2.71 |
290.09 |
164.85 |
0.987 |
<0.001 |
0.397 |
0.116 |
| Total |
564 |
0.57 |
0.48 |
2.20 |
2.02 |
25.48 |
36.57 |
0.983 |
<0.001 |
0.618 |
<0.001 |
The lowest median energy consumption was achieved during
diagnostic angiograms at 0.91 kWh (IQR: 0.74), also accounting for the shortest
median intervention time at 0.24 h (IQR: 0.20). Coronary interventions with 4
or more stents had the highest energy consumption (4.86 kWh, IQR: 1.48), also
being the longest interventions (1.29 h, IQR: 0.57). Overall, energy
consumption correlated significantly with both the duration and the DAP (r =
0.98 and r = 0.62, respectively, both p <0.001). Energy consumption also
depended on the intervention room, being lower in monoplane CL1 compared to biplane
CL2 for two of the three most performed procedures (figure 4).
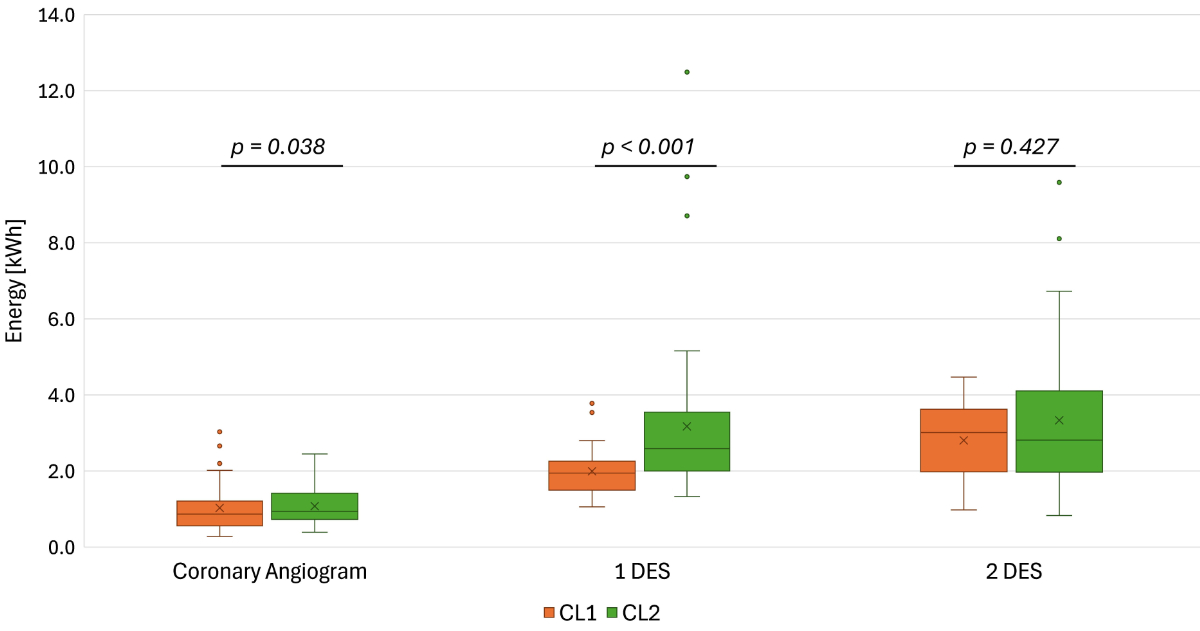
Figure 4Median power [W]
Median Energy Consumption [kWh] per intervention in
CL1, CL2. Boxes represent interquartile range (IQR), depicting central 50% of
data points between first and third quartiles. The horizontal line in each box
marks the median. Whiskers extend to the most extreme data points with 1.5
times the IQR and dots indicate outliers. Biplane catheter laboratory (CL) 2
exhibits higher median energy consumption for 1 drug-eluting stent (DES) (p
<0.001) and for coronary angiogram (p = 0.038) when compared to monoplane
CL1. Performing procedures in CL1 reduces energy consumption.
Energy per operator
11 of the 21 medical professionals performing interventions
conducted more than 10 interventions (table 2). For these operators, the total
median energy consumption was 2.19 kWh. The median energy consumption of four operators
differed significantly from this overall value: 1.66 kWh (p = 0.005), 2.99 kWh (p
<0.001), 2.98 kWh (p = 0.003) and 2.59 kWh (p = 0.003). It was not possible
to stratify the median energy consumption per operator by intervention type, due
to limited sample sizes in several combinations of operator and intervention
type. Operators conducted a heterogeneous mix of shorter, less energy-intense
and longer, more energy-intense interventions, which may partially explain the
observed differences in median energy consumption between operators.
Example days
Typical procedure days are illustrated for each catheterisation
unit in figure 5. Between 4 to 6 interventions were performed on the example
days. The peak power output during scanning reached values greater than 20,000 W
in CL2. However, the energy used for actual scanning during an intervention
(also called ‘net imaging’ energy consumption), when regarded as additional to
baseline ‘idle’ energy, contributed only between 6.04% to 25.04% to the total
energy consumption during an intervention.
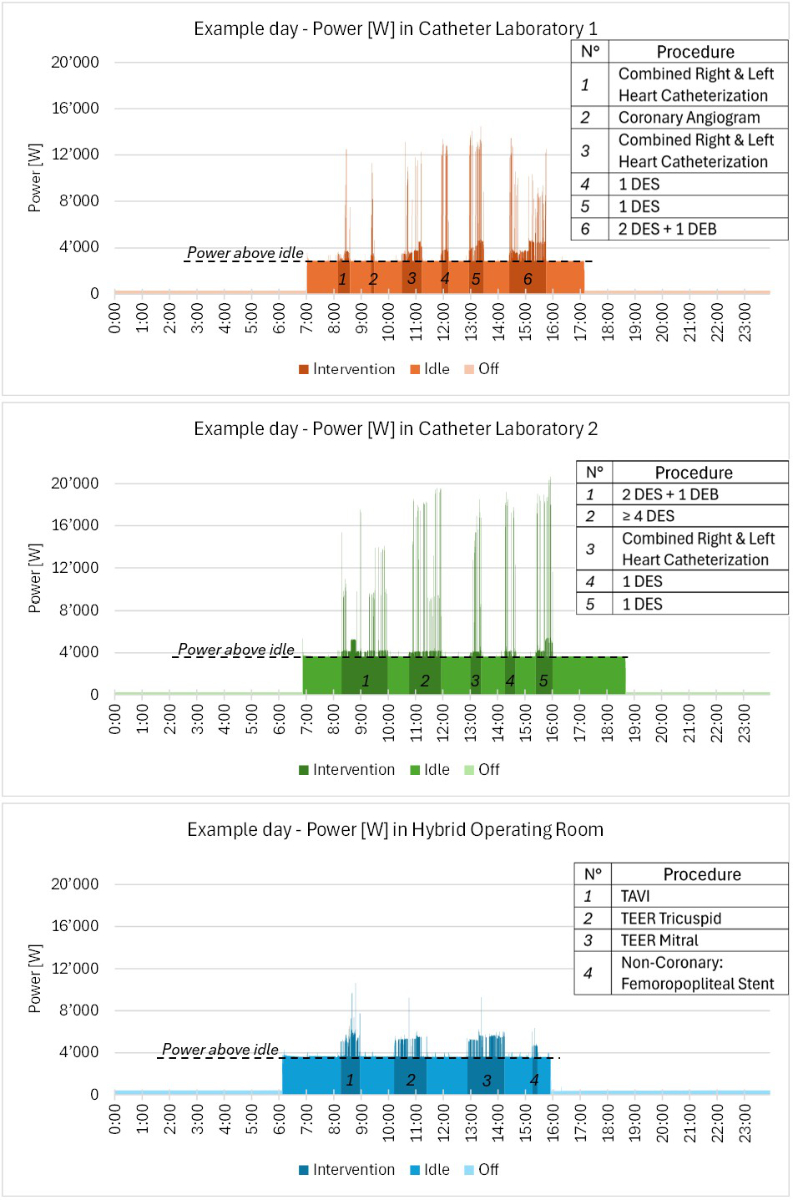
Figure 5Median power [W]
Power [W] on
example days. Manually selected 24-hour period of power output (second-interval
measurements) display a typical distribution of operational modes.
Interventions include implantation of drug-eluting stents (DES) and drug-eluting
balloons (DEB), transcatheter arterial valve implantation (TAVI) and
transcatheter edge-to-edge repair (TEER). During interventions, only 6.04–25.04%
of energy consumption (EC) was due to scanning action (peaks exceeding ‘idle’ mode
energy consumption). Lowering baseline power consumption will decrease energy
consumption even during interventions.
Annual energy consumption, cost and CO2 emissions
During the 2-month measurement period, the type and number
of interventions and the utilisation of the catheter units were comparable to previous
years. Accordingly, the total annual energy consumption was estimated at 39,885.72
kWh, corresponding to CHF 12,037.51 and equivalent to 4.47 tons of CO2
emissions annually.
Discussion
This study reports the energy consumption in three different
cardiology intervention rooms for various operational modes, energy consumption
and duration of performed cardiology interventions and an estimation of CO2
emissions. While there have been studies on the energy consumption of operational
modes of catheter units [9], this study offers a novel detailed
analysis of 564 diagnostic and therapeutic cardiac procedures, sorting them
into 18 groups to compare energy consumption and duration and thus the environmental
impact of each group. The energy consumption showed strong correlation with
both the duration and the dose-area product of interventions.
‘Idle’ mode, a waste of energy
The largest part of total energy was used during the
unproductive ‘idle’ mode (62.8% of total energy consumption). Furthermore, during
the ‘intervention’ mode only 6.04–25.04% of energy consumption was due to
scanning actions, represented by peaks higher than the mean ‘idle’ power. Thus,
an estimated 80% of energy is consumed for non-productive baseline functions
during ‘idle’ and ‘intervention’ modes combined. The literature on
sustainability in radiology departments confirms these findings, as 40–91% of energy
is consumed during non-productive operational modes [9]. Strategies to reduce energy
consumption during the ‘idle’ mode and for baseline functions could yield significant
energy savings [5, 9]. Even though the ‘off’ mode was the longest of any operational
modes, it also contributed the lowest energy consumption, therefore not
offering room to increase energy efficiency.
Strategies for saving energy
There is growing concern about the impact of the healthcare
system on climate change [13]. Implementing operational and
technological energy-saving strategies to reduce energy consumption will
improve energy efficiency and thus reduce greenhouse gas emissions [14].
However, environmental considerations should never influence clinical
decision-making or compromise quality of patient care.
Firstly, ‘idle’ mode duration can be reduced by switching
catheter units on only shortly before interventions and by reducing prolonged
turnover intervals, either by performing more interventions (thus increasing
energy efficiency per patient) or scheduling them closer together. In addition, switching
off scanning units
immediately after the intervention is completed would further reduce 'idle'
mode duration.
For approaches that reduce the ‘idle’ mode by switching the
unit off between patients, it is essential to separate the power supply for
scanning units from other devices in the operating room, as monitoring screens
and computers can currently not be operated when the scanning unit is turned
off. Switching the catheter units on/off increases/reduces power consumption
linearly without any power peaks, thus not increasing energy consumption, takes
less than five minutes and does not wear internal components [9].
Secondly, improved technology could lower energy consumption
with no impact on workflow by lowering power consumption of baseline functions
especially during ‘idle’ and ‘intervention’ modes. However, developing more
energy-efficient scanning units is complex and replacement of currently fully
functioning systems would be neither cost-efficient nor sustainable.
Thirdly, future software may introduce an automated energy-saving
mode as an alternative to the ‘idle’ mode. In such a mode, the fluoroscopy
system would not be ready to scan but recorded scans would be able to be analysed.
Automated energy-saving modes have been implemented in the automobile industry,
leading to considerable fuel savings (26.4%) [15]. Alternatively,
further technical development may allow independent operation of energy-intense
parts of the scanning system (C-arm, patient table, large intervention
monitor).
Such strategies have already proven to be effective. Decreasing
power consumption during the ‘idle’ mode and manually turning off devices lead to
significant energy and cost savings, according to studies performed in
radiology departments [5, 9]. Further research on the energy-saving
potential for devices of different vendors and future products is warranted [16].
The impact of intervention type and operator
This study offers a comparison of three different catheterisation
imaging systems and a detailed analysis of 564 interventions, their duration
and energy consumption. The interventions varied significantly in duration and energy
consumption, with more-complex procedures taking longer and using more energy.
The median energy consumption for a diagnostic coronary angiogram was 0.9 kWh, similar
to a coronary computed tomography (1.3 kWh) but significantly lower than a cardiac
MRI (around
17 kWh) [7]. Although the median energy consumption of four operators
differed significantly from the total median, efforts to save energy at the individual
operator level risk procedure quality and do not harbour the same potential for
energy savings as measures to reduce idle energy consumption. Quantitative data
on the ecological footprint caused by energy consumption of cardiology
interventions allows more precise calculation of greenhouse gas emissions of
scope 3 [17].
The bigger picture
Healthcare accounts for approximately 4.4% of global
emissions [2], with medical imaging alone contributing up to 10% [6]. Electricity
supply and power generation causes 53% of the healthcare sector’s carbon
footprint [2]. Reducing energy consumption alongside decarbonisation of
electricity generation is therefore essential. The annual energy consumption of
the three catheter intervention rooms was projected to be around 40 MWh, which
is comparable to the annual energy consumption of eight 4-person households and
accounts for 0.47% of the hospital’s total energy consumption of 8.5 million kWh in
2022, representing a small but not negligible share of the hospital’s overall energy
consumption [18, 19]. For one year, the energy cost amounted to more than CHF 12,000
and the carbon footprint was calculated as 4.5 tons of CO2, comparable
to the emissions of a car journey around the circumference of the earth [20].
When including the clinic’s two electrophysiology labs, the neuro suite, all computed
tomography
and MRI scanners, the energy consumption is estimated at 10% of the hospital energy
consumption. Implementing technical and operational energy-saving strategies that
reduce ‘idle’ energy could lead to a substantial reduction of energy
consumption, running costs and carbon footprint of cardiac interventions.
Study limitations
This study is limited by the collection of data being
restricted to two months and three different catheterisation rooms not of the
latest generation. Data per intervention are limited, may not be generalised to
other hospitals or compared to newer systems and those of different vendors. Furthermore,
the intervention volume may be higher at other centres, thus having lower turnover
time and ‘idle’ energy consumption.
The definition of an intervention is limited to a period
with peaks of power being above the idle value. Hence, an intervention begins
by the first scanning action and ends with the last scan. Any energy used before the
first scan or after
the last scan was not attributed to the intervention itself.
The measured energy consumption only includes energy that is
part of the fluoroscopy system. All other energy used (air conditioning, light,
power plugs, running anaesthesia and ultrasound equipment) was not measured. The
environmental impact of cardiac catheter procedures beyond energy was not
assessed. The lack of these data leads to an underestimation of the carbon
footprint per intervention and total energy consumption.
Lastly, the CO2 emissions per kWh remain
hypothetical, as the electricity in each country and hospital depends on the
local energy mix (combination of the country’s energy production, export and
import). Switzerland produces most of its electricity from hydropower and other
renewable sources. However, seasonally imported electricity from neighbouring
countries is partly generated from fossil fuels with higher CO2
emissions [12].
Conclusion
This study concludes that energy consumption in three
different cardiology intervention suites is by far highest for the ‘idle’ mode,
harbouring a large energy-saving potential. Energy used for interventions
represents less than 25% of total consumption and correlates with DAP and
intervention duration. Therefore, measures to reduce energy consumption should
be of a technical and operational nature, mainly by reducing the energy
consumption and duration of the ‘idle’ mode. Further research into the effect
of these measures is needed.
Data availability statement
Deidentified study data are not openly available at this
point in time due to the large dataset size and associated logistical
constraints. However, the authors are open to sharing relevant portions of the
raw data on a case-by-case basis. Data may be made available for
non-commercial, academic research purposes, particularly for studies aiming to
improve the energy efficiency of fluoroscopy systems. Data-sharing requests
will be individually evaluated by the first and senior authors of this article
and, if approved, data will be exchanged directly with the requesting
researchers.
Prof. Dr. med. Patric Biaggi
Heart Clinic Hirslanden
Witellikerstrasse 40
CH-8032 Zurich
patric.biaggi [at]hirslanden.ch
References
1. Intergovernmental Panel on Climate Change (IPCC). Summary for policymakers. Climate
Change 2021 – The physical science basis: Working Group I contribution to the sixth
Assessment Report of the Intergovernmental Panel on Climate Change. Cambridge: Cambridge
University Press; 2023. pp. 3–32.
2. Health Care Without Harm, Arup. Health care’s climate footprint: how the health sector
contributes to the global climate crisis and opportunities for action. Reston (VA):
Health Care Without Harm; 2019 Sep.
3. United Nations. Causes and effects of climate change [Internet]. New York: United
Nations; [date unknown] [cited 2025 Feb 20]. Available from: https://www.un.org/en/climatechange/science/causes-effects-climate-change
4. International Renewable Energy Agency (IRENA). World energy transitions outlook 2024:
1.5°C pathway [Internet]. Abu Dhabi: IRENA; 2024 Nov [cited 2025 Feb 20]. Available
from: https://www.irena.org/Publications/2024/Nov/World-Energy-Transitions-Outlook-2024
5. Roletto A, Zanardo M, Bonfitto GR, Catania D, Sardanelli F, Zanoni S. The environmental
impact of energy consumption and carbon emissions in radiology departments: a systematic
review. Eur Radiol Exp. 2024 Feb;8(1):35. 10.1148/radiol.2020192084 doi: https://doi.org/10.1186/s41747-024-00424-6
6. Picano E, Mangia C, D’Andrea A. Climate change, carbon dioxide emissions, and medical
imaging contribution. J Clin Med. 2022 Dec;12(1):215. 10.3390/jcm12010215
7. Heye T, Knoerl R, Wehrle T, Mangold D, Cerminara A, Loser M, et al. The energy consumption
of radiology: energy- and cost-saving opportunities for CT and MRI operation. Radiology.
2020 Jun;295(3):593–605. 10.1148/radiol.2020192084
8. Blitzer D, Meinrenken CJ, Apelgren NB, Chavez XS, Durrenberger O, Jagdish AS, et al. Carbon
emission analysis of aortic valve replacement: the environmental footprint of transcatheter
vs. surgical procedures. Eur Heart J. 2025 Nov;46(44):4810–9. 10.1093/eurheartj/ehaf379
9. Vosshenrich J, Mangold D, Aberle C, Cerminara A, Seifert HH, Osswald S, et al. Interventional
imaging systems in radiology, cardiology, and urology: energy consumption, carbon
emissions, and electricity costs. AJR Am J Roentgenol. 2024 Jun;222(6):e2430988. 10.2214/ajr.24.30988 doi: https://doi.org/10.2214/AJR.24.30988
10. Hutchison C. Bi-Plane vs. Single-Plane Cath Labs: What's the Difference? PatientImage
[Internet]. 2024 Oct 29 [cited 2025 Nov 10]. Available from: https://www.patientimage.com/blog/bi-plane-vs-single-plane-cath-labs
11. Vajuhudeen Z, Ismail M, Wilczek M, et al. Dose area product [Internet]. Radiopaedia.org;
2022 Aug 6 [cited 2025 Nov 10]. doi: https://doi.org/10.53347/rID-80058
12. Thiel D. The CO2 content in Swiss electricity is increasing [Internet]. Brugg, (Switzerland):
aliunid AG; 2023 Apr [cited 2025 Feb 20]. Available from: https://aliunid.com/wp-content/uploads/2023/04/2023-media-information-aliunid-CO2-content-in-Swiss-electricity.pdf
13. Gendy D, Walters H, O’Mahony E, Zaman S. The scope for radiology to contribute to
the NHS net zero target: findings from a survey of radiology staff in the UK. Clin
Radiol. 2022 Aug;77(8):e667–72. 10.2214/ajr.24.30988 doi: https://doi.org/10.1016/j.crad.2022.05.002
14. Khanji MY, Patel R, Ricci F. Going green in cardiology. Eur Heart J. 2024 Feb;45(6):411–2.
10.1093/eurheartj/ehad703
15. Huff S, David S, Boundy R, et al. Auto Stop-Start Fuel Consumption Benefits. SAE Tech
Paper. 2023;2023-01-0346. doi: https://doi.org/10.4271/2023-01-0346
16. Rockall AG, Allen B, Brown MJ, El-Diasty T, Fletcher J, Gerson RF, et al. Sustainability
in radiology: position paper and call to action from ACR, AOSR, ASR, CAR, CIR, ESR,
ESRNM, ISR, IS3R, RANZCR, and RSNA. J Med Imaging Radiat Oncol. 2025 Feb;1754-9485.13842.
10.1111/1754-9485.13842
17. Greenhouse Gas Protocol. Corporate value chain (scope 3) accounting and reporting
standard [Internet]. Washington (DC): World Resources Institute; 2013 Apr [cited 2025
Feb 20]. Available from: https://ghgprotocol.org/sites/default/files/standards/Corporate-Value-Chain-Accounting-Reporing-Standard_041613_2.pdf
18. Bundesamt für Energie (BFE). Stromverbrauch eines typischen Haushalts [Internet].
Bern (Switzerland): BFE; 2021 Aug [cited 2025 Feb 20]. Available from: https://pubdb.bfe.admin.ch/de/publication/download/10559
19. Biaggi P, Wyss C. Ökologische Nachhaltigkeit in der Kardiologie. info@herz+gefäss.
Erlenbach (Switzerland): medinfo AG; 2025 Jan. p. 15.
20. Bundesamt für Statistik (BFS). Umweltindikator – CO2-Ausstoss von Personenwagen [Internet].
Bern (Switzerland): BFS; [cited 2025 Nov 18]. Available from: https://www.bfs.admin.ch/bfs/de/home/statistiken/raum-umwelt/umweltindikatoren/alle-indikatoren/reaktionen-der-gesellschaft/co2-ausstoss-personenwagen.html