
Overview of data acquisition, filtering and analysis in this study.
DOI: https://doi.org/https://doi.org/10.57187/4707
chronic kidney disease
estimated glomerular filtration rate
Kidney Disease: Improving Global Outcomes
model of the end-stage liver disease
Acute and chronic kidney conditions are a major threat to global health with over 850 million patients affected [1]. Impaired kidney function is both a risk for further comorbidities and a crucial factor for survival in critically ill patients [2]. Serum creatinine is an established and the most widely used laboratory parameter for estimating kidney function, as it is produced at a relatively constant rate, freely filtered by the glomeruli and only minimally reabsorbed in the renal tubules [3]. Numerous formulas exist to calculate an estimated glomerular filtration rate (eGFR), a measure for grading the severity of acute kidney injury (AKI) and chronic kidney disease (CKD), as recommended by the Kidney Disease: Improving Global Outcomes (KDIGO) group [4]. Furthermore, the serum creatinine concentration is part of the Model for End-stage Liver Disease (MELD) score, which is used in patients with liver cirrhosis to predict 3-month mortality risk and for prioritisation of liver transplantation [5]. Therefore, reliable and accurate creatinine measurement methods are crucial for clinical decision-making as these scores can meaningfully support, but not replace, interpretation within the clinical context.
Isotope dilution mass spectrometry was named as the reference method for creatinine determination in blood samples by different expert working groups [6]. Due to its high manual workload, this method is unfeasible for routine clinical use. The two established methods, available as fully automated high-throughput kits from various manufacturers, are based on the Jaffe reaction, using picric acid in alkaline conditions, and the more specific enzymatic reaction, using creatininase, creatinase and sarcosine oxidase [7, 8]. Neither method, however, is exempt from interference. Bilirubin is considered to be one of the most relevant chromogens affecting the accuracy of creatinine measurements by both Jaffe and enzymatic assays, with the enzymatic assay being less affected, although some studies challenge this assumption [9–13]. The observed effects are study- and manufacturer-dependent [9, 12]. Studies have shown that inaccuracy in creatinine measurements in patients with hyperbilirubinaemia eligible for liver transplantation may lead to misclassification of patients and affect liver transplant allocation which can result in a life-threatening condition [14, 15]. There are several proposed procedures to eliminate the bilirubin interference with creatinine measurements in clinical samples, such as pretreatment of the sample with oxidising agents like bilirubin oxidase, ultracentrifugation or dilution [16, 17]. However, these kinds of sample pre-treatment are not suitable for daily routine practice using fully automated sample handling and analysis, and in addition lead to increased turnaround time of sample analysis. Several Jaffe reagent kit providers use the “rate blanking” method to minimise interference from bilirubin by using the colour change of the sample in alkaline conditions, without the addition of picric acid, as a correction factor [18]. Cystatin C, a low-molecular-weight protein that is produced at a constant rate and undergoes glomerular filtration but neither reabsorption nor secretion in the tubules, offers an alternative to creatine for kidney function assessment; however it is less available and more costly [19].
We set out to assess the comparability between the Roche Jaffe method, which is currently in use at the Institute of Clinical Chemistry of University Hospital Zurich, and the enzymatic method in routine patient samples. To estimate the clinical impact of bilirubin interference on the two assays, we applied our results to eGFR-based kidney disease staging and the MELD score.
This cross-sectional analytical study included all heparin plasma samples submitted for routine creatinine measurement over a 3-week period (4–24 February 2020), resulting in an anonymised dataset of 15,618 samples. The dataset contains several samples from individual patients with follow-up examinations. The study was conducted under an ethics waiver granted by the Cantonal Ethics Committee of Zurich (BASEC-Nr. Req-2024-01036). The primary outcome of the study was the assay-specific bias between Jaffe and enzymatic creatinine measurements across increasing levels of bilirubin. Secondary outcomes included the impact of this bias on eGFR-based chronic kidney disease staging and MELD score calculation.
The investigation was conducted as a quality assurance project of the Institute of Clinical Chemistry at University Hospital Zurich. The study received an ethics waiver from the cantonal ethics committee of Zurich (Business Administration System for Ethics Committees; BASEC-Nr. Req-2024-01036).
Creatinine concentrations were determined in February 2020 with the Creatinine Jaffe Gen.2 (CREJ2) assay, which is routinely used at our institute and includes rate blanking, and the enzymatic Creatinine plus ver.2 (CREP2) assay, both from Roche, on a Roche Cobas 8000 c702 system. The icteric index, haemolysis index and lipaemia index were measured on a Cobas C502 system. Icteric and haemolysis index correspond approximately to bilirubin and haemoglobin concentrations in mg/dl, respectively. The lipaemia index corresponds to turbidity. According to the manufacturer, the Jaffe assay is interfered by an icteric index >5 for conjugated bilirubin and >10 for unconjugated bilirubin, while the enzymatic assay is interfered by an icteric index >15 for conjugated bilirubin and an icteric index >20 for unconjugated bilirubin.
Over a period of three weeks, from 4 to 24 February 2020, every heparin plasma sample (n = 15,680; median patient age: 60, standard deviation: 17.8 years, male/female ratio: 57%/43%) submitted for creatinine measurement to the Institute of Clinical Chemistry at University Hospital Zurich was included for the method comparison (figure 1). In an anonymised dataset, the creatinine measurements, icteric index, haemolysis index, lipaemia index and eGFR were exported for statistical analysis. Data points with missing values were excluded (n = 49). Lipaemic samples with an index >800 (n = 0) and haemolytic samples with an index >800 (approx. 800 mg/dl haemoglobin) (n = 13) were not included, due to interference with the Jaffe and the enzymatic assay, respectively. The remaining dataset (n = 15,618) was split into a non-icteric dataset (icteric index <5, approx. <5 mg/dl bilirubin) (n = 15,394) and an icteric dataset (icteric index >5, approx. >5 mg/dl bilirubin) (n = 224) for further analysis. For the eGFR calculations, patients aged <18 years were excluded (n = 12).
Overview of data acquisition, filtering and analysis in this study.
To assess the impact of discrepant creatinine concentrations obtained with the Jaffe and enzymatic method in icteric samples, we compared the concordance and discordance of eGFR across different CKD severity stages [4]. eGFR was calculated according to the CKD-EPI 2009 formula [20], which is currently used at University Hospital Zurich, and staged according to KDIGO group guidelines [4]. To assess the potential influence of the discrepancies between the Jaffe and the enzymatic method on clinical decision-making in the icteric samples, we calculated the MELD formula separately with the creatinine results from either method. The MELD score is calculated by summing the logarithmic values of creatinine, bilirubin and International Normalised Ratio (INR) of blood coagulation each with different weights, i.e. 9.57 × ln (creatinine) + 3.78 × ln (total bilirubin) + 11.2 × ln (INR) + 6.43 [5].
The statistical analysis was carried out with the R environment (version 4.4.0) and figures were created with the R package ggplot2 (version 3.3.5) [21]. The linearity of the dataset was checked with the R package lin.eval (version 0.1.2) [22]. For the Deming analysis, the mcr package (version 1.2.2) was used with the jackknife method for estimation of the 95% confidence interval (CI) of the slope and intercept using default settings [23]. The Pearson correlation coefficient (r) was calculated using R Base to assess the strength of the linear relationship between the two assays for non icteric samples (i.e. icteric index ≤5) and for icteric samples (i.e. icteric index >5). For the Bland–Altman analysis, relative bias and standard deviations were calculated with R Base. In the case of clearly visible segregation of the distribution of the relative differences between the two methods at a certain range, mean bias and 95% CI were calculated separately for the diverging sections.
As outlined in figure 1, we focused on non-icteric samples to assess the agreement between Jaffe and enzymatic methods from Roche with unproblematic samples (table S1 in the supplementary Excel file).
The Pearson correlation across this dataset with 15,394 measurements was 0.995 with an intercept of –1.985 µmol/l and a slope of 0.987, as determined with the Deming regression method (figure 2A, table S2). The mean relative bias between these two methods was 3.97% (figure 2B, table S2 in the supplementary Excel file) with an upper CI bound of 19.38% and a lower CI bound of –11.44%. Few samples, especially at lower creatinine levels and at around 250 µmol/l creatinine, had markedly higher creatinine concentrations when measured with the Jaffe assay. As these are non-icteric samples, other interfering substances, such as cephalosporin-containing antibiotics, may have caused this discrepancy between the two methods. Altogether, despite the few outliers, the two methods showed an acceptable agreement in non-icteric samples, i.e. a mean relative bias below 5% and a slope close to 1.
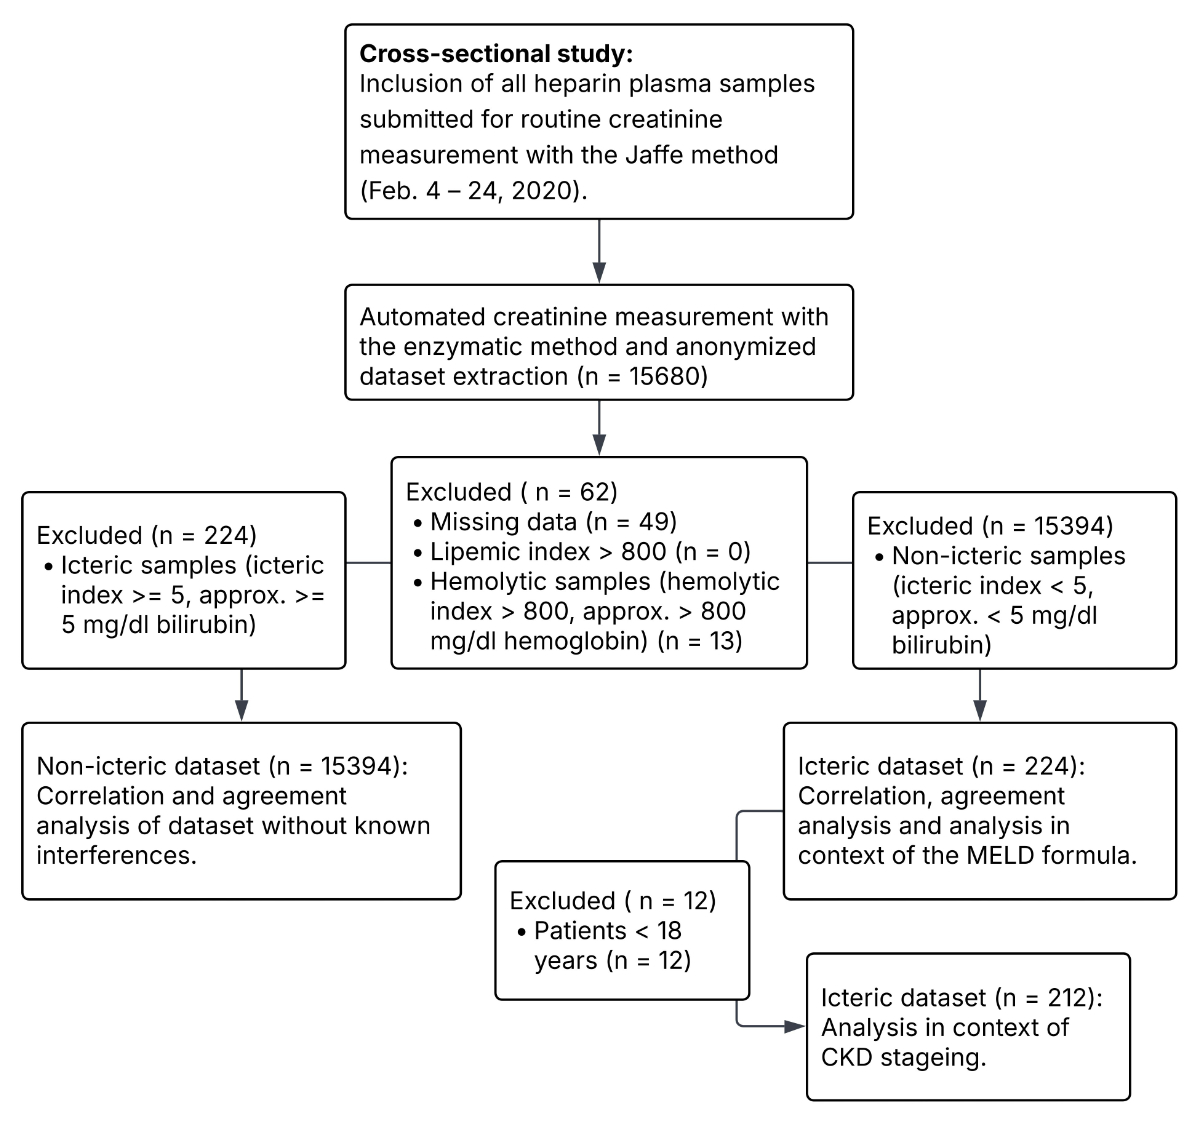
Figure 1Comparison of the creatinine Jaffe method to the enzymatic method. This dataset does not include samples with known interferences, e.g. bilirubinaemia, haemolytic or lipaemic samples. A) Correlation plot with Deming regression shown as a solid line. Dotted line represents the diagonal. B) Bland–Altman graph showing relative bias (solid line) between the two methods. Upper and lower confidence interval bounds are shown as dashed lines.
Of the total 15,680 samples, 15,618 were included in the analysis dataset, of which 224 samples had an icteric index >5 (approximately 5 mg/dl bilirubin), which interferes with the Jaffe assay, and only 58 samples had an icteric index >15 (approximately 15 mg/dl bilirubin), which represents the bilirubin interference limit for the enzymatic assay (table S1). Across all measurements, this represented 1.4% and 0.37% of all samples, respectively. The Pearson correlation across the icteric samples was 0.961 with an intercept of 9.412 µmol/l and a slope of 1.084, as determined with the Deming regression method (figure 3A, table S2). In comparison to the non-icteric dataset, there is an intercept difference of 11.4 µmol/l creatinine. With increasing bilirubin concentration, the methods showed higher discrepancies. The mean relative bias was 10.91% with an upper CI bound of 36.41% and a lower CI bound of -14.58% in samples with an icteric index ≤20 (approximately 20 mg/dl bilirubin) (figure 3B, table S2). In samples with an icteric index >20, the mean relative bias was 43.44% with an upper CI bound of 87.50% and a lower CI bound of -0.63%. While in some icteric samples the enzymatic method measured higher than the Jaffe method, all measurements were higher in the Jaffe method with an icteric index ≥20. Despite the established cutoff by the manufacturer for bilirubin being at an icteric index of 15, our cross-comparison of the two assays revealed a noticeable segregation and increased bias at an icteric index of 20.
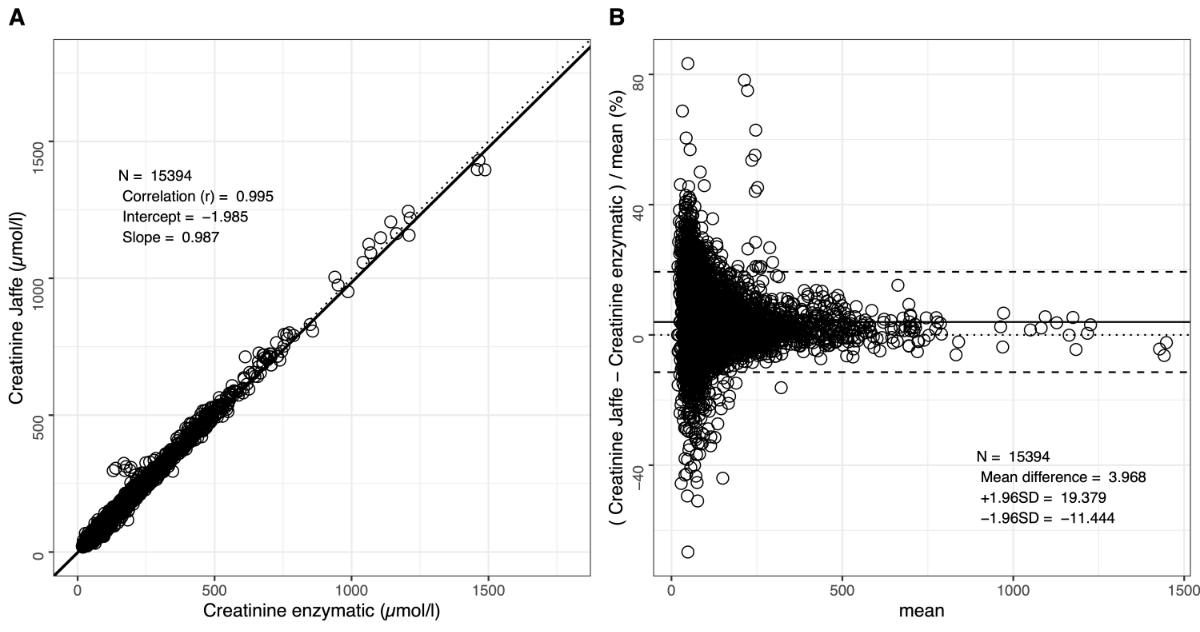
Figure 2Comparison of the Jaffe method with the enzymatic method in icteric samples (i.e. icteric index ≥5). A) Correlation plot with Deming regression, shown as a dashed line. The dotted line represents the diagonal. The solid line represents the Deming regression from figure 1A. B) The Bland–Altman graph showing relative bias (solid line) between the two methods. Upper and lower confidence interval bounds are shown as dashed lines. To calculate the statistics, the data was segregated at an icteric index of 20. The icteric index corresponds approximately to bilirubin concentrations in mg/dl (= 17.1 µmol/l).
At an icteric index >5 and <10 (i.e. approximately 5 and 10 mg/dl), the MELD score would be 0.403 points higher with the Jaffe assay than the enzymatic assay (figure 4, table S2). This discrepancy was, as expected, more prominent with increasing bilirubinaemia. In samples with an icteric index ≥10 and <28 (approximately 28 mg/dl bilirubin), the mean difference would be 0.875 points, while in samples with an icteric index ≥28, the mean difference would be 3.403 points.
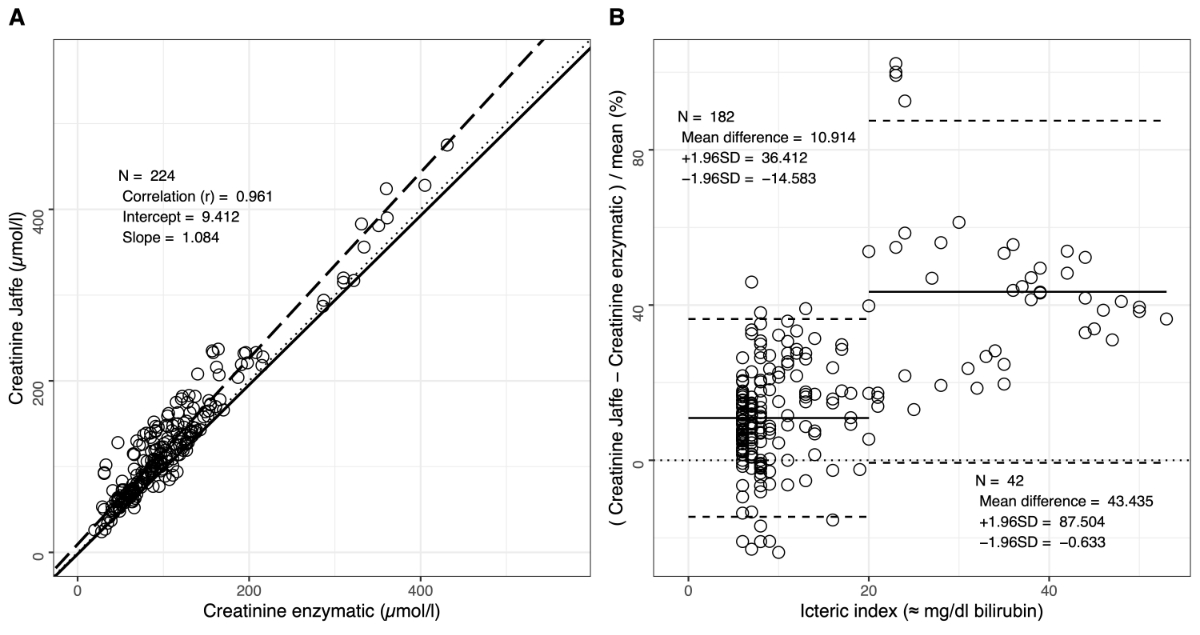
Figure 3Bias of the creatinine part of the MELD formula shown as a Bland–Altman graph. The relative bias between the two methods is shown as a solid line. Upper and lower confidence interval bounds are shown as dashed lines. To calculate the statistics, the data was segregated based on visual observation at an icteric index of 10 and 27. As specified by the MELD score [5], values above 354 µmol/l (= 4 mg/dl) were set to 4 and values below 88.5 µmol/l (= 1 mg/dl) were set to 1. The icteric index corresponds approximately to bilirubin concentrations in mg/dl (= 17.1 µmol/l).
Most of the calculated eGFR in the icteric samples were staged into the same group (60.37%) (figure 5A). In 2.35% and 37.26% of the samples, kidney function would be classified into a less and more advanced stage, respectively, of renal impairment, when measured with the Jaffe method. Of note, more than 6% of the patients would be classified with a discordance of two categories. Around one quarter or less of all samples with an icteric index >5 and <10 would be staged differently when using the Jaffe or the enzymatic assay for creatinine measurements (figure 5B). In samples with an icteric index >35 (approximately 35 mg/dl bilirubin), all patients would be assigned to different stages.
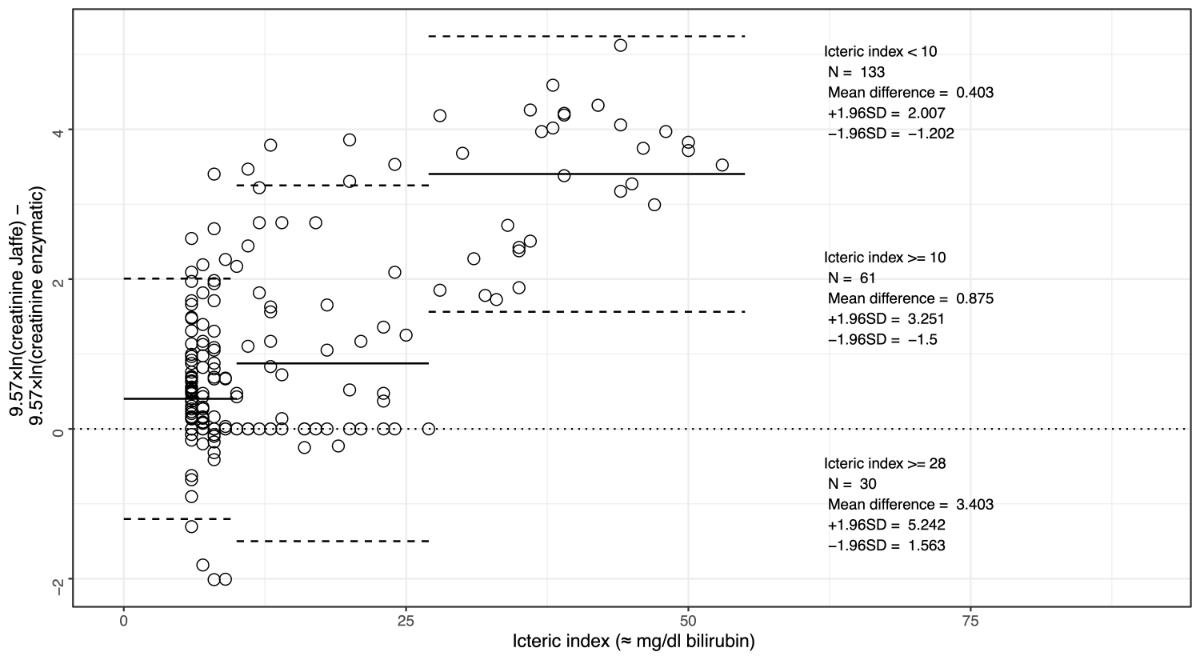
Figure 4Impact of discrepant creatinine results on chronic kidney disease staging in hyperbilirubinaemia samples. eGFR was not calculated for patients aged below 18 years (n = 12). A) eGFR staged into the different CKD groups. Icteric indices are shown as boxplots. Vertical lines indicate the minimum and maximum values, boxes are first and third quartiles, and bold vertical lines within the box are medians. The number of samples and median icteric index are written on top. Grey boxes indicate concordant staging, yellow boxes a discordance of one stage and orange boxes a discordance of two stages. B) Fraction of concordant or discordant staging in relation to the icteric index. The colour code is according to panel A. The icteric index corresponds approximately to bilirubin concentrations in mg/dl (= 17.1 µmol/l).
In Switzerland, when considering the results of the external quality control provider MQ (Verein für Medizinische Qualitätskontrolle), the majority of the institutions use a Jaffe assay, while only a minority use an enzymatic assay for creatinine measurements [24, 25]. This trend reflects standard global practice, where the Jaffe method is preferred for economic reasons: enzymatic creatinine assays are more expensive than assays based on the Jaffe reaction [4]. However, Jaffe assays are more susceptible to interference, particularly from bilirubin, whereas the enzymatic method is inherently more specific. According to KDIGO group guidelines, resource limitations that may limit access to enzymatic creatinine should not be viewed as an obstacle to implementing a GFR reporting programme based on Jaffe creatinine measurements [4]. Furthermore, for the MELD score calculation, it is not specified which assay should be used to measure creatinine [5].
As we provide creatinine results using the Jaffe assay from Roche at our institute, it was of high interest to assess the impact of the discrepancy between Jaffe and enzymatic creatinine assays on clinical decision-making. Across all non-icteric samples, the Jaffe and enzymatic assay from Roche were comparable, with a few exceptions of highly discrepant results, probably due to an unknown interference. In icteric samples, the relative bias was above 10%. Above an icteric index of 20, which is above the interference threshold for both the Jaffe and enzymatic method, the relative bias was higher than 40%, possibly as a result of overestimating creatinine with the Jaffe assay due to rate blanking and/or underestimation of creatinine values with the enzymatic method. As the enzymatic assay is affected by conjugated bilirubin from an index of 15 and by unconjugated bilirubin from an index of 20, the marked divergence between the two methods observed above an icteric index of 20 may suggest higher concentrations of unconjugated bilirubin in our patient cohort. Our results in the context of MELD and chronic kidney disease staging show that Jaffe leads to higher MELD scores and classification towards more advanced stages of renal impairment in more than one third of the icteric samples when compared to enzymatic creatinine measurements. The MELD score ranges from 6 to 40, with severity often categorised in increments of 10. The observed increases in MELD scores of 0.4 to 3.4 points when using the Jaffe method compared to the enzymatic method might slightly affect the interpretation of liver function at borderline scores but do not result in a change in severity class.
To date, at our institute, creatinine results affected by bilirubin interference are reported with caution based on assay-specific data, as previously described by others [26], particularly because creatinine values are essential for MELD score calculation. Is this aligned with good clinical practice, and can this approach be improved by learning from our data? From an economic perspective, the rate of icteric samples is too small to implement the enzymatic method for routine practice, considering its good performance across a great majority of the analysed samples. In three weeks, 1.4% of the samples had an icteric index >5, the interference limit for the Jaffe assay, and 0.37% of the samples had an icteric index >15, the interference limit for the enzymatic assay. However, to provide reliable laboratory results for patients with hyperbilirubinaemia, cystatin C could be measured in the few samples with an icteric index >10 for kidney function estimation and survival prediction in end-stage liver disease. Cystatin C has the advantage over creatinine that it is independent of influencing factors, such as sex and muscle mass, and that hyperbilirubinaemia does not interfere with the assay [27]. At our institute, reporting of cystatin C-based eGFR is available [28]. While Frinkensedt et al. showed that a cystatin C-based MELD score has a similar predictive power of survival in end-stage liver disease patients as creatinine-based MELD calculations [29], we do not provide MELD score reporting at our laboratory. As an alternative to referring icteric samples for cystatin C measurement, automated dilution offers a practical and cost-efficient solution [17].
Our study has several limitations. Since it was conducted as a quality control assessment, we did not specifically enrich for icteric samples, to evaluate the in-house impact and affected sample size. As a result, the sample distribution is uneven across creatinine and bilirubin levels, but it reflects sample characteristics in an everyday laboratory setting. Furthermore, it is important to note that our results and conclusions may not be applicable to creatinine assays from other manufacturers. We cannot make any statement on the real creatinine values of the assessed samples as mass spectrometry-based determination of creatinine was out of this study’s scope. Furthermore, we were not able to include any data on the comparability to cystatin C because of (i) lack of cystatin measurements for icteric samples and (ii) lack of patient characteristics in our anonymised study. Because anonymisation prevented evaluation of eGFR and MELD scores in their full clinical context, the resulting findings reflect theoretical implications rather than real patient-level clinical outcomes. While the strength of this study is the high number of samples, an important limitation is that we did not enrich specifically for certain subgroups such as liver transplant candidates, as done elsewhere [30]. Finally, various substances beyond bilirubin can interfere with the Jaffe and enzymatic assays [31] and these were not assessed in this study.
In conclusion, this dataset from a high number of patient samples demonstrates that the Roche Jaffe and enzymatic creatinine methods generally agree well in our routine laboratory setting. For icteric samples, we observed a discrepancy that can influence kidney function estimation and overall survival prediction in patients with end-stage liver disease.
The deidentified study data, including age, sex, creatinine levels measured by both the Jaffe and enzymatic methods, as well as the indices data (haemolytic index, icteric index and lipaemia index), are available in the supplementary Excel file.
The authors would like to thank the staff of the Institute of Clinical Chemistry at University Hospital Zurich for their support. Furthermore, we acknowledge the sponsoring of the enzymatic test by Roche.
Roche provided the enzymatic assay free of charge and had no involvement in study design, data collection, analysis, interpretation or the decision to publish.
All authors have completed and submitted the International Committee of Medical Journal Editors form for disclosure of potential conflicts of interest. No potential conflict of interest related to the content of this manuscript was disclosed.
1. Jager KJ, Kovesdy C, Langham R, Rosenberg M, Jha V, Zoccali C. A single number for advocacy and communication-worldwide more than 850 million individuals have kidney diseases. Kidney Int. 2019 Nov;96(5):1048–50. doi: https://doi.org/10.1016/j.kint.2019.07.012
2. Fidalgo P, Bagshaw SM. Chronic kidney disease in the intensive care unit. Management of Chronic Kidney Disease. Berlin, Heidelberg: Springer Berlin Heidelberg; 2014. pp. 417–38. doi: https://doi.org/10.1007/978-3-642-54637-2_32
3. Stevens LA, Coresh J, Greene T, Levey AS. Assessing kidney function—measured and estimated glomerular filtration rate. N Engl J Med. 2006 Jun;354(23):2473–83. doi: https://doi.org/10.1056/NEJMra054415
4. Stevens PE, Ahmed SB, Carrero JJ, Foster B, Francis A, Hall RK, et al. Kidney Disease: Improving Global Outcomes (KDIGO) CKD Work Group. KDIGO 2024 Clinical Practice Guideline for the Evaluation and Management of Chronic Kidney Disease. Kidney Int. 2024 Apr;105(4 4S):S117–314. doi: https://doi.org/10.1016/j.kint.2023.10.018
5. Kamath PS, Wiesner RH, Malinchoc M, Kremers W, Therneau TM, Kosberg CL, et al. A model to predict survival in patients with end-stage liver disease. Hepatology. 2001 Feb;33(2):464–70. doi: https://doi.org/10.1053/jhep.2001.22172
6. Thomas L. Labor und Diagnose [Internet]. Prof. Lothar Thomas. 2024 [cited 2024 Aug 29]. Available from: https://www.labor-und-diagnose.de/
7. Jaffe M. Ueber den Niederschlag, welchen Pikrinsäure in normalem Harn erzeugt und über eine neue Reaction des Kreatinins. Biol Chem. 1886;10(5):391–400. doi: https://doi.org/10.1515/bchm1.1886.10.5.391
8. Miller BF, Dubos R. Determination by a specific, enzymatic method of the creatinine content of blood and urine from normal and nephritic individuals. J Biol Chem. 1937 Nov;121(2):457–64. doi: https://doi.org/10.1016/S0021-9258(18)74278-6
9. Greenberg N, Roberts WL, Bachmann LM, Wright EC, Dalton RN, Zakowski JJ, et al. Specificity characteristics of 7 commercial creatinine measurement procedures by enzymatic and Jaffe method principles. Clin Chem. 2012 Feb;58(2):391–401. doi: https://doi.org/10.1373/clinchem.2011.172288
10. Cobbaert CM, Baadenhuijsen H, Weykamp CW. Prime time for enzymatic creatinine methods in pediatrics. Clin Chem. 2009 Mar;55(3):549–58. doi: https://doi.org/10.1373/clinchem.2008.116863
11. Owen LJ, Keevil BG. Does bilirubin cause interference in Roche creatinine methods? Clin Chem. 2007 Feb;53(2):370–1. doi: https://doi.org/10.1373/clinchem.2006.075846
12. Nah H, Lee SG, Lee KS, Won JH, Kim HO, Kim JH. Evaluation of bilirubin interference and accuracy of six creatinine assays compared with isotope dilution-liquid chromatography mass spectrometry. Clin Biochem. 2016 Feb;49(3):274–81. doi: https://doi.org/10.1016/j.clinbiochem.2015.10.015
13. Cheung T, Tawfik A, Kampfrath T. Effects of Bilirubin Interference in the Roche Kinetic Alkaline Picrate Creatinine Assay. J Appl Lab Med. 2018 Jul;3(1):152–4. doi: https://doi.org/10.1373/jalm.2017.025528
14. Cholongitas E, Marelli L, Kerry A, Senzolo M, Goodier DW, Nair D, et al. Different methods of creatinine measurement significantly affect MELD scores. Liver Transpl. 2007 Apr;13(4):523–9. doi: https://doi.org/10.1002/lt.20994
15. Kaiser T, Kinny-Köster B, Bartels M, Parthaune T, Schmidt M, Thiery J. Impact of different creatinine measurement methods on liver transplant allocation. PLoS One. 2014 Feb;9(2):e90015. doi: https://doi.org/10.1371/journal.pone.0090015
16. Peake M, Whiting M. Measurement of serum creatinine—current status and future goals. Clin Biochem Rev. 2006 Nov;27(4):173–84.
17. Charifa A, Bunch DR, El-Khoury JM. Practical Approach to Eliminate Bilirubin Interference in Icteric Samples for Creatinine Measurement. J Appl Lab Med. 2019 Nov;4(3):477–9. doi: https://doi.org/10.1373/jalm.2019.030247
18. Boot S, LaRoche N, Legg EF. Elimination of bilirubin interference in creatinine assays by routine techniques: comparisons with a high performance liquid chromatography method. Ann Clin Biochem. 1994 May;31(Pt 3):262–6. doi: https://doi.org/10.1177/000456329403100308
19. Villa P, Jiménez M, Soriano MC, Manzanares J, Casasnovas P. Serum cystatin C concentration as a marker of acute renal dysfunction in critically ill patients. Crit Care. 2005 Apr;9(2):R139–43. doi: https://doi.org/10.1186/cc3044
20. Levey AS, Stevens LA, Schmid CH, Zhang YL, Castro AF 3rd, Feldman HI, et al.; CKD-EPI (Chronic Kidney Disease Epidemiology Collaboration). A new equation to estimate glomerular filtration rate. Ann Intern Med. 2009 May;150(9):604–12. doi: https://doi.org/10.7326/0003-4819-150-9-200905050-00006
21. Wickham H, Chang W, Henry L, Pedersen TL, Takahashi K, Wilke C, et al. Ggplot2: Create elegant data visualisations using the grammar of graphics [Internet]. CRAN: Contributed Packages. The R Foundation; 2007. Available from: https://cran.r-project.org/package=ggplot2
22. Shrivastav V. lin.eval: Perform Polynomial Evaluation of Linearity [Internet]. CRAN: Contributed Packages. The R Foundation; 2019. Available from: https://cran.r-project.org/package=lin.eval
23. Potapov S, Model F, Schuetzenmeister A, Manuilova E, Dufey F, Raymaekers J. mcr: Method Comparison Regression [Internet]. CRAN: Contributed Packages. The R Foundation; 2012. Available from: https://cran.r-project.org/package=mcr
24. MQ – Bericht des Ringversuchs 2024 -1 [Internet]. [cited 2025 Dec 3]. Available from: https://www.mqzh.ch/cm/images/mq20241/pdf/mq_2024_1_rvb_d.pdf
25. MQ – Bericht des Ringversuchs 2025 - 1 [Internet]. [cited 2025 Dec 3]. Available from: https://www.mqzh.ch/cm/images/mq20251/pdf/mq_2025_1_rvb_d.pdf
26. Spencer KS, Duvall LE. Investigating the effect of icterus interference on a creatinine Roche enzymatic methodology. Ann Clin Biochem. 2025 Nov;62(6):510–3. doi: https://doi.org/10.1177/00045632251337619
27. Randers E, Kristensen JH, Erlandsen EJ, Danielsen H. Serum cystatin C as a marker of the renal function. Scand J Clin Lab Invest. 1998 Nov;58(7):585–92. doi: https://doi.org/10.1080/00365519850186210
28. Inker LA, Schmid CH, Tighiouart H, Eckfeldt JH, Feldman HI, Greene T, et al.; CKD-EPI Investigators. Estimating glomerular filtration rate from serum creatinine and cystatin C. N Engl J Med. 2012 Jul;367(1):20–9. doi: https://doi.org/10.1056/NEJMoa1114248
29. Finkenstedt A, Dorn L, Edlinger M, Prokop W, Risch L, Griesmacher A, et al. Cystatin C is a strong predictor of survival in patients with cirrhosis: is a cystatin C-based MELD better? Liver Int. 2012 Sep;32(8):1211–6. doi: https://doi.org/10.1111/j.1478-3231.2012.02766.x
30. Soleimani N, Dehghani S, Anbardar MH, Mohammadzadeh S, Amirinezhad Fard E, Zare Sheibani A, et al. Comparing Jaffe and Enzymatic Methods for Creatinine Measurement at Various Icterus Levels and Their Impacts on Liver Transplant Allocation. Int J Anal Chem. 2023 Oct;2023:9804533. doi: https://doi.org/10.1155/2023/9804533
31. Syme NR, Stevens K, Stirling C, McMillan DC, Talwar D. Clinical and Analytical Impact of Moving from Jaffe to Enzymatic Serum Creatinine Methodology. J Appl Lab Med. 2020 Jul;5(4):631–42. doi: https://doi.org/10.1093/jalm/jfaa053
The supplementary Excel file is available for download as a separate file at https://doi.org/10.57187/4707.