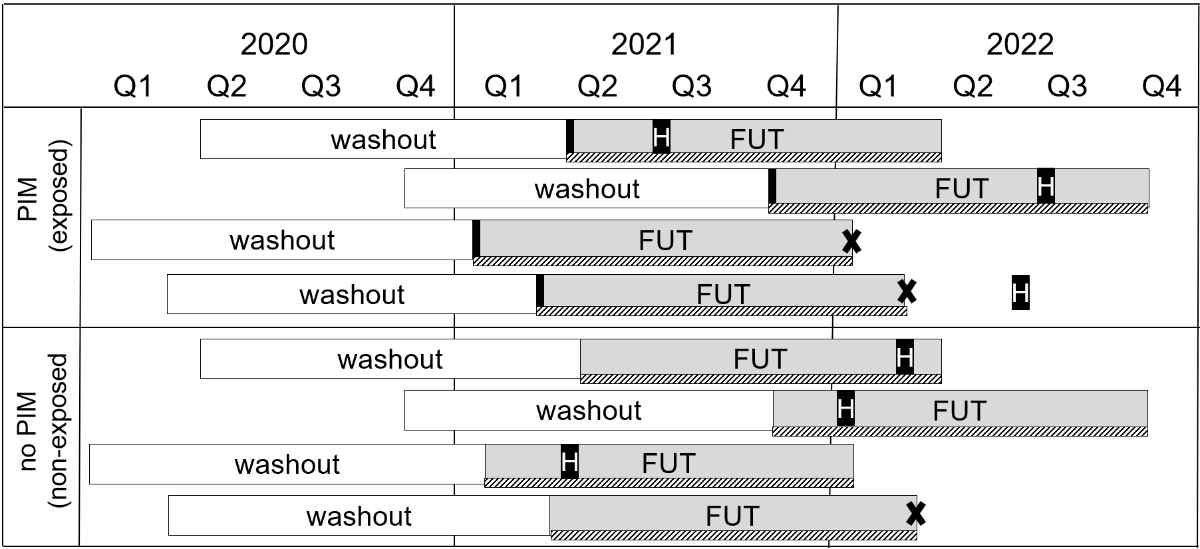
Figure 1
Study design on PIM prescriptions and associated hospitalisation and healthcare costs.
Abbreviations: FUT, follow-up time of 365 days; PIM, potentially inappropriate medication.
DOI: https://doi.org/https://doi.org/10.57187/4613
Potentially inappropriate medications (PIM) are described as medications that should be avoided due to their high risk of adverse events and lack of evidence of effectiveness [1]. The impact of PIMs on various outcomes such as healthcare utilisation and costs has been widely studied. PIM use was associated with increased healthcare utilisation [2, 3], risk of all-cause [4–7], drug-related [8–10] and fall-related hospitalisations [3, 11, 12]. PIM exposure was also associated with emergency [10] and general practitioner (GP) [11] visits as well as higher healthcare costs in general [2, 3, 13, 14]. Consequently, PIMs pose a significant challenge for high-quality and efficient healthcare systems.
PIMs are of particular relevance in elderly healthcare since older adults are at greater risk of adverse drug events for a number of reasons. First, age-related changes in pharmacokinetics and pharmacodynamics increase drug sensitivity and the risk of adverse events [15]. Second, despite being the primary consumers of prescribed drugs [16], older adults are often underrepresented in clinical trials, leading to a lack of robust evidence on the safety and efficacy of medications for this population [17]. Finally, the high prevalence of chronic illnesses among older adults, which requires complex drug regimens, increases the risk of adverse drug-drug interactions. Considering these challenges, various screening tools to identify and reduce PIMs in older patients have been developed and published. The Beers criteria from the US were the first comprehensive measure introduced and many countries have since adapted or developed similar criteria to suit their specific pharmaceutical markets and treatment practices, such as the PRISCUS list in Germany [18] or the Screening Tool of Older Persons’ Potentially Inappropriate Prescriptions (STOPP) in Ireland [19].
In Switzerland, up-to-date studies on PIMs and their implications for the general older population are scarce, despite the country’s ageing population and rising healthcare costs [20, 21]. While recent studies have examined the prescribing prevalence in specific settings, such as nursing homes [22], general practice [23] or specific health insurance schemes [24], there is no current prevalence estimate of PIM prescribing that can be generalised to the total population of Switzerland. Previous research [25] examined the association between PIM prescription and hospitalisation based on data from 2016, but assessed the exposure to PIM and the subsequent hospitalisation annually, without considering the exact time to event. This approach lacked capture of the temporal relationship between exposure and outcome, and thus may have led to an underestimation of short-term effects of the potential harm of PIMs. Another study [12], which examined the risk of hospitalisation following an initial PIM prescription, was based on outdated data (2008 to 2012) and the results were not generalisable to the total Swiss population since the analyses focused on managed care insurance models. Therefore, our study aimed to address the following two primary objectives: (1) To assess current data on PIM prevalence, including population-based time trends, and (2) to evaluate the association between the exposure to PIM and (a) the time to first all-cause hospitalisation as well as (b) the total healthcare costs in the general older population of Switzerland.
This observational retrospective study was based on routine claims data from one of the largest health insurance companies in Switzerland (Helsana Group). The data contained anonymised patient-level information, covering drugs (substance and dosage), medical services (in- and outpatient), laboratory tests, chosen health insurance plan, deductible level and sociodemographic information such as age, sex and living area.
The analysis of PIMs in the general older population consisted of two parts:
Study design on PIM prescriptions and associated hospitalisation and healthcare costs.
Abbreviations: FUT, follow-up time of 365 days; PIM, potentially inappropriate medication.
The study sample included patients aged 65 years or older with continuous insurance coverage between 2020 and 2022. Patients with at least one PIM prescription between 1 January 2021 and 31 December 2021 were classified into the exposed group, whereas the non-exposed group included patients without a PIM prescription during the same time period. For patients in the exposed group, the start of the follow-up period was defined by the date of the initial PIM prescription (index date). For all patients in the non-exposed group, 12 data entries were generated, with a notional index date on the first day of each month from January to December (hereafter referred to as patient-months), which determined their starting date of the follow-up period (figure 2). The combination of month and year of the index dates served as a matching variable in the propensity score procedure, and ultimately served to account for potential seasonal effects.
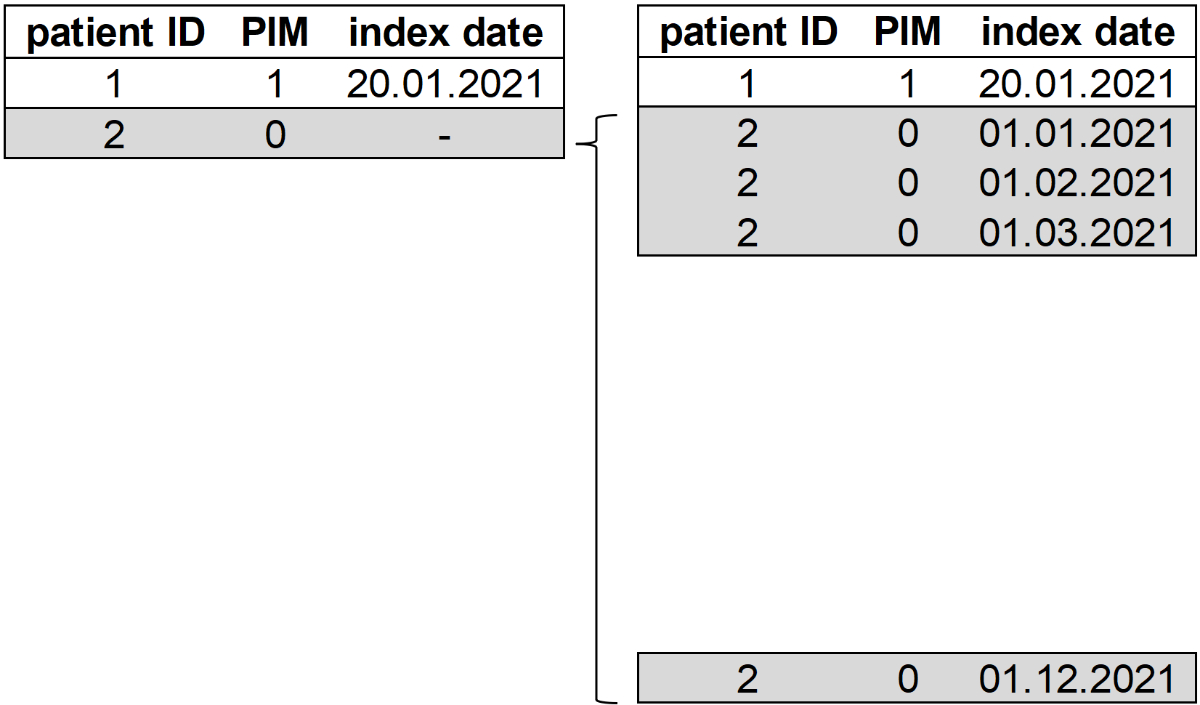
Generation of additional entries for each control in the dataset.
Abbreviations: PIM: potentially inappropriate medication.
Notes: All numbers depicted are for illustration. The patient ID in combination with the index date represents the unique identifier.
From both the exposed and non-exposed group, patients who received at least one PIM prescription and/or were hospitalised during the 12-month period before the corresponding index date were excluded. We applied this washout period to eliminate any potential unobserved effects from prescriptions and hospitalisations prior to the index date. In addition, from the non-exposed group, we excluded patient-months in which at least one PIM prescription was recorded 12 months after the notional index date (which can be up to 2022) and in which no drug at all was recorded in the 12-month period before and/or after the corresponding index date.
We defined PIMs based on the Beers criteria [26] and the PRISCUS list [18]. Other validated criteria such as the STOPP criteria [19] could not be considered for the analyses, because they are based on diagnoses, which are not included in our claims database. The identification of PIMs was based on the Anatomical Therapeutic Chemical (ATC) classification system by the WHO [27], with additional specifications considering number of prescribed packages, package size, dosage, mode of administration (e.g. oral, topical, parenteral) and combinations of specific ATCs with package levels defined based on the Swiss Pharmacode. The analysis considered only drugs that were licensed and listed for reimbursement in Switzerland. The drug classes that include PIMs are presented in table S1 in the appendix. For the assessment of PIM prevalence from 2012 to 2022, we used the year-specific versions of the two PIM lists. The analysis of the association with hospitalisation and healthcare costs was based on the Beers 2019 criteria [26] and the PRISCUS 1.0 list [18].
For the analysis, a total of 126 active agents (unique ATC codes) and combinations were included as PIMs. Among these, 37% from the 2019 Beers criteria (62 of a total of 168) and 77% from the PRISCUS list (64 of a total of 83) were licensed in Switzerland and covered by the mandatory health insurance scheme.
The outcomes of interest were (2a) time to first all-cause hospitalisation after the initial PIM prescription in 2021 and (2b) total healthcare costs, both evaluated during the 1-year follow-up period. Hospitalisation was defined as an inpatient stay (≥1 night) in an acute care hospital. Total healthcare costs were defined as the sum of in- and outpatient care costs per patient and year. Outpatient costs included physician visits both from GPs and specialists, medications, laboratory tests, outpatient visits to hospitals, paramedical visits, nursing and medical equipment. Inpatient costs included the cost of hospitalisation in acute care, psychiatric and rehabilitation hospitals, nursing homes, emergency transport services, and related costs for medications, laboratory tests and medical equipment.
Patients’ sociodemographic, health insurance and morbidity characteristics were used as matching variables and covariates. Sociodemographic and health insurance characteristics were assessed at the time point of the (notional) index date whereas morbidity characteristics were assessed based on the year prior to the index date (same time period as washout). Covariates for sociodemographic and health insurance characteristics included age, sex, language region, area of living (urban-rural typology), chosen health insurance model and deductible level. Age was analysed as a continuous variable, and sex as male or female. Language region distinguished the German-, French- and Italian-speaking parts of Switzerland. Area of living was categorised as urban, intermediate or rural. The health insurance model included the standard care model (SCM) and integrated care health insurance models with varying levels of integrated care: family doctor model (FDM), FDM-light, telemedicine model (TM), with FDM representing the highest degree of integrated care. Deductible level was categorised as low or high. Covariates of morbidity included number of physician visits, consulted physicians, unique ATCs and chronic diseases, as well as outpatient and inpatient costs and inpatient stay in a nursing home. The number of physician visits and consulted physicians included both primary care and specialist contacts. Chronic diseases were identified using pharmaceutical cost groups (PCGs) because medical diagnoses are missing from the given claims dataset. PCGs are a well-established and frequently applied pharmaceutical classification to assess morbidity based on patients’ prescribed medication when clinical data are not available [28].The number of chronic diseases was categorised as 0, 1–3, 4–5 or ≥6 chronic conditions. Outpatient and inpatient costs encompassed the same cost categories as described in the outcome section. An inpatient stay in a nursing home was defined as a stay (≥1 night) in such a facility.
To assess the PIM prevalence from 2012 to 2022, we calculated the proportion of patients who received at least one PIM prescription for each year. PIM exposure was assessed per quarter and aggregated at the annual level (binary coded: exposed/non-exposed). Multiple prescriptions of PIMs were not explicitly considered, but simply classified as exposed.
We used descriptive statistics to summarise patient and outcome characteristics of the study sample used for the outcome analysis. Counts and percentages were used for categorical variables; means and standard deviations for continuous variables.
To balance the differences in baseline characteristics between patients in the exposed and non-exposed group of the study sample, we conducted 1:1 nearest neighbour matching with exact matching on categorical covariates including index date (month-year level), sex, language region, area of living, health insurance model, deductible level, number of PCGs and inpatient stay in a nursing home. The variables age, healthcare costs, as well as the number of unique ATCs, outpatient visits and consulted physicians were further used for the nearest neighbour matching. To evaluate the comparability between the two groups, we calculated the summary statistics for baseline characteristics of the covariates and the density distributions of the propensity scores before and after propensity score matching (PSM), the standardised mean differences as well as the variance ratios, and the density distributions for each variable in the matched case and control groups.
Based on the matched data, we applied a multiple Cox proportional hazards (CPH) model and calculated time-dependent adjusted hazard ratios (HR) to test for the association between PIM/no PIM prescription and the time to first hospitalisation. Given that the proportional hazards (PH) assumption for the predictor of interest (PIM/no PIM, exposed vs non-exposed) was not satisfied (statistical test and graphical diagnostic shown in table S2 and figure S3 in the appendix), time-dependent adjusted HRs were calculated using a step function. A step function is a simple approach to model time-varying coefficients when the PH assumption is violated. It divides the sample into several time intervals and stratifies a CPH model according to the defined time intervals [29, 30], in this case 1–15 days, 15–30 days, 30–60 days, 60–180 days and greater than 180 days. For the association between the exposure to PIM and total healthcare costs, we calculated a negative binomial regression model, and based thereon, the marginal effects (ME) at the mean for better interpretability of the effects.
To assess the sensitivity of the regression analysis, we performed several sensitivity analyses. First, to minimise reverse causality, we excluded patients hospitalised within the first 15 days of follow-up, as hospitalisations in this period may reflect pre-existing conditions that lead to PIM prescription rather than PIM effects. Second, we excluded patients aged 80 years or older [31] as their PIM use is likely to be unavoidable due to lack of alternative treatments associated with their advanced age. Third, to account for potential bias due to multiple entries from the same person in the control group (12 vs 1), we used a subsample that included only distinct matches of non-exposed (no PIM), so that each patient occurred only once in the dataset.
For all analyses, the R programming language, version 4.1.0 (R Foundation for Statistical Computing), was used. The survival package [32] was used for the CPH model, and the MEs at the means were calculated using the mfx package [33].
For the analysis, we used retrospective, pre-existing and anonymised administrative healthcare claims data. The authors had no access to information that could identify individual patients during or after data collection. According to the Swiss Federal Act on Research involving Human Beings (Human Research Act, HRA) [34] and the local ethics committee of the canton of Zurich, ethical approval and patients’ informed consent are not required for this type of study. The data were accessed on 14 June 2024 for the research purposes.
The prevalence analysis was based on annual samples that ranged from 251,484 patients aged 65 years or older in 2012 to 272,058 patients in 2022. Figure 3 shows the 1-year PIM prevalence in the general older population from 2012 to 2022. In 2022, around one-third of patients were prescribed at least one PIM. The prevalence generally decreased over the last decade with a modest increase from 37% in 2012 to 42% in 2015. After 2015, the PIM prevalence gradually decreased by a total of approximately 10%-points until 2022 (figure 3). Detailed annual prevalences are presented in table S4 in the appendix.
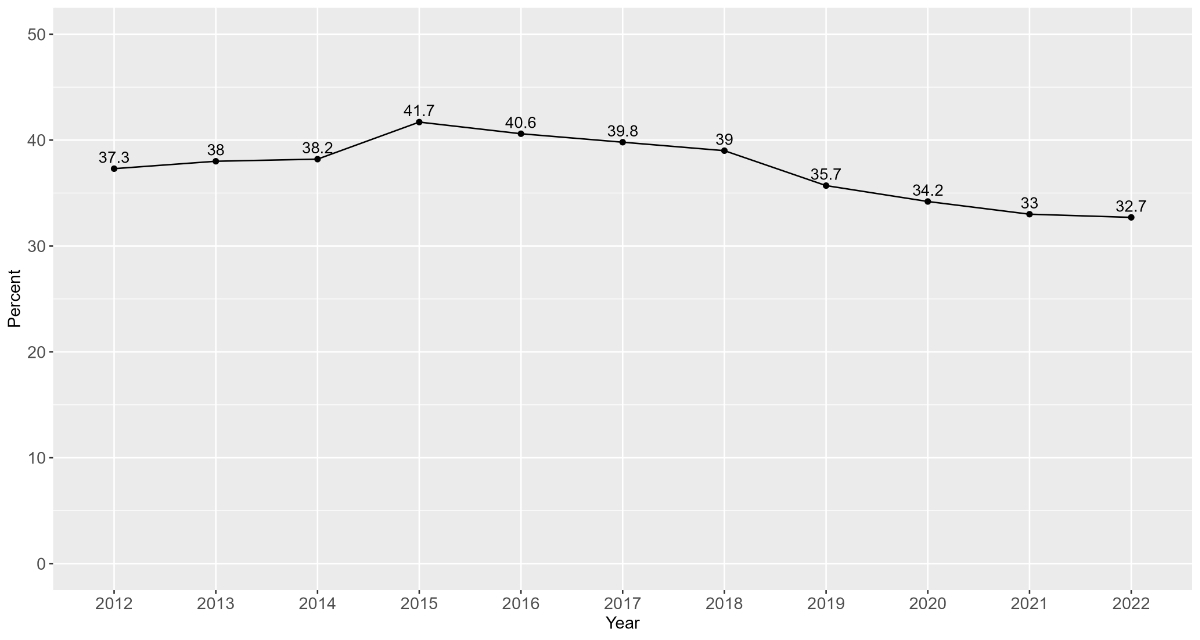
Prevalence of potentially inappropriate medications over time.
Figure 4 presents the flowchart of the selected study sample used for the outcome analysis. A total of 299,847 patients aged 65 years or older were included for the analysis. After applying the exclusion criteria of non-continuous insurance coverage, the sample comprised 159,594 patients in the non-exposed group (no PIM) and 78,057 in the exposed group (PIM). The inclusion of 12 notional index dates, the dataset of the non-exposed group resulted in 1,915,128 entries (“patient-months”). Following additional exclusion criteria (e.g. washout period) for both the exposed and the non-exposed group, the sample comprised 123,330 patients in the non-exposed group and 17,738 in the exposed group. After PSM between those two groups, the final sample included 17,700 matched pairs, resulting in a total of 35,400 patient (-months). Notably, within the exposed group, 47% of the patients showed multiple PIM exposures within one year following the initial exposure.
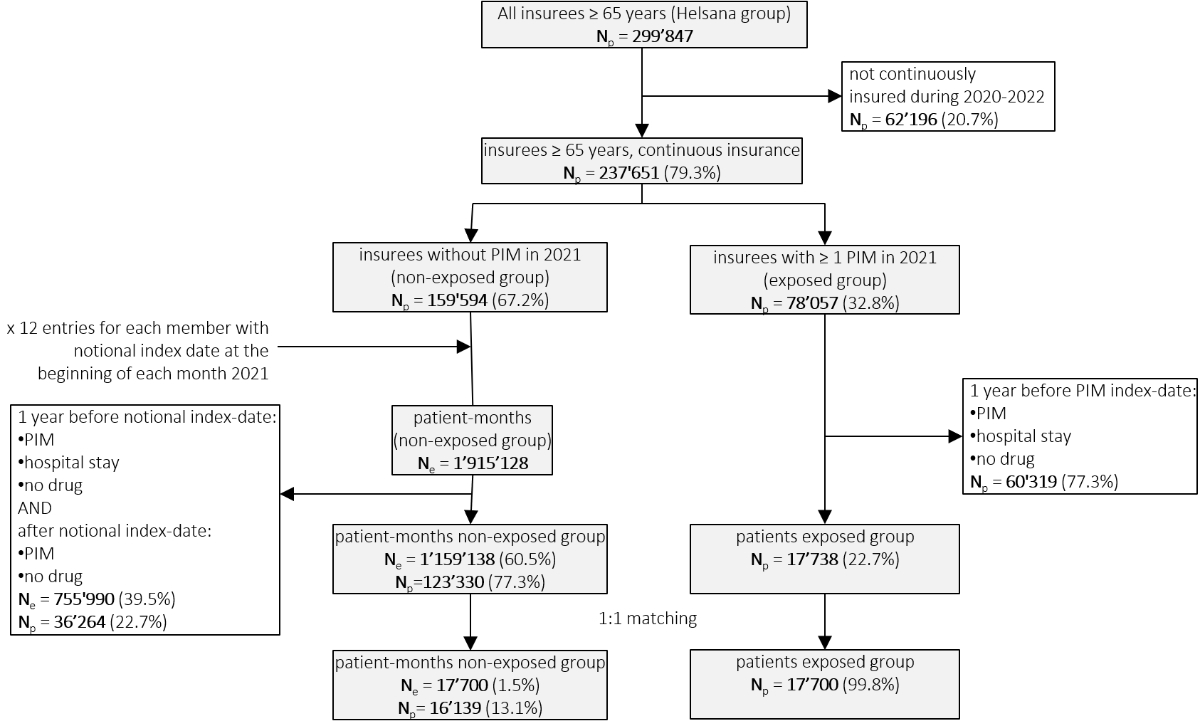
Figure 4. Flowchart of the selected study sample (outcome analysis).
Abbreviations: Ne: number of entries; Np: number of unique patients.
Notes: number of entries refers to patient-months (notional index date at beginning of each month), which might come from the same patient in the non-exposed group.
Table 1 presents the baseline characteristics of the study population after applying PSM, showing evenly distributed covariates between patients with and without PIMs. In both groups, 6 of 10 patients were women, and the average is about 76 years. Most patients resided in urban areas and in the German-speaking part of Switzerland. Almost 40% of the patients chose a SCM and 90% a low deductible level. Around 90% of the patients had at least one chronic condition, had on average around 14 physician visits from two different physicians and received 11 different ATCs in the year before the index date. Only 4% of patients were in a nursing home during the washout period, of whom 70–80% in each group were in a nursing home for the entire year during the washout period. The average outpatient / inpatient cost per patient in the year before the index date was approximately CHF 5800 / CHF 700 (comprising costs for inpatient stays in nursing homes, rehabilitation and psychiatric clinics, excluding all acute hospitalisation costs). The standardised mean differences, variance ratios and density distributions of each variable, as well as the density distributions of propensity scores showing common support between the two groups, are presented in figure S5, table S6, figure S7 and figure S8 in the appendix. The baseline characteristics of the covariates prior to PSM are shown in table S9 in the appendix.
Table 1. Baseline characteristics of the matched study population (outcome analysis).
| Variables | Total | No PIM (non-exposed) | PIM (exposed) | ||
| Study population | n (%) | 35,400 (100%) | 17,700 (50.0%) | 17,700 (50.0%) | |
| Female sex | n (%) | 22,058 (62.3%) | 11,029 (62.3%) | 11,029 (62.3%) | |
| Age | mean (SD) | 76 (7.2) | 76 (7.2) | 76 (7.1) | |
| Living area | Urban | n (%) | 23,564 (66.6%) | 11,782 (66.6%) | 11,782 (66.6%) |
| Rural | n (%) | 4562 (12.9%) | 2281 (12.9%) | 2281 (12.9%) | |
| Intermediate | n (%) | 7274 (20.5%) | 3637 (20.5%) | 3637 (20.5%) | |
| Language region | German-speaking | n (%) | 26,768 (75.6%) | 13,384 (75.6%) | 13,384 (75.6%) |
| French-speaking | n (%) | 5282 (14.9%) | 2641 (14.9%) | 2641 (14.9%) | |
| Italian-speaking | n (%) | 3350 (9.5%) | 1675 (9.5%) | 1675 (9.5%) | |
| Health insurance plan | SCM | n (%) | 13,894 (39.2%) | 6947 (39.2%) | 6947 (39.2%) |
| FDM | n (%) | 13,174 (37.2%) | 6587 (37.2%) | 6587 (37.2%) | |
| FDM-light | n (%) | 4248 (12.0%) | 2124 (12.0%) | 2124 (12.0%) | |
| TM | n (%) | 4084 (11.5%) | 2042 (11.5%) | 2042 (11.5%) | |
| Deductible: CHF ≤500 | n (%) | 31,826 (89.9%) | 15,913 (89.9%) | 15,913 (89.9%) | |
| Number of chronic conditions (wo) | 0 | n (%) | 4100 (11.6%) | 2050 (11.6%) | 2050 (11.6%) |
| 1–3 | n (%) | 22,200 (62.7%) | 11,100 (62.7%) | 11,100 (62.7%) | |
| 4–5 | n (%) | 7010 (19.8%) | 3505 (19.8%) | 3505 (19.8%) | |
| ≥6 | n (%) | 2090 (5.9%) | 1045 (5.9%) | 1045 (5.9%) | |
| Nursing home (wo) | n (%) | 1436 (4.1%) | 718 (4.1%) | 718 (4.1%) | |
| Outpatient consultations | mean (SD) | 14 (12.4) | 13 (12.7) | 14 (12.0) | |
| Different physicians (wo) | mean (SD) | 2 (1.6) | 2 (1.6) | 2 (1.6) | |
| Unique ATCs (wo) | mean (SD) | 11 (6.7) | 11 (6.6) | 11 (6.7) | |
| Costs in CHF (wo) | Outpatient costs | mean (SD) | 5800 (7896.7) | 5731 (7385.6) | 5868 (8376.3) |
| Inpatient costs | mean (SD) | 719 (4131.5) | 716 (4032.7) | 723 (4149.4) | |
Abbreviations: FDM: family doctor model; PIM: potentially inappropriate medication; SCM: standard care model; SD: standard deviation; TM: telemedicine model; wo: washout. Notes: Washout refers to the period one year prior to the corresponding index date. Outpatient consultations include primary care and specialist physicians. Inpatient costs include costs for inpatient stays in nursing homes, rehabilitation and psychiatric clinics. FDM: The treating physician is part of a physician network, which has a cooperation agreement with the health insurance, which defines reimbursement for integrated care services and regulates the type of cooperation and commits to a network-specific quality standard. FDM-light: In contrast to FDM, the treating physician is not part of an approved physician network. Nursing home was defined as a ≥1 overnight stay.
Table 2 presents the descriptive comparison of the outcome variables including all-cause hospitalisation (yes, no), time to first hospitalisation among hospitalised patients and total healthcare costs. Approximately 23% of the patients in the exposed and 16% in the non-exposed group were hospitalised in the year following the PIM or during the index year. Patients who were prescribed PIMs were generally hospitalised earlier and had higher total healthcare costs than those without PIM prescriptions.
Table 2Outcome characteristics of the study population (outcome analysis).
| Outcome | Total | No PIM (non-exposed) | PIM (exposed) | |
| Hospitalisation | n (%) | 6919 (19.5%) | 2785 (15.7%) | 4134 (23.4%) |
| Days until first hospitalisation | mean (SD) | 162 (108.0) | 175 (106.3) | 153 (109.0) |
| Total healthcare costs | mean (SD) | CHF 9897 (CHF 13,779.5) | CHF 8280 (CHF 11,446.6) | CHF 11,515 (CHF 15,604.5) |
Abbreviations: n: number; SD: standard deviation.
Figure 4 shows the estimated HR from the CPH model, representing the association between patients with exposure to PIM and time to first hospitalisation. The CPH model revealed a significant association between PIM exposure and an increased risk of hospitalisations. The highest risk of hospitalisation occurred within the first 15 days after the initial PIM prescription (HR: 2.72, 95% CI: [2.25–3.27]) and gradually decreased over time (after 30 days: HR: 2.16 [1.75–2.66]. 60 days: HR: 1.76 [1.50–2.05]. 90 days: HR: 1.67 [1.42–2.97]. 180 days: HR: 1.50 [1.37–1.66]. 365 days: HR: 1.34 [1.25–1.44]). Increased risk of hospitalisation was also observed in patients who were older (HR: 1.02 [1.02–1.03]) and lived in the German-speaking part of Switzerland (HR: 1.12 [1.03–1.22]). For patient’s morbidity characteristics, the number of outpatient visits (HR: 1.00 [1.00–1.00]), consulted physicians (HR: 1.02 [1.01–1.04]) and the number of unique ATCs (HR: 1.03 [1.02–1.03]), as well as the healthcare costs (both out- and inpatient: HR: 1.00 [1.00–1.00]) were associated with a higher risk of hospitalisation. Being female (HR: 0.81 [0.77–0.85]) and living in a nursing home (HR: 0.68 [0.55–0.85]) were associated with a lower risk of hospitalisation.
The sensitivity analysis showed comparable results for the coefficients of PIM vs no PIM, both when excluding patients hospitalised within the first 15 days of follow-up (subsample of 17,290 matched patients) and patients aged 80 years and older (subsample of 12,934 matched patients). Furthermore, the results remained stable when a subsample of 16,139 distinct matches of exposed and non-exposed patients was used. The full results of the sensitivity analysis are presented in tables S10, S11 and S12 in the appendix.
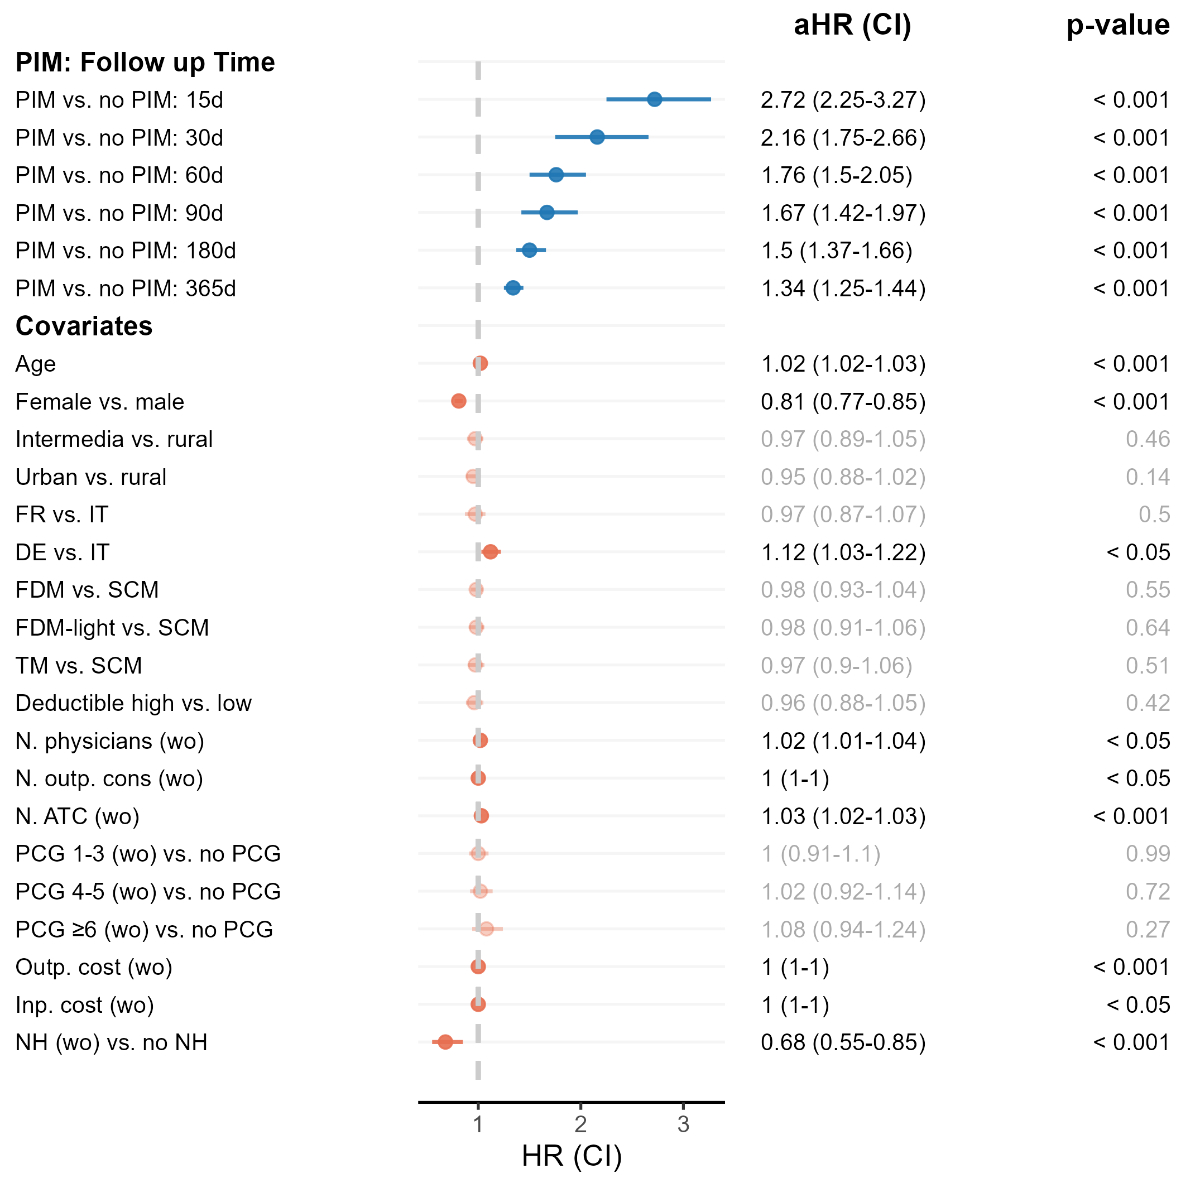
Estimated association between PIM exposure and hospitalisation based on a CPH model. Abbreviations: aHR: adjusted hazard ratio; ATC: Anatomical Therapeutic Chemical (classification system); CI: confidence interval; d: days; DE: German-speaking area; FDM: family doctor model; FR: French-speaking area; inp.: inpatient; n: number; NH: nursing home stay; outp.: outpatient; PCG: pharmaceutical cost group; PIM: potentially inappropriate medication; SCM: standard care model; TM: telemedicine model; wo: washout. Notes: Sample size: 35,400 (17,700 matched pairs). Washout refers to the period one year prior to the corresponding index date. The high deductible level is CHF ≥500. Outpatient consultations and number of physicians include primary care and specialist physicians. Inpatient costs include costs for inpatient stays in nursing homes, rehabilitation and psychiatric clinics. FDM: The treating physician is part of a physician network, which has a cooperation agreement with the health insurance, which defines reimbursement for integrated care services and regulates the type of cooperation and commits to a network-specific quality standard. FDM-light: In contrast to FDM, the treating physician is not part of an approved physician network.
Figure 5 presents the estimated ME from the negative binomial regression model, representing the association between patients exposed to PIM and total healthcare costs. Patients with at least one PIM prescription showed on average CHF 3194 higher costs than patients without PIM (ME: 3194.38 [3047.67–3341.10]). Patient age (ME: 102.92 [92.37–113.47]), living in the French-speaking part of Switzerland (ME: 458.45 [150.75–766.16]) as well as patient’s morbidity characteristics were also associated with higher healthcare costs (ranging from inpatient costs: ME: 0.25 [0.22–0.28] to nursing home stay: ME: 5218.86 [4262.42–6175.30]). In contrast, being female (ME: -958.98 [-1110.90–-807.05]), enrolment in a FDM (ME: -245.90 [-407.83–-83.97]) or a TM (ME: -296.45 [-529.13–-63.78]) and a higher deductible level (ME: -732.62 [-957.62–-507.61]) were associated with lower healthcare costs. The estimated IRRs are presented in table S13 in the appendix.
The sensitivity analysis showed robust results. The coefficients of PIM vs no PIM were comparable to those from the main sample, when excluding patients hospitalised within the first 15 days of follow-up and patients aged 80 years. Using a subsample of distinct matches of exposed and non-exposed patients did not notably alter the results. The full results of the sensitivity analysis are presented in tables S10, S11 and S12 in the appendix.
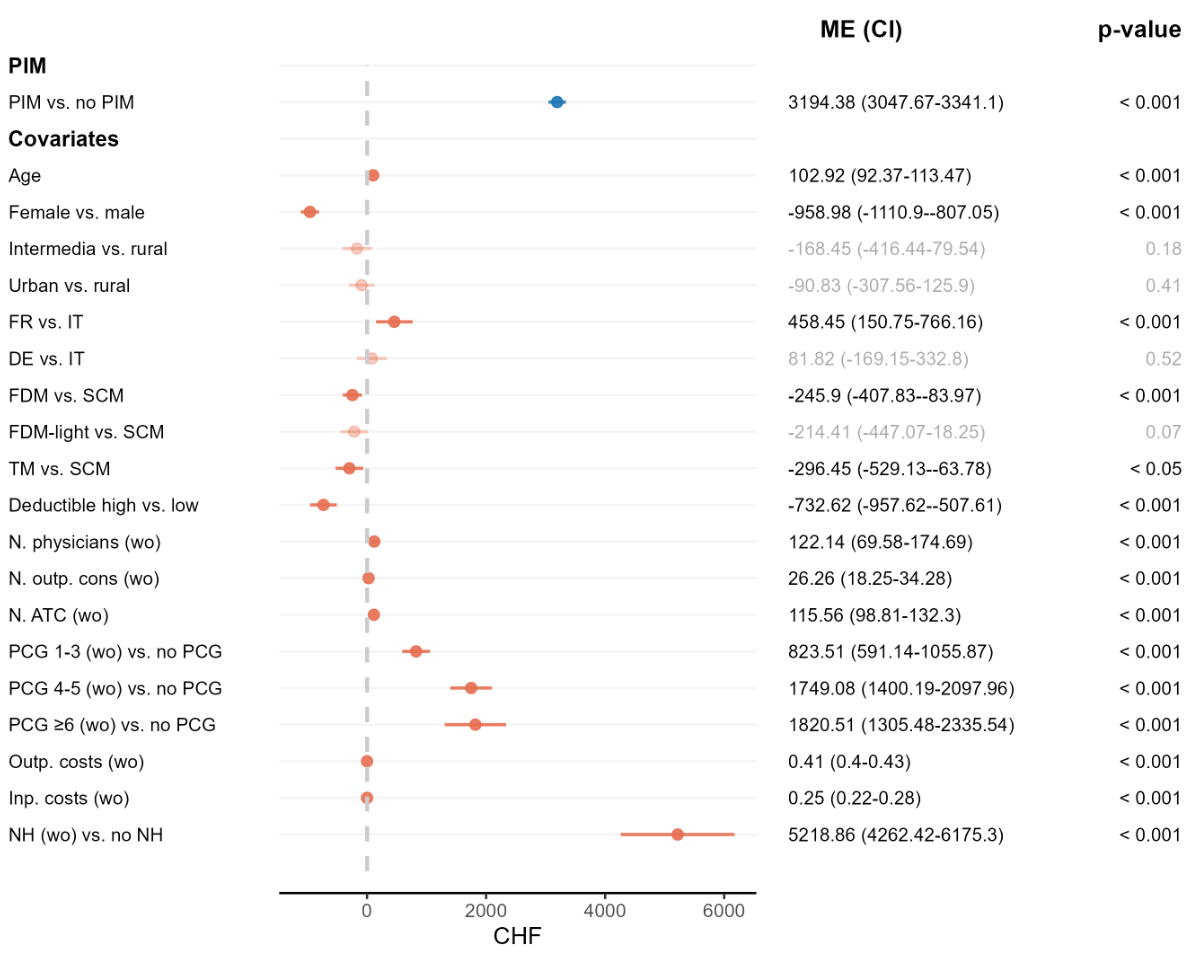
Estimated association between the prescription of PIMs and total healthcare costs in the follow-up period. Abbreviations: ATC: Anatomical Therapeutic Chemical (classification system); CI: confidence interval; d: day; DE: German-speaking area; FDM: family doctor model; FR: French-speaking area; inp.: inpatient; ME: marginal effects; n, number; NH: nursing home stay; outp.: outpatient; PCG: pharmaceutical cost group; PIM: potentially inappropriate medication; SCM: standard care model; TM: telemedicine model; wo: washout. Notes: Sample size: 35,400 (17,700 matched pairs). Washout refers to the period one year prior to the corresponding index date. The high deductible level is CHF ≥500. Outpatient consultations and number of physicians include primary care and specialist physicians. Inpatient costs include costs for inpatient stays in nursing homes, rehabilitation and psychiatric clinics. FDM: The treating physician is part of a physician network, which has a cooperation agreement with the health insurance, which defines reimbursement for integrated care services and regulates the type of cooperation and commits to a network-specific quality standard. FDM-light: In contrast to FDM, the treating physician is not part of an approved physician network.
Our study revealed a high PIM prevalence in the general Swiss older population, despite a gradual decrease over the last decade. It further showed a strong association between exposure to PIM and time to all-cause hospitalisation as well as increased total healthcare costs in the follow-up period.
The estimated PIM prevalence (33% in 2022) is in line with findings from previous studies from other European countries. Brick et al. systematically reviewed the PIM prevalence in older adults residing in Central and Eastern Europe in all care settings up to 2019 and showed a PIM prevalence of 34.6% [35]. In another systematic review, Tian et al. assessed the PIM prevalence among older adults worldwide from 1990 to 2022 and reported a pooled prevalence of 35% for Europe [36]. Both the national and international high PIM prevalence are surprising, since the concept of PIM was formally introduced in the early 1990s in the US and since then numerous assessment tools have been continuously developed and adapted across various countries around the world to prevent PIMs. We assume that one reason for the high prevalence is still a lack of knowledge of PIM and PIM assessment tools among healthcare providers, as suggested by studies [37, 38]. There might also be clinical reasons based on the patient’s individual health status. Older adults are affected by age-related physiological changes and are more likely to have chronic conditions requiring multiple medications. Managing complex patient cases can challenge healthcare providers in balancing effective and safe medication which might increase the risk of PIM exposure. For some patients, PIM may be unavoidable despite best efforts, where no other prescription options are available to reduce disease progression or mitigate pain.
Nevertheless, a decline in PIM prevalence has been observed over time in Switzerland and in Germany [39]. This development could be attributed to several factors. First, the introduction of newly updated PIM lists and their distribution might have gradually raised awareness of PIMs among healthcare providers and led to a more considered prescribing practice over the last decade. Second, the increased use of software programs developed to detect inappropriate medications likely played a role in preventing PIM prescriptions [40]. Third, the implementation of chronic care programmes and innovative integrated care models might have indirectly contributed to the reduction of PIMs by improving the overall care of chronic conditions, which are highly prevalent in older adults and often mean multiple medications per patient.
For the association between patients with PIM prescription and hospitalisation, the study found a significantly higher risk of hospitalisation in patients who received PIM prescriptions compared to those who did not. Similar results were demonstrated in comparable studies from Italy and Germany, which used claims data, focused on the older general population and applied methods of survival analysis [6, 7]. The distribution of drug classes from the PIM list showed that anxiolytics, hypnotics and sedatives were among the most frequently prescribed drug classes in the study. The most frequently prescribed PIM drug classes are presented in table S14 in the appendix. Thus, it seems plausible that medications from these drug classes have contributed to the positive association, as they are strongly associated with falls and cognitive impairment [41, 42], which can lead to severe adverse outcomes requiring hospital care. In addition, we found decreasing HRs over time based on the step function, indicating that severe adverse events requiring hospitalisation may occur shortly after exposure. This is in line with the results of a study that examined the temporal pattern of adverse events following drug administration, demonstrating that such events often occur within a short timeframe after exposure [43]. Furthermore, we explicitly included only patients without PIM exposure prior to the initial prescription. We assume that these patients responded more sensitively to initial PIM use and experienced immediate adverse effects as they had not developed medication tolerance or received regular re-assessment of their medication regimen to optimise care.
To the best of our knowledge, this is the first study in Switzerland to examine the differences in healthcare costs of the general older population with and without PIM prescription. Our findings revealed significantly higher healthcare costs in patients exposed to PIMs after adjustment for differences in sociodemographics and morbidity.
The cost differences were higher but in range with estimates of a systematic review [14], which evaluated the associated costs of PIMs in the general older population, and are likely to be explained by the different healthcare settings and methodologies applied. Considering that a large proportion of the older population was prescribed PIMs in Switzerland, our findings illustrate the significant financial burden of PIMs on the healthcare system. This might also strain healthcare resources and potentially affect quality and efficiency of healthcare, particularly in the context of skilled labour shortages and high clinician workloads.
Overall, the present study provides current estimates of PIM exposure and its associated risk of hospitalisation and healthcare costs in the general older population in Switzerland. Up-to-date and population-based data are crucial in the context of increasing political discussion on drug safety and healthcare costs in the older population. Assessments and evaluations of the extent of the public health burden help healthcare providers and policymakers and enable evidence-based discussions and decision-making. Given the high PIM prevalence and the associated public health burden, there is an urgent need to reduce PIMs in the general older population in Switzerland. In line with prior research [44], our analysis showed that a small number of drug classes such as anxiolytics, hypnotics and sedatives account for the majority of PIM prescriptions and are likely to contribute to the observed associations. The findings may reflect a lack of awareness in prescribing PIMs in primary care and the challenge of managing conflicting treatment recommendations in vulnerable patients, where a careful balance of benefits and risks is essential. Future research should examine prescribing processes in these clinical contexts and identify approaches that effectively and efficiently minimise PIMs. While some PIMs might be unavoidable due to lack of alternative treatments for disease progression or pain management, even a modest reduction in PIMs is likely to improve patient outcomes and lower healthcare costs.
The study has several strengths and limitations. First, the main strength of the study is the use of a large health insurance claims dataset which is practice-based and a reliable source of patient-level information. It provided comprehensive and per se unbiased information on the prescribed drug and healthcare services received by a large cohort of older adults with and without PIM prescription. The detailed data allowed us to identify the exact date of the initial PIM prescription and the subsequent hospitalisation. Second, the applied methodological approach including PSM followed by a multivariate adjusted regression analysis allowed robust estimators and reduced bias from potential confounders. Third, we applied a step function to model time dependence. This approach allowed the risk of hospitalisation to change at different time intervals and provided a more comprehensive and dynamic understanding of the temporal pattern of the association between the PIM and the risk of hospitalisation.
The study has also limitations.
First, the applied study design and dataset do not allow for any causal interpretation of the estimated results. Despite applying appropriate statistical methods and a washout period to reduce confounding and improve robustness, we cannot fully exclude the presence of unmeasured or unobserved confounding. Differences in underlying indications, multimorbidity and associated treatment needs between patients with and without PIMs exist and partly account for the observed higher hospitalisation and healthcare costs. The findings should therefore be interpreted as associations, and not as direct causal effects.
Second, our findings may not be fully generalisable to the entire older population of Switzerland due to selection bias. However, basic health insurance is mandatory in Switzerland, and Helsana Group is one of the largest insurers with a 16% market share and coverage across all geographical regions and age groups of Switzerland. While selection bias cannot be entirely excluded, we assume that it is unlikely to have substantial bias affecting our results.
Third, a comparison of patients with and without PIM exposure may not fully reflect the clinical reality. Patients at risk of PIM exposure may have been prescribed alternative medications classified as safer options, which reduce the risk of adverse effects while still providing therapeutic benefits. In some clinical situations, prescription of PIMs is unavoidable especially in severe or progressive diseases, which are more likely to occur in our target population of older adults. Nevertheless, using non-exposed patients as controls offers a suitable reference. PIM criteria focus primarily on identifying PIMs rather than providing alternatives; therefore comprehensive lists of alternative medications are not always available and might vary depending on the criteria used.
Fourth, the estimated CPH model does not account for PIM exposures that occurred between the initial prescription and subsequent hospitalisation. Therefore, we cannot exclude the potential influence of additional PIM prescription on the risk of hospitalisation. In fact, among exposed patients, those who were hospitalised were more likely to experience multiple PIM exposures within one year after the index date (55%) compared to non-hospitalised patients (44%). However, the primary aim in our study was to evaluate the impact of the initial PIM exposure, which is often the most clinically relevant one, as it represents the decision point where the risk is introduced.
Fifth, we cannot completely exclude the possibility of selection bias, which might also be reflected in changes in PIM prevalence within our outcome study sample resulting from the exclusion criteria applied during the washout and/or follow-up periods. However, we faced a trade-off between a clean study design that accounted for potential confounding factors related to earlier or later health issues and utilising a more complete and therefore more representative sample.
Sixth, the identification of PIMs and their associations with outcomes may vary depending on the PIM list applied [44]. In this study we used two well-established (Beers and PRISCUS) and widely adopted (Beers) lists. Furthermore, a recent study examining the prevalence of PIMs across multiple PIM lists found that only a few drug classes account for most prescriptions [44], and these classes are covered by the lists used in our analysis.
Lastly, we cannot entirely exclude the potential influence of the COVID-19 pandemic (2020–2021) on the outcomes in our study. However, we assume that the influence is limited as patients with chronic disease, which are highly prevalent in older populations, continued to receive necessary care [45].
This study showed a high PIM prevalence and associated public health burden in terms of hospitalisations and healthcare costs in the general older population of Switzerland. Our findings may indicate limited awareness in prescribing PIMs in primary care and the challenge associated with managing conflicting therapeutic recommendations in vulnerable patients. Given the ageing population and rising healthcare costs, the study highlights the urgent need for targeted strategies to reduce PIMs such as computer- and database-driven interventions for healthcare providers to efficiently detect and reduce PIMs.
The analysed dataset is not publicly available. The insurance claims data from Helsana Group are subject to protection and privacy restrictions and were used under licence for this study. Additional information is available from Helsana upon reasonable request.
Renato Farcher, Sereina M. Graber and Carola A. Huber are employees of Helsana Health Insurance AG. The employer played no part in study design, data collection, analysis and interpretation of the data, preparation of the manuscript or the decision to publish.
All authors have completed and submitted the International Committee of Medical Journal Editors form for disclosure of potential conflicts of interest. No potential conflict of interest related to the content of this manuscript was disclosed.
1. American Geriatrics Society 2023 updated AGS Beers Criteria® for potentially inappropriate medication use in older adults. J Am Geriatr Soc 2023; 71(7): 2052–81 https://doi.org/: 37139824
2. Heider D, Matschinger H, Meid AD, et al. Health Service Use, Costs, and Adverse Events Associated with Potentially Inappropriate Medication in Old Age in Germany: Retrospective Matched Cohort Study. Drugs Aging 2017; 34(4): 289–301 https://doi.org/: 28224283
3. Hyttinen V, Jyrkkä J, Saastamoinen LK, Vartiainen A-K, Valtonen H. The association of potentially inappropriate medication use on health outcomes and hospital costs in community-dwelling older persons: a longitudinal 12-year study. Eur J Health Econ 2019; 20(2): 233–43 https://doi.org/: 29978444
4. Reinhild Haerig T, Krause D, Klaassen-Mielke R, Rudolf H, Trampisch HJ, Thuermann P. Potentially inappropriate medication including drug-drug interaction and the risk of frequent falling, hospital admission, and death in older adults - results of a large cohort study (getABI). Front Pharmacol 2023; 14: 1062290 https://doi.org/: 36874024
5. Pérez T, Moriarty F, Wallace E, McDowell R, Redmond P, Fahey T. Prevalence of potentially inappropriate prescribing in older people in primary care and its association with hospital admission: longitudinal study. BMJ 2018; 363: k4524 https://doi.org/: 30429122 doi: https://doi.org/10.1136/bmj.k4524
6. Varga S, Alcusky M, Keith SW, et al. Hospitalization rates during potentially inappropriate medication use in a large population-based cohort of older adults. Br J Clin Pharmacol 2017; 83(11): 2572–80 https://doi.org/: 28667818 doi: https://doi.org/10.1111/bcp.13365
7. Endres HG, Kaufmann-Kolle P, Steeb V, Bauer E, Böttner C, Thürmann P. Association between Potentially Inappropriate Medication (PIM) Use and Risk of Hospitalization in Older Adults: An Observational Study Based on Routine Data Comparing PIM Use with Use of PIM Alternatives. PLoS One 2016; 11(2): e0146811 https://doi.org/: 26840396
8. Xing XX, Zhu C, Liang HY, et al. Associations Between Potentially Inappropriate Medications and Adverse Health Outcomes in the Elderly: A Systematic Review and Meta-analysis. Ann Pharmacother 2019; 53(10): 1005–19 https://doi.org/: 31129978 doi: https://doi.org/10.1177/1060028019853069
9. van der Stelt, C A K, Vermeulen Windsant-van den Tweel, A M A, Egberts ACG, et al. The Association Between Potentially Inappropriate Prescribing and Medication-Related Hospital Admissions in Older Patients: A Nested Case Control Study. Drug Saf 2016; 39(1): 79–87 https://doi.org/: 26553305 doi: https://doi.org/10.1007/s40264-015-0361-1
10. Brown JD, Hutchison LC, Li C, Painter JT, Martin BC. Predictive Validity of the Beers and Screening Tool of Older Persons' Potentially Inappropriate Prescriptions (STOPP) Criteria to Detect Adverse Drug Events, Hospitalizations, and Emergency Department Visits in the United States. J Am Geriatr Soc 2016; 64(1): 22–30 https://doi.org/: 26782849
11. Narayan SW, Nishtala PS. Associations of Potentially Inappropriate Medicine Use with Fall-Related Hospitalisations and Primary Care Visits in Older New Zealanders: A Population-Level Study Using the Updated 2012 Beers Criteria. Drugs Real World Outcomes 2015; 2(2): 137–41 https://doi.org/: 27747763
12. Reich O, Rosemann T, Rapold R, Blozik E, Senn O. Potentially inappropriate medication use in older patients in Swiss managed care plans: prevalence, determinants and association with hospitalization. PLoS One 2014; 9(8): e105425 https://doi.org/: 25136981
13. Schiavo G, Forgerini M, Lucchetta RC, Silva GO, Mastroianni PD. Cost of adverse drug events related to potentially inappropriate medication use: A systematic review. J Am Pharm Assoc (Wash DC). 2022;62(5):1463–1476.e14.
14. Malakouti SK, Javan-Noughabi J, Yousefzadeh N, et al. A Systematic Review of Potentially Inappropriate Medications Use and Related Costs Among the Elderly. Value Health Reg Issues 2021; 25: 172–9 https://doi.org/: 34311335 doi: https://doi.org/10.1016/j.vhri.2021.05.003
15. Shi S, Klotz U. Age-related changes in pharmacokinetics. Curr Drug Metab 2011; 12(7): 601–10 https://doi.org/: 21495970 doi: https://doi.org/10.2174/138920011796504527
16. Bundesamt für Statistik (BFS). Schweizerische Gesundheitsbefragung: BFS cited April 2024 Available from: URL: https://www.bfs.admin.ch/bfs/de/home/statistiken/gesundheit/erhebungen/sgb.html#
17. Lau SWJ, Huang Y, Hsieh J, et al. Participation of Older Adults in Clinical Trials for New Drug Applications and Biologics License Applications From 2010 Through 2019. JAMA Netw Open 2022; 5(10): e2236149 https://doi.org/: 36239939
18. Holt S, Schmiedl S, Thürmann PA. Potentially inappropriate medications in the elderly: the PRISCUS list. Dtsch Arztebl Int 2010; 107(31-32): 543–51 https://doi.org/: 20827352
19. O'Mahony D. STOPP-START v.2: Screening Tool of Older People's Prescriptions (STOPP) Screening Tool to Alert to Right Treatment (START) 2015.
20. Bundesamt für Statistik (BFS). Alterung der Bevölkerung: Faktoren der Alterung und Hunderjährige in der Schweiz: BFS; 2024 cited 2025 January 22 Available from: URL: https://www.bfs.admin.ch/bfs/de/home/statistiken/bevoelkerung/alterung.html
21. Bundesamt für Statistik (BFS). Ausgaben für das Gesundheitswesen: BFS; 2024 cited 2025 January 22 Available from: URL: https://www.bfs.admin.ch/bfs/de/home/statistiken/querschnittsthemen/wohlfahrtsmessung/indikatoren/gesundheitsausgaben.html
22. Schneider R, Reinau D, Schur N, et al. Drug prescription patterns, polypharmacy and potentially inappropriate medication in Swiss nursing homes: a descriptive analysis based on claims data. Swiss Med Wkly 2019; 149: w20126 https://doi.org/: 31568557 doi: https://doi.org/10.4414/smw.2019.20126
23. Rachamin Y, Jäger L, Meier R, et al. Prescription Rates, Polypharmacy and Prescriber Variability in Swiss General Practice-A Cross-Sectional Database Study. Front Pharmacol 2022; 13: 832994 https://doi.org/: 35237170
24. Chauvin P, Fustinoni S, Seematter-Bagnoud L, Herr M, Santos Eggimann B. Potentially inappropriate prescriptions: Associations with the health insurance contract and the quality of the patient-physician relationship? Health Policy 2021; 125(9): 1146–57 https://doi.org/: 34266705
25. Huber CA, Scherer M, Rapold R, Blozik E; Swiss Quality Indicator for Primary Care (SQIPRICA) Working Group members were. Evidence-based quality indicators for primary healthcare in association with the risk of hospitalisation: a population-based cohort study in Switzerland. BMJ Open. 2020 Apr;10(4):e032700.
26. American Geriatrics Society 2019 Updated AGS Beers Criteria® for Potentially Inappropriate Medication Use in Older Adults. J Am Geriatr Soc 2019; 67(4): 674–94 https://doi.org/: 30693946
27. WHO Collaborating Center for Drug Statistics. Methodology Guidelines for ATC classification and DDD assignment: World Health Organization; 2022. Available from: URL: https://atcddd.fhi.no/atc_ddd_index_and_guidelines/guidelines/
28. Huber CA, Szucs TD, Rapold R, Reich O. Identifying patients with chronic conditions using pharmacy data in Switzerland: an updated mapping approach to the classification of medications. BMC Public Health 2013; 13: 1030 https://doi.org/: 24172142 doi: https://doi.org/10.1186/1471-2458-13-1030
29. Zhang Z, Reinikainen J, Adeleke KA, Pieterse ME, Groothuis-Oudshoorn CGM. Time-varying covariates and coefficients in Cox regression models. Ann Transl Med 2018; 6(7): 121 https://doi.org/: 29955581 doi: https://doi.org/10.21037/atm.2018.02.12
30. Therneau T, Crowson C, Clinic M. Using Time Dependent Covariates and Time Dependent Coefficients in the Cox Model 2014.
31. Wu Q, Gu D. Oldest-Old Adults. In: Gu D, Dupre ME, editors. Encyclopedia of Gerontology and Population Aging. Cham: Springer International Publishing; 2021. pp. 3637–53. doi: https://doi.org/10.1007/978-3-030-22009-9_1121
32. RDocumentation. survSplit: Split a survival data set at specified times; survival (version 2.15) cited 2024 June 19 Available from: URL: https://www.rdocumentation.org/packages/survival/versions/2.15/topics/survSplit
33. RDocumentation. mfx: Marginal Effects, Odds Ratios and Incidence Rate Ratios for GLMs; mfx(version 1.2-2) cited 2024 August 10 Available from: URL: https://www.rdocumentation.org/packages/mfx/versions/1.2-2
34. Federal Council. Federal act of 30 September 2011 on research involving human beings (Human Research Act, HRA). cited 2024 February 12 Available from: URL: https://www.fedlex.admin.ch/eli/cc/2013/617/en
35. Brkic J, Fialova D, Okuyan B, et al. Prevalence of potentially inappropriate prescribing in older adults in Central and Eastern Europe: a systematic review and synthesis without meta-analysis. Sci Rep 2022; 12(1): 16774 https://doi.org/: 36202826 doi: https://doi.org/10.1038/s41598-022-19860-8
36. Tian F, Chen Z, Zeng Y, Feng Q, Chen X. Prevalence of Use of Potentially Inappropriate Medications Among Older Adults Worldwide: A Systematic Review and Meta-Analysis. JAMA Netw Open. 2023 Aug;6(8):e2326910–2326910.
37. Komagamine J, Miyatake S. Lack of awareness among emergency physicians of potentially inappropriate medications in elderly patients at EDs. Am J Emerg Med 2016; 34(9): 1888–90 https://doi.org/: 27358045 doi: https://doi.org/10.1016/j.ajem.2016.06.065
38. Pohontsch NJ, Heser K, Löffler A, et al. General practitioners' views on (long-term) prescription and use of problematic and potentially inappropriate medication for oldest-old patients-A qualitative interview study with GPs (CIM-TRIAD study). BMC Fam Pract 2017; 18(1): 22 https://doi.org/: 28212616
39. Selke Krulichová I, Selke GW, Thürmann PA. Trends and patterns in EU(7)-PIM prescribing to elderly patients in Germany. Eur J Clin Pharmacol 2021; 77(10): 1553–61 https://doi.org/: 33938975
40. Lo-Ciganic W-H, Huang JL, Zhang HH, et al. Using machine learning to predict risk of incident opioid use disorder among fee-for-service Medicare beneficiaries: A prognostic study. PLoS One 2020; 15(7): e0235981 https://doi.org/: 32678860
41. Thürmann P, Mann NK, Zawinell A, Niepraschk-von Dollen K, Schröder H. Potenziell inadäquate Medikation für ältere Menschen – PRISCUS 2.0. In: Schröder H, Thürmann P, Telschow C, Schröder M, Busse R, editors. Arzneimittel-Kompass 2022: Qualität der Arzneimittelversorgung. Berlin, Heidelberg: Springer Berlin Heidelberg; 2022. pp. 51–76. doi: https://doi.org/10.1007/978-3-662-66041-6_4
42. Salvo EM, Ferko NC, Cash SB, Gonzalez A, Kahrilas PJ. Umbrella review of 42 systematic reviews with meta-analyses: the safety of proton pump inhibitors. Aliment Pharmacol Ther 2021; 54(2): 129–43 https://doi.org/: 34114655 doi: https://doi.org/10.1111/apt.16407
43. Kim JH, Song Y-K. Utilizing temporal pattern of adverse event reports to identify potential late-onset adverse events. Expert Opinion on Drug Safety: 1–8 https://doi.org/
44. Schietzel S, Zechmann S, Rachamin Y, Neuner-Jehle S, Senn O, Grischott T. Potentially Inappropriate Medication Use in Primary Care in Switzerland. JAMA Netw Open. 2024 Jun;7(6):e2417988–2417988.
45. Bähler C, Elmiger M, Signorell A. Helsana-Report: Corona: Auswirkungen der Corona-Pandemie auf die medizinsiche Versorgung in der Schweiz 2021.
The appendix is available in the pdf version of the article at https://doi.org/10.57187/4613.