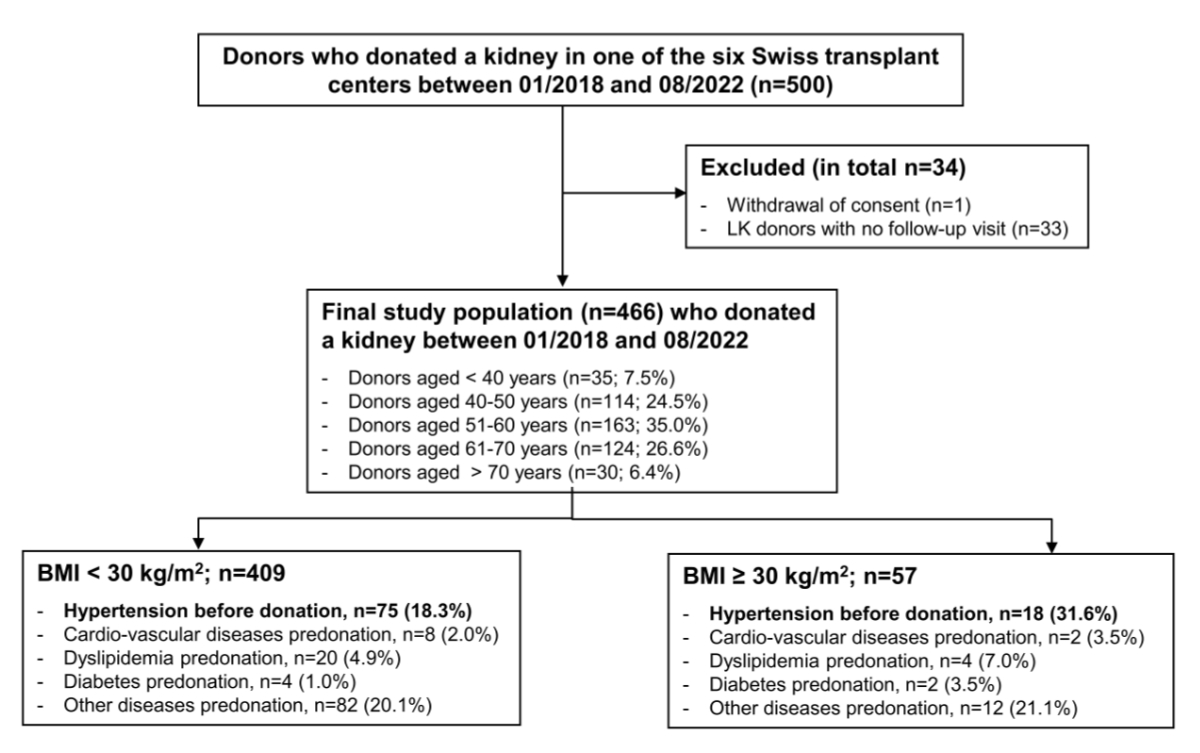
Figure 1Study flowchart. Donors with no follow-up visits were excluded (n = 33) as well as one donor who withdrew consent; thus the final population consisted of 466 donors who donated a kidney between January 2018 and August 2022.
DOI: https://doi.org/https://doi.org/10.57187/s.4513
Chronic Kidney Disease Epidemiology Collaboration
estimated glomerular filtration rate (calculated by the CKD-EPI formula; in ml/min/1.73 m2 body surface area)
haemoglobin A1c
glucagon-like peptide-1
Kidney Disease Improving Global Outcomes
Organ Procurement and Transplantation Network
Swiss Academy of Medical Sciences
Sodium-glucose co-transporter 2
Swiss Organ Living-Donor Health Registry
Urine albumin-to-creatinine ratio
Urine protein-to-creatinine ratio
World Health Organization
Nephrectomy for living kidney donation has become a well-established surgical procedure for healthy individuals. Living kidney donor transplantation accounts for nearly one-third of kidney transplantations in Switzerland (https://www.swisstransplant.org). However, due to the persistent organ shortage worldwide, the selection criteria for living kidney donors have been broadened to include elderly donors, as well as donors with comorbidities such as hypertension and obesity [1, 2]. Further, accepting living kidney donors with type 2 diabetes mellitus remains a much debated topic in living kidney donor transplantation [3].
Although hypertension is a well-known risk factor for kidney and cardiovascular diseases, the Kidney Disease Improving Global Outcomes (KDIGO) guidelines suggest that donor candidates with hypertension that can be controlled using one or two antihypertensive agents and with no evidence of target organ damage are acceptable for living kidney donation [4]. The recently revised medical-ethical guidelines on living donation of solid organs from the Swiss Academy of Medical Sciences (SAMW; https://www.samw.ch) are consistent with those from KDIGO. But these guidelines strongly advise that donor candidates should be counselled on lifestyle interventions to address modifiable risk factors for hypertension and cardiovascular diseases, including a healthy diet and achievement of normal body weight, smoking abstinence and regular exercise [4]. Ideally, these interventions should be initiated before donation and maintained lifelong.
Previous studies have shown that in the general population obesity is associated with increased surgical as well as long-term medical risks like type 2 diabetes mellitus and cardiovascular problems [5–7]. Further, several epidemiological investigations have confirmed that obesity is a significant risk factor for the occurrence of proteinuria and kidney failure in the general population [8]. Patients with reduced renal mass of any origin seem to be particularly susceptible to the detrimental influence of obesity on kidney outcome [8]. In patients undergoing unilateral nephrectomy, higher body mass index (BMI) has been associated with increased risk of proteinuria and renal insufficiency [9]. Comparatively, Ibrahim et al. estimated the risk of proteinuria, reduced glomerular filtration rate (GFR) and kidney failure in 3956 white living kidney donors with a mean follow-up of 16.6±11.9 years and showed that those with a higher BMI at donation had a higher risk of developing proteinuria as well as reaching an estimated glomerular filtration rate (eGFR) <30 ml/min/1.73 m2 or kidney failure, although they excluded donors with a BMI >30 kg/m2 [10]. In addition, Locke et al. studied the risk of kidney failure associated with obesity at the time of donation among 119,769 living kidney donors with a maximum follow-up of 20 years and demonstrated that obese living kidney donors had a significantly higher risk of kidney failure compared to their non-obese counterparts [11]. Nevertheless, BMI acceptance criteria for living kidney donors have become less stringent over time. Previous studies reported an increase in kidney transplantations from obese donors of about 20% between 1963 and 2011 [1, 12].
Type 2 diabetes mellitus has a strong genetic component and about 30% of those afflicted with it in the general population develop kidney damage. Historically, the Organ Procurement and Transplantation Network (OPTN) and many other international guidelines have excluded individuals with type 2 diabetes mellitus or with a positive family history of type 2 diabetes mellitus from living kidney donation due to concerns regarding the potential additive effect of hyperfiltration that is triggered by type 2 diabetes mellitus or a reduction in renal mass [3]. However, in the meantime, the guidelines were loosened. As per KDIGO, “the decision to approve donor candidates with pre-diabetes or type 2 diabetes mellitus should be individualised based on demographic and health profile in relation to the transplant program’s acceptance threshold” [4]. The European Best Practice Guidelines qualify donor candidates with pre-existing type 2 diabetes mellitus for living kidney donation only under “exceptional circumstances” [13] and the OPTN nowadays states in their guidelines that donor candidates with type 2 diabetes mellitus are now being considered for donation “unless assessment of donor demographics or comorbidities reveals evidence of end-organ damage or unacceptable lifetime risk of complications” (https://optn.transplant.hrsa.gov). Concerning pre-diabetes and type 2 diabetes mellitus, the SAMW guidelines are consistent (https://www.samw.ch). It is crucial to highlight that, according to all guidelines, donor candidates with pre-existing pre-diabetes or type 2 diabetes mellitus must be informed about disease progression, which may lead to severe health complications like kidney failure; for example, Ibrahim et al. demonstrated that postdonation type 2 diabetes mellitus more than doubled the risk of eGFR ≤30 ml/min/1.73 m2 or kidney failure [10].
Obviously, living kidney donor transplantation exposes donors to potential risks of early and long-term complications; therefore detailed and updated knowledge about these risks is essential with a special focus on living kidney donors who were accepted with a certain comorbidity. This information can best be obtained from prospective cohort/registry studies [14]. Nevertheless, caution is needed when extrapolating living kidney donation outcome data to different populations due to the variety of geographic origin, socioeconomic differences, as well as racial and ethnic disparities between countries. Thus, conclusions cannot be applied 1:1 to other populations. Generating local outcome data of the living kidney donor cohort in Switzerland highlights the advantage of generating data from a well-defined population of predominantly Caucasians living in a country with a universal healthcare system. As little is known about the postdonation metabolic risk of living kidney donors in Switzerland, this prospective, multicentre cohort study investigated the trajectories of metabolic parameters before and after living kidney donation and evaluated the risk of weight gain, occurrence of new-onset type 2 diabetes mellitus, hypertension or cardiovascular diseases among living kidney donors recorded within a national registry.
The Swiss Organ Living-Donor Health Registry (SOL-DHR) was founded in 1993 as the first prospective registry worldwide. Since its founding, the SOL-DHR has provided lifelong follow-up for living kidney donors who donated in Switzerland and has collected data from all living organ donors of Swiss transplant centres [15]. This study, which prospectively collected data from living kidney donors, was approved by the ethics committee of Northwestern and Central Switzerland (www.eknz.ch; project-ID 2023-02076) and all donors gave written informed consent.
Follow-up parameters with a focus on metabolic values including haemoglobin A1c (HbA1c) have only been collected in the national registry since the second half of 2017. To ensure that the relevant parameters were available for all included living kidney donors before donation, individuals who donated before 2018 were not considered for this study. Between January 2018 and August 2022, 500 individuals donated a kidney at one of the Swiss transplant centres. After exclusion of 1 person due to withdrawal of consent and 33 without any follow-up data, the final population for a special focus on metabolic parameters consisted of 466 individuals who donated a kidney between January 2018 and August 2022 with a minimum 1-year follow-up (figure 1). In accordance with the national follow-up protocol, living kidney donors are systematically assessed at fixed intervals – namely at 1, 3, 5, 7 and 10 years post-donation, then every 2 years. As metabolic data are typically first collected at the 1-year visit, a minimum follow-up of one year was required to ensure availability of postdonation data for analysis.
Figure 1Study flowchart. Donors with no follow-up visits were excluded (n = 33) as well as one donor who withdrew consent; thus the final population consisted of 466 donors who donated a kidney between January 2018 and August 2022.
The national registry arranges follow-up visits for living kidney donors at one year and then every two years lifelong. Data collection principles before kidney donation, at the time of discharge from nephrectomy and thereafter have been described in detail previously [15, 16]. Briefly, transplant centres inform donors about the registry and send data on baseline characteristics, comorbidities and the relationship with recipients to the SOL-DHR. Follow-up data are provided by the treating physician and include parameters on kidney function, metabolic parameters, current medications and whether new complications/diseases have occurred since the last visit.
Donor baseline characteristics include, sex, age, height, weight, BMI, blood pressure, predonation medications taken and pre-existing comorbidities. Pre-existing diseases/problems were classified into the following categories: (a) arterial hypertension if the donor had taken any antihypertensive medications before donation, (b) cardiovascular diseases (coronary heart disease, aortic aneurysm, cardiac arrhythmia, etc), (c) metabolic disorders (i.e. obesity, defined as a BMI ≥30 kg/m2 according to the World Health Organization (WHO) classification; type 2 diabetes mellitus defined as a predonation HbA1c value ≥6.5% or use of any antidiabetic medications before donation; and dyslipidaemia), as well as other diseases (i.e. a summary of all other current or past diseases such as pulmonary problems, rheumatoid diseases, problems of the musculoskeletal system, endocrine disorders and tumours). Further, the transplant centres reported the side of nephrectomy, the surgical technique used, the length of in-hospital stay as well as early peri-and postoperative complications as previously described [16]. Follow-up data on weight, BMI, blood pressure control, any medications taken including new drugs, and occurrence of new diseases/problems since the last follow-up visit were collected. Concerning blood pressure, three measurements were taken and the mean value used.
Although a formal primary outcome was not pre-specified, the main aim of this exploratory study was to describe the trajectories of metabolic parameters before and after living kidney donation, with a particular focus on weight changes. This hypothesis-generating approach aimed to inform future research directions. Furthermore, we wanted to explore the occurrence of new-onset type 2 diabetes mellitus, hypertension or other (cardiovascular) diseases after living kidney donation with a special focus on obese and non-obese living kidney donors.
The pre- and postdonation laboratory parameters collected included serum creatinine, eGFR (calculated using the CKD-EPI 2009 formula) and urine analysis (i.e. urine dipstick analysis, urine sediment examination if dipstick is abnormal, urine protein-to-creatinine ratio [UPCR], urine albumin-to-creatinine ratio [UACR]), as well as HbA1c values. Since 1993, blood/urine samples for all laboratory parameters have been sent to a core laboratory (Viollier AG, Basel, Switzerland).
We used JMP software version 16.0 (SAS Institute Inc., Cary, NC) and R version 4.4.1 (www.R-project.org) for statistical analysis. Categorical data were summarised as counts and percentages and analysed using Fisher’s exact test or Pearson’s chi-squared test, as appropriate. Hypothesis testing for continuous variables was performed using the Wilcoxon signed-rank test for paired data and data summarised as median and interquartile range (IQR) if not stated otherwise. Missing values were assumed to be missing at random. No imputation was used to address missing values. As a measure of effect, the median differences (95% CI) and corresponding paired rank-biserial rₛ correlation coefficients were calculated. For interpretation purposes, effect sizes were graded according to biserial rₛ correlation coefficients as follows: rₛ <0.2 is very small; between 0.2 and <0.5 is small; between 0.5 and <0.8 is medium; ≥0.8 is large. As a decrease of kidney function (i.e. serum creatinine levels and corresponding eGFR) from predonation to 1-year postdonation is obvious due to loss of nephron mass, the differences between the creatinine values/eGFR at the first follow-up visit 1-year postdonation and the last follow-up (i.e. the 3-year or 5-year follow-up visit) were calculated. For all other parameters including UPCR and UACR, the differences between predonation and the last follow-up visit were analysed. Diluted urine samples with a urine creatinine value <3 mmol/l were excluded from the analysis of the UPCR and UACR of donors with comparable pairs of urine samples. For the analysis of outcome data, living kidney donors were stratified into two groups based on predonation BMI: <30 kg/m2 or ≥30 kg/m2. In addition, living kidney donors were stratified into tertiles based on postdonation BMI change as follows: weight loss with BMI change ≤0.1 kg/m2; little to no weight change with BMI change from predonation to last follow-up between 0 and 1.2 kg/m2; and weight gain with a BMI change ≥1.3 kg/m2. Furthermore, we also carried out an interim analysis by stratifying donors according to predonation BMI into three groups: normal weight if BMI <25 kg/m2; overweight if BMI 25–29.9 kg/m2; and obese if BMI ≥30 kg/m2. Correlation analysis was performed to determine the relationship between donor age at the time of donation and predonation BMI with change of BMI after living kidney donation. The associations of age and predonation BMI with change in BMI postdonation are visualised in correlation plots. For all analyses, statistical significance was set at a two-tailed p-value <0.05.
For 466 individuals who donated a kidney between January 2018 and August 2022 (93.2% of all living kidney donors who were registered during that period), parameters with a focus on metabolic values including HbA1c as well as follow-up data of at least one year were available (figure 1). Baseline characteristics of donors stratified according to their inclusion and exclusion are depicted in appendix table S1. The baseline characteristics of included donors are summarised in table 1. The median age at the time of donation was 57 years and 65.7% of the living kidney donors were female. Only a small number of donors were aged <40 or >70 years (both less than 10%, table 1). Most donors were partners, parents or siblings.
Table 1Baseline characteristics, n = 466. Values are median (IQR) unless otherwise stated.
| Variable | Overall | |
| Age at donation in years | 57 (49–64) | |
| Age group at donation, n (%) | <40 years | 35 (7.5%) |
| 40–50 years | 114 (24.5%) | |
| 51–60 years | 163 (35.0%) | |
| 61–70 years | 124 (26.6%) | |
| >70 years | 30 (6.4%) | |
| Sex, n (%) | Female | 306 (65.7%) |
| Male | 160 (34.3%) | |
| Donor-recipient relationship, n (%) | Parent | 126 (27.0%) |
| Sibling | 73 (15.7%) | |
| Other relative | 16 (3.4%) | |
| Partner | 163 (35.0%) | |
| Other non-relative | 88 (18.9%) | |
| Kidney paired donation, n (%) | 18 (3.9%) | |
| Altruistic, n (%) | 3 (0.6%) | |
| Pre-existing diseases, n (%)* | Was/were present | 218 (46.8%) |
| Hypertension | 93 (20.0%) | |
| Cardiovascular diseases | 10 (2.1%) | |
| Dyslipidaemia | 28 (6.0%) | |
| Type 2 diabetes mellitus | 6 (1.3%) | |
| Obesity | 57 (12.2%) | |
| Other | 94 (20.2%) | |
| Current smoker, n (%)** | 47 (16.7%) | |
| Kidney function before donation | Creatinine, µmol/l | 65 (58–74) |
| eGFR, CKD-EPI (ml/min/1.73 m2) | 95 (88–103) | |
| UPCR, mg/mmol*** | 8.3 (6.2–11.3) | |
| UACR, mg/mmol*** | 0.7 (0.4–1.2) | |
| Systolic blood pressure in mm Hg | 126 (118–136) | |
| Diastolic blood pressure in mm Hg | 79 (73–84) | |
| Weight in kg | 72 (64–80) | |
| BMI in kg/m2 | Overall | 25.3 (23.2–28.1) |
| BMI <25 kg/m2, n (%) | 205 (44.0%) | |
| BMI 25–29.9 kg/m2, n (%) | 204 (43.8%) | |
| BMI 30–35 kg/m2, n (%) | 52 (11.2%) | |
| BMI >35 kg/m2, n (%) | 5 (1.0%) | |
| HbA1c**** | 5.4 (5.2–5.6) | |
| Prediabetes, n (%)**** | 75 (17.5%) | |
BMI: body mass index; eGFR: estimated glomerular filtration rate (calculated by the Chronic Kidney Disease Epidemiology Collaboration [CKD-EPI] formula in ml/min/1.73 m2 body surface area); IQR: interquartile range.
* In total, 218 (46.8%) living kidney donors had one or more preexisting diseases.
** Smoking behaviour is known for 281 (60.3%) living kidney donors.
*** UPCR = urine protein-to-creatinine ratio and UACR = urine albumin-to-creatinine ratio, which was only calculated for donors with undiluted urine (i.e. urine creatinine ≥3 mmol/l; n = 318).
**** HbA1c:haemoglobin A1c, available for 429 (92.1%) donors before donation since January 2018.
In total, 218 (46.8%) living kidney donors had one or more preexisting diseases (table 1). Focusing on metabolic parameters and cardiovascular problems, 20% of living kidney donors had arterial hypertension treated with at least one antihypertensive agent (n = 93). Most living kidney donors were treated with a monotherapy (61/93), and mainly blockers of the renin-angiotensin system were prescribed, either as monotherapy or in combination with a beta-blocker, calcium-channel blocker or diuretic agent (74/93), and only three living kidney donors were treated with a triple antihypertensive therapy before living kidney donation (table S2). Further, 12.2% (n = 57) of living kidney donors had a BMI ≥30 kg/m2 and were defined as having predonation obesity. None of these living kidney donors was treated with a glucagon-like peptide-1 (GLP-1) agonist to lose weight before living kidney donation. Pre-existing dyslipidaemia treated with a lipid-lowering agent was present in 6.0% of donors while cardiovascular diseases such as coronary heart disease or cardiac rhythm disturbance (e.g. atrial fibrillation) were observed in 2.1%. In addition, six living kidney donors had type 2 diabetes mellitus at the time of donation, defined as either the use of antidiabetic agents (3/6) or having an HbA1c value of ≥6.5% (table 1). Median predonation creatinine was 65 µmol/l, and the median eGFR was 95 ml/min/1.73 m2. Thus, most donors had normal kidney function, and only three donors had a predonation eGFR <60 ml/min/1.73 m2. The median predonation systolic and diastolic blood pressures were 126 mm Hg and 79 mm Hg, respectively. The median predonation BMI was 25.3 kg/m2, 11.2% of donors had a BMI in the range 30–35 kg/m2 and only 1.0% of the donors had a BMI >35 kg/m2 at the time of donation. The median HbA1c value was 5.4% (table 1).
In addition, we stratified donors by predonation BMI of < or ≥30 kg/m2. The corresponding baseline characteristics of the two groups are shown in table 2. The median weight of donors in the BMI <30 kg/m2 group was 70 kg compared to 90 kg in donors with a BMI of ≥30 kg/m2 (p <0.0001, table 2). Predonation blood pressure values also significantly differed between the two groups (p ≤0.004, table 2); however median systolic and diastolic blood pressure values were within the normal range in both groups. Further, the percentage of donors with predonation arterial hypertension was higher in the donor group with predonation BMI ≥30 kg/m2 compared to BMI <30 kg/m2 (31.6% vs 18.3%) (p = 0.03). The same was observed for HbA1c values, although the absolute differences were only small (p = 0.02) (table 2). We also carried out an interim analysis by stratifying donors according to predonation BMI into three groups (i.e. normal weight forBMI <25 kg/m2, overweight for BMI 25–29.9 kg/m2 and obese for BMI ≥30 kg/m2). Predonation blood pressure values were again different in these three groups. (p ≤0.002, appendix table S3); however median systolic and diastolic blood pressure values were within the normal range in all BMI strata. Further, the percentage of donors with predonation arterial hypertension was highest in the predonation obese group than in the other groups (p = 0.0005, table S3). Predonation HbA1c values also significantly differed between the three groups, although the absolute differences were only small (p = 0.004) (table S3). This was triggered by significantly higher HbA1c values in obese donors compared to normal-weight donors (p = 0.007).
Table 2Baseline characteristics of donors stratified by predonation body mass index < or ≥30 kg/m2, n = 466. Values are median (IQR) unless otherwise stated. Missing values were assumed to be missing at random. No imputation was used to address missing values.
| Variable | <30 kg/m (n = 409) | ≥30 kg/m (n = 57) | p-value | |
| Age at donation in years | 57 (49–63) | 57 (49–64) | 0.86 | |
| Age group at donation, n (%) | <40 years | 32 (7.8%) | 3 (5.3%) | 0.71 |
| 40–50 years | 97 (23.7%) | 17 (29.8%) | ||
| 51–60 years | 144 (35.2%) | 19 (33.3%) | ||
| 61–70 years | 111 (27.2%) | 13 (22.8%) | ||
| >70 years | 25 (6.1%) | 5 (8.8%) | ||
| Sex, n (%) | Female | 270 (66.0%) | 36 (63.2%) | 0.66 |
| Male | 139 (34.0%) | 21 (36.8%) | ||
| Donor-recipient relation, n (%) | Parent | 113 (27.6%) | 13 (22.8%) | 0.56 |
| Sibling | 64 (15.7%) | 9 (15.8%) | ||
| Other relative | 12 (2.9%) | 4 (7.0%) | ||
| Partner | 142 (34.7%) | 21 (36.9%) | ||
| Other non-relative | 78 (19.1%) | 10 (17.5%) | ||
| Kidney paired donation, n (%) | 17 (4.2%) | 1 (1.8%) | 0.71 | |
| Hypertension predonation, n (%) | 75 (18.3%) | 18 (31.6%) | 0.03 | |
| Cardiovascular diseases predonation, n (%) | 8 (2.0%) | 2 (3.5%) | 0.35 | |
| Dyslipidaemia predonation, n (%) | 23 (5.6%) | 5 (8.8%) | 0.35 | |
| Type 2 diabetes mellitus predonation, n (%) | 4 (1.0%) | 2 (3.5%) | 0.16 | |
| Other diseases predonation | 82 (20.1%) | 12 (21.1%) | 0.86 | |
| Current smoker, n (%)* | 44 (10.8%) | 3 (5.3%) | 0.43 | |
| Kidney function predonation | Creatinine, µmol/l | 65 (58–74) | 68 (60–78) | 0.06 |
| eGFR, CKD-EPI (ml/min/1.73 m2) | 96 (89–104) | 92 (85–102) | 0.08 | |
| UPCR, mg/mmol** | 8.6 (6.2–11.7) | 8.1 (6.1–10.1) | 0.25 | |
| UACR, mg/mmol** | 0.7 (0.4–1.2) | 0.8 (0.4–1.4) | 0.70 | |
| Systolic blood pressure in mm Hg | 126 (117–135) | 133 (121–143) | 0.001 | |
| Diastolic blood pressure in mm Hg | 79 (73–83) | 81 (76–88) | 0.004 | |
| Body weight in kg | 70 (63–78) | 90 (82–97) | <0.0001 | |
| HbA1c *** | 5.4 (5.2–5.6) | 5.5 (5.3–5.7) | 0.02 | |
| Prediabetes predonation, n (%)*** | 64 (17.0%) | 11 (20.8%) | 0.22 | |
BMI: Body mass index; eGFR: estimated glomerular filtration rate (calculated by the Chronic Kidney Disease Epidemiology Collaboration [CKD-EPI] formula; in ml/min/1.73 m2 body surface area); IQR: interquartile range.
* Smoking behaviour is known for 281 (60.3%) living kidney donors.
** UPCR = urine protein-to-creatinine ratio and UACR = urine albumin-to-creatinine ratio, which was only calculated for donors with undiluted urine (i.e. urine creatinine ≥3 mmol/l; n = 318).
*** HbA1c = haemoglobin A1c, available for 429 (91.9%) donors before donation since January 2018.
The course of kidney function, blood pressure and metabolic parameters is presented in table 3. Concerning kidney function, compared to one year after donation, eGFR was not significantly different at the last follow-up time point (i.e. the 3-year or the 5-year follow-up visit for those individuals with a 5-year follow-up) (p = 0.19; table 3). Median UPCR and UACR values at last follow-up were significantly different compared to before donation (both p <0.0001); however the median differences were small with UACR even decreasing (UPCR: 3.5 mg/mmol, 95% confidence interval [CI]: 2.4–4.2; UACR: −0.3 mg/mmol, 95% CI −0.4–0.2) with a corresponding paired rank-biserial coefficient of r = 0.51 and −0.43, respectively (table 3). In total, 7.0% of those who developed proteinuria, defined as a UPCR >20 mg/mmol creatinine after donation, had never had proteinuria before. Concerning blood pressure values and metabolic parameters such as HbA1c and weight, the investigated outcome parameters also showed small median differences, with corresponding small to medium correlation coefficients (table 3).
Table 3Course of kidney function, blood pressure and metabolic parameters, n = 466. For all scores, the median value (IQR) is indicated.
| Parameter | Before donation | Last follow-up | Median difference | Paired rank-biserial | p-value | |
| Median (IQR) | Median (IQR) | 95% CI | 95% CI | |||
| Kidney function | Creatinine (µmol/l)* | 98 (87–112) | 97 (85–113) | 1.0 (−3–2) | −0.04 (−0.11–0.10) | 0.63 |
| eGFR, CKD-EPI (ml/min/1.73 m2)* | 60 (53–70) | 61 (53–71) | 0.0 (−1.7–1.6) | −0.1 (−0.24–0.05) | 0.19 | |
| UPCR (mg/mmol)** | 8.3 (6.2–11.4) | 11.7 (8.3–14.9) | 3.5 (2.4–4.2) | 0.51 (0.41–0.61) | <0.0001 | |
| UACR (mg/mmol)** | 0.7 (0.4–1.2) | 0.5 (0.3–0.8) | −0.3 (−0.4–0.2) | −0.43 (−0.53–0.31) | <0.0001 | |
| Blood pressure | Systolic (mm Hg) | 126 (118–136) | 128 (120–137) | 2 (0–3) | 0.10 (0.0–0.21) | 0.06 |
| Diastolic (mm Hg) | 79 (73–84) | 80 (75–87) | 1 (0–3) | 0.27 (0.17–0.37) | <0.0001 | |
| Metabolic variables | HbA1c | 5.4 (5.2–5.6) | 5.5 (5.3–5.8) | 0.1 (0.1–0.2) | 0.69 (0.63–0.74) | <0.0001 |
| Body weight (kg)*** | 72 (64–80) | 73 (64–82) | 0.9 (−0.4–2.0) | 0.21 (0.10–0.31) | 0.0002 | |
| BMI (kg/m2)*** | 25.3 (23.2–28.1) | 25.6 (23.1–28.7) | 0.35 (−0.10–0.65) | 0.24 (0.13–0.33) | <0.0001 |
BMI: body mass index; CI: confidence interval; HbA1c: haemoglobin A1c; IQR: interquartile range; UACR: urine albumin-to-creatinine ratio; UPCR: urine protein-to-creatinine ratio.
* As a decrease of kidney function (i.e. serum creatinine levels and corresponding eGFR) from before donation to 1-year postdonation is obvious due to loss of nephron mass, the differences between the creatinine/eGFR values at the first follow-up visit one year postdonation and the last follow-up (i.e. the 3-year or 5-year follow-up visit) were calculated by the Wilcoxon signed-rank test for paired data and corresponding rank-biserial rₛ correlation coefficients were calculated (i.e. within n = 236 pairs of creatinine/eGFR samples). For all other parameters including UPCR and UACR, the differences from before donation to the last follow-up visit were analysed by the Wilcoxon signed-rank test for paired data. As a measure of effect, the median differences (95% CI) and corresponding paired rank-biserial rₛ correlation coefficients were calculated.
** Diluted urine samples with a urine creatinine value <3 mmol/l (n = 126) were excluded from the analysis of the UPCR and UACR.
*** Information on body weight/BMI at last follow-up was not available for 20 donors. Missing values were assumed to be missing at random. No imputation was used to address missing values.
The relationship of age and predonation BMI with change in postdonation BMI is shown in the corresponding correlation plots. There was no correlation between age at donation and BMI change after living kidney donation (Pearson correlation coefficient r = 0.05, 95% CI: −0.05–0.14, p = 0.33) nor between predonation BMI and BMI change (r = −0.02, 95% CI: −0.11–0.07, p = 0.69) (figure 2).
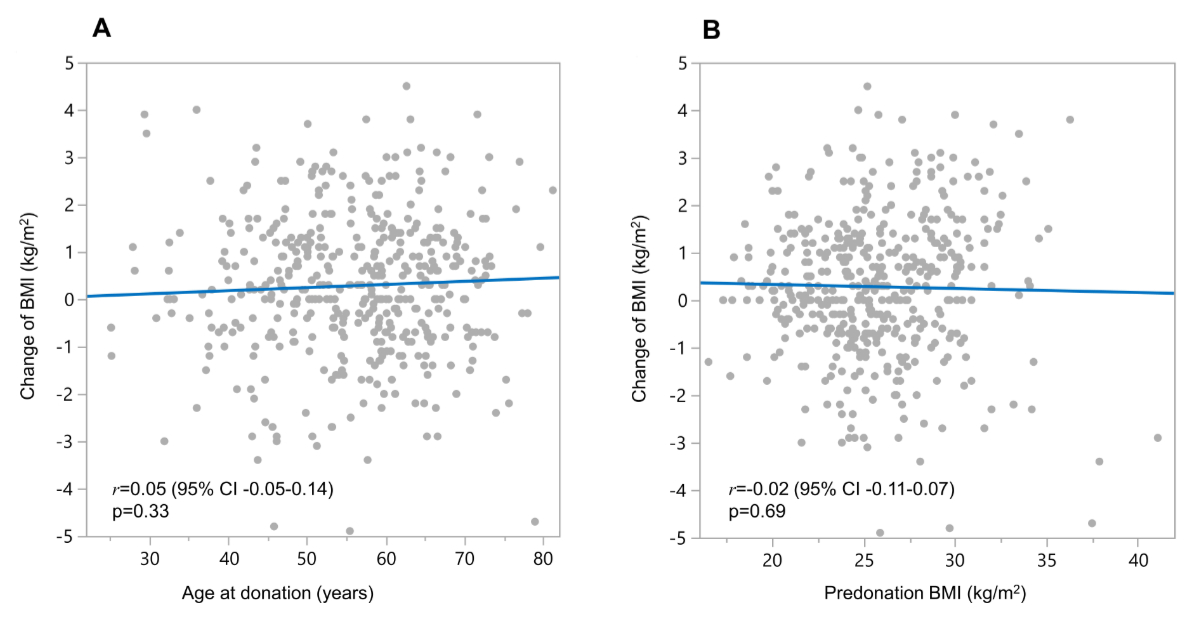
Figure 2The relationship of (A) age at donation and (B) predonation body mass index (BMI, kg/m2) with change in BMI after living kidney donation visualised in correlation plots. The blue line indicates the linear association. The corresponding Pearson correlation coefficients (r) including the 95% confidence intervals (CI) as well as p-values are indicated.
Next, we dichotomised the donors according to predonation BMI < or ≥30 kg/m2 as shown in table 4. During the observation period, donors with a predonation BMI ≥30 kg/m2 maintained their high BMI levels with a median BMI of 32.2 kg/m2 at last follow-up compared to a median BMI of 25.0 kg/m2 among donors in the predonation BMI <30 kg/m2 group. One living kidney donor with a predonation BMI ≥30 kg/m2 was treated with a glucagon-like peptide-1 (GLP-1) agonist during follow-up to lose weight. In addition, donors with high predonation BMI levels showed slightly higher systolic blood pressure and HbA1c values (both p = 0.02); however, the differences were small, with corresponding small correlation coefficients (i.e. paired rank-biserial r = 0.2 for both) (table 4). During the observation period, 6% of donors developed arterial hypertension (n = 28). Most of them were treated with an antihypertensive monotherapy (25/28), as summarised in appendix table S4. Furthermore, 2.6% (n = 12) of donors developed cardiovascular diseases and only 1.1% (n = 5) of donors developed type 2 diabetes mellitus (table 4). In addition, during the observation period, 8.6% (n = 40) of donors were newly treated with a lipid-lowering agent. Obese donors (BMI ≥30 kg/m²) had a higher postdonation type 2 diabetes mellitus incidence than those with BMI <30 kg/m² (p = 0.01, table 4); however, the overall type 2 diabetes mellitus frequency was low. Furthermore, there was also a higher frequency of individuals with prediabetes at last follow-up within the obese donor group compared to non-obese donors (p = 0.003, table 4). With stratification of donors according to predonation BMI (normal weight: BMI <25 kg/m2; overweight: BMI 25–29.9 kg/m2; obese: BMI ≥30 kg/m2), outcomes were similar (appendix table S5).
Table 4Outcomes of donors stratified by predonation body mass index < or ≥30 kg/m2, n = 466. Values are median (IQR) unless otherwise stated. Missing values were assumed to be missing at random. No imputation was used to address missing values.
| Variable | <30 kg/m (n = 409) | ≥30 kg/m (n = 57) | p-value | |
| Time from donation in years | 2.9 (1.0–3.1) | 3.0 (1.1–3.1) | 0.42 | |
| Age at last follow-up in years | 59 (51–66) | 60 (51–66) | 0.77 | |
| BMI at last follow-up in kg/m2* | 25.0 (22.6–27.5) | 32.2 (30.7–34.0) | <0.0001 | |
| Change in BMI* | 0.2 (−0.6–1.2) | 0.7 (−0.9–1.7) | 0.17 | |
| Percent change in BMI in % | 1.0 (−2.6–4.8) | 2.3 (−2.9–5.5) | 0.37 | |
| SBP at last follow-up in mm Hg | 127 (119–136) | 133 (122–140) | 0.02 | |
| DBP at last follow-up in mm Hg | 80 (75–86) | 81 (77–89) | 0.17 | |
| HbA1c at last follow-up | 5.5 (5.3–5.8) | 5.6 (5.4–5.9) | 0.02 | |
| Prediabetes at last follow-up, n (%) | 133 (32.5%) | 19 (33.3%) | 0.003 | |
| Kidney function at last follow-up** | Creatinine, µmol/l | 96 (84–112) | 102 (85–120) | 0.34 |
| eGFR, CKD-EPI (ml/min/1.73 m2) | 62 (54–71) | 60 (49–75) | 0.72 | |
| UPCR, mg/mmol*** | 11.7 (8.4–15.1) | 12.1 (8.8–15.4) | 0.59 | |
| UACR, mg/mmol*** | 0.5 (0.3–0.9) | 0.5 (0.3–0.8) | 0.74 | |
| New-onset arterial hypertension, n (%) | 21 (5.1%) | 7 (12.3%) | 0.07 | |
| Cardiovascular diseases, n (%)**** | 10 (2.4%) | 2 (3.5%) | 0.65 | |
| New-onset type 2 diabetes mellitus, n (%) | 2 (0.5%) | 3 (5.3%) | 0.01 | |
| Newly treated dyslipidaemia | 35 (8.6%) | 5 (8.8%) | 0.54 | |
| Occurrence of hernia, n (%) | 4 (1.0%) | 1 (1.8%) | 0.48 | |
BMI: body mass index; DBP: diastolic blood pressure; HbA1c: haemoglobin A1c; eGFR: estimated glomerular filtration rate (calculated by the Chronic Kidney Disease Epidemiology Collaboration [CKD-EPI] formula; in ml/min/1.73 m2 body surface); IQR: interquartile range; SBP: systolic blood pressure.
* Information on body weight at last follow-up was not available for 20 donors.
** Kidney function at last follow-up was calculated only from creatinine levels obtained at either the 3-year or 5-year follow-up control after donation (in total n = 250).
*** UPCR = urine protein-to-creatinine ratio and UACR = urine albumin-to-creatinine ratio, which was only calculated for donors with undiluted urine (i.e. urine creatinine ≥3 mmol/l; n = 393).
**** Cardiovascular diseases with exclusion of new-onset arterial hypertension.
Lastly, living kidney donors were stratified by tertiles of postdonation BMI changes: weight loss with BMI change ≤0.1 kg/m2; (nearly) no weight change with BMI change between 0 and 1.2 kg/m2; weight gain with BMI change ≥1.3 kg/m2. Baseline characteristics of donors stratified by tertile of postdonation BMI changes are summarised in table S6. There were no statistical differences in baseline characteristics among the three groups, except for predonation BMI (table S2). Outcomes are shown in table 5. Overall, 24% of donors (n = 112) gained weight after living kidney donation. Further, 36.1% of individuals presented with (nearly) no weight change during postdonation follow-up (n = 168) and 35.6% of donors (n = 166) lost a little weight during the observation period after living kidney donation. Median blood pressure values at last follow-up significantly differed between the three groups (overall p-value = 0.006 for median systolic blood pressures and 0.0004 for median diastolic blood pressures, table 5). Weight gain was associated with a higher systolic blood pressure at the last follow-up compared with donors who lost weight (median systolic blood pressure was 132 mm Hg in the weight gain group compared with 125 mm Hg in the weight loss group, p = 0.004). Further, similar results were obtained for diastolic blood pressure (p = 0.0001). However, the percentage of new-onset arterial hypertension was not higher within the weight gain group compared to the other groups (p = 0.16) (table 5). New-onset type 2 diabetes mellitus as well as cardiovascular diseases also did not differ between the three groups (table 5). We also carried out a sensitivity analysis and analysed all living kidney donors who were being treated for arterial hypertension or type 2 diabetes mellitus at the last follow-up (those who were treated predonation together with those with new-onset diseases). Thus, in this analysis the weight gain category did not have a greater proportion of donors treated for hypertension or type 2 diabetes mellitus at the last follow-up compared to the other groups, although the number of donors treated for type 2 diabetes mellitus was highest in this category.
Table 5Outcomes of donors stratified by tertile of change in body mass index, n = 446. Values are median (IQR) unless otherwise stated. Missing values were assumed to be missing at random. No imputation was used to address missing values. Information on body weight at last follow-up was not available for 20 donors.
| Tertiles of change in body mass index, median (range) in kg/m2 | |||||
| Predonation variables | −0.9 (−7.6 to −0.1) | 0.5 (0 to 1.2) | 1.9 (1.3 to 6.8) | p-value | |
| n = 166 | n = 168 | n = 112 | |||
| Time from donation in years | 3.0 (1.0; 3.1) | 3.0 (1.0; 3.1) | 2.0 (1.0; 3.0) | 0.32 | |
| Age at last follow-up in years | 60 (51; 67) | 59 (51; 67) | 60 (52; 65) | 1.00 | |
| BMI at last follow-up in kg/m2* | 24.1 (22.2; 26.2) | 25.7 (22.9; 28.4) | 29.0 (26.1; 31.7) | <0.0001 | |
| Percentage change in BMI, %* | −3.5 (−6.7; −2.1) | 2.1 (0.7; 3.4) | 7.6 (5.8; 10.5) | <0.0001 | |
| Systolic blood pressure at last follow-up in mm Hg | 125 (118; 134) | 128 (120; 136) | 132 (122; 142) | 0.006 | |
| Diastolic blood pressure at last follow-up in mm Hg | 80 (74; 84) | 80 (75; 86) | 85 (77; 90) | 0.0004 | |
| HbA1c at last follow-up, % | 5.5 (5.3; 5.7) | 5.5 (5.3; 5.8) | 5.6 (5.4; 5.8) | 0.17 | |
| Kidney function at last follow-up** | Creatinine, µmol/l | 95 (83; 112) | 100 (85; 114) | 96 (85; 111) | 0.61 |
| eGFR, CKD-EPI (ml/min/1.73 m2) | 61 (54; 72) | 61 (52; 72) | 62 (53; 70) | 0.81 | |
| UPCR, mg/mmol* | 11.7 (7.4; 14.8) | 11.7 (8.5; 15.7) | 11.7 (9.5; 15.5) | 0.62 | |
| UACR, mg/mmol* | 0.5 (0.3; 0.7) | 0.4 (0.3; 0.9) | 0.5 (0.3; 1.0) | 0.35 | |
| New-onset arterial hypertension, n (%) | 9 (5.4%) | 15 (8.9%) | 4 (3.6%) | 0.16 | |
| New-onset cardiovascular diseases, n (%)*** | 4 (2.4%) | 3 (1.8%) | 5 (4.5%) | 0.38 | |
| New-onset type 2 diabetes mellitus, n (%) | 1 (0.6%) | 1 (0.6%) | 3 (2.7%) | 0.19 | |
| Newly treated dyslipidaemia, n (%) | 20 (12.0%) | 6 (3.6%) | 14 (12.5%) | 0.30 | |
| Occurrence of hernia, n (%) | 2 (1.2%) | 2 (1.2%) | 1 (0.9%) | 0.97 | |
BMI: body mass index; DBP: diastolic blood pressure; eGFR: estimated glomerular filtration rate (calculated by the Chronic Kidney Disease Epidemiology Collaboration [CKD-EPI] formula; in ml/min/1.73 m2 body surface area); HbA1c: haemoglobin A1c; IQR: interquartile range; SBP: systolic blood pressure.
* UPCR = urine protein-to-creatinine ratio and UACR = urine albumin-to-creatinine ratio, which was only calculated for donors with undiluted urine (i.e. urine creatinine ≥3 mmol/l; n = 378).
** Kidney function at last follow-up was calculated only from creatinine levels obtained either at the 3-year or 5-year follow-up control after donation (in total n = 248).
*** Cardiovascular diseases with exclusion of new-onset arterial hypertension.
In this study, we investigated changes in metabolic parameters after living kidney donation. While we observed a higher incidence of type 2 diabetes mellitus in obese donors after living kidney donation, the overall incidence was low in obese as well as non-obese individuals. This is consistent with the results from Ibrahim et al. who analysed 2954 kidney donors with a mean follow up of 17.7 years regarding development of type 2 diabetes mellitus after living kidney donation and concluded that a predonation body mass index (BMI) >30 kg/m2 was associated with an increased risk of developing type 2 diabetes mellitus [17]. Importantly, in our donor population other metabolic complications such as new-onset arterial hypertension, cardiovascular diseases and BMI change at last follow-up did not differ between obese and non-obese donors. The percentage of obese donors who developed new-onset arterial hypertension was higher compared to the non-obese donor group (12.3% versus 5.1%). However, the difference did not reach statistical significance. In addition, kidney function and proteinuria at last follow-up did not differ between the two groups.
As expected, the study population had generally good health at baseline with mostly normal kidney function, no proteinuria (as per the definitions of KIDGO) and favourable metabolic parameters including normal median blood pressure and haemoglobin A1c (HbA1c) values at the time of living kidney donation. Overall, the percentage of accepted obese donors in our population was 12.2%. Further, 20% of donors had arterial hypertension and 1.3% had type 2 diabetes mellitus at the time of donation. Concerning obesity and arterial hypertension, the investigated donor population represents the general Swiss population quite well, considering the last health survey in Switzerland from 2022 (https://www.bfs.admin.ch/bfs/de/home.html). In 2022, 12% of the Swiss population had obesity and 20% had arterial hypertension. In contrast, the percentages of dyslipidaemia and type 2 diabetes mellitus were higher in the general Swiss population, at 15% and 5% respectively, compared to 6% and 1.3% respectively in our population. Focusing on weight and obesity, other living kidney donor programmes from other countries seem to have similar populations. The 12-month results of the Safety of the Living Kidney Donor (SoLKiD) cohort (including 336 living kidney donors), which represents the living kidney donor population of 20 transplant centres in Germany [18], reported a median predonation BMI of 25.85 kg/m2 (IQR: 23.74–29.01), which is similar to that of our study cohort. Issa et al. investigated the risk of weight gain after kidney donation and its association with increased risks of type 2 diabetes mellitus and hypertension in a single-centre study including 940 living kidney donors with a median follow-up 22.3 years [19]. Within their living kidney donor cohort, the percentage of donors with a predonation BMI of ≥30 kg/m2 was 13.3% and these donors had a higher systolic blood pressure at donation, but otherwise did not significantly differ in metabolic parameters and kidney function compared to living kidney donors with a BMI <30 kg/m2 [19]. Unsurprisingly, in our study cohort, the percentage of living kidney donors with predonation arterial hypertension was higher in the obese donors than in the non-obese donors (31.6% vs 18.3%). In addition, median blood pressure and HbA1c values showed small but also statistically significant differences.
Interestingly, when focusing on the entire study cohort, assessment of kidney function showed a stable course at last follow-up compared to one year after donation and most donors had preserved kidney function during the observation period after donor nephrectomy (eGFR of ≥60 ml/min/1.73 m2). Furthermore, obese donors showed no differences in kidney function at the last follow-up compared to non-obese donors, although our follow-up period was limited to a maximum of five years. Nevertheless, similar findings were reported by Issa et al. in their single-centre study with a median long-term follow-up of >20 years [19]. Living kidney donors with a predonation BMI ≥30 kg/m2 did not present with lower eGFR at the last follow-up compared to donors with predonation BMI <30 kg/m2 (respectively, mean eGFR 63.1 ml/min/1.73 m2 vs 63.7 ml/min/1.73 m2, p = 0.9) [19]. Moreover, concerning blood pressure values and metabolic parameters, the investigated outcome parameters of our entire study cohort showed small median differences in this limited follow-up period, with at most “medium” corresponding correlation coefficients.Although we observed a slight numerical increase in urine protein-to-creatinine ratio (UPCR) and a slight decrease in urine albumin-to-creatinine ratio (UACR) at last follow-up, both parameters remained within normal ranges, and the absolute changes were small. Given these findings, we consider the discrepancy to be of limited clinical relevance.
The definition of weight gain, both in the general population and after donor nephrectomy, varies in the literature. While overweight and obesity are standardised by WHO BMI criteria, weight gain lacks a clear definition. For example, Issa et al. used a ≥10% BMI increase since donation and BMI change tertiles to define weight gain [19]. Within our living kidney donor population, this would translate into a weight gain of 2.5 kg/m2 or at least >2 kg/m2. Considering the latter definition, 54/466 (11.6%) of donors gained weight during follow-up. Using the definition of ≥10% BMI since donation, only 33/466 (7.1%) of living kidney donors in our population gained weight after living kidney donation. Regardless of the definition of weight gain and irrespective of the predonation BMI, living kidney donors maintained their high BMI levels after living kidney donation. We deliberately avoided an arbitrary cut-off for weight gain in our analyses. Instead, we analysed the correlations of predonation donor age and BMI with BMI change after living kidney donation and showed that there was no correlation between age at donation or predonation BMI with BMI change.
To assess the impact of weight change after living kidney donation on metabolic outcomes, we stratified living kidney donors into tertiles based on postdonation BMI changes. Baseline characteristics were similar across tertiles, except for predonation BMI. Notably, weight gain was linked to the highest BMI levels at follow-up and higher systolic and diastolic blood pressures compared to weight loss. However, the proportion of new-onset hypertension was not higher in the weight gain group. New-onset type 2 diabetes mellitus as well as cardiovascular diseases also did not differ between the three tertile groups. Concerning BMI and blood pressure at the last follow-up, the results of Issa et al. were similar [19]. But in contrast to our results, they showed that the living kidney donors who gained the most weight were also more likely to be older and being treated for hypertension and type 2 diabetes mellitus [19]. While our correlation suggests the same tendency, we did not observe a significant association. We may speculate that this was triggered by a higher percentage of donors who developed either hypertension or type 2 diabetes mellitus or by the longer observation period in their study. Indeed, when we analysed all living kidney donors who were being treated for arterial hypertension or type 2 diabetes mellitus at the last follow-up (including both those who were treated predonation and those with new-onset diseases), donors in the weight gain category were not more frequently treated for hypertension or type 2 diabetes mellitus at the last follow-up compared to the other groups. However, the number of donors treated for type 2 diabetes mellitus was highest in the weight gain category.
In the absence of clear evidence from prospective living kidney donor cohorts to guide the development of selection criteria for potential living kidney donors with predonation type 2 diabetes mellitus, Soliman et al. proposed an approach for evaluating such candidates [3]. In summary, the brief report stated that because type 2 diabetes mellitus is a major cause of kidney failure, accepting diabetic living kidney donors with additional risk factors “raises substantial clinical concerns and should be approached with caution” [3]. Among others, eligibility criteria for living kidney donors with preexisting type 2 diabetes mellitus include: no concomitant arterial hypertension; non-insulin dependence; no smoking behaviour; BMI <30 kg/m2; UPCR <20 mg/mmol or UACR <3 mg/mmol [3]. Regardless of whether donors with type 2 diabetes mellitus are accepted for living kidney donor transplantation and the selection criteria applied, we strongly believe that our data underpin that living kidney donation is a safe procedure concerning metabolic risk, although obese donors in particular should be informed about the slightly higher risk of development of type 2 diabetes mellitus and probably hypertension after living kidney donation. Ideally, they should optimise their lifestyle before donation to minimise potential long-term complications. Furthermore, the use of GLP-1 agonists and/or sodium-glucose co-transporter 2 (SGLT2) blockers may substantially influence decision-making among potential donors and donor outcomes in the near future.
The strength of this multicentre study is that our data reflect long-term experience with living kidney donation in Switzerland where we have a stringent medical evaluation process for eligibility before donation, including exploration of metabolic parameters as well as a thorough nationally organised regular follow-up of living kidney donors after donation. However, the study has some limitations. First, due to the overall low frequency of metabolic complications, the results need to be interpreted with caution. Second, due to the low number of living kidney donors with predonation type 2 diabetes mellitus, reflecting the donor selection process until recently, or with new-onset type 2 diabetes mellitus as well as limited follow-up, our study lacked the power to explore whether type 2 diabetes mellitus leads to a higher risk of eGFR decline when compared to non-diabetic donors after living kidney donation. In addition, within our national database, the family history of type 2 diabetes mellitus is not registered and therefore, we could not consider this parameter in the analysis. Third, nearly 7% of donors had to be excluded due to missing follow-up data, thus the potential for selection bias must be taken into account. The excluded population was predominantly male and younger compared to included donors. Expectedly, they had higher eGFR levels compared to included donors. Crucially, they did not differ in metabolic parameters like weight and BMI, blood pressure or HbA1c levels before donation, nor in preexisting diseases. Fourth, the absence of an appropriate control group – ideally consisting of individuals who were evaluated for donation but did not proceed for non-medical or non-metabolic reasons – limits our ability to determine whether the observed changes are specific to kidney donation. Without such a comparator, we cannot assess whether associations such as that between weight gain and increased blood pressure differ meaningfully from trends in the general population. However, the aim of this study was not to evaluate causality or assess whether donation itself exacerbates metabolic risks. Rather, it was to provide a descriptive analysis of metabolic changes among living kidney donors, with particular attention given to the association between preexisting obesity and postdonation outcomes. While these findings may not be novel in the context of obesity research, we believe they underscore the importance of predonation metabolic evaluation and counselling in this specific population. Finally, our study population consisted mainly of Caucasian people and therefore we could not assess whether ethnicity plays a factor either in weight gain or development of type 2 diabetes mellitus after living kidney donation.
In conclusion, while this exploratory study was not designed to assess the overall safety of living kidney donation, the observed metabolic changes during follow-up were generally modest. Obese donors appeared to have a slightly higher frequency of new-onset type 2 diabetes mellitus compared to non-obese donors. These findings underscore the importance of predonation counselling on lifestyle optimisation, particularly for individuals with elevated BMI.
The study protocol of the SOL-DHR can be accessed at https://www.sol-dhr.ch/de/. The statistical code used for this analysis can be shared upon reasonable request by contacting the corresponding author. Deidentified individual-level data underlying the findings presented in this manuscript – including the data dictionary – may also be made available upon reasonable request. Access will be granted following approval by the data custodians of the Swiss Organ Living-Donor Health Registry, in accordance with national data protection laws and ethical guidelines. Data will be available for academic research purposes only and for a period of five years from the date of publication. Requests should include a brief summary of the proposed use and analysis plan.
This work is dedicated to Prof. Gilbert Thiel (*1934; † 2012) who founded the Swiss Organ Living-Donor Health Registry in 1993 and set a milestone for comprehensive lifelong monitoring of living kidney donors in Switzerland. Furthermore, he was a great promoter of living kidney donor transplantation beyond our national borders. The authors and representatives of the Swiss transplant centres thank Lene Kraft for her valuable administrative work for the registry and outstanding collaboration. Further, the SOL-DHR thanks all transplant centres for their excellent collaboration as well as Viollier AG, Basel, Switzerland for performing the laboratory tests.
Author contributions: PHM designed the research study. PHM, JK, DB and MD performed the research study. All authors collected data. PHM, JK, DB and MD analysed the data. All authors wrote the paper.
There was no extra funding request necessary to conduct the study, as this study was partially performed for a doctor’s thesis. All reported grants were used outside the scope of this work. MD reports a research grant from the Swiss National Science Foundation (SNF) (SNF projects P500PM_214237) and TZ received a grant from Innosuisse (project 40018.1 IP-LS). JS reports grants from the SNF to conduct the Swiss transplant cohort study (STCS) as the principal investigator (SNSF project 33CS30/201385 / 1). PHM received grants from the Gottfried and Julia Bangerter-Rhyner foundation.
All authors have completed and submitted the International Committee of Medical Journal Editors form for disclosure of potential conflicts of interest. No potential conflict of interest related to the content of this manuscript was disclosed.
1. Taler SJ, Messersmith EE, Leichtman AB, Gillespie BW, Kew CE, Stegall MD, et al.; RELIVE Study Group. Demographic, metabolic, and blood pressure characteristics of living kidney donors spanning five decades. Am J Transplant. 2013 Feb;13(2):390–8. doi: https://doi.org/10.1111/j.1600-6143.2012.04321.x
2. Clayton PA, Saunders JR, McDonald SP, Allen RD, Pilmore H, Saunder A, et al. Risk-Factor Profile of Living Kidney Donors: The Australia and New Zealand Dialysis and Transplant Living Kidney Donor Registry 2004-2012. Transplantation. 2016 Jun;100(6):1278–83. doi: https://doi.org/10.1097/TP.0000000000000877
3. Soliman KM, Daoud A, Posadas Salas MA, Rice T, Uehara G, Shayto R, et al. Accepting Living Kidney Donors with Preexisting Diabetes Mellitus: A Perspective on the Recent OPTN Policy Change-July 2022. Clin J Am Soc Nephrol. 2023 Jan;18(1):127–9. doi: https://doi.org/10.2215/CJN.09460822
4. Lentine KL, Kasiske BL, Levey AS, Adams PL, Alberu J, Bakr MA, et al. KDIGO Clinical Practice Guideline on the Evaluation and Care of Living Kidney Donors. Transplantation. 2017;101(8S Suppl 1):S1-S109. doi: https://doi.org/10.1097/TP.0000000000001769
5. Must A, Spadano J, Coakley EH, Field AE, Colditz G, Dietz WH. The disease burden associated with overweight and obesity. JAMA. 1999 Oct;282(16):1523–9. doi: https://doi.org/10.1001/jama.282.16.1523
6. Haslam DW, James WP. Obesity. Lancet. 2005 Oct;366(9492):1197–209. doi: https://doi.org/10.1016/S0140-6736(05)67483-1
7. Bhupathiraju SN, Hu FB. Epidemiology of Obesity and Diabetes and Their Cardiovascular Complications. Circ Res. 2016 May;118(11):1723–35. doi: https://doi.org/10.1161/CIRCRESAHA.115.306825
8. Praga M, Morales E. Obesity, proteinuria and progression of renal failure. Curr Opin Nephrol Hypertens. 2006 Sep;15(5):481–6. doi: https://doi.org/10.1097/01.mnh.0000242172.06459.7c
9. Praga M, Hernández E, Herrero JC, Morales E, Revilla Y, Díaz-González R, et al. Influence of obesity on the appearance of proteinuria and renal insufficiency after unilateral nephrectomy. Kidney Int. 2000 Nov;58(5):2111–8. doi: https://doi.org/10.1111/j.1523-1755.2000.00384.x
10. Ibrahim HN, Foley RN, Reule SA, Spong R, Kukla A, Issa N, et al. Renal Function Profile in White Kidney Donors: The First 4 Decades. J Am Soc Nephrol. 2016 Sep;27(9):2885–93. doi: https://doi.org/10.1681/ASN.2015091018
11. Locke JE, Reed RD, Massie A, MacLennan PA, Sawinski D, Kumar V, et al. Obesity increases the risk of end-stage renal disease among living kidney donors. Kidney Int. 2017 Mar;91(3):699–703. doi: https://doi.org/10.1016/j.kint.2016.10.014
12. Sachdeva M, Rosen LM, Varghese J, Fishbane S, Molmenti EP. Weight trends in United States living kidney donors: analysis of the UNOS database. World J Transplant. 2015 Sep;5(3):137–44. doi: https://doi.org/10.5500/wjt.v5.i3.137
13. Abramowicz D, Cochat P, Claas FH, Heemann U, Pascual J, Dudley C, et al. European Renal Best Practice Guideline on kidney donor and recipient evaluation and perioperative care. Nephrol Dial Transplant. 2015 Nov;30(11):1790–7. doi: https://doi.org/10.1093/ndt/gfu216
14. Lentine KL, Lam NN, Segev DL. Risks of Living Kidney Donation: Current State of Knowledge on Outcomes Important to Donors. Clin J Am Soc Nephrol. 2019 Apr;14(4):597–608. doi: https://doi.org/10.2215/CJN.11220918
15. Thiel GT, Nolte C, Tsinalis D. Prospective Swiss cohort study of living-kidney donors: study protocol. BMJ Open. 2011 Jan;1(2):e000202. doi: https://doi.org/10.1136/bmjopen-2011-000202
16. Brügger C, Hunkeler Z, Diebold M, Krättli J, Geiger I, Wehmeier C, et al. Early Complications in Kidney Donors and Course of Health-related Quality of Life 12 mo After Donation: An Analysis of the Swiss Organ Living-Donor Health Registry. Transplant Direct. 2024 Oct;10(11):e1716. doi: https://doi.org/10.1097/TXD.0000000000001716
17. Ibrahim HN, Kukla A, Cordner G, Bailey R, Gillingham K, Matas AJ. Diabetes after kidney donation. Am J Transplant. 2010 Feb;10(2):331–7. doi: https://doi.org/10.1111/j.1600-6143.2009.02944.x
18. Suwelack B, Berger K, Wolters H, Gerß JW, Bormann E, Wörmann V, et al.; SoLKiD study group. Results of the prospective multicenter SoLKiD cohort study indicate bio-psycho-social outcome risks to kidney donors 12 months after donation. Kidney Int. 2022 Mar;101(3):597–606. doi: https://doi.org/10.1016/j.kint.2021.12.007
19. Issa N, Sánchez OA, Kukla A, Riad SM, Berglund DM, Ibrahim HN, et al. Weight gain after kidney donation: association with increased risks of type 2 diabetes and hypertension. Clin Transplant. 2018 Sep;32(9):e13360. doi: https://doi.org/10.1111/ctr.13360
The appendix is available in the pdf version of the article at https://doi.org/10.57187/s.4513.