Clinical outcomes and risk factors associated with neonatal transports in Switzerland:
a retrospective single-centre cohort study
DOI: https://doi.org/https://doi.org/10.57187/s.4307
Friederike Schwarza,
Thomas Riedela,
Matthias V. Koppb,
Marie Roumetc,
Volker Nils Umlaufa
a Division of Paediatric Intensive Care Medicine, Department of
Paediatrics, Inselspital, Bern University Hospital, University of Bern, Bern, Switzerland
b Department of Paediatrics, Inselspital,
Bern University Hospital, University of Bern, Bern, Switzerland
c Department of Clinical Research,
University of Bern, Bern, Switzerland
Summary
OBJECTIVE: To assess the association of
patient and transport characteristics with mortality and morbidity of neonates
who require interfacility transport in central Switzerland.
METHODS: We conducted a retrospective
single-centre cohort study including neonates transported by the neonatal
transport service of the Bern University Children՚s Hospital between January
2019 and December 2022. We reviewed the transport protocols and electronic
patient charts of the hospitalisation after transport, and investigated the
association of patient characteristics, clinical management before transport
and transport characteristics (transport mode, transport times, adverse events)
with outcomes. The primary outcome was death or impairment; secondary outcomes
were lengths of stay in the intensive care unit and hospital, inotrope-free
days and respiratory support-free days following transport.
RESULTS: Of 807 neonates who were included,
105 (13%) showed an unfavourable outcome (death: 25 patients, impairment at
time of discharge: 80). We observed a significant association between patients’
diagnosis and primary outcome (p <0.001). Patients with a primary
neurological disorder (n = 120, 14.9%) had a significantly higher risk of an unfavourable
outcome (odds ratio [OR]: 5, 95% confidence interval [CI]: 2.46–10.9) compared
to patients with a cardiac diagnosis. Death or impairment (primary outcome) was
more likely to be observed in ground-transported patients than in air-transported
patients (crude OR: 2.12, 95% CI: 1.20–4.07, p = 0.009). This effect remained
significant after adjustment for the potential confounding effect of a
selection of patient and administrative characteristics (adjusted OR: 2.23, 95%
CI: 1.14–4.68, p = 0.018). Emergency transports, extended medical support
before transport, a five-minute APGAR score <6 and a Sarnat score ≥2 were
associated with an unfavourable outcome in the crude analysis, but not in the adjusted
analysis. There was no significant association between stabilisation time or
total transport time and primary outcome.
CONCLUSIONS: Our study illustrates
potential risk factors for morbidity and mortality in neonates requiring
transport from the birth facility to a specialised neonatal care centre. The
relevance of the primary diagnosis should influence logistical transport decision-making
in the future. In particular, children with neurological diseases require
special attention. As ground transport showed a worse outcome than air
transport, the helicopter service might be considered more frequently. Transport
times seem to be of less importance in regions with short transport distances,
but optimising dispatch and call to arrival times would probably improve
transport efficiency.
Introduction
Neonatal transport is a high-risk procedure
due to the intrinsic vulnerabilities of the patient population and the distinct
physiological characteristics of neonates, such as their compromised ability to
adapt to hypoxia and changes in barometric pressure, humidity, temperature,
noise and vibration [1, 2]. Additionally, neonates with respiratory support are
particularly susceptible to complications like hypotension, hypoglycaemia, intraventricular
haemorrhage and pneumothorax. Prenatal risk factors, perinatal health
conditions (e.g. respiratory distress and perinatal asphyxia) and congenital
malformations (such as congenital heart defects) can further influence
transport outcomes [1]. Consequently, neonatal transport demands specialised
administrative and medical resources to ensure efficient and safe transfer [3,
4]. There is limited data on the impact of transportation times, safety and
specific risk factors on neonatal transport outcomes. In Switzerland,
approximately 1500 neonatal transports are conducted annually from regional
maternity units to specialised neonatal care centres (personal communication,
Swiss working group of neonatology and paediatric intensive care [IGPNI]). Of
these, the neonatal transport service of the Bern University Children’s Hospital
is responsible for around 230 transports each year. All transports are carried
out by a dedicated team trained in neonatal transport. To date, systematic
assessment of outcomes and transport-associated risk factors remains lacking. The
objective of our study was to find potential risk factors for morbidity and
mortality in neonates requiring transport. These included selected patient
characteristics as well as selected transport characteristics, that have been associated
with the outcome of
neonates in previous studies [5–7]. The results serve as a basis for reflection
on potential actions that can be taken to improve patient outcomes and
transport efficiency.
Methods
This retrospective cohort study aims (a) to
describe the clinical and transport characteristics of patients transported by
the service of the Bern University Children’s Hospital from birth facilities to
our hospital, (b) to assess their outcomes, and (c) to investigate the
association between patient and transport characteristics and patient outcomes.
The following outcomes were considered:
- primary outcome: death or
impairment,
- secondary outcomes: acidosis at
admission, days in the intensive care unit (ICU), length of hospital stay
(days), days without inotrope use, days without respiratory support.
In order to cover all the neonates, who in
our study at the time of discharge needed any kind of support in daily life, we defined
“impairment” as: neurological deficits (e.g.
neurodevelopmental deficits or muscle weakness), functional deficits (e.g.
feeding difficulties), need for medical support (e.g. feeding tube or home care
services) or need for medication other than vitamin D or iron supplementation
(e.g. anticongestive or anticonvulsive therapy).
Length of stay in the ICU was evaluated
within the first 20 days post-transport. Hospital length of stay was assessed
within the first 50 days, and days without respiratory or inotropic support
were evaluated within the first 14 days. When analysing hospital ICU stays, we
observed that a small number of patients had exceptionally long stays.
Specifically, 12 patients (1.5% of the study population) had a hospital stay of
more than 50 days and 12 patients (1.5%) had an ICU stay of more than 20 days.
In this study, we decided to focus on the factors influencing the duration of a
“typical” stay. Therefore, we set the threshold at 50 days for hospitalisation
and 20 days for ICU stays, covering 98.5% of the stays. For days without
respiratory and without inotropic support, the choice to focus on a normal
period of 14 days was guided by the clinical context: the time-to-event was
expected to occur within 14 days in the majority of patients.
Study population and variables
We analysed the 926 transports carried out
by the neonatal transport service of the Bern University Children’s Hospital
from birth facilities to our hospital between January 2019 and December 2022.
The referral centres covered by our neonatal transport service included 19
hospitals at that time. Transport distance ranged from 3.1 km to 63.5 km by
ground transport, while air transport distance ranged from 34.7 km to 80.2 km
flight distance. Transports were coordinated by the paediatric intensive care
unit (PICU) team and conducted by a nurse and a doctor from the newborn
intensive care unit (NICU). Air transport was organised in cooperation with the
Swiss Air Ambulance Rega. In case of bad weather conditions, longer distances
had to be covered by ground transport. After arrival, the patients were
admitted to the NICU, the PICU, neonatal intermediate care (IMC) or the regular
neonatal unit.
The exclusion criteria were: transport
destination other than Bern University Children’s Hospital, repatriation
transports, transports of patients not transferred from a birth facility, death
prior to the transport team’s arrival, inconclusive data or lack of documentation,
elective transports (planned for the next day or later), patients not indicated
for transport and parents’ refusal to provide general consent. We reviewed
transport protocols and electronic patient charts of the hospital stay
following transport. According to the decision of the Bern Regional Ethics
Committee (Human Research Ordinance [HRO]), ethical approval was not required
as they considered this study to be merely a quality assessment study and
therefore not subject to articles 2 and 3 of the Human Research Act (HRA).
The patient data from handwritten standardised
transportation protocols, from the patients’ discharge letters and data from
the patients’ medical records in the ICU Patient Data Management System
(Centricity Critical Care by GE, Anandic Medical Systems AG, Feuerthalen ZH,
Switzerland) or the Hospital Information System (ipdos) were entered in a coded
manner in a password-protected Excel file. Access to the coded data was
restricted to the principal investigators and the statistician of the study
team only. The entered data were checked for queries by two independent
investigators. The transportation protocols were filled out by the medical
transport team in charge, and stored in the archive of the Division for
Paediatric Intensive Care of the Inselspital University Hospital Bern.
Exposures
The patient characteristics selected for
analysis included:
- 5 min APGAR [8] score,
- Sarnat score [9] for the
assessment of hypoxic-ischaemic encephalopathy (No asphyxia | Sarnat score
<2 | Sarnat score 2–3),
- need for extended medical
support before transportation (Yes | No; extended support was defined as the need
for resuscitation, or use of inotropic agent or need for intubation for
respiratory support),
- primary diagnosis category (Cardiac
| Infectious | Neurological | Respiratory | Other),
- gestational age (<37 | 37–40
| ≥41 weeks).
Administrative transport characteristics selected
for analysis included:
- shift type, i.e. regular (8pm
to 5pm, Monday to Friday) or on-call (other times),
- type, i.e. ground or
helicopter.
Further assessed patient and transport
characteristics are shown in tables 1 to 3 and tables S1–S3 in the appendix.
The time from the emergency call to departure was defined as “dispatch time”, that
from arrival at the referral centre to departure as “stabilisation time” and that
from the emergency call to the transport team’s return to Bern University
Children’s Hospital as “total transport time”. Transport urgency was categorised
as “Emergency transport” if the child exhibited impaired vital signs at the
time of the emergency call or “Urgent transport” if the child had stable vital
signs expected to deteriorate.
Table 1Selected patient and transport
characteristics.
| Characteristic |
Overall (n = 807) |
Death or impairment |
| Yes (n = 105) |
No (n = 702) |
| Gestational age in weeks, n (%) |
<37 |
137 (17%) |
21 (20%) |
116 (17%) |
| 37–40 |
543 (67%) |
71 (68%) |
472 (67%) |
| ≥41 |
126 (16%) |
12 (12%) |
114 (16%) |
| Missing2 |
1 |
1 |
0 |
| 5 min APGAR score3 |
Median (IQR) |
8.0 (7.0–9.0) |
7.0 (4.0–9.0) |
8.0 (7.0–9.0) |
| Missing2 |
7 |
1 |
6 |
| Sarnat score4, n (%) |
No asphyxia |
739 (92%) |
73 (70%) |
666 (95%) |
| <2 |
29 (3.6%) |
10 (9.5%) |
19 (2.7%) |
| 2–3 |
39 (4.8%) |
22 (21%) |
17 (2.4%) |
| Primary diagnosis category, n (%) |
Cardiac |
66 (8.2%) |
11 (10%) |
55 (7.8%) |
| Infectious |
196 (24%) |
9 (8.6%) |
187 (27%) |
| Neurological |
120 (15%) |
60 (57%) |
60 (8.5%) |
| Respiratory |
251 (31%) |
10 (9.5%) |
241 (34%) |
| Other5 |
174 (22%) |
15 (14%) |
159 (23%) |
| Urgency of transport, n (%) |
Urgent6 |
285 (35%) |
20 (19%) |
265 (38%) |
| Emergency7 |
522 (65%) |
85 (81%) |
437 (62%) |
| Transport mode, n (%) |
Air transport |
175 (22%) |
13 (12%) |
162 (23%) |
| Ground transport |
632 (78%) |
92 (88%) |
540 (77%) |
| On-call transport8, n (%) |
Yes |
556 (69%) |
77 (73%) |
479 (68%) |
| No |
251 (31%) |
28 (27%) |
223 (32%) |
| Extended medical support9 before
transportation, n (%) |
Yes |
97 (12%) |
31 (30%) |
66 (9.4%) |
| No |
706 (88%) |
72 (70%) |
634 (91%) |
| Missing2 |
4 |
2 |
2 |
| Dispatch time10 in min |
Median (IQR) |
43.5 (35.0–55.0) |
41.0 (30.3–52.8) |
45.0 (35.0–55.0) |
| Missing2 |
71 |
7 |
64 |
| Call to arrival in min |
Median (IQR) |
69.0 (55.0–82.0) |
65.0 (48.0–78.0) |
69.0 (55.0–82.3) |
| Missing2 |
70 |
8 |
62 |
| Stabilisation time11 in min |
Median (IQR) |
57.0 (45.0–69.0) |
61.0 (43.5–76.5) |
57.0 (45.0–68.0) |
| Missing2 |
19 |
3 |
16 |
| Stabilisation time11 in min,
n (%) |
0–45 |
201 (26%) |
27 (26%) |
174 (25%) |
| 46–60 |
264 (34%) |
23 (23%) |
241 (35%) |
| 61–90 |
270 (34%) |
40 (39%) |
230 (34%) |
| >90 |
53 (6.7%) |
12 (12%) |
41 (6.0%) |
| Missing2 |
19 |
3 |
16 |
| Total transport time12 in min |
Median (IQR) |
155.0 (131.0–180.0) |
156.5 (123.5–181.0) |
155.0 (131.0–180.0) |
| Missing2 |
75 |
9 |
66 |
| Transport complications13, n (%) |
Yes |
142 (18%) |
32 (30%) |
110 (16%) |
| No |
665 (82%) |
73 (70%) |
592 (84%) |
Table 2Association of total transport
time with primary and secondary outcomes (effects measures are presented by 10
minutes transport time).
|
Crude |
Adjusted |
| Characteristics |
Odds
ratio |
95% CI |
p-value |
Odds
ratio |
95% CI |
| Primary outcome |
Binary |
Death or impairment* |
0.99 |
0.94–1.03 |
0.6 |
1.02 |
0.96–1.08 |
| Secondary outcomes |
Binary |
Acidosis at admission |
1.03 |
0.96–1.09 |
0.4 |
1.06 |
0.98–1.15 |
| Ordinal |
Length of ICU stay, first 20 days following transport |
0.96 |
0.93–0.99 |
0.009 |
0.96 |
0.93–0.99 |
| Inotrope-free days, first 14 days following transport |
1.02 |
0.97–1.08 |
0.5 |
0.94 |
0.88–1.00 |
| Days without respiratory
support, first 14 days following transport |
1.00 |
0.97–1.04 |
0.8 |
1.00 |
0.96–1.03 |
| Time to event |
Length of
stay in-hospital, first 50 days following
transport |
AFT coef:1.00 |
0.98–1.01 |
0.5 |
AFT coef: 1.00 |
0.99–1.01 |
Table 3Association of patient and
transport characteristics with primary outcome. An odds ratio (OR) <1
indicates that as the variable increases, the event is less likely to occur; an
OR = 1 indicates that as the variable increases, the likelihood of the event
does not change.
|
Crude |
Adjusted |
| Characteristics |
Odds ratio |
95% CI |
p-value |
Odds ratio |
95% CI |
p-value |
| On-call transport1 |
|
|
0.3 |
|
|
0.5 |
|
No |
– |
– |
|
– |
– |
|
| Yes |
1.28 |
0.82–2.06 |
|
1.23 |
0.72–2.13 |
|
| Transport mode |
|
|
0.009 |
|
|
0.018 |
|
Air transport |
– |
– |
|
– |
– |
|
| Ground transport |
2.12 |
1.20–4.07 |
|
2.23 |
1.14–4.68 |
|
| Urgency |
|
|
<0.001 |
|
|
0.11 |
|
Urgent2 |
– |
– |
|
– |
– |
|
| Emergency3 |
2.58 |
1.58–4.40 |
|
1.70 |
0.89–3.29 |
|
| Stabilisation time4 |
1.11 |
1.01–1.22 |
0.021 |
1.08 |
0.96–1.22 |
|
| Primary diagnosis category |
|
|
<0.001 |
|
|
<0.001 |
|
Cardiac |
– |
– |
|
– |
– |
|
| Infectious |
0.24 |
0.09–0.61 |
|
0.39 |
0.13–1.12 |
|
| Neurological |
5.00 |
2.46–10.9 |
|
5.52 |
2.35–14.0 |
|
| Respiratory |
0.21 |
0.08–0.52 |
|
0.23 |
0.09–0.63 |
|
| Other |
0.47 |
0.21–1.11 |
|
0.89 |
0.35–2.41 |
|
| 5 min APGAR score5 |
0.75 |
0.69–0.82 |
<0.001 |
0.92 |
0.81–1.05 |
0.2 |
| Sarnat score6 |
|
|
<0.001 |
|
|
>0.9 |
|
No asphyxia |
– |
– |
|
– |
– |
|
| 1 |
4.80 |
2.07–10.5 |
|
1.01 |
0.36–2.67 |
|
| 2–3 |
11.8 |
6.02–23.5 |
|
0.92 |
0.36–2.35 |
|
| Extended medical support7
before transportation |
|
|
<0.001 |
|
|
0.3 |
|
No |
– |
– |
|
– |
– |
|
| Yes |
4.14 |
2.51–6.73 |
|
1.51 |
0.70–3.16 |
|
| Gestational age in weeks |
|
|
0.4 |
|
|
0.2 |
|
37–40 |
– |
– |
|
– |
– |
|
| <37 |
1.20 |
0.70–2.01 |
|
1.44 |
0.74–2.76 |
|
| ≥41 |
0.70 |
0.35–1.29 |
|
0.67 |
0.30–1.37 |
|
Statistical methods
Patient and transport characteristics, and outcomes
are delineated in tables stratified by the primary outcome (death or
impairment), without any formal statistical testing. Categorical variables are
summarised as counts and proportions, while continuous variables are described
using medians with interquartile ranges (IQR) or means with standard deviations
(SD), as appropriate. Transport times, including dispatch time,
departure-arrival time, stabilisation time, return time and total transport
time are depicted in boxplots.
The association between total transport time and
patient outcomes was analysed for each outcome separately using both crude and
adjusted models. Binary
outcomes, such as death or impairment and acidosis upon admission, were
evaluated using logistic regression models. The impact
of transport time on the length of stay was assessed using Accelerated Failure
Time (AFT) models, under the assumption of a log-logistic distribution for time
to discharge, with censoring applied to patients who died at the event time.
For days in the ICU, days without inotrope use and days without respiratory
support, ordered logistic regression models were used to evaluate the effect of
transport time on the probability of increasing the outcomes. Crude models
included the outcome as the dependent variable and total transport time
(continuous, in 10-minute increments) as the independent variable. Effect
measures are presented with the associated 95% CI and p-values. Effects
measures are presented per 10 minutes transport time. For binary outcomes, we
used logistic regression models and present the effect measure as an odds ratio
(OR); for continuous outcomes, we used linear regression models and present the
model coefficient as effect measure. Adjusted models additionally accounted for
potentially confounding factors including the 5-minute APGAR score, Sarnat
score, need for extended medical support prior to transport, primary diagnosis
category and gestational age. Administrative transport characteristics included
whether the transport occurred during regular working hours (8 am – 5 pm,
Monday to Friday) or an on-call shift, and the mode of transport (ground or
helicopter).
To investigate the effects of the stabilisation
time, as well as patient and transport characteristics on the primary outcome,
we used both crude and adjusted logistic regression models. The crude models
include the primary outcome as the dependent variable and the characteristic of
interest as the independent variable. As before, for the analysis of the
association between total transport time and patient outcomes, the adjusted
models include the effects of the 5-minute APGAR score, Sarnat score, need for extended
medical support prior to transport, primary diagnosis category, gestational
age, whether the transport occurred during an on-call shift and the mode of
transport.
Results
From January 2019 to December 2022, a total
of 926 patients were transported by the neonatal transport service of the Bern
University Children’s Hospital. Of these, 807 met the inclusion criteria. These
patients were transferred from 19 different referral hospitals to Bern
University Children’s Hospital. Patient selection is shown in figure 1. Patient
and transport characteristics are summarised in tables S1–S3 in the
appendix.
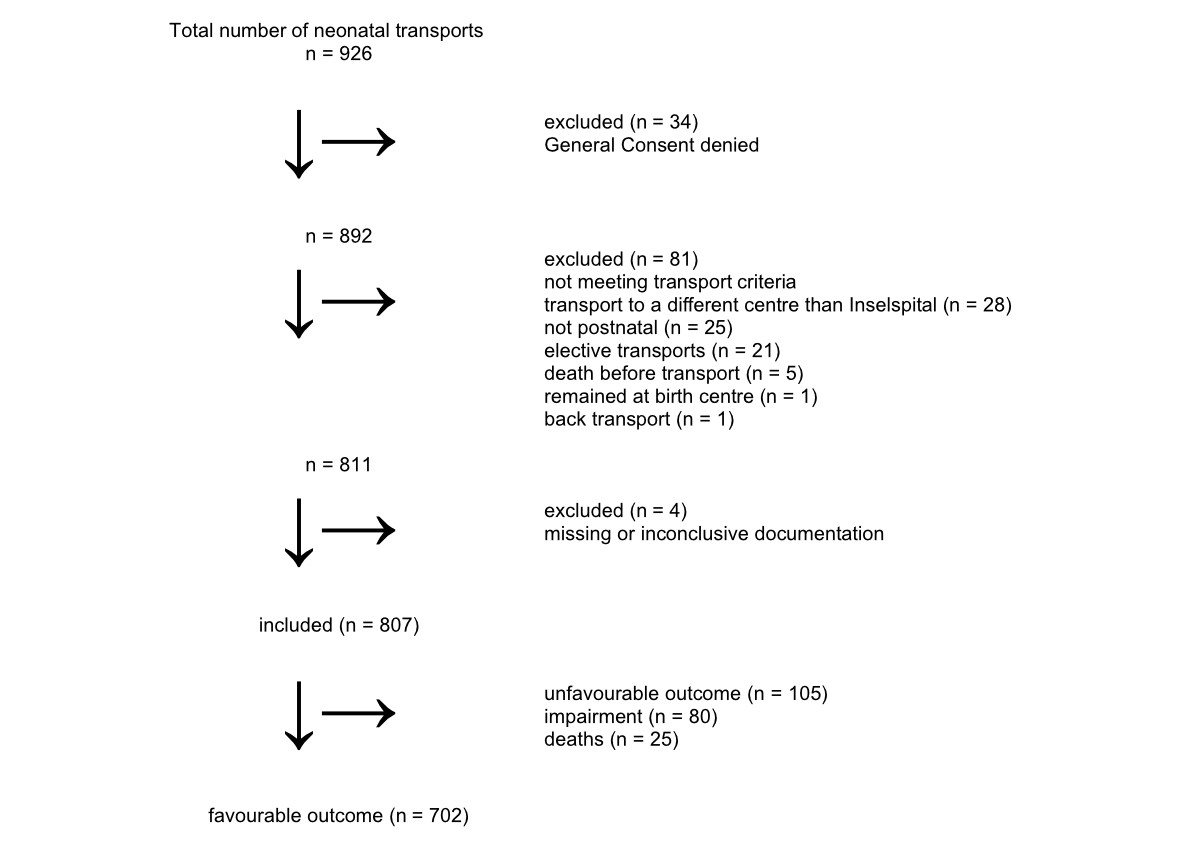
Figure 1Patient selection. Elective transport = transport
planned for the next day or later; impairment = neurological deficits,
functional deficits, need for medication or need for medical support at time of
discharge after hospital stay following neonatal transport; unfavourable
outcome = death or impairment.
Of the 807 patients, 105 (13%) experienced
an unfavourable outcome, with 25 patients succumbing to death and 80 patients
exhibiting impairment at time of discharge. Lengths of stay in the ICU were
longer in the group of patients with unfavourable outcomes, with a median of 4
days (IQR: 2.0–10.0), compared to a median of 0 days (IQR: 0–2.3) in the group
of patients with favourable outcomes. The median length of stay in the hospital
was 16 days (IQR: 7.0–28.0) for the unfavourable outcome group and 5 days (IQR
4.0–8.0) for the favourable outcome group.
The median number of days without respiratory
support within the first 14 days following transport was 9 days (IQR: 0–13.0)
in the group with poorer outcomes and 14 days (IQR 12.0–14.0) in the group with
more favourable outcomes. There was no difference in the number of days without
inotropic support between the two groups, with a median of 14 days in both
groups.
The median age at admission was 7 hours (IQR: 3–18).
The primary diagnosis was respiratory in 251 cases (31%), infectious in 196
cases (24%) and neurological in 120 cases (15%). The majority of transports
were emergency transports (n = 522, 65%) and on-call transports (n = 556, 69%;
see table 1).
The diagnosis category was significantly
associated with the primary outcome (p <0.001; table 3). A neurological
diagnosis was associated with a significantly increased risk of an unfavourable
outcome compared to a cardiac diagnosis (OR: 5, 95% confidence interval [CI]:
2.46–10.9). Extended medical support before transport was associated with an unfavourable
outcome in the unadjusted regression analysis; however, this association was
not statistically significant in the adjusted analysis (table 3). Similarly,
emergency transports were associated with an unfavourable outcome in the unadjusted
analysis (OR: 2.58, 95% CI: 1.58–4.40, p <0.001), but this association was
not significant after adjustment (p = 0.11, table 3). Five-minute APGAR scores
were lower in the patient group with worse outcome (IQR: 4–9 vs 7–9) and significantly
associated with the primary outcome in the crude (OR: 0.75, 95% CI: 0.69–0.82,
p <0.001 ) but not the adjusted analysis. A Sarnat score ≥2 was also
associated with a worse outcome (p <0.001) only in the crude analysis.
Gestational age was not associated with the primary outcome. Patients
transported by ground (n = 632, 78%) had a significantly worse outcome than
those transported by helicopter (n = 175, 22%) in the adjusted analysis (OR:
2.23, 95% CI: 1.14–4.68, p = 0.018; table 3). Transport times are presented in table
1 and figure 2. Longer stabilisation times were associated with an increased
risk of death or impairment in the unadjusted regression analysis (OR: 1.11,
95% CI: 1.01–1.22, p = 0.021), but this association was not significant in the adjusted
analysis (table 3). Among patients with stabilisation times >60 minutes,
16.1% (52/323) experienced an unfavourable outcome compared to 10.8% (50/465)
of those with stabilisation times <60 minutes (table 1). We also found that
longer transport times may slightly reduce length of ICU stay (OR per 10 minutes
transport time: 0.96, 95% CI: 0.93–0.99, p = 0.015). Nevertheless, the effect
size is small. The crude OR indicates no association between transport time and
inotrope-free days, while the adjusted OR indicates a marginally significant
reduction in inotrope-free days with longer transport time (OR per 10 minutes
transport time: 0.94, 95% CI: 0.88–1.00, p = 0.052). No other outcomes,
including death or impairment, acidosis at admission, inotrope-free days, days
without respiratory support or overall length of hospital stay, showed a
significant association with transport time (table 2).
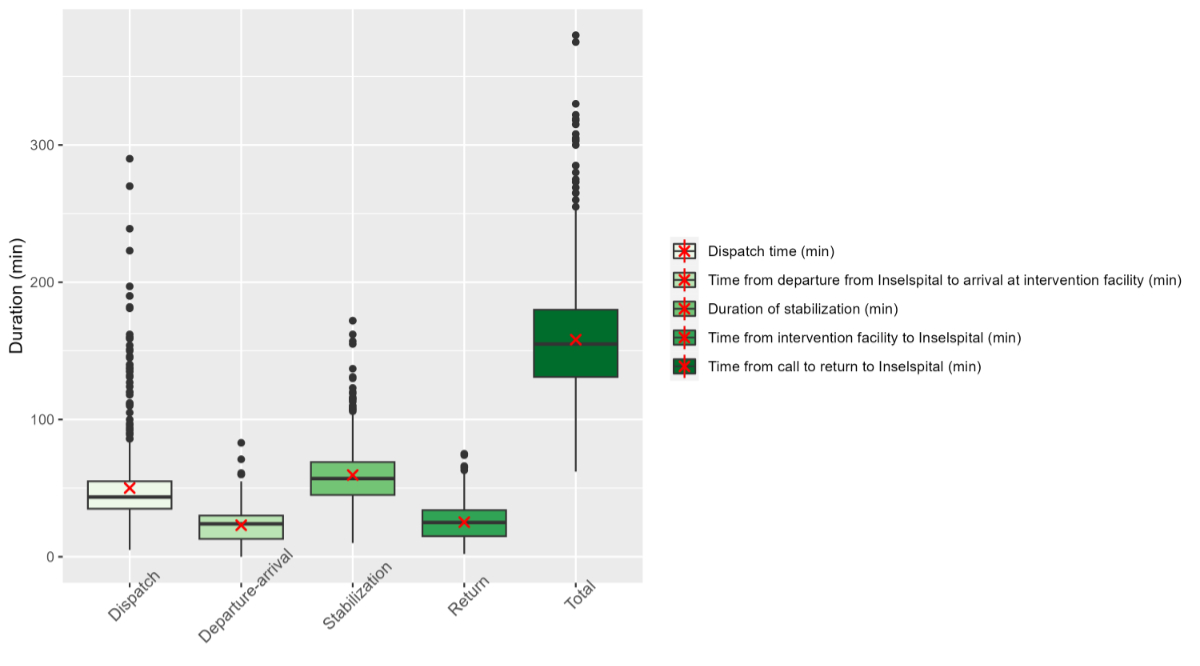
Figure 2Transport times: Each box in the
boxplot represents the interquartile range (IQR), encompassing the central 50%
of all values. The lower boundary of the box corresponds to the first quartile
(Q1), while the upper boundary corresponds to the third quartile (Q3). Within
the box, the solid line denotes the median value and the red cross signifies
the mean value. The whiskers extend to the furthest data point within 1.5 times
the IQR from the quartiles.
Discussion
This single-centre cohort study
systematically investigated for the first time the outcomes and
transport-associated risk factors for morbidity and mortality in 807 neonates
requiring neonatal transport in central Switzerland. To our knowledge, this
study includes the largest study population compared to similar works, and the
most comprehensive evaluation on outcomes and risk factors from Europe [10].
Following the characterisation of the neonatal transport systems of western and
eastern Switzerland by Leemann et al. [11] and McEvoy et al. [12], our study
provides an extended and detailed analysis of the central Swiss neonatal
transport system, thereby contributing to a comprehensive evaluation of
neonatal transport across Switzerland. The patient characteristics in our study
cohort did not significantly differ from those reported by Leemann et al. and
McEvoy et al. [11, 12]. As expected, respiratory diseases remained the most
common reason for neonatal interfacility transfer. However, in contrast to
their findings, we observed a higher percentage of suspected neonatal
infections, making infections the second most frequent indication for
transport. Reasons for this finding remain unclear. But given the birth
statistic of the region of Bern alone (39,415 children were born in the years
2019 to 2022), the number of neonatal transports indicated for a neonatal
infection (n = 196) appears reasonable [13].
In our analysis of diagnosis categories,
neonates presenting with a primary neurological diagnosis demonstrated
significantly poorer prognoses. The majority of patients were neonates with
asphyxia; the remaining neurological diagnoses included intraventricular haemorrhage,
cerebral infarction, neonatal seizures, muscular hypotension, encephalopathy/leukencephalopathy
among others. A trend towards adverse outcomes was observed in neonates with a
five-minute Apgar score below 6 and a Sarnat score exceeding 2. Although the
association did not reach statistical significance, a high percentage of unfavourable
outcomes was also noted among neonates requiring cardiopulmonary resuscitation
or inotropic support. Consequently, we recommend that neonates exhibiting these
risk factors should be transported by the most experienced and specialised
transport teams.
There are limited reference data regarding
optimal transport times for neonates. Previous studies suggest that helicopter
transport is safe for critically ill neonates and that longer transport times
may lead to a deterioration in neonatal condition [5–7]. In our study, most
neonates underwent ground transport and had significantly worse outcomes
compared to those transported by helicopter. In our region, the indication for
helicopter transport is typically defined by a transport distance exceeding 55
km independent of urgency or patient diagnosis. As air transport has been shown
to be a safe mode of neonatal transport [14, 15], we recommend increasing the
use of helicopter transport for neonates when clinically indicated. The
potential time advantage appears to play a less significant role, but the
reasons for this advantage cannot be determined from this study. Factors such
as stress or shearing forces exerted on the newborns are conceivable.
The length of ICU stay (first 20 days)
shows a small but statistically significant reduction with increasing transport
time. The reason for this finding remains unclear, as we would have expected a
worse outcome with longer transport times. Despite the size of the study
population, the subgroups may still be too small and, most likely, biased by
the number of deaths. Our results suggest a potential reduction in inotrope-free
days with longer transport time, which fits more into our understanding of
transport times and outcomes. Nevertheless, no other outcomes, including death
or impairment, acidosis at admission, days without respiratory support or
overall hospital length of stay, showed a significant association with
transport time.
Previous studies have demonstrated the
impact of the time from emergency call to specialised care at the receiving facility
on patient outcomes [16–18]. Given the “first golden hour” after birth [16, 17],
our transport team arrives at the referral centre too late, after 69 minutes
only (65 minutes in the group of patients with worse outcome). To improve this
time interval, (a) the team needs to be ready faster in order to reduce the
dispatch time, or (b) cover the distance faster to arrive earlier. This could
imply a more frequent choice of helicopter transport [16]. Leemann et al.
advised that the time interval from emergency call to transport team departure
should not exceed 30 minutes [11]. The median dispatch time in our study was
43.5 minutes, which is notably longer than the dispatch times reported by centres
in Zürich (35 minutes) and Lausanne (34 minutes) [11, 12]. This delay may be
attributable to the fact that during on-call hours our transport team first has
to arrive at our centre as opposed to the neonatal transport service of Zürich with
a transport team on-site around the clock. And a higher proportion of
transports of our centre occurred during on-call hours (69%), compared to the centres
in Zürich and Lausanne [11, 12]. The implementation of a 24/7 stand-by
transport team based in the hospital could potentially improve dispatch times,
the efficiency of neonatal transport and patient outcomes.
Stabilisation time is influenced by the
number of procedures performed at the referral site, and therefore, interventions
should be minimised [19]. The Canadian Neonatal Transport Network (CNTN)
recommends a stabilisation time of less than 120 minutes [19]. In our study,
the median stabilisation time was 57 minutes, suggesting that a target of 60
minutes is feasible. The goal of an optimal stabilisation time would be to
concentrate on the necessary measures to stabilise the neonate in order to
guarantee a safe but fast transport to a specialised centre for neonatal care.
The decisions for the kind of support are merely orientated on the clinical
problem of the patient. Naturally, specific transport-related factors need to
be considered, e.g. intubation for flights in higher altitude in already respiratory-distressed
patients. We advocate for a prompt and gentle transport of neonates to increase
efficiency and reduce costs.
In our study, transport complications were
documented in 18% (n = 142/807) of transports. Most complications involved
mild, uncomplicated changes in vital signs in terms of desaturations (63%) or
arterial hypotension (26%), treatable with increase of flow or FiO2 or volume
bolus, respectively. Other complications included apnoea, bradycardia,
seizures, technical problems or ventilation problems. We observed no instances
of CPR during transport and no transport-related mortality, which has been
reported to be as high as 12–40% in some studies [19]. There were no major
interventions necessary during transport. Temperature instability is the most
common vital sign anomaly reported in the literature [19]; however, temperature
was not documented in 63% of our patients, precluding direct comparison. There
were no reported communication- or system-related problems. The early
identification and treatment of neonatal infections are emphasised in Canadian
neonatal transport metrics [22]. In our cohort, only 77% of patients treated
with antibiotics received them on-site. While there were cases where additional
laboratory results were not available, and clinical symptoms varied and were
non-specific, early initiation of antibiotics when in doubt is justified.
However, delayed initiation of antibiotics pending laboratory results did not
appear to worsen outcomes.
Overall, the neonatal transport system of
Bern University provides safe and efficient care and transport, although there
are areas for improvement. To address the significant percentage of incomplete
documentation, we are implementing a REDCap database to reduce the incidence of
missing or incomplete records. The TRIPS-II score has proven valuable for risk
assessment in neonatal transport [5, 23, 24] and will be incorporated into the
database. The establishment of regional databases across Switzerland is likely
to be a cornerstone for quality assessment and improvement of the Swiss
neonatal transport system and the foundation for implementing national quality
metrics [11, 22, 25]. We advocate for the development of a national database
for the Swiss neonatal transport system to ensure safety and efficiency, and to
enhance educational programmes.
Limitations
Our study analysed the neonatal transport
system of one tertiary centre in central Switzerland. This setting generates
certain limitations of this study. The size of the patient population and the
specific geographic and logistical circumstances reduce the generalisability of
our findings. Patient selection was influenced by the exclusion of a number of
patients who had an elective transport planned one or more days after the call.
Some patients were excluded because of improper documentation. As the study design
did not include control groups (e.g. neonates
with the same diagnosis who were not transported), we cannot make any clear
statement about the transport-dependency of the prognosis.
Conclusions
Our study identifies potential risk factors
for morbidity and mortality in neonates requiring transport. Our findings do
not demonstrate a significant association between transport time and the most
important clinical outcomes, including mortality, neurological impairment,
length of hospital stay or duration without inotropic or respiratory support.
Consequently, in regions with short transport distances, transport time may be
less relevant than the primary diagnosis and the initial resuscitation measures
taken at the referring facility. Improvement in transport efficiency could probably
be achieved by optimising dispatch and call to arrival times.
Particular attention should be directed
toward neonates with a primary neurological diagnosis, as these conditions are
associated with a higher risk of adverse outcomes. As ground transport showed a
worse outcome than air transport in our investigation, the helicopter service
might be considered more frequently as it has been proven safe for neonates in
previous studies. To ensure the highest standards of neonatal transport and to
optimise training and education, we advocate for the creation of a national database
for the Swiss neonatal transport system and the implementation of national
quality metrics specific to neonatal transport. This would allow for critical
incident reporting, assessment of high-quality data and regular neonatal
transport audits.
Data sharing statement
In accordance with the International
Committee of Medical Journal Editors (ICMJE) recommendations, data sharing is
not mandatory for retrospective cohort studies. Although the data are anonymised,
we still see a potential risk that, if shared publicly, individual patients
could be re-identified through the combination of age, transport time and
diagnosis, especially due to the small number of patients located in a small
region.
Friederike Schwarz
Division of Paediatric Intensive Care
Medicine
Department of Paediatrics
Inselspital
Bern University Hospital
University of Bern
Freiburgstrasse 15
CH-3010 Bern
friederike.schwarz[at]insel.ch
References
1. Schierholz E. Flight physiology: science of air travel with neonatal transport considerations.
Adv Neonatal Care. 2010 Aug;10(4):196–9. doi: https://doi.org/10.1097/ANC.0b013e3181e94709
2. Bailey V, Szyld E, Cagle K, Kurtz D, Chaaban H, Wu D, et al. Modern Neonatal Transport:
Sound and Vibration Levels and Their Impact on Physiological Stability. Am J Perinatol.
2019 Mar;36(4):352–9. doi: https://doi.org/10.1055/s-0038-1668171
3. Orr RA, Felmet KA, Han Y, McCloskey KA, Dragotta MA, Bills DM, et al. Pediatric specialized
transport teams are associated with improved outcomes. Pediatrics. 2009 Jul;124(1):40–8.
doi: https://doi.org/10.1542/peds.2008-0515
4. Calhoun A, Keller M, Shi J, Brancato C, Donovan K, Kraus D, et al. Do pediatric teams
affect outcomes of injured children requiring inter-hospital transport? Prehosp Emerg
Care. 2017;21(2):192–200. doi: https://doi.org/10.1080/10903127.2016.1218983
5. Eliason SH, Whyte H, Dow K, Cronin CM, Lee S; Canadian Neonatal Network. Variations
in transport outcomes of outborn infants among Canadian neonatal intensive care units.
Am J Perinatol. 2013 May;30(5):377–82. doi: https://doi.org/10.1055/s-0032-1324706
6. Joseph AM, Horvat CM, Evans IV, Kuch BA, Kahn JM. Helicopter versus ground ambulance
transport for interfacility transfer of critically ill children. Am J Emerg Med. 2022 Nov;61:44–51.
doi: https://doi.org/10.1016/j.ajem.2022.08.032
7. Frid I, Ågren J, Kjellberg M, Normann E, Sindelar R. Critically ill neonates displayed
stable vital parameters and reduced metabolic acidosis during neonatal emergency airborne
transport in Sweden. Acta Paediatr. 2018 Aug;107(8):1357–61. doi: https://doi.org/10.1111/apa.14295
8. Razaz N, Boyce WT, Brownell M, Jutte D, Tremlett H, Marrie RA, et al. Five-minute
Apgar score as a marker for developmental vulnerability at 5 years of age. Arch Dis
Child Fetal Neonatal Ed. 2016 Mar;101(2):F114–20. doi: https://doi.org/10.1136/archdischild-2015-308458
9. Mietzsch U, Kolnik SE, Wood TR, Natarajan N, Gonzalez FF, Glass H, et al.; HEAL Trial
Study Group. Evolution of the Sarnat exam and association with 2-year outcomes in
infants with moderate or severe hypoxic-ischaemic encephalopathy: a secondary analysis
of the HEAL Trial. Arch Dis Child Fetal Neonatal Ed. 2024 Apr;109(3):308–16. doi: https://doi.org/10.1136/archdischild-2023-326102
10. Schumacher S, Mitzlaff B, Mohrmann C, Fiedler KM, Heep A, Beske F, et al. Characteristics
and special challenges of neonatal emergency transports. Early Hum Dev. 2024 May;192:106012.
doi: https://doi.org/10.1016/j.earlhumdev.2024.106012
11. Leemann T, Bernet V, Grass B, Hagmann C. Neonatal transport in Switzerland: a retrospective
single-centre analysis - quo vadis? Swiss Med Wkly. 2020 Aug;150(3334):w20308. doi: https://doi.org/10.4414/smw.2020.20308
12. McEvoy CG, Descloux E, Barazzoni MS, Diaw CS, Tolsa JF, Roth-Kleiner M. Evaluation
of Neonatal Transport in Western Switzerland: A Model of Perinatal Regionalization.
Clin Med Insights Pediatr. 2017 May;11:1179556517709021. doi: https://doi.org/10.1177/1179556517709021
13. Finanzdirektion Kanton Bern. Bevölkerungsbewegung: Bevölkerungswachstum im Jahr. 2023.
Available from: www.fin.be.ch/de/start/themen/OeffentlicheStatistik/bevoelkerungsstatistik/bevoelkerungsbewegung.html
14. Killion C, Stein HM. The Impact of Air Ambulance Transport on Neonatal Outcomes. Newborn
Infant Nurs Rev. 2009;9(4):207–11. doi: https://doi.org/10.1053/j.nainr.2009.09.008
15. Bouchut JC, Van Lancker E, Chritin V, Gueugniaud PY. Physical stressors during neonatal
transport: helicopter compared with ground ambulance. Air Med J. 2011;30(3):134–9.
doi: https://doi.org/10.1016/j.amj.2010.11.001
16. Bellini C, De Angelis LC, Secchi S, Massirio P, Andreato C, Polleri G, et al. Helicopter
Neonatal Transport: First Golden Hour at Birth Is Useful Tool Guiding Activation of
Appropriate Resources. Air Med J. 2020;39(6):454–7. doi: https://doi.org/10.1016/j.amj.2020.09.002
17. Hirata K, Nozaki M, Mochizuki N, Hirano S, Wada K. Impact of Time to Neonatal Transport
on Outcomes of Transient Tachypnea of the Newborn. Am J Perinatol. 2019 Aug;36(10):1090–6.
doi: https://doi.org/10.1055/s-0038-1676490
18. Chien CY, Tsai SL, Tsai LH, Chen CB, Seak CJ, Weng YM, et al. Impact of Transport
Time and Cardiac Arrest Centers on the Neurological Outcome After Out-of-Hospital
Cardiac Arrest: A Retrospective Cohort Study. J Am Heart Assoc. 2020 Jun;9(11):e015544.
doi: https://doi.org/10.1161/JAHA.119.015544
19. Chakkarapani AA, Whyte HE, Massé E, Castaldo M, Yang J, Lee KS; Canadian Neonatal
Transport Network. Procedural Interventions and Stabilization Times During Interfacility
Neonatal Transport. Air Med J. 2020;39(4):276–82. doi: https://doi.org/10.1016/j.amj.2020.04.007
20. Schultz RM, Natarajan G, Berk J, Wallace L. Inter-facility transports of critically
ill neonates. Pediatrics. 2019 August;144(2_MeetingAbstract):869. 10.1542/peds.144.2MA9.869.
21. Gray MM, Riley T, Greene ND, Mastroianni R, McLean C, Umoren RA, et al. Neonatal Transport
Safety Metrics and Adverse Event Reporting: A Systematic Review. Air Med J. 2023;42(4):283–95.
doi: https://doi.org/10.1016/j.amj.2023.05.001
22. Lee KS. Neonatal transport metrics and quality improvement in a regional transport
service. Transl Pediatr. 2019 Jul;8(3):233–45. doi: https://doi.org/10.21037/tp.2019.07.04
23. Lee SK, Aziz K, Dunn M, Clarke M, Kovacs L, Ojah C, et al.; Canadian Neonatal Network.
Transport Risk Index of Physiologic Stability, version II (TRIPS-II): a simple and
practical neonatal illness severity score. Am J Perinatol. 2013 May;30(5):395–400.
24. Qu W, Shen Y, Qi Y, Jiang M, Zheng X, Zhang J, et al. Comparison of four neonatal
transport scoring methods in the prediction of mortality risk in full-term, out-born
infants: a single-center retrospective cohort study. Eur J Pediatr. 2022 Aug;181(8):3005–11.
doi: https://doi.org/10.1007/s00431-022-04506-8
25. Schwartz HP, Bigham MT, Schoettker PJ, Meyer K, Trautman MS, Insoft RM; American Academy
of Pediatrics Section on Transport Medicine. Quality Metrics in Neonatal and Pediatric
Critical Care Transport: A National Delphi Project. Pediatr Crit Care Med. 2015 Oct;16(8):711–7.
doi: https://doi.org/10.1097/PCC.0000000000000477
Appendix
The appendix is available in the PDF version of this article at https://doi.org/10.57187/s.4307.