Swiss caesarean section rates according to Robson’s Ten-Group Classification System:
an observational study
DOI: https://doi.org/https://doi.org/10.57187/4231
Stephen Adjahoua,
Gian-Paolo Klinkeb,
Alexandre Valléec,
Benedetta Guania,
Nordine Ben Alia,
Jean-Marc Ayoubic,
Anis Fekia,
Arrigo Fruscalzoa
a Department of Obstetrics and Gynecology, Hospital of Fribourg,
Switzerland
b Federal Statistical Office OFS, Switzerland
c Epidemiology unit and public health, Foch Hospital, Suresnes, France
Summary
STUDY
AIMS: Robson’s Ten-Group Classification System (TGCS) was proposed to describe caesarean
section rates by ten patient-centred risk-specific groups. The aim of the study
was to describe Swiss caesarean section rates according to this classification,
further stratifying it according to region and type of structure where delivery
took place. We also aimed to compare our
results to the standard caesarean section rates, recommended by the World
Health Organization (WHO).
METHODS:
An observational study including all women delivering in health facilities in
Switzerland in the period 2014–2021. A total of 695,733 deliveries were
included. Core variables used for classification were semi-automatically
generated using routine data provided by the Swiss Federal Statistics Office. Caesarean
section rates were reported according to the TGCS. Data were also stratified
according to each of the 26 Swiss cantons, as well as to the typology of
hospital where delivery took place.
RESULTS:
The major relative contributors to the overall caesarean section rate were Group
2 (nulliparous, above 37 weeks, with induction) and Group 5 (women with
previous caesarean section, above 37 weeks with a singleton pregnancy),
respectively accounting for 20.7% and 30.1% of all caesarean sections. We also
showed that the Swiss population was similar to the population considered in the
WHO recommendation. Nonetheless, the caesarean section rate among our
population exceeded that suggested by the WHO recommendations, being respectively
of 44.4% vs 39.9% and 86.0% vs 74.4% for Groups 2 and 5. Large variations were
detected in the caesarean section rate when looking at the different cantons,
ranging from 29.8% to 59.6% for Group 2 and between 58.0% and 100.0% for Group 5.
CONCLUSION:
Routine data collection allowed us to describe caesarean section rates throughout
Switzerland according to the TGCS. The Swiss caesarean section rate was higher than
the caesarean section rate recommended by the WHO, even though the population
characteristics were comparable. Substantial differences were found when
stratifying caesarean section rates according to the canton, as well as to the
type of structure where delivery took place.
Introduction
Caesarean
section is one of the most frequently performed surgeries [1]. However,
its use increases maternal morbidity, due to surgery complications, and health costs
[2].
Furthermore, we know that the first caesarean section will determine the
obstetric life of the parturient and increase the need for a caesarean section
in the future [3]. With the
industrialisation of healthcare, the rate of caesareans has exploded and become
a global epidemic. In the United States, the rate of caesarean sections rose
from 5.8% to 31.9% between 1970 and 2016, becoming the most frequently performed
surgical procedure [4]. A
smaller country such as Switzerland is not spared by this global epidemic. In
2021, our country had a caesarean section rate of 32.8% [5].
Analysing the overall caesarean rate
can be misleading due to the diverse risk profiles within the population. To
facilitate comparative assessments, it is crucial to break down this rate into
risk-specific groups. The Ten-Group Classification System (TGCS), introduced by
Michael Robson in 2001, offers a clinically relevant framework for evaluating
variations in the caesarean rate [6, 7].
Endorsed by the World Health Organization (WHO) for comparing caesarean
rates between hospitals, the TGCS is increasingly used for cross-unit and
cross-country rate comparisons, as well as for tracking trends over time [8]. This
classification system categorises women into ten distinct, non-overlapping
groups.
In
1985, the WHO stated that a caesarean section rate higher than 15% could not be
medically justified. In 2015, it recommended use of the TGCS when assessing the
proper use of caesarean sections [8]. Assessing
singleton pregnancies through the lens of the TGCS may lead to better-targeted
interventions and thus decrease the caesarean section rate for deliveries with lower
risks [9].
With
a multicounty survey on maternal and newborn health, the
WHO constituted a reference population from 66 health facilities in 22
countries (the WHO MCS population). Based on this population, a target caesarean
section rate has been proposed by the WHO for each TGCS group [10]. However,
it is questionable whether the population of the included countries could be
compared to that of a high-income country, like Switzerland – calling into question
the target caesarean section rate proposed by the WHO.
The
aim of the present study was to provide a statistical description of caesarean
sections performed in Switzerland in the last decade according to Robson’s TGCS.
We also provided a comparison between the WHO recommended caesarean section
rate and the caesarean section rate of our study and a
comparison between the main characteristics of the reference population and the
population of our study.
Methods
Study design and setting
This
was a retrospective ecological study carried out in cooperation with the Swiss
Federal Statistical Office. The study was approved by the local ethics
committee (Commission cantonale d’étique
de la recherche sur l’être humain, CER-VD, ID-number 2021-01639, 12 October
2021).
Participants
All
women who gave birth in an acute care hospital from January 2014 to December 2021
in Switzerland, starting from the 24th week of gestation, were
included. Home births, stillbirths and pregnancy terminations were excluded
from the analysis.
Data sources
The
Swiss Federal Statistical Office annually collects the diagnoses of discharges
for deliveries that occurred in Swiss hospitals and birth centres. For the
present study, we used this administrative data source for the period 2014 to
2021. Personal insurance numbers were used for this scope. All deliveries
associated with viable newborns that occurred in Switzerland in an inpatient
setting are thus covered. All the data were transmitted and analysed in anonymised
form. The statistical analysis was performed using the STATA-17 software
package.
Outcome measures
The
primary outcome was the cumulative rate of caesarean sections according to Robson’s
Ten-Group Classification System (table 1). The main features of this
classification are that it is fully inclusive and mutually exclusive [6]. To allocate
each delivery to a group, we used the number of previous births, the number of
fetuses during the pregnancy, the fetal presentation, weeks of amenorrhoea at
birth, the presence of a previous uterine scar, the type of labour (spontaneous
or induced) and of delivery (caesarean section or vaginal). This information was
identified by means of procedures and diagnostic information associated with
each discharge, codified respectively with the Swiss classification of surgical
procedures (CHOP) and the International Statistical Classification of Diseases,
10th revision German Modification (ICD-10-GM) codes. To evaluate caesarean
section rates according to the TGCS, we used the algorithm described in the WHO’s
implementation manual [10]. A
semi-automated classification of the category was performed, as suggested by
the WHO guidelines [10]. Data
were presented as suggested by the WHO guidelines. First, a quality control
verification process was performed in order to assess the plausibility of the
data used for classification. Then our population was classed and compared to
the WHO multicountry survey population (WHO MCS) [10]. Finally,
we looked at our caesarean section rate by category. Furthermore, we stratified
the caesarean section rate for each canton, and type of hospital (university
hospitals or other type).
Table 1The caesarean
section classification, according to Robson’s Ten-Group Classification System
(adapted from reference [10]).
| Group
|
Description
|
| 1 |
Nulliparous,
singleton, cephalic, ≥37 weeks, in spontaneous labour |
| 2 |
Nulliparous,
singleton, cephalic, ≥37 weeks, induced labour or pre-labour caesarean |
| 3 |
Multiparous,
without previous caesarean section, singleton, cephalic, ≥37 weeks,
spontaneous labour |
| 4 |
Multiparous,
without previous caesarean section, singleton, cephalic, ≥37 weeks, induced
or pre-labour caesarean |
| 5 |
Previous
caesarean section, singleton, cephalic, ≥37 weeks |
| 6 |
Nulliparous,
singleton, breech |
| 7 |
Multiparous,
singleton, breech (including previous caesarean section) |
| 8 |
Multiple
pregnancies (including previous caesarean section) |
| 9 |
Transverse
or oblique lies (including previous caesarean section) |
| 10 |
Preterm,
singleton, cephalic, <37 weeks (including previous caesarean section) |
Statistical analysis
The characteristics of the study population are
presented using means and standard deviations (SD) for continuous variables,
and counts and proportions for categorical variables. All data
transmitted by the Federal Statistical Office were processed using Stata V17.
Results
The
present study covers a total of 695,733 deliveries occurring in Switzerland
during the study period 2014–2021. We were able to classify 682,680 deliveries
according to the TGCS, accounting for 98.1% of all deliveries.
Among
these, 224,969 corresponded to caesarean section deliveries (33.0% of all
deliveries) and 457,711 corresponded to vaginal births (67.1% of all
deliveries). The mean maternal age over the full period was 31.7 years. The
gravidity and parity were, respectively, 1.0 and 0.7. Women with a previous uterine
scar accounted for 13.8% of the whole population. The characteristics of
the study population are summarised in table 2.
Table 2Maternal and
pregnancy characteristics of the study populations.
| Characteristic |
Overall |
Caesarean section |
Vaginal birth |
| Maternal characteristics: Mean (SD-median) |
Age at
delivery, in years |
31.7 (4.9-32) |
32.6 (5.0-33) |
31.2 (4.8-31) |
| Age at
first child, in years |
30.5 (4.9-31) |
31.6 (5.1-32) |
30 (4.7-30) |
| Pregnancy history |
Number of
previous pregnancies |
1(1.2-1) |
1 (1.2-1) |
1 (1.2-1) |
| Number of
previous deliveries |
0.7 (0.9-1) |
0.7 (0.8-0) |
0.7 (0.9-1) |
| Deliveries distribution: absolute
number (percentage) |
| Total deliveries |
|
682,680 (100%) |
224,969 (32.9%) |
457,711 (67.0%) |
| Fetal position |
Vertex |
630,365 (92.3%) |
179,729 (28.5%) |
450,636 (71.5%) |
| Breech |
34,991 (5.1%) |
33,079 (94.5%) |
1912 (5.5%) |
| Transverse |
17,324 (2.5%) |
12,161 (70.0%) |
5163 (29.0%) |
| Pregnancy type |
Singleton |
670,106 (98.1%) |
215,108 (32.1%) |
454,998 (67.9%) |
| Multiple |
12,574 (1.8%) |
9861 (78.4%) |
2713
(21.6%) |
| Uterine
scar* |
94,267 (13.8%) |
82,435 (87.4%%) |
11,832 (12.5%) |
| Labour type |
Spontaneous |
518,640 (76.0%) |
182,692 (35.2%) |
335,948 (64.8%) |
| Induced |
164,040 (24.0%) |
42,277 (25.7%) |
121,763 (74.2%) |
| Gestational age at delivery |
Premature (<37 weeks) |
41,583 (6.1%) |
23,529 (56.6%) |
18,054 (43.4%) |
| At term (≥37 weeks) |
641,097 (93.9%) |
201,440 (31.4%) |
439,657 (68.6%) |
| Macro-region |
German-speaking |
482,907 (70.7%) |
166,320 (34.4%) |
316,587 (65.6%) |
| French- or
Italian-speaking |
199,773 (29.2%) |
58,649 (29.3%) |
141,124 (70.6%) |
| Institutional characteristics: type
of structure** |
University
hospital |
111,197 (16.3%) |
39,521 (35.5%) |
71,676 (64.5%) |
| Centralised
care (university excluded) |
371,574 (54.4%) |
121,603 (32.7%) |
249,971 (67.3%) |
| Primary
care |
184,948 (27.1%) |
62,645 (33.9%) |
122,303 (66.1%) |
| Gynaecological/obstetric
clinic |
14,961 (2.2%) |
1200 (8.0%) |
13,761
(92.0%) |
We also
performed an analysis of the quality of data collected according to the WHO
recommendations (table 3). We evaluated singleton newborns in transverse or
oblique lie (group 9). The group size accounted for 2.4% of all caesarean
sections (it should be less than 1% ideally; it was found to be 0.4% in the WHO MCS
population) while the caesarean section rate in this group
was 68.8% (it should by definition be 100%); it was found to be 88.6% in the WHO
MCS population.
Table 3Quality of data
according to the WHO’s recommendations.
| Steps |
Interpretation
by Robson |
WHO
MCS population |
Our
results |
| The total
numbers of caesarean sections and of women who delivered |
These
numbers should be identical to the total numbers of caesarean sections and of
women who delivered in your hospital |
NA |
Total
live births |
| FSO |
696,691 |
| Our
study |
682,680
(98.0%) |
| Total
caesarean sections |
| FSO |
224,966 |
| Our
study |
224,969 |
| Size of Group
9 |
Should be
less than 1.0% |
0.4% |
2.4% |
| Group 9 caesarean
section rate |
Should be
100% by convention |
88.6% |
68.8% |
Table 4
illustrates our results according to WHO guidelines. The two
major contributors to the overall caesarean section rate are TGCS Groups 5 and 2,
accounting for a relative contribution of 30.1% and 20.7%, respectively,
responsible for 50.8% of the overall caesarean section rate.
Table 4Results according to
the TGCS report table.
| Group |
Number of caesareans
in group |
Number of
women in group |
Group size
(%) |
Group CS
rate (%) |
Absolute
group contribution to overall CS rate (%) |
Relative group
contribution to overall CS rate (%) |
| 1 |
26,834 |
167,323 |
24.5% |
16.0% |
3.9% |
11.9% |
| 2 |
46,544 |
104,862 |
15.4% |
44.4% |
6.8% |
20.7% |
| 3 |
5406 |
173,318 |
25.4% |
3.1% |
0.8% |
2.4% |
| 4 |
13,520 |
67,487 |
9.9% |
20.0% |
2.0% |
6.0% |
| 5 |
67,708 |
78,753 |
11.5% |
86.0% |
9.9% |
30.1% |
| 6 |
19,764 |
20,450 |
3.0% |
96.6% |
2.9% |
8.8% |
| 7 |
10,566 |
11,426 |
1.7% |
92.5% |
1.5% |
4.7% |
| 8 |
9861 |
12,574 |
1.8% |
78.4% |
1.4% |
4.4% |
| 9 |
11,095 |
16,130 |
2.4% |
68.8% |
1.6% |
4.9% |
| 10 |
13,671 |
30,357 |
4.4% |
45.0% |
2.0% |
6.1% |
| Total |
224,969 |
682,680 |
100% |
|
|
100% |
Figure
1 shows the group size, caesarean section rate and relative contribution by TGCS
Group. It reveals that Groups 1 and 3 represented almost half of all our
deliveries. However, the highest caesarean section rate was recorded for the
nulliparous and multiparous breech presentation (Groups 6 and 7, respectively, with
96.6% and 92.5%), followed by Group 5 (previous caesarean section, singleton,
cephalic, ≥37 weeks) then Group 2 (nulliparous, singleton, cephalic, ≥37 weeks,
induced) with a caesarean section rate of 86.0% and 44.4%, respectively.
Considering both the group size and the caesarean section rate, we observe that
the major relative contributors to the overall caesarean section rate were Groups
5 and 2, accounting for 30.1% and 20.7%, respectively, of all caesarean sections.
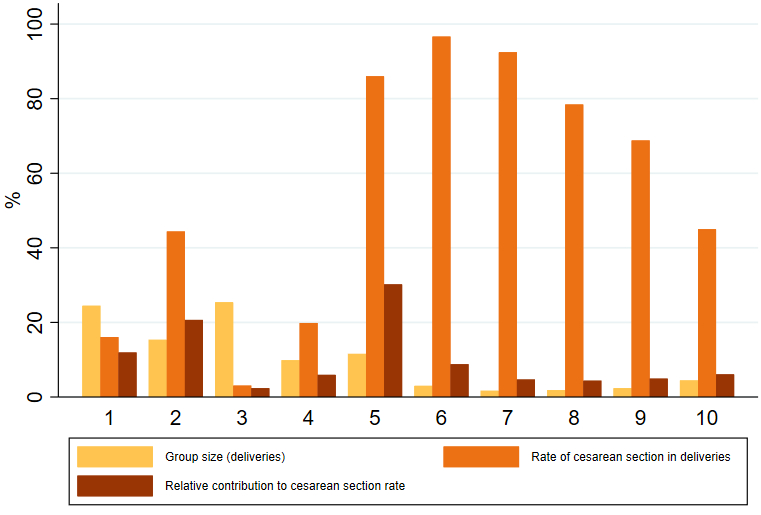
Figure 1Caesarean
sections in Switzerland between 2014 and 2021, according to Robson’s Ten-Group
Classification System. CS: caesarean section; Group size: The percentage of
patients belonging to the category compared to the overall study population;
Relative contribution of group to overall caesarean section rate: number of caesareans
in the group compared to the overall caesarean sections in the study, as a percentage.
Group 1: Nulliparous, singleton, cephalic, ≥37 weeks in spontaneous labour;
Group 2: Nulliparous, singleton, cephalic, ≥37 weeks, induced or caesarean
section before labour; Group 3: Multiparous (excluding previous caesarean
section), singleton, cephalic, ≥37 weeks in spontaneous labour; Group 4:
Multiparous (excluding previous caesarean section), singleton, cephalic, ≥37
weeks, induced or CS before labour; Group 5: Previous caesarean section,
singleton, cephalic, ≥37 weeks; Group 6: All nulliparous, singleton, breech; Group
7: Multiparous, singleton, breech (including previous caesarean section); Group
8: All multiple births (including previous caesarean section); Group 9: All
singleton, abnormal lie (including previous caesarean section); Group 10: All
singleton, cephalic, ≤36 weeks (including previous caesarean section).
When
evaluating caesarean section trends in our population, we noted a declining
trend in the overall caesarean section rate over the study period. Considering
the ten TGCS Groups, it appears that the caesarean section rate for all Groups has
been decreasing from the year 2014 and 2015 to the year 2021, except for Group 10.
Figure
2 shows the temporal trend in caesarean section rate according to the TGCS.
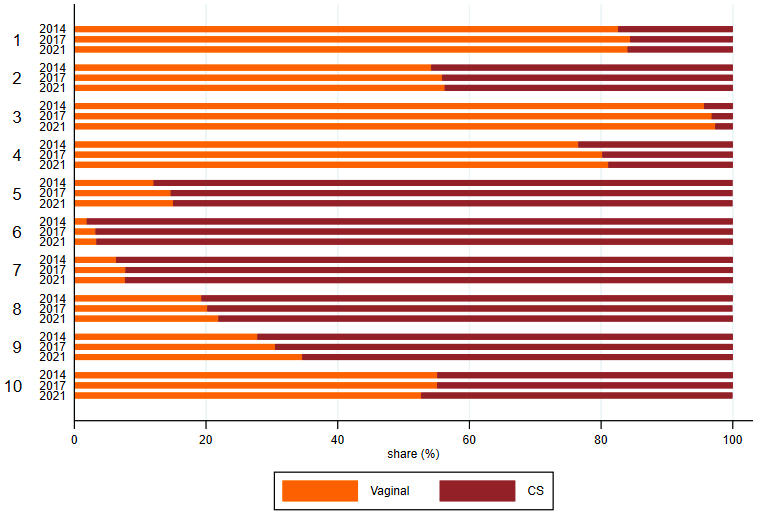
Figure 2Mode of
delivery by TGCS Groups in 2014, 2015 and 2021.
Table 5
compares our population to the WHO reference population [10]. Our rate of
nulliparous at-term with a cephalic presentation reached 39.9% of the
population, while the rate of multiparous with a cephalic presentation at term
was recorded at 35.3%. The third group in our study consisted of women with a
previous caesarean section, comprising 11.5% of the total. This group also
showed a high induction rate, with a ratio of 1.6 when comparing Groups 1 and
2.
Table 5Characteristics
of the study population compared to the WHO’s reference population.
| Step |
Robson
guideline |
WHO
MCS population |
Our
results (Switzerland) |
| 1. Look at the
size of Groups 1 + 2 (Column 4) |
This
usually represents 35–42% of the obstetric population of most hospitals |
38.1% |
39.9% |
| 2. Look at the
size of
Groups 3 + 4 (Column 4) |
This
usually represents about 30% of women |
46.5% |
35.3% |
| 3. Look at the
size of Group 5 (Column 4) |
This is
related to the overall caesarean section rate. The size of Group 5 is usually
about half of the total caesarean section rate. In settings with low overall caesarean
section rates, it is usually under 10%. |
7.2% |
11.5% |
| 4. Look at the
size of Groups 6 + 7 (Column 4) |
This should
be 3–4% |
2.7% |
4.7% |
| 5. Look at the
size of Group 8 (Column 4) |
This should
be 1.5–2% |
0.9% |
1.8% |
| 6. Look at the
size of Group 10 (Column 4) |
This should
be less than 5% in most normal risk settings |
4.2% |
4.4% |
| 7. Look at the
Ratio of the size of Group 1 vs Group 2 (Divide the size of Group 1 by
the size of Group 2; Column 4) |
This is
usually 2 or higher |
Ratio 3.3 |
1.6 |
| 8. Look at the
Ratio of the size of Group 3 versus Group 4 (Divide the size of Group 3
by the size of Group 4; Column 4) |
This is
always higher than the ratio of Group 1/Group 2 in the same institution, i.e.
larger than 2:1. This is a very reliable finding in confirming data quality
and culture of the organisation. |
2 |
2.6 |
| 9. Look at the
Ratio of the size of Group 6 versus Group 7 (Divide the size of Group 6
by the size of Group 7; Column 4) |
This is
usually 2:1 because breeches are more frequent in nulliparous women than in multiparous
women. |
Ratio 0.8 |
1.8 |
Figure 3 shows the caesarean section rate by TGCS Group in 2021 in the
different regions of Switzerland. These cartographies reveal wide disparities
between different part of our country, especially for the caesarean section
rate for the two main contributors to our overall caesarean section rate, Groups
2 and 5, ranging from 29.8% to 59.6% for Group 2 and between 58.0% and 100% for
Group 5; vs caesarean section rates in Switzerland overall of 44.4% in Group 2 and
86.0% in Group 5.
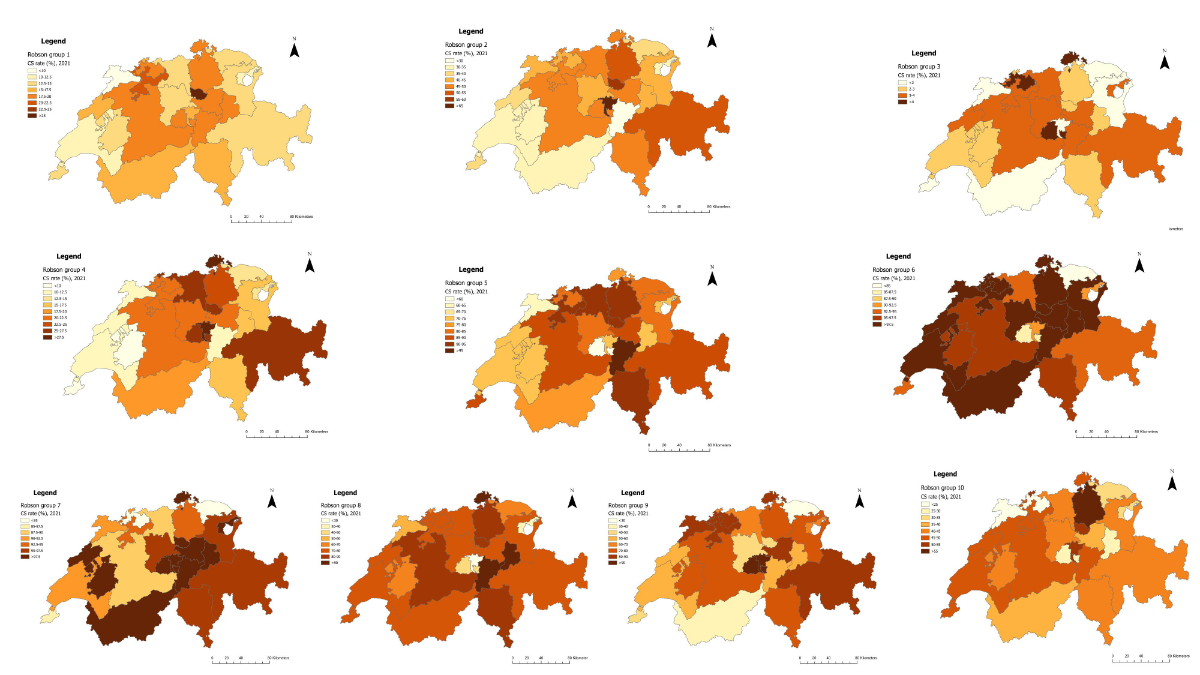
Figure 3Caesarean
section rate in Switzerland in 2021, according to Robson’s Ten-Group
Classification System. Group 1: Nulliparous, singleton, cephalic,
≥37 weeks in spontaneous labour; Group 2: Nulliparous, singleton, cephalic, ≥37
weeks, induced or caesarean section before labour; Group 3: Multiparous (excluding
previous caesarean section),
singleton, cephalic, ≥37 weeks in spontaneous labour; Group 4: Multiparous (excluding
previous caesarean section),
singleton, cephalic, ≥37 weeks, induced or CS before labour; Group 5: Previous caesarean
section,
singleton, cephalic, ≥37 weeks; Group 6: All nulliparous, singleton, breech; Group
7: Multiparous, singleton, breech (including previous caesarean section);
Group 8: All multiple births (including previous caesarean section);
Group 9: All singleton, abnormal lie (including previous caesarean section);
Group 10: All singleton, cephalic, ≤36 weeks (including previous caesarean section).
Figure
4 shows the difference in the caesarean section rate between hospitals based on
their size and type of activity. We can observe that for the two main
contributors to our overall caesarean section, namely Groups 2 and 5, the
biggest hospitals tend to have a lower caesarean section rate. The Group 2 caesarean
section rate was 39.6% in university hospitals, while structures with the lowest number
of
patients hospitalised per year had a rate higher than 50%. The same remark can be
made for Group 4:
university hospitals had a caesarean section rate less than a fifth while this rate
climbed to almost a third in
structures with fewer than 9000 hospitalisations
per year. Regarding Group 5, there is a slight increase when comparing
university hospitals with small facilities but all types of hospital had a caesarean
section rate
hovering around 80%. Conversely, for the category of caesarean
section that required neonatal support,
Group 10, it seems that the biggest hospital had a higher caesarean
section rate, 56.0%. Finally, for Group
9, which should have a caesarean section rate of 100%, the biggest facilities seem
to have a better quality of
data entry.
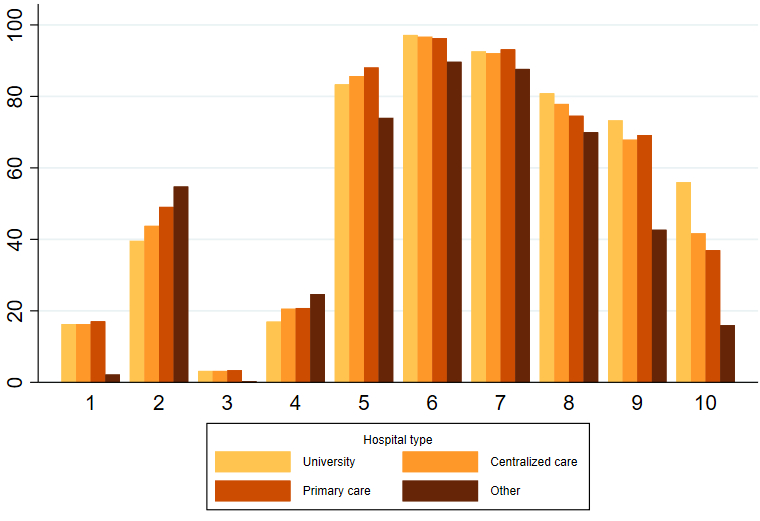
Figure 4Caesarean rate by hospital type. Centralised
care hospitals include hospitals that have between 30,000 and 9000 hospitalisations
per year between all the different services or a high level of training.
Primary care hospitals have fewer than 9000 hospitalisations per year and a
lower level of training. Other hospitals include specialised hospitals where
one specialty is predominant. Group 1: Nulliparous, singleton, cephalic, ≥37
weeks in spontaneous labour; Group 2: Nulliparous, singleton, cephalic, ≥37
weeks, induced or caesarean section before labour; Group 3: Multiparous
(excluding previous caesarean section), singleton, cephalic, ≥37 weeks in
spontaneous labour; Group 4: Multiparous (excluding previous caesarean section),
singleton, cephalic, ≥37 weeks, induced or CS before labour; Group 5: Previous caesarean
section, singleton, cephalic, ≥37 weeks; Group 6: All nulliparous, singleton, breech;
Group 7: Multiparous, singleton, breech (including previous caesarean section);
Group 8: All multiple births (including previous caesarean section); Group 9:
All singleton, abnormal lie (including previous caesarean section); Group 10:
All singleton, cephalic, ≤36 weeks (including previous caesarean section).
Discussion
Main study findings
In
this study, we described caesarean section rates in Switzerland according to Robson’s
Ten-Group Classification System (TGCS). According to these data, the major
contributors were Groups 5 and 2. We also detected
large differences in the distribution of the caesarean section rate according
to the region and the type of hospital considered, without significant trends
during the study period.
Considering
our data, we observed that our population is mainly composed of nulliparous and
multiparous without any obstetric risk, such as the WHO population [10]. We showed
in table 4, a relative contribution of 30.1% from Group 5 and 20.7% from Group 2.
The two groups together account for 50.8% of the overall caesarean section rate.
These results are in accordance with the current literature showing that these
two Groups are those where most efforts should be addressed [3,
12].
When evaluating the caesarean section rate among our population among the most
representative TGCS Groups, we found that it exceeded that suggested by the WHO
recommendations, being 44.4% vs 39.9% and 86.0% vs 74.4%, respectively for Group
2 and Group 5 [10].
When
evaluating caesarean section trends in our population, we noted a stable global
caesarean section rate over the study period. When we look at the different
regions, we can clearly see that some areas reach a caesarean section rate
under the Multi-Country Survey on Maternal and Newborn Health population and
close to the WHO recommendation. For instance, the goal for Group 2 – WHO
recommends a caesarean section rate around 20–35% – is reached by several regions
in our country.
The same observation can be made with Group 4. It is interesting to see the difference
in the caesarean section rate also according to the type of hospital
where delivery took place.
Strengths and limitations
One
of the strengths of this study is that data collected from the Swiss Federal
Statistical Office are population-based and representative of national
practices. They include all deliveries performed in Switzerland, except for home
births, which, according to a national survey published in 2015, accounted for
about 2.5% of all deliveries [13]. We also
chose to perform the study over an 8-year period in order to include a large
number of patients and to evaluate whether variations were detectable during
the study period. The starting period selected was 2014, given that before this
year no distinction was made between planned and emergency caesarean sections.
The absence of this information would affect the classification of these
deliveries to the correct TGCS Group. Using routine data processed by the Swiss
Federal Statistical Office, we were able to classify the great majority of the
deliveries that occurred, thus providing a comprehensive overview of caesarean
section contributors for all Swiss acute care hospitals.
The
main limitations of our study are the type of data collected and its retrospective
nature. In Switzerland, codification is done by non-medical personnel according
to the discharge summary of patients. The variable used for defining the ten TGCS
Groups was extrapolated using the ICD-10 and the Swiss classification of
surgical procedures (CHOP) codes, respectively, for defining the diagnosis and
the procedures performed. Consequently, the quality of data can vary
considerably, increasing the number of misclassifications in the TGCS Groups.This
was reflected by the control
of data quality, performed according to the WHO guidelines; for example,
concerning the number of singleton pregnancies with abnormal
presentation undergoing a vaginal birth. However, in our experience, the most challenging
Group to be
correctly identified was Group 5 (women with a history of caesarean section, singleton,
cephalic, fetus in the ≥37 weeks of gestation), which also represents a
relevant category of caesarean sections in terms of numerosity. Furthermore, according
to the coding system, caesarean
section was indicated for all forms of
uterine scars, including a potential small part of women who have had a
previous myomectomy or other interventions on the uterine wall excluding the caesarean
section.
According to a previous single-centre retrospective
study conducted in Switzerland, the relative rate of caesarean
sections accounting for Group 5
represented the 66.8% of all delivering women with at least one previous caesarean
section[12]. This rate of caesarean
section is much lower than the 86.0% rate
we found in our population but can be linked to a specific population of study
and institutional confounding factors. On the contrary, our data are
superposable with the national data presented in a multicentre study, again,
based on information provided by the national register on the basis of the
standard codification system [14].
In order to reduce misclassifications, we followed up
each woman having already delivered for a period of 10 years before the study
period. Women were tracked by using their personal identity code. We were able
to track 98.0% of all women with a previous history of childbirth. However,
this does not avoid potential errors in classification due to lack of
information or errors in tracking the women. Thus,
according to our experience, there is an urgent need to improve the perinatal
audit in Switzerland. Supporting the use of electronic patient records will
probably help to provide a better collection of routine data, helping to
implement current and future research and medical practice.
Interpretation
The caesarean section rate of 32.9% in Switzerland during the
study period stands notably above the threshold recommended by the World Health
Organization (15%). Although Swiss maternal demographics are broadly comparable
to those in the WHO reference population, the higher caesarean rate suggests
that clinical practice and healthcare system characteristics may be influencing
obstetric outcomes beyond medical necessity.
One of the main insights from our study is the
regional
variability across
the 26 Swiss cantons. For example, caesarean section rates in Group 2
(nulliparous, term, singleton, cephalic pregnancies with induction or pre-labour
caesarean) ranged from 29.8% to 59.6% across regions. Similarly, in Group 5
(women with a previous caesarean), rates ranged from 58.0% to 100%. These
disparities point towards localised differences in obstetric decision-making
and institutional policies rather than clinical risk profiles alone.
This variation is even more evident when analysing the type of
healthcare institution. University
hospitals generally
reported lower caesarean rates, particularly in Groups 2 and 4, compared to primary
care hospitals and smaller clinics.
This suggests that larger institutions, potentially due to greater adherence to
evidence-based protocols or access to multidisciplinary teams, may be more
capable of promoting vaginal deliveries in appropriate cases.
Furthermore, although the TGCS revealed that the main caesarean
drivers in Switzerland are Groups 2 and 5, which is consistent with other
high-income countries, our national rates exceeded WHO’s proposed targets for
these groups. For instance, Swiss caesarean rates reached 44.4% in Group 2 (vs
WHO’s 39.9%) and 86.0% in
Group 5 (vs WHO’s
74.4%). This suggests opportunities for targeted interventions to reduce
unnecessary repeat caesareans and to improve labour management in induced
nulliparous women.
While the WHO’s recommendations are based on data predominantly
collected in low- and middle-income countries, our results affirm that such
international benchmarks can still offer valuable points of comparison for
Switzerland. Several Swiss regions already meet or come close to these targets,
showing that a more
uniform, quality-driven approach to delivery care is feasible within the country.
However, targeting
specific groups by developing adapted strategies for reducing caesarean section
rate can be more challenging than expected. There are many confounding factors
that seem to influence the caesarean section rate, even when considering the TGCS.
They include organisational factors as well as pregnancy-related factors
concerning maternal and fetal conditions, that could impact both the overall and
specific incidence of caesarean sections by TGCS Group [15]. Thus, the TGCS alone
might not be the best tool to
compare different hospitals. Some studies have evaluated the impact of
these confounding factors, showing a potential benefit in including the TGCS when
calculating the adjusted risk for caesarean section [16–18].
Our study also highlights limitations in the current perinatal data collection infrastructure
in Switzerland. The study
revealed poor data quality which was particularly visible for Group 9. This
indicates the need for standardised data acquisition
systems. Strengthening electronic health records and ensuring medically
trained coders are involved in classification would enhance the accuracy and
utility of future audits [19]. We would
also recommend limiting the number of free fields in the patient’s medical
record to multiple-choice pre-established forms, which would make it easier to
obtain clear and complete data.
Conclusions
In
conclusion, Switzerland, while a high-resource and high-performing health
system, still shows considerable variation and overuse of caesarean sections.
Our study underscores the possibility for our country to reach the WHO’s
recommendation. This could be reached by harmonising obstetric practices,
improving institutional protocols and supporting shared decision-making models
across all regions and facility types. National efforts to promote vaginal
birth after caesarean, refine induction protocols, and invest in staff training
could contribute to reducing the caesarean section rate without compromising
maternal or neonatal outcomes.
Data sharing statement
Data of this work belong to the Swiss Federal
Statistical Office and are subject to a data protection contract; they will not
be shared publicly. However, data could be available upon reasonable request.
Acknowledgments
Author’s contributions: Conceptualisation:
Arrigo Fruscalzo; Methodology: Arrigo Fruscalzo, S.A., G.P.K.; Validation:
A.V., J-M.A.; Formal analysis: S.A., G.P.K.; Writing—review and editing: S.A.,
G.B., Ben Ali N., Anis Feki, Arrigo Fruscalzo. All authors have read and agreed to
the published version of the manuscript.
Arrigo Fruscalzo
Department of Obstetrics and Gynecology
Hospital of Fribourg
Chemin des Pensionnats 2-6
CH-1708 Fribourg
Arrigo.Fruscalzo[at]h-fr.ch
References
1. McDermott KW, Liang L. Overview of Operating Room Procedures During Inpatient Stays
in U.S. Hospitals, 2018. In: Healthcare Cost and Utilization Project (HCUP) Statistical
Briefs [Internet]. Rockville (MD): Agency for Healthcare Research and Quality (US);
2006 [cited 2025 Mar 23]. Available from: http://www.ncbi.nlm.nih.gov/books/NBK574416/
2. Souza JP, Gülmezoglu A, Lumbiganon P, Laopaiboon M, Carroli G, Fawole B, et al.; WHO
Global Survey on Maternal and Perinatal Health Research Group. Caesarean section without
medical indications is associated with an increased risk of adverse short-term maternal
outcomes: the 2004-2008 WHO Global Survey on Maternal and Perinatal Health. BMC Med.
2010 Nov;8(1):71. doi: https://doi.org/10.1186/1741-7015-8-71
3. Pyykönen A, Gissler M, Løkkegaard E, Bergholt T, Rasmussen SC, Smárason A, et al. Cesarean
section trends in the Nordic Countries - a comparative analysis with the Robson classification.
Acta Obstet Gynecol Scand. 2017 May;96(5):607–16. doi: https://doi.org/10.1111/aogs.13108
4. Antoine C, Young BK. Cesarean section one hundred years 1920-2020: the Good, the Bad
and the Ugly. J Perinat Med. 2020 Sep;49(1):5–16. doi: https://doi.org/10.1515/jpm-2020-0305
5. Office fédéral de la statistique, Sections Services de santé, Santé de la population.
Santé reproductive [Internet]. 2021. Available from: https://www.bfs.admin.ch/bfs/fr/home/statistiques/sante/etat-sante/reproductive.html
6. Robson MS. The 10-Group Classification System-a new way of thinking. Am J Obstet Gynecol.
2018 Jul;219(1):1–4. doi: https://doi.org/10.1016/j.ajog.2018.05.026
7. Triep K, Torbica N, Raio L, Surbek D, Endrich O. The Robson classification for caesarean
section—A proposed method based on routinely collected health data. Ryckman KK, editor.
PLOS ONE. 2020 Nov 30;15(11):e0242736.
8. Betran A, Torloni M, Zhang J, Gülmezoglu A, the WHO Working Group on Caesarean Section,
Aleem H, et al. Statement on Caesarean Section Rates. BJOG Int J Obstet Gynaecol.
2016 Apr;123(5):667–70.
9. Gu J, Karmakar-Hore S, Hogan ME, Azzam HM, Barrett JF, Brown A, et al. Examining Cesarean
Section Rates in Canada Using the Modified Robson Classification. J Obstet Gynaecol
Can. 2020 Jun;42(6):757–65. doi: https://doi.org/10.1016/j.jogc.2019.09.009
10. World Health Organization. Robson classification: implementation manual [Internet].
Geneva: World Health Organization; 2017 [cited 2023 Feb 22]. 51 p. Available from:
https://apps.who.int/iris/handle/10665/259512
11. Souza JP, Gülmezoglu AM, Vogel J, Carroli G, Lumbiganon P, Qureshi Z, et al. Moving
beyond essential interventions for reduction of maternal mortality (the WHO Multicountry
Survey on Maternal and Newborn Health): a cross-sectional study. Lancet. 2013 May;381(9879):1747–55.
doi: https://doi.org/10.1016/S0140-6736(13)60686-8
12. Haydar DA, Vial PY, Baud D. Evolution du taux de césariennes dans une maternité universitaire
suisse selon la classification de Robson. Rev MÉDICALE SUISSE; 2017. p. 5.
13. Erdin R, Schmid M, Pehlke-Milde J. Recensement des activités des sages-femmes indépendantes
de Suisse.
14. Zeitlin J, Durox M, Macfarlane A, Alexander S, Heller G, Loghi M, et al.; Euro-Peristat
Network. Using Robson’s Ten-Group Classification System for comparing caesarean section
rates in Europe: an analysis of routine data from the Euro-Peristat study. BJOG. 2021 Aug;128(9):1444–53.
doi: https://doi.org/10.1111/1471-0528.16634
15. Le Ray C, Blondel B, Prunet C, Khireddine I, Deneux-Tharaux C, Goffinet F. Stabilising
the caesarean rate: which target population? BJOG. 2015 Apr;122(5):690–9. doi: https://doi.org/10.1111/1471-0528.13199
16. Quibel T, Rozenberg P, Bouyer C, Bouyer J. Variation between hospital caesarean delivery
rates when Robson’s classification is considered: An observational study from a French
perinatal network. Shamshirsaz AA, editor. PLOS ONE. 2021 Aug 20;16(8):e0251141.
17. Colais P, Fantini MP, Fusco D, Carretta E, Stivanello E, Lenzi J, et al. Risk adjustment
models for interhospital comparison of CS rates using Robson’s ten group classification
system and other socio-demographic and clinical variables. BMC Pregnancy Childbirth.
2012 Jun;12(1):54. doi: https://doi.org/10.1186/1471-2393-12-54
18. Muraca GM, Joseph KS, Razaz N, Ladfors LV, Lisonkova S, Stephansson O. Crude and adjusted
comparisons of cesarean delivery rates using the Robson classification: A population-based
cohort study in Canada and Sweden, 2004 to 2016. PLoS Med. 2022 Aug;19(8):e1004077.
doi: https://doi.org/10.1371/journal.pmed.1004077
19. Robson MS. Known knowns, unknown unknowns and everything in-between - the Ten Group
Classification System (TGCS). BJOG. 2021 Aug;128(9):1454–5. doi: https://doi.org/10.1111/1471-0528.16679