Evaluation and testing of the proportional hazards assumption in analysis of time-to-event
data in subgroup analysis of randomised controlled trials: a meta-epidemiological
study
DOI: https://doi.org/https://doi.org/10.57187/s.4022
Dominique Lisa Birrerab,
Lukas Werner Widmerc,
Lulu
Tannod,
Romano Schneidere,
Amanda Dirnbergere,
Alexander
Wilhelme,
Urs Zingga,
Beat Müllere,
Lorenz Meulifg,
Christoph Kuemmerlie
a Department of Surgery, Limmattal Hospital,
Zurich-Schlieren, Switzerland
b Department of Surgery, University Hospital of Zurich
Switzerland, Zurich, Switzerland
c Department
of Surgery, Cantonal Hospital of Fribourg and Faculty of Science and Medicine, University
of Fribourg, Fribourg, Switzerland
d Department
of Surgery, University Hospital Southampton, Southampton, United Kingdom
e Clarunis, University Digestive Health Care Center Basel,
University Hospital Basel, Basel, Switzerland
f Department of Vascular Surgery, University Hospital Zurich, Zurich, Switzerland
g Department of Vascular Surgery, Copenhagen Aortic
Centre, Copenhagen University Hospital, Copenhagen, Denmark
Summary
BACKGROUND: When Cox regression models are used to analyse time-to-event data, the
proportional
hazard assumption (PHA) must be reassured to obtain valid results. Transparent
reporting of the statistics used is therefore essential to interpret research. This
study aimed to assess the quality of statistical reporting and testing of the
PHA in subgroup analysis of surgical randomised controlled trials (RCTs).
METHODS: All published articles (see appendix 1) in the top quartile (25%) of
surgical journals from 2019 to 2021 were screened in a literature review according
to the ClarivateTM journal citation report impact factor. Subgroup
analyses of surgical RCT data that used Cox models were identified. Statistical
reporting was rated using a previously established 12-item PHA Reporting Score
as our primary endpoint. For
original surgical publications, the PHA was formally tested on reconstructed
time-to-event data from Kaplan-Meier estimators. Methodological reporting quality
was rated according to the CONSORT statement. Digitalisation was only possible
in studies where a Kaplan-Meier estimator including numbers at risk per time
interval was published. All results from the subgroup analyses were compared to
primary surgical RCT reports and benchmark RCTs using Cox models published in
the New England Journal of Medicine and The Lancet.
RESULTS: Thirty-two studies reporting secondary subgroup analyses on surgical RCT
data using Cox models were identified. Statistical reporting of surgical subgroup
publications was significantly inferior compared to original benchmark
publications: median PHA Reporting Score 50% (interquartile range [IQR]: 39 to
58) vs 58% (IQR: 42 to 67), p <0.001. The subgroups did not differ in
comparison to primary surgical RCTs: median PHA Reporting Score 50% (IQR: 39 to
58) vs 42% (IQR: 33 to 58), p = 0.286. Adherence to the CONSORT reporting
standards did significantly differ between subgroup studies and benchmark
publications (p <0.001) as well as between subgroup studies and primary
surgical RCT reports: 13 (12.5 to 14) vs 13 (IQR: 11 to 13), p = 0.042.
CONCLUSION: Statistical methodological reporting of secondary subgroup analyses from
surgical RCTs was inferior to benchmark publications but not worse than primary
surgical RCT reports. A comprehensive statistical review process and
statistical reporting guidelines might help improve the reporting quality.
Introduction
The Consolidated
Standards of Reporting Trials (CONSORT) statement, published in 2010, provides
a guideline for the reporting of parallel-group randomised trials [1].
Reporting according to consented standards enhances the quality and
transparency of research by presenting complete and precise applied methods. Internal
validity is a prerequisite for the applicability of scientific results to an
external population. The CONSORT statement 12a proposes that the statistical
method should be reported. The statistical method used must be not only stated
but also used appropriately from the beginning.
In time-to-event
analysis, where the occurrence of the outcome event is analysed, several
statistical methods are available. The most common statistical tests to compare
time-to-event data between two groups are the log-rank test, a non-parametric
univariate test, and the Cox proportional-hazards model (Cox model), a method
that allows multivariable adjustment in time-to-event analysis [2, 3]. The
hazard ratio is calculated to quantify the risk of an event occurring at any
time throughout the study between the study groups. It results in an averaged
effect that often varies along the follow-up duration and for most medical
studies [4]. Although differences in drug effects or disease susceptibility may
cause a true varying hazard rate over time, simple patient selection or missing
data points may result in the same variation.
Cox models are
based on two fundamental assumptions that must be checked and hold to allow
drawing valid conclusions from the obtained results. First, censoring of
participants must be non-informative, meaning that the dropout of participants does
not obscure the true
treatment effect, and thus the treatment itself is not related to early
participant dropout [1]. Second, the
proportional hazard assumption (PHA) presupposes that the baseline hazard for
each study group is constant over time. This can be informally assessed by
inspection of the Kaplan-Meier estimator. Crossing, converging or diverging
curves over the follow-up period indicates that the hazards change over
time and the PHA will probably not hold. As a result, the hazard ratio, an
estimator of the overall treatment effect, no longer reflects the true
treatment effect at any given time during the study. In fact, if
non-proportional hazards are present, reporting the overall hazard ratio is
misleading. Additionally, the statistical tests lose power [5].
Although
not explicitly captured by the CONSORT statement, detailed reporting on the
statistics used, including the testing, verification and disclosure of the
underlying assumptions, is crucial. This applies to not only randomised
controlled trials (RCTs) but also all comparative research and, in particular, all
subgroup analyses in which randomisation has been disbanded and the effects of
multiple testing and chance play a greater role [6, 7].
The quality
of methodological reporting in surgical RCTs has been previously assessed and
often labelled as rudimentary [8–10]. Assessment of reporting of statistical
methods, including PHA testing in time-to-event analysis in surgical RCTs, is
rarely performed [11, 12]. We assessed the adherence to established reporting
guidelines and the reporting of statistical methods in time-to-event analysis
of subgroup reports in high-impact surgical journals. The findings were
compared to previously assessed primary reports from surgical trials published
between 2019 and 2021 in the top 25% of journals based on the ClarivateTM
journal citation report and to a benchmark consisting of articles published in
the New England Journal of Medicine and The Lancet [13]. The aim was
to identify weaknesses in the reporting that may ultimately result in
misleading conclusions by authors and readers, as well as misguiding clinical
practice.
Methods
Literature search
and data extraction
A selective
literature review was performed to identify all secondary publications of surgical
RCTs that were published from 2019 to 2021 that used Cox models comparing subgroups.
The top quartile of surgical journals according to the 2018 journal impact factor
as categorised by Web of Science, Clarivate Analytics, were independently
screened for eligibility by two authors (LW, CK). A list of all screened
journals is available in appendix 1.
The eligibility
criteria were the date of publication, secondary subgroup analysis of
time-to-event data using a Cox model, and any kind of surgical intervention in
at least one study arm or an eligible surgical population, as well as subgroup
analysis in the subspecialties (general surgery, surgical oncology,
cardiothoracic surgery, vascular surgery, transplantation and orthopaedic
surgery). Primary RCT publications, studies with early termination and
meta-analyses of RCT data were excluded. The data extraction was performed by two
reviewers independently (LW, CK), and discrepancies were resolved by a third
reviewer (LM).
The
reporting of this selective literature review adheres to the PRISMA guidelines
[14].
Outcomes
The primary
outcome was a previously used summation score of points obtained from
statistical reporting [13]. The PHA Reporting Score ranged from 0 to 12 points,
where 12 points represents the highest reporting quality. If no Kaplan-Meier
estimators were published, the maximum score was 9 points. The score is
depicted in table 1. It comprised reporting of the following items: statistical
model, including covariates, PHA testing and reporting of test results; patient
flow diagram; Kaplan-Meier estimator; number of patients per group and
subgroups; and number of censored patients per group. To enable comparison
between publications with and without Kaplan-Meier estimators, the PHA
Reporting Score was converted into a percentage value, with the denominator
changed accordingly. This percentage score constitutes the primary outcome.
Table 1The PHA Reporting Score [13] criteria, including subgroups.
| Reporting criterion |
Points |
| 1. Statistical
model |
0 = not clearly reported |
| 1 = reported with sufficient details |
| 2. Included
covariates |
0 = not clearly reported |
| 1 = reported with sufficient details |
| 3. PHA testing |
0 = not clearly reported |
| 1 = PHA testing mentioned but not clearly
reported |
| 2 = PHA testing conducted and reported with details |
| 4. Patient flow
diagram |
0 = not clearly reported |
| 1 = CONSORT flow diagram or similar |
| 5. No. of
participants per group |
0 = not clearly reported |
| 1 = reported with sufficient details |
| 6. No. of censored
participants |
0 = not clearly reported |
| 1 = reported with sufficient details for each
group |
| 7. PHA reporting |
0 = not performed or not clearly reported |
| 1 = reported, test results/plots not available |
| 2 = reported, test results/plots available |
| 8. Kaplan-Meier estimator* |
|
0 = Kaplan-Meier plots not presented |
| 1 = Kaplan-Meier plots available |
| No. at risk per group |
0 = not reported |
| 1 = reported on plot |
| 95% CI per group |
0 = not reported |
| 1 = reported on plot |
The
secondary outcome was a summation score of points obtained from methodological
reporting according to the CONSORT 2010 methods criteria [1]. The CONSORT score
ranges from 0 to 14 points, where 14 points represents the highest reporting
quality. The items of this score comprise reporting of the trial design, the
randomisation sequence generation, the allocation ratio, concealment of
allocation, the level of blinding, the inclusion period, the study end date,
the follow-up registration, the sample size calculation (sufficient reporting
was defined as the presence of alpha and beta level, effect size, statistical
test and total number), the eligibility criteria, the intervention, the
control, the outcome measures and the mode of primary analysis.
The
obtained score results were compared to the published PHA Reporting Scores and
CONSORT scores of “primary surgical RCTs” and “benchmark RCTs” [11]. The identification
of these studies was previously reported in
detail. In short, the “primary surgical RCT” group included 25 surgical RCTs published
in 2019 in the top quartile
of surgical journals using Cox models, and the “benchmark RCT” group included 54 RCTs
in any field of medicine published in the first
six months of 2019 in the New England Journal of Medicine and The
Lancet using a Cox model [13]. The PHA Reporting Score and the CONSORT
score were calculated for each article. When information on formal testing of
the PHA was not available, DataThief III and the StataVR ipdfc command (StataCorp,
College Station, Texas, USA) were used to reconstruct the data from published
Kaplan-Meier estimators if available. A global test and Schoenfeld residuals
were used to check the PHA. The reproducibility of the scores was high in this
first report. We found that reporting adherence to the CONSORT guidelines was
high in both groups but significantly lower in the surgical publications.
However, the reporting of the PHA testing was negligible in the surgical trial
group. Because reconstruction of the data depended on sophisticated additional
reporting of (e.g.) Kaplan-Meier estimators, this was often not possible. However,
when reconstructed data was tested for the PHA, there was evidence of violation
in one study, and the significant result obtained from a Cox model was no
longer significant when an appropriate non-parametric method, namely the
restricted mean survival time, was used.
Statistics
The
continuous score variables were visually inspected for their distribution and
then summarised using median and quartiles (Q1, Q3). Counts are presented with
numbers and percentages.
The PHA
Reporting Scores and CONSORT scores were compared between the subgroup studies
and the benchmark RCTs, as well as between the subgroup studies and the primary
surgical RCT reports, using the Wilcoxon rank-sum test. Score results were then
plotted per study group and journal using jitter plots (width: 0.1, height:
2.0).
All
analyses were done with RStudio (version 4.2.3) on macOS 12.5.1. All p-values
are two-sided with an α-level of 5%.
Results
A total of 32
articles published in the screened surgical journals conducted a subgroup
analysis of RCT data using Cox models between 2019 and 2021 (see appendices 1 and
2). The reporting of methods and statistics by journal is visualised in figures 1
and 2.
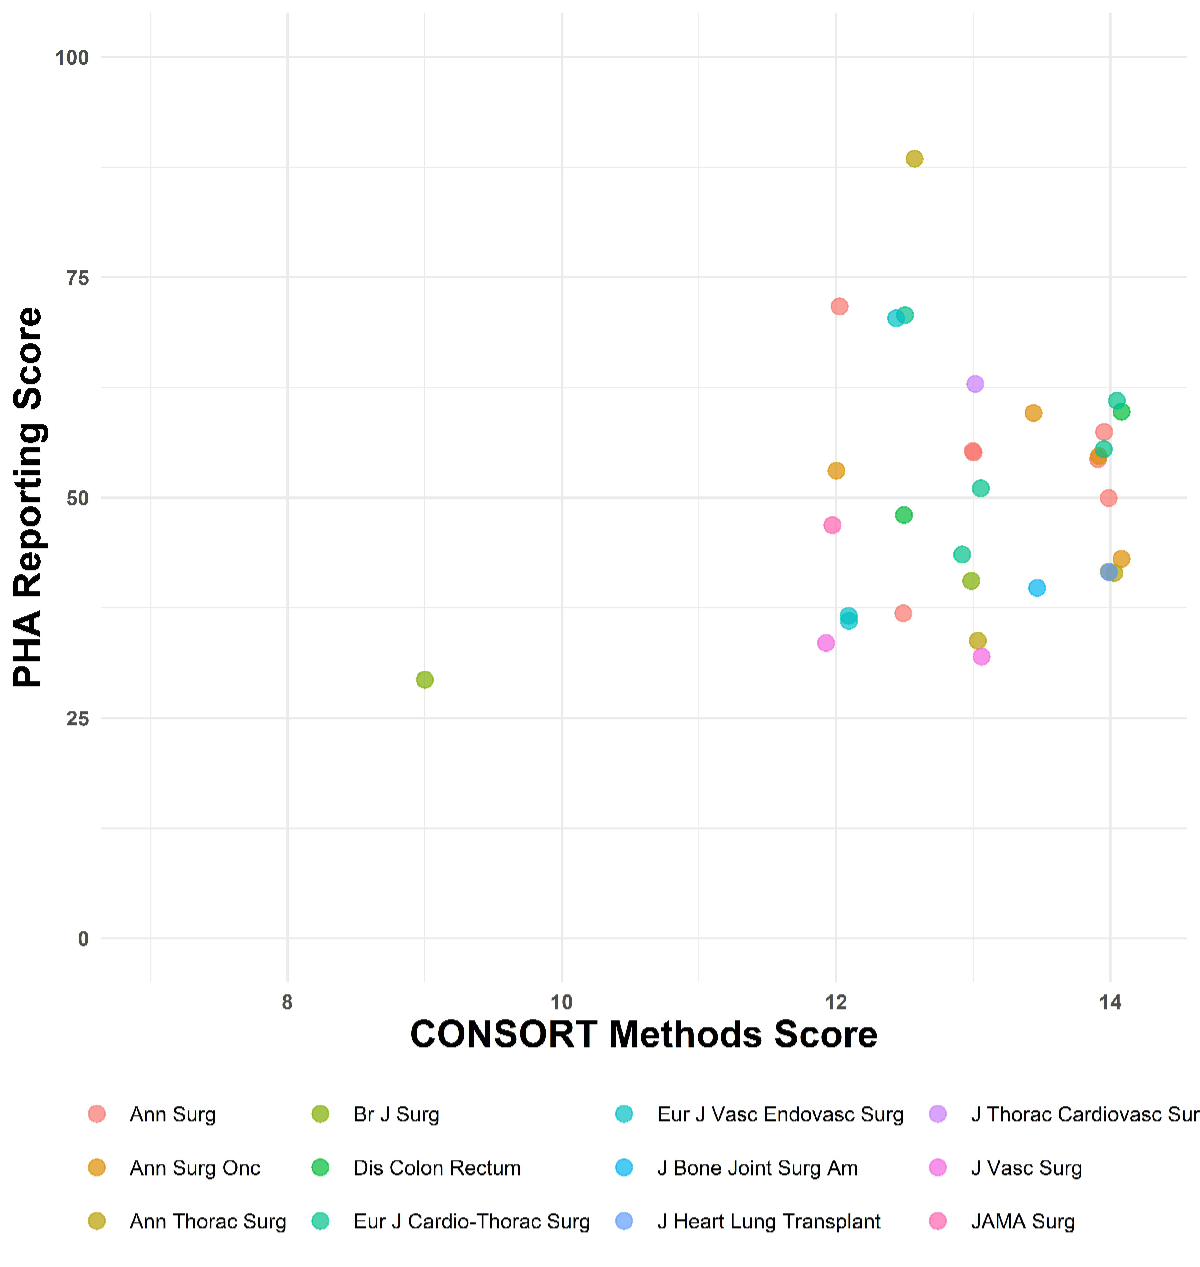
Figure 1Reporting of methods and statistics by journal. Jitter plot
showing the proportional
hazard assumption (PHA) Reporting Score in percentage and the CONSORT score of each
study (n = 79). The x-axis is trimmed at 7 points; no study performed below 7
points in the CONSORT score.
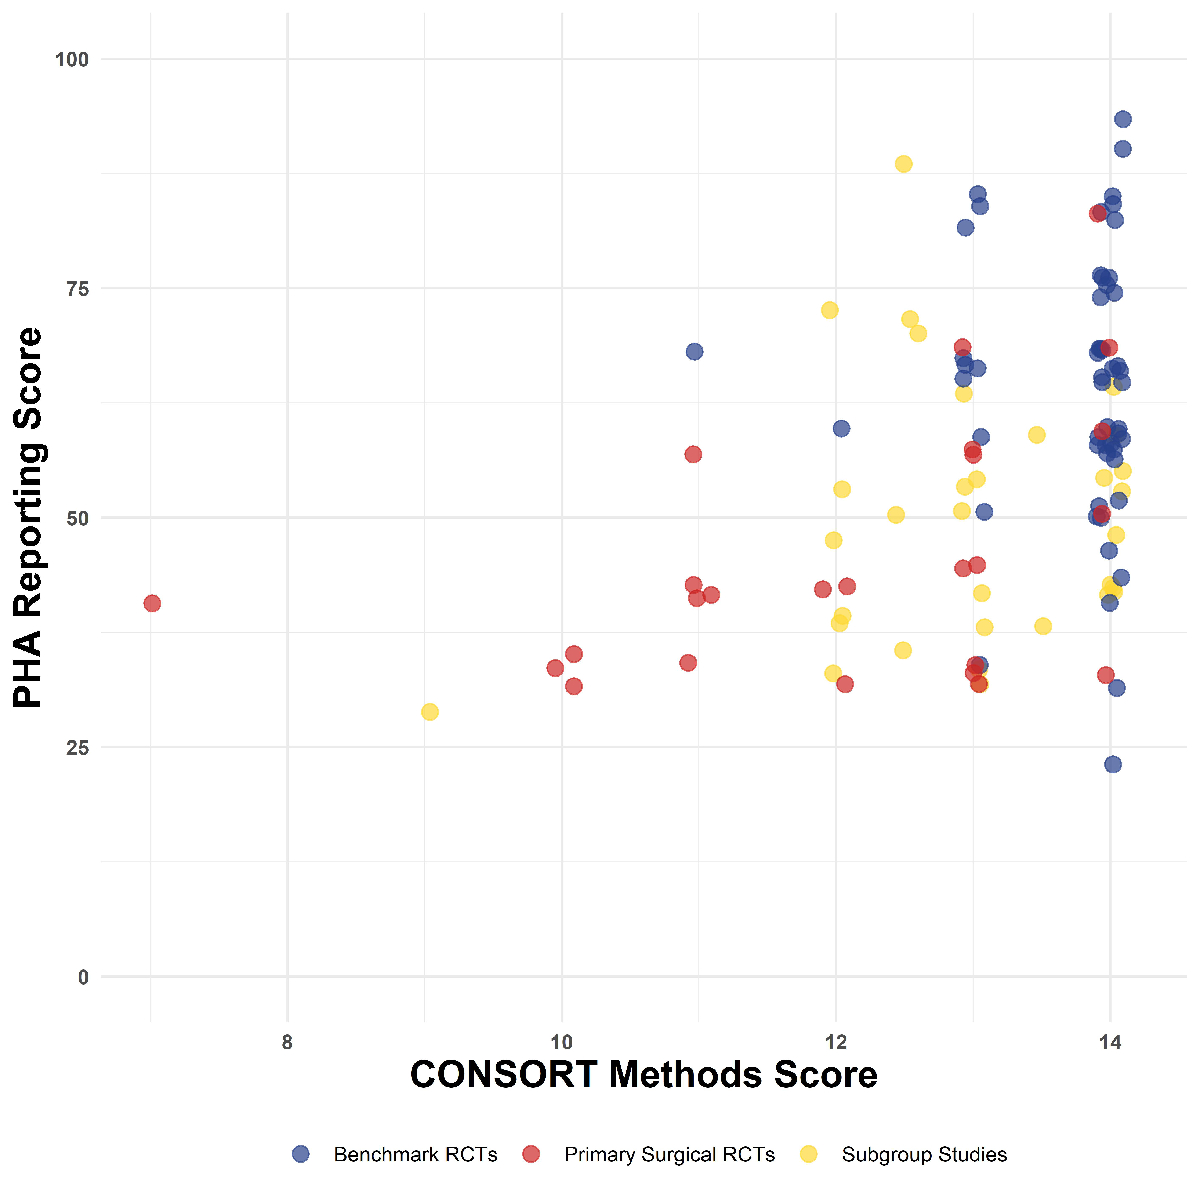
Figure 2Reporting of methods and statistics by journal. Comparing benchmark, primary surgical
randomised controlled trial (RCT) and
subgroup studies.
Statistical reporting
The statistical
reporting is presented in table 2. For the subgroup studies, the median PHA
Reporting Score was 50% (Q1, Q3: 39, 58). The previously reported PHA Reporting
Score in the benchmark RCTs was 67% (58, 75) and in the primary surgical RCT
reports 42% (33, 58).
Table 2PHA Reporting Score for surgical and
benchmark studies, including subgroups. Variables are presented with numbers
and percentages in brackets, if not stated otherwise. They indicate the
proportion of studies that reported the criteria. Distribution of the PHA
Reporting Score was not normally distributed; therefore, data are summarised
using median and interquartile range (IQR: Q1 to Q3). To allow comparability of
studies, given the presented data with or without Kaplan-Meier estimators, the
maximum score was reduced (i.e. −3 points) if no Kaplan-Meier estimator was
published, and a percentage score was calculated.
|
Surgical |
Benchmark |
Subgroup |
| n = 25 |
n = 54 |
n = 32 |
| PHA
reporting score, % median (Q1 to Q3) |
42 (33 to
58) |
67 (58 to
75) |
50 (39 to
58) |
| PHA
reporting score, median (IQR) |
5 (4 to
7) |
8 (7 to
9) |
6 (5 to
7) |
| Model
specifications, n (%) |
20 (80) |
51 (94) |
29 (91) |
| Included
covariates, n (%) |
13 (52) |
46 (85) |
22 (69) |
| PHA testing
(methods), n (%) |
Announced
testing without details |
1 (4) |
22 (41) |
7 (22) |
| Announced
testing with details |
2 (8) |
9 (17) |
2 (6) |
| Patient
flow diagram, n (%) |
23 (92) |
54 (100) |
28 (88) |
| No. of
participants per group, n (%) |
25 (100) |
54 (100) |
32 (100) |
| No. of
censored per group, n (%) |
9 (36) |
28 (52) |
8 (25) |
| PHA testing
(results), n (%) |
Reported
results without details |
2 (8) |
24 (44) |
5 (16) |
| Reported
results including plot |
0 (0) |
4 (7) |
1 (3) |
| Kaplan-Meier
estimator published, n (%) |
21 (84) |
50 (93) |
29 (91) |
| No. at
risk per group, n/N (%) |
15/21
(71) |
50/50
(100) |
25/29
(86) |
| 95% CI per group, n/N (%) |
0/15 (0) |
2/50 (4) |
3 (10) |
The PHA
Reporting Score was significantly lower in subgroup studies compared to
benchmark RCTs, p <0.001. No statistically significant difference existed between
subgroup studies and primary surgical RCT reports, p = 0.286. Details of the
reporting are presented in table 2. The difference between the groups was most
pronounced in the reporting of formal testing of the PHA. In only 9/32 (28%) subgroup
studies, formal PHA testing was mentioned in the methods section, whereas 31/54
(57%) of the benchmark RCTs announced PHA testing. Statistical details on PHA
testing were poorly described, appearing in only 2 out of 32 (6%) subgroup
studies, 2 out of 25 (8%) primary surgical RCT reports and 9 out of 54 (17%) benchmark
RCTs. Likewise, reporting of PHA testing results was generally poor but higher
in benchmark RCTs (28/54, 52%) compared to subgroup studies (6/32, 19%). The
best-reported item was the number of participants per group, which was reported
in all studies throughout all three groups.
Table 3 displays
details on the reporting of PHA testing results. PHA testing results were
reported in only 2/32 (6%) subgroup studies compared to 28/54 (52%) benchmark
RCTs. This opposes a staggeringly high proportion of 30/32 (94%) subgroup
studies and 23/25 (92%) primary surgical RCT reports that did not report
testing or verification of the PHA, whereas specific reporting of PHA testing
was only missing in 26/54 (48%) benchmark RCTs.
Table 3Results of CONSORT score reporting. Variables are presented with numbers and
percentages in brackets if not stated otherwise and indicate the proportion of
studies that reported the criteria.
|
Surgical |
Benchmark
|
Subgroup |
| n = 25 |
n = 54 |
n = 32 |
| Total score,
median (Q1 to Q3) |
13 (11 to
13) |
14 (14 to
14) |
13 (12.5
to 14) |
| Trial setting |
25 (100) |
54 (100) |
33 (100) |
| Allocation ratio |
24 (96) |
53 (98) |
27 (84) |
| Participants/eligibility criteria |
25 (100) |
54 (100) |
32 (100) |
| Intervention |
25 (100) |
54 (100) |
32 (100) |
| Control |
25 (100) |
54 (100) |
32 (100) |
| Outcome
measure |
24 (96) |
54 (100) |
32 (100) |
| Inclusion period |
23 (92) |
54 (100) |
32 (100) |
| Study
end date |
21 (84) |
51 (94) |
28 (88) |
| Follow-up assessment |
23 (92) |
54 (100) |
31 (97) |
| Sample
size calculation |
10 (40) |
50 (93) |
21 (66) |
| Randomisation
mode |
21 (84) |
54 (100) |
30 (84) |
| Concealment of allocation |
19 (76) |
51 (94) |
27 (84) |
| Level
of blinding |
19 (76) |
50 (93) |
28 (88) |
| Analysis mode |
17 (68) |
54 (100) |
30 (94) |
CONSORT reporting
Reporting
quality, as measured by reporting adherence to the CONSORT 2010 Checklist, is
presented in table 4. In general, CONSORT reporting was excellent. The median
total score was 14 (Q1, Q3: 13, 14), indicating that 50% of articles had a
complete reporting of all 14 items listed in the CONSORT 2010 Checklist.
However, the CONSORT score was statistically lower in subgroup studies with a
median of 13 points (Q1, Q3: 12.5 to 14) compared to benchmark RCTs, where the
median score was 14 points (Q1, Q3: 14 to 14), p <0.001. On the other hand, reporting
in the subgroup studies was significantly better compared to primary surgical
RCT reports, which had a median of 13 points (11 to 13), p = 0.042.
Table 4Testing of the PHA. Variables are presented with numbers and percentages of
total numbers in brackets if not stated otherwise. Digitalisation was performed
for all studies where PHA testing was not conducted and reported if possible.
Digitalisation was only possible in studies where a Kaplan-Meier estimator
including numbers at risk per time interval was published.
| |
Surgical
studies |
Benchmark
studies |
Subgroup |
| n = 25 |
n = 54 |
n = 32 |
| Testing
of PHA performed and reported, n (%) |
2 (8) |
28 (52) |
2 (6) |
| PHA
verified, n/N (%) |
2/2 (100) |
24/28
(86) |
2/2 (100) |
| Non-proportionality
identified, n/N (%) |
0/2 (0) |
4/28 (14) |
0/2 (0) |
| Alternative
analysis performed, n/N (%) |
0/2 (0) |
2/4 (50) |
0/2 (0) |
| Testing
of PHA not reported or not verified, n (%) |
23 (92) |
26 (48) |
30 (94) |
The
difference was most pronounced in detailed reporting of sample size
calculations: only 21/32 (66%) subgroup studies reported a precise sample size
calculation versus 50/54 (93%) studies in the benchmark group (table 3). In
primary surgical RCTs, only 10/25 (40%) studies reported a precise sample size
calculation. Complete reporting was seen in all three groups for the CONSORT
items “trial setting”, “eligibility
criteria”, and descriptions of the intervention and control.
Discussion
This study
assessed the reporting quality in subgroup studies of surgical RCTs analysing
time-to-event data published in the top quartile of surgical journals in 2019–2021.
These results were compared to data from a previously published study assessing
reporting in primary surgical RCTs, published in the same journals, and a
benchmark group consisting of RCTs published in the New England Journal of
Medicine and The Lancet.
The focus
of this study was the reporting of the time-to-event analysis, a very specific
but highly relevant aspect of medical literature. For this type of analysis, no
established reporting guidelines exist. Thus, inconsistent and incomplete
reporting was expected, especially in the surgical literature, where reporting
quality is traditionally lower compared to high-quality medical journals. To
assess the reporting quality for statistical reporting of time-to-event
analysis, specific reporting criteria were established and summed in the PHA
Reporting Score. Reporting quality according to this score was better in the
benchmark group compared to the surgical subgroup studies and the primary surgical
studies. Detailed reporting on PHA testing in RCTs was rarely reported in studies
published in surgical journals, whereas it was acceptable in benchmark studies.
Overall, only two of the 32 surgical subgroup studies (6%) reported that the
PHA was verified to hold. In the remaining 30 surgical subgroup studies (94%),
the published statistical details do not allow drawing a conclusive picture
assuring readers that the PHA was considered at all. This contrasts with a relatively
high proportion of 24 of the 54 benchmark RCTs (44%) that verified the PHA and
an additional 4 benchmark RCTs (7.5%) that even identified non-proportionality
in their time-to-event analysis. In two of these four RCTs, an alternative
statistical analysis was conducted because the PHA did not hold [13].
Scientific
reporting guidelines were established to guide study authors, reviewers,
editors and readers. The overall aim is to improve the quality of medical
research by achieving transparent, congruent and reproducible reporting. This
study shows that the well-established CONSORT 2010 reporting recommendations
found their way into the reporting of surgical RCTs. However, compared to the
benchmark RCTs with the highest reporting quality, the reporting according to
CONSORT criteria was still significantly worse in both primary surgical RCTs
and subgroup studies of surgical RCT reports [1].
PHA violations in the
medical literature
Some
important violations reported in the literature raised awareness of the issue
of neglecting PHA testing [16–18]. The PHA testing was also systematically
assessed in cancer sciences, where time-to-event analyses are most commonly
used [11, 18, 19]. It has been shown that non-proportional hazards are not
unusual in RCTs, a fact that was confirmed by the findings of our study group
[11, 12, 20].
Several predisposing
factors for PHA violation have been proposed. In drug trials, after a drug
intervention is stopped, diverging curves start converging due to the short
biochemical effects of the drug. Vice versa, in immunotherapy, a delayed
treatment effect has been observed as the biological explanation for a PHA
violation [21]. Non-survival endpoints have also been identified as a risk
factor for PHA violation [12]. In three surgical drug trials, the intervention
was stopped early after randomisation. Altogether, the current state of the
surgical literature regarding PHA testing and reporting, similar to cancer
science, exhibits significant shortcomings. Despite progress in establishing
standards in some surgical journals, methodological reporting remains
insufficient.
Scale of the problem
in the surgical literature
In general,
researchers aim for high-ranked journals according to the impact factor for the
publication of their studies. The chance of an article being accepted is higher
if relevant results are concisely reported. However, the quality of peer reviewing
is still a “black box”, and the
competence of reviewers is not methodically analysed. High-ranked journals may have
a better-quality reviewing process and use more sophisticated statistical
evaluation techniques [22, 23].
The
requirement alone to implement a systematic statistical reviewing process for
each eligible submission could increase the quality of surgical literature. The
review process should be even more rigorous for RCTs because they often
directly lead to the implementation of the results in clinical practice. RCTs
generally ensure well-balanced groups regarding baseline characteristics if the
sample size is large and narrow eligibility criteria are constant throughout
the inclusion period. Smaller trials are prone to differences in baseline
characteristics between the trial arms and benefit from stratification and
minimisation to achieve balance. This will inherently increase the chance that
hazards are proportional over time. However, this might not be true for all randomisation
strategies. If for example block randomisation is used, despite having a
balanced sample size, a risk exists of allocation or selection bias if the
study groups are unmasked because the allocation of participants might be
predictable (e.g. one group might contain more secondary diseases) [24]. Further,
RCTs are most often guided by epidemiologists or trial statisticians, ensuring high
reporting quality and statistical planning and strategy, as well as in the
execution of a study.
For this
study, only RCTs published in top-ranked surgical journals were included, presumably
representing the highest methodological standards as well as the highest
reporting quality in the field. By including only RCTs, we assessed the study
design with the lowest risk for violation of the PHA. Still, relevant shortcomings
in reporting and violations of the PHA were identified. In benchmark RCTs where
the reporting quality was best, non-proportionality was identified in 7.5% of
all studies. This led to an alternative non-parametric analysis in 4% of all
benchmark studies. In our previously published study, original data of surgical
RCTs, where non-proportionality was expected, was requested by CK. Eventually,
in one of the 25 surgical RCTs, not only was a violation of the PHA documented
but the initially reported significant primary endpoint turned out to be
non-significant in a non-parametric analysis [17]. Such dramatic consequences might
be rare but have the potential to negatively affect medical practice, influence
future research, and flaw literature reviews and meta-analyses.
This study most
likely describes only the tip of the iceberg. Violation of the PHA might be
even more relevant in studies with more vulnerable designs and published in
journals with a less sophisticated reviewing process [13, 17].
A crucial
question remains: Does “not reported” mean “not
done” or “not reported but done”? In benchmark trials, the primary outcome was not
affected if PHA testing was not reported or even if a violation was suspected
based on the digitised data. Hence, PHA testing was likely conducted but not
reported in these trials. In the surgical literature, we must consider the
first scenario (“not done”) to sometimes be true since three studies with a
change in the outcome direction were identified.
Limitations
Some
limitations require attention. When using a literature review as the method of
choice, its weaknesses may include the potential for misinterpretation and
underdevelopment. First, we have not reconstructed the data or contacted the
authors to inquire about PHA testing. Second, we may not have covered all
literature and sample sizes because this was subject to the authors’ selection
during the screening process. Finally, the score we developed has not been
externally validated.
Conclusion
This study demonstrates
that statistical reporting and adherence to the CONSORT reporting guidelines are
poor in secondary analyses of surgical RCTs. Adherence to statistical reporting
guidelines and a comprehensive statistical review process might help improve
reporting quality to confine the misapplication of statistical models.
Christoph Kuemmerli
University
Center for Gastrointestinal and Liver Disorder
Clarunis
Kleinriehenstrasse 30
CH-4058 Basel
christoph.kuemmerli[at]clarunis.ch
References
1.Schulz KF, Altman DG, Moher D; CONSORT Group. CONSORT 2010 Statement: updated guidelines
for reporting parallel group randomised trials. Trials. 2010 Mar;11(1):32. doi: https://doi.org/10.1186/1745-6215-11-32
2.Andersen PK. Survival analysis 1982-1991: the second decade of the proportional hazards
regression model. Stat Med. 1991 Dec;10(12):1931–41. doi: https://doi.org/10.1002/sim.4780101208
3.Mantel N. Evaluation of survival data and two new rank order statistics arising in
its consideration. Cancer Chemother Rep. 1966 Mar;50(3):163–70.
4.Stensrud MJ, Hernán MA. Why Test for Proportional Hazards? JAMA. 2020 Apr;323(14):1401–2.
doi: https://doi.org/10.1001/jama.2020.1267
5.Li H, Han D, Hou Y, Chen H, Chen Z. Statistical inference methods for two crossing
survival curves: a comparison of methods. PLoS One. 2015 Jan;10(1):e0116774. doi: https://doi.org/10.1371/journal.pone.0116774
6.Counsell CE, Clarke MJ, Slattery J, Sandercock PA. The miracle of DICE therapy for
acute stroke: fact or fictional product of subgroup analysis? BMJ. 1994 Dec;309(6970):1677–81.
doi: https://doi.org/10.1136/bmj.309.6970.1677
7.Brookes ST, Whitley E, Peters TJ, Mulheran PA, Egger M, Davey Smith G. Subgroup analyses
in randomised controlled trials: quantifying the risks of false-positives and false-negatives.
Health Technol Assess. 2001;5(33):1–56. doi: https://doi.org/10.3310/hta5330
8.Stubenrouch FE, Cohen ES, Bossuyt PM, Koelemay MJ, van der Vet PC, Ubbink DT. Systematic
review of reporting benefits and harms of surgical interventions in randomized clinical
trials. BJS Open. 2020 Apr;4(2):171–81. doi: https://doi.org/10.1002/bjs5.50240
9.Speich B, Mc Cord KA, Agarwal A, Gloy V, Gryaznov D, Moffa G, et al. Reporting Quality
of Journal Abstracts for Surgical Randomized Controlled Trials Before and After the
Implementation of the CONSORT Extension for Abstracts. World J Surg. 2019 Oct;43(10):2371–8.
doi: https://doi.org/10.1007/s00268-019-05064-1
10.Limb C, White A, Fielding A, Lunt A, Borrelli MR, Alsafi Z, et al. Compliance of Randomized
Controlled Trials Published in General Surgical Journals With the CONSORT 2010 Statement.
Ann Surg. 2019 Mar;269(3):e25–7. doi: https://doi.org/10.1097/SLA.0000000000002630
11.Rulli E, Ghilotti F, Biagioli E, Porcu L, Marabese M, D’Incalci M, et al. Assessment
of proportional hazard assumption in aggregate data: a systematic review on statistical
methodology in clinical trials using time-to-event endpoint. Br J Cancer. 2018 Dec;119(12):1456–63.
doi: https://doi.org/10.1038/s41416-018-0302-8
12.Rahman R, Fell G, Trippa L, Alexander BM. Violations of the proportional hazards assumption
in randomized phase III oncology clinical trials. J Clin Oncol. 2018;36(15 suppl):2543.
doi: https://doi.org/10.1200/JCO.2018.36.15_suppl.2543
13.Kuemmerli C, Sparn M, Birrer DL, Müller PC, Meuli L. Prevalence and consequences of
non-proportional hazards in surgical randomized controlled trials. Br J Surg. 2021 Jul;108(7):e247–8.
doi: https://doi.org/10.1093/bjs/znab110
14.Moher D, Liberati A, Tetzlaff J, Altman DG; PRISMA Group. Preferred reporting items
for systematic reviews and meta-analyses: the PRISMA statement. PLoS Med. 2009 Jul;6(7):e1000097.
doi: https://doi.org/10.1371/journal.pmed.1000097
15.Mok TS, Wu YL, Thongprasert S, Yang CH, Chu DT, Saijo N, et al. Gefitinib or carboplatin-paclitaxel
in pulmonary adenocarcinoma. N Engl J Med. 2009 Sep;361(10):947–57. doi: https://doi.org/10.1056/NEJMoa0810699
16.Greenhalgh RM, Brown LC, Powell JT, Thompson SG, Epstein D, Sculpher MJ; United Kingdom
EVAR Trial Investigators. Endovascular versus open repair of abdominal aortic aneurysm.
N Engl J Med. 2010 May;362(20):1863–71. doi: https://doi.org/10.1056/NEJMoa0909305
17.Meuli L, Kuemmerli C. The Hazard of Non-proportional Hazards in Time to Event Analysis.
Eur J Vasc Endovasc Surg. 2021 Sep;62(3):495–8. doi: https://doi.org/10.1016/j.ejvs.2021.05.036
18.Chai-Adisaksopha C, Iorio A, Hillis C, Lim W, Crowther M. A systematic review of using
and reporting survival analyses in acute lymphoblastic leukemia literature. BMC Hematol.
2016 Jun;16(1):17. doi: https://doi.org/10.1186/s12878-016-0055-7
19.Lapointe-Shaw L, Bouck Z, Howell NA, Lange T, Orchanian-Cheff A, Austin PC, et al. Mediation
analysis with a time-to-event outcome: a review of use and reporting in healthcare
research. BMC Med Res Methodol. 2018 Oct;18(1):118. doi: https://doi.org/10.1186/s12874-018-0578-7
20.Trinquart L, Jacot J, Conner SC, Porcher R. Comparison of Treatment Effects Measured
by the Hazard Ratio and by the Ratio of Restricted Mean Survival Times in Oncology
Randomized Controlled Trials. J Clin Oncol. 2016 May;34(15):1813–9. doi: https://doi.org/10.1200/JCO.2015.64.2488
21.Alexander BM, Schoenfeld JD, Trippa L. Hazards of Hazard Ratios - Deviations from
Model Assumptions in Immunotherapy. N Engl J Med. 2018 Mar;378(12):1158–9. doi: https://doi.org/10.1056/NEJMc1716612
22.Saha S, Saint S, Christakis DA. Impact factor: a valid measure of journal quality? J
Med Libr Assoc. 2003 Jan;91(1):42–6.
23.Davis CH, Bass BL, Behrns KE, Lillemoe KD, Garden OJ, Roh MS, et al. Reviewing the
review: a qualitative assessment of the peer review process in surgical journals.
Res Integr Peer Rev. 2018 May;3(1):4. doi: https://doi.org/10.1186/s41073-018-0048-0
24.Efird J. Blocked randomization with randomly selected block sizes. Int J Environ Res
Public Health. 2011 Jan;8(1):15–20. doi: https://doi.org/10.3390/ijerph8010015
Appendix
The appendix is available in the pdf version of the article at https://doi.org/10.57187/s.4022.