Participation in organised sports and longitudinal development of physical activity
in Swiss youth: the population-based SOPHYA cohort
DOI: https://doi.org/https://doi.org/10.57187/s.3778
Johanna Hänggiabc,
Gianfranco Lovisonab,
Ayoung Jeongab,
Emmanuel Schaffnerab,
Emil Njihuisab,
Fabian Studerd,
Wolfgang Taubec,
Bengt Kaysere,
Suzanne L. Suggsf,
Bettina Bringolf-Islerab*,
Nicole Probst-Henschab*
a Swiss Tropical and Public Health Institute,
Allschwil, Switzerland
b University of Basel, Basel, Switzerland
c Movement and Sports Science, Department of
Neurosciences and Movement Sciences, University of Fribourg, Fribourg, Switzerland
d Swiss Federal Institute of Sport SFISM, Magglingen,
Switzerland
e Institute of Sport Sciences, University of
Lausanne, Lausanne, Switzerland
f Institute for Public Health and Institute of
Communication and Public Policy, Università della Svizzera Italiana, Lugano, Switzerland
* These authors contributed equally as senior
authors
Summary
BACKGROUND: Maintaining physical activity throughout
life is crucial for overall health and wellbeing. Yet the
age-related decline in average physical activity, a natural phenomenon also observed
in animals, poses a challenge. This study aimed to investigate
whether participation in organised sports supported by the Swiss Youth+Sports (Y+S)
programme is associated with sustaining or enhancing physical activity among children
and adolescents during 5 years of follow-up.
METHODS: The longitudinal study was nested in
the population-based SOPHYA (Swiss
children’s Objectively measured PHYsical Activity) cohort. Participants aged 6–16 years at SOPHYA1 (2014) with complete
accelerometer data from baseline and follow-up assessment (SOPHYA2, 2019) were included.
The primary exposure was participation in organised sport during the follow-up period,
calculated by linkage with the Y+S database as the number of days with at least
one activity in Y+S-offered programmes for ages 5 to 20 years. The primary outcome
was the categorisation of participants into physical activity “improvers” or “worseners”.
Improvers in the respective physical activity categories – total activity counts
per minute (CPM), minutes in moderate-to-vigorous activity (MVPA), minutes in light
activity (LPA) and minutes in sedentary behaviour (SB) – increased or maintained
their active physical activity during the 5 follow-up years. Information on confounders
and effect modifiers (sex, age, body mass index (BMI), language region, household
income, education) was obtained by self-report at baseline. Logistic regressions
examined the relationship between organised sport participation and the probability
of being a physical activity improver in each physical activity intensity category
separately. Covariates for the final models were selected through a stepwise procedure
based on the Bayesian information criterion from a maximal model containing all
covariates as well as all two-way interactions with organised sport and between
them. All models were a priori adjusted for technical variables (season of measurement;
wear time; duration of follow-up).
RESULTS: The analysis included 432 participants.
There was a strong CPM, MVPA and LPA decline from 2014 to 2019, but an increase
in SB. Nevertheless, the prevalence of improvers was 22.5% for CPM, 9.5% for MVPA,
26.9% for LPA and 9.7% for SB. Engagement in organised sport between 2014 and 2019
was positively associated with CPM, MVPA and SB, but not with LPA improver status.
For 30 additional days of participation in organised sport over the five years of
the study, the odds of being an improver vs being a worsener increased by 4.0% for
CPM (95% CI: 0.13–7.69), 6.2% for MVPA (95% CI: 0.82–11.54) and 6.0% for SB (95%
CI:−1.49–13.97).
CONCLUSION: The results provide supporting evidence
that organised sport in the context of the Swiss Y+S programme may empower the young
to maintain an active lifestyle and even offset the age-related decline in physical
activity.
Abbreviations
- CPM:
-
Mean counts per minute per day
- LPA:
-
Minutes in light physical activity per
day
- MVPA:
-
Minutes in moderate-to-vigorous activity
per day
- PA:
-
Physical activity
- SB:
-
Minutes in sedentary behaviour per day
- SOPHYA:
-
Swiss children’s Objectively measured PHYsical
Activity (study)
- Y+S:
-
Youth and Sports (the Swiss Federal Government’s
national sports promotion programme)
Introduction
Physical activity (PA) is crucial in maintaining
overall health and well-being throughout the lifespan [1, 2]. Regular engagement
in physical activity in children, adolescents and adults has been consistently associated
with broad health benefits, including reduced risk of chronic diseases [3], improved
mental health [4, 5], enhanced quality of life and improved cognitive function,
including academic achievement [6–8]. Promoting and sustaining physical activity
behaviour in the young is therefore a public health priority. However, one of the
most consistent findings of physical activity research
is that individuals, and youth in particular, tend to become less physically active
as they age [9–12]. Accordingly, the age-related decline in average physical activity,
although a natural phenomenon also observed in animals [13], poses a challenge for
the attainment of physical activity and health promotion goals.
The transitions
from childhood to adolescence [14] and from adolescence to young adulthood are critical
periods for establishing lifestyle behaviours [15]. A first relevant research question
is whether a child who is physically active at a higher than average level remains
comparatively more active throughout adolescence and adulthood. The concept of “tracking”
relates to the persistence of physical activity behaviour over time, and therefore
to the longitudinal stability of a particular behaviour or the maintenance of an
individual’s relative rank within a cohort [16]. Tracking studies investigating
the age-related or longitudinal development of physical activity used various approaches:
(a) estimating inter-age correlations and reporting tracking coefficients [17–20],
(b) assessing the likelihood of maintaining the percentile rank of physical activity
over time within a peer group of the same age and sex [21–23] or (c) employing group-based
trajectory modelling as a statistical method to identify subgroups of individuals
with higher or lower declines of physical activity over time [24, 25]. Longitudinal
studies that assessed tracking of device-based physical activity, with measurement
intervals ranging from 2 to 6 years, have in general reported low to moderate stability
of physical activity [18, 26, 27].
A second
relevant research question is which modifiable factors play a role in preventing
age-related activity loss. While the commonly observed age-related decline in physical
activity behaviour is rooted in biological changes while growing up [28], modifiable
factors (e.g. psychological, cognitive, emotional, behavioural, social and environmental)
also play a role in attenuating or accelerating this decline [29]. Organised sports
participation has emerged as a potentially important modifiable factor for mitigating
the age-related physical activity decline. Participation in organised sport was
positively associated with higher physical activity levels in both cross-sectional
[31, 32] and longitudinal studies [33, 34]. Organised sport could provide structured
and social environments that support and facilitate ongoing motivation and skills
acquisition. Notably, the acquisition of motor skills through participation in organised
sport was found to be associated with the maintenance of physical activity levels
[33].
Tracking
studies published to date, including those studying modifiable factors, investigated
the longitudinal change of physical activity relative to peers of the same age and
sex. They do not reveal the absolute within-subject physical activity changes over
time. In these previous studies, the absolute within-person changes could be small
or even negative despite the presence of moderate physical activity tracking [18].
There is limited knowledge regarding groups of young individuals who successfully
avoid an absolute decrease in physical activity as they grow up. Only two group-based
trajectory modelling studies, with one accelerometry-based, pointed to the presence
of individuals who maintained or increased their physical activity behaviour while
growing up [24, 35].
The
present study aimed to identify and characterise children and adolescents who improved
or maintained their absolute physical activity level in different intensity categories
and thus resisted the age-related decline in active physical activity. In particular,
we investigated whether participation in Youth and
Sport-supported
organised sport was associated with maintenance or improvement in the absolute,
accelerometer-assessed within-participant level of active physical activity. Youth
and Sport (Y+S) is the Swiss Federal Government’s national sports
promotion programme. SOPHYA
(Swiss children’s Objectively measured PHYsical Activity)
[36], the first population-based cohort in Switzerland assessing physical activity
in youth by accelerometery, provided the opportunity to investigate physical activity
development in children and adolescents over a 5-year follow-up period and relate
it to Y+S-supported organised sport participation.
Methods
Study population and procedure
The SOPHYA cohort study recruited participants
based on data from the national population registry. All children born in Switzerland
between 1998 and 2007 and registered accordingly were eligible, with no children
excluded. A stratified random sampling procedure was applied, dividing the population
into 10 equivalent strata, each representing a birth year, to ensure balanced age
groups. The recruitment process and participation rate of SOPHYA1 have been previously
documented [37]. Briefly, of 4193 participants included in the stratified random
sample, 3108 participated in the baseline interview. Of 3108 participants, 2341
expressed an interest in the accelerometry substudy, of whom only 2032 were later
reachable and completed the SOPHYA1 baseline interview in 2014. Of these 2032 participants,
1320 provided valid baseline accelerometer data. Of those 1320 participants, 1111
had complete data for all covariates and expressed their willingness to be recontacted
and were invited for a repeat assessment after five years (SOPHYA2). Out of these
1111 children,
524 agreed to accelerometry in SOPHYA2.
The participation rate of those approached for
accelerometer measurements in SOPHYA1 was 65% (1320 of 2032). Of those who participated
in accelerometer measurements in SOPHYA1, the participation rate for follow-up accelerometer
measurements (SOPHYA2) was 47% (524 of 1111). A participant flowchart of SOPHYA1
and SOPHYA2 measurements is shown in figure 1.
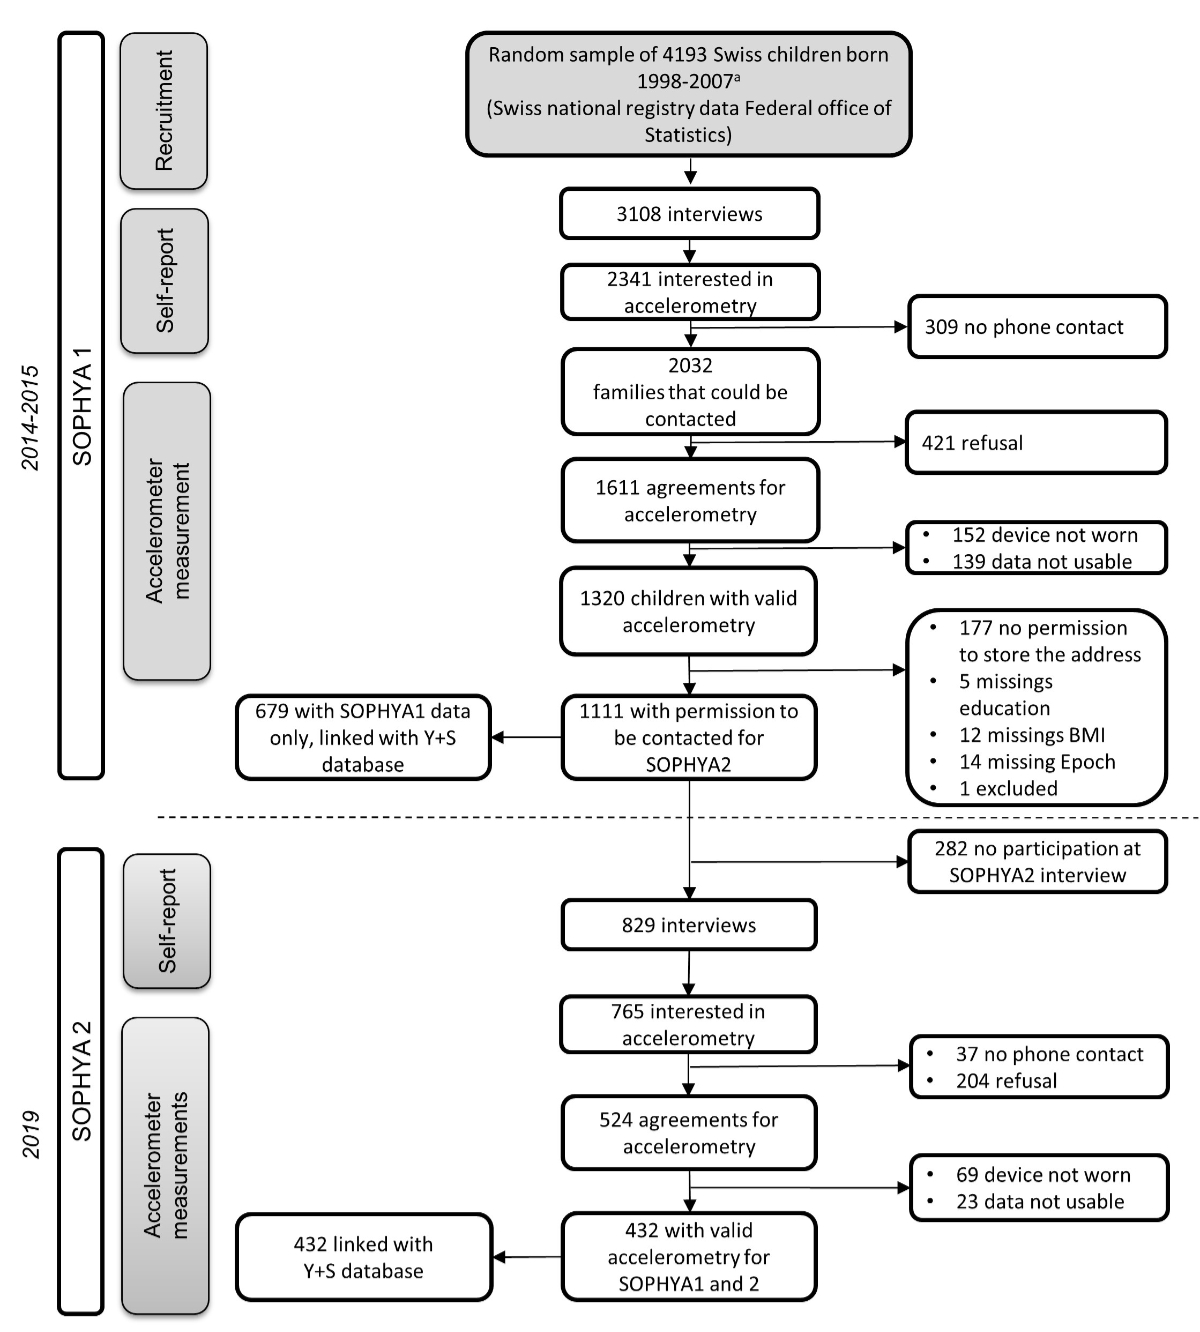
Figure 1Participant flowcharts for SOPHYA1 and
SOPHYA2. Children were recruited for the SOPHYA study through two distinct sources.
Children born in 1998 to 2002 were recruited through the established Sport Switzerland
study [39]. Children born between 2003 and 2007 were recruited by the SOPHYA study
through a similar but notably shorter interview process.
At both measurement time points, contact with
participants was exclusively remote, by phone and post, as participants lived in
different parts of Switzerland.
As a first step in both SOPHYA waves, a telephone
interview about sports behaviour and sociodemographic factors was conducted [38,
39]. The professional research institute LINK conducted the interviews. At the end
of the interview, the participants were asked if they were interested in taking
part in an accelerometry substudy as a second step.
As a second step in both SOPHYA waves, trained
fieldworkers of the SOPHYA team contacted participants interested in the accelerometer
assessment. Consenting participants received accelerometers, questionnaires and
study instructions by post. They wore accelerometers for 1 week and filled in a
paper-based questionnaire that included a diary for the measurement week and questions
to self-report height and weight for deriving body mass index (BMI). To cover all
seasons and because physical activity measurements by accelerometry
are time-consuming, data collection for SOPHYA1 and SOPHYA2 lasted more than one
year.
The SOPHYA study was conducted in three languages
as a collaboration between the Swiss Tropical and Public Health Institute (Swiss
TPH) in Basel, the lead partner responsible for the German- and Romansh-speaking
study regions; the University of Lausanne, responsible for the French-speaking study
region; and the Università della Svizzera Italiana (USI), responsible for the Italian-speaking
study region.
For SOPHYA1,
written informed consent was obtained from a parent for a child’s participation.
Adolescents aged 12 years or older filled in an additional consent form. In SOPHYA2,
for participants younger than 14 years, written informed consent was obtain by a
parent as a proxy; for participants aged between 14 and 18 years, both one parent
and the participant provided written informed consent; for participants aged
over 18 years, only their written informed consent was sought. The local ethics review
board of the Canton of Basel and Northwestern and Central
Switzerland, EKNZ (www.eknz.ch), approved this study (Project-IDs: 147/13; EKNZ
2018-01786 and 2018-00549). The study complied with the latest Helsinki Declaration.
An open science protocol for this study was
not developed and registered. In line with the ethical approval of SOPHYA, the datasets
generated and analysed during the current study are not publicly available, but
are available from the corresponding author upon reasonable request.
Device-based measured physical activity and sedentary
behaviour
A pre-programmed accelerometer and several questionnaires,
including a time activity diary, were sent to participants by post and returned
after the measurement week using a prepaid envelope. Instructions for accelerometer
use were included in the mailing and supplemented by instructions over the phone
by trained SOPHYA fieldworkers. All participants wore an Actigraph (ActiGraph, Pensacola,
Florida, USA) accelerometer model GT1M or GT3X for seven consecutive days
attached to their right hip with an elastic band (of 1320 participants in SOPHYA1,
49 wore a GT1M and 1271 wore a GT3X; of 432 participants in SOPHYA2, 14 wore a GT1M
and 418 wore a GT3X. The
GT1M only measures along the vertical axis, the GT3X along all three. Since the
vertical axis output is compatible between the two devices [41], only the vertical
axis was considered. The accelerometers had to be removed for water activities and
during sleeping hours. The initialisation of the devices, data transfer and analyses
were conducted using ActiLife 6.2 software (ActiGraph, Pensacola, Florida, USA).
Epoch length was set at 15 s, and non-wearing time was defined as 60 min of consecutive
0 counts. A measurement was considered valid if participants had at least three
weekdays with a daily minimum of 10 hours of wear time and at least one weekend
day with a daily minimum of 8 hours. Mean daily minutes in moderate-to-vigorous
physical activity (MVPA), light physical activity (LPA), sedentary behaviour (SB)
and daily mean of counts per minute (CPM) during the measurement week were calculated
as follows: First, mean minutes and mean counts per minute were averaged separately
over the weekdays and the weekend days with measurements. Second, the weekday-averaged
mean minutes and mean counts per minute were multiplied by five. Third, the weekend-averaged
mean minutes and mean counts per minute were multiplied by two. Fourth, the results
from step two and three were summed and then divided by seven to obtain week- and
weekend-weighted mean minutes and mean counts per minute.
For the definition of sedentary behaviour, the
cut-off of 100 CPM was used [42]. MVPA was defined by the age-dependent cut-offs
defined by Freedson et al. 2005 [43] with thresholds for moderate activity at 4
metabolic equivalents (METs) [44]. LPA was defined as activity above the sedentary
cut-off of 100 CPM and below the cut-off for moderate activity. To permit comparison
of participants aged over 18 during SOPHYA2, cut-off points by Freedson et al. 2005
[43] for 18-year-olds were used.
Participation in organised sport
Y+S widely supports sports courses and camps
for children and young people aged 5–20 with a budget of approximately CHF 100 million
per year covering 90 different sports and disciplines and serving more than 600,000
participants per year [45]. Y+S supports sports clubs financially by providing contributions
per participant and activity, if the coaches have completed a Y+S education. Activities
supported by Y+S are various sports clubs, voluntary school sports and scouts and
include training, competition and camp days.
Every single sports activity of a child or adolescent
financially supported by Y+S is registered in the national Y+S database. The proportion
of Y+S-supported organised sport in the total number of sports offerings in organised
sport is not known. As approximately 65% of the total Swiss population of children
aged 12–13 take part in Y+S, the coverage of Y+S can be assumed to be quite high
[45]. Therefore the continuous data on the frequency and regularity of participation
in organised sport supported by Y+S and provided by the Y+S database, can be considered
a good predictor of participation in organised sport. Based on the approval of a
formal linkage request to Y+S, Y+S attendance entries between January 2008 and July
2020 were extracted and could be linked to 1111 SOPHYA1 accelerometry participants.
SOPHYA participants’ name, address and date of birth were used for linkage with
the Y+S database. Personal information was consistently separated from SOPHYA data
and information on organised sport by using a unique anonymised user ID for matching
records. The linkage was not validated. Participants who were not found in the Y+S
database were considered non-participants in organised sport.
Measures
Primary outcome
The primary outcome was the categorisation of each participant
as an “improver” or “worsener”’ for each physical activity intensity category. To
determine this outcome, we calculated the difference in physical activity
as PASOPHYA2 − PASOPHYA1 for each individual and for each
physical activity intensity category, namely MVPA, LPA, SB and CPM. A difference
with a non-negative sign reflects improvement or maintenance of physical activity
in the MVPA, LPA and CPM categories, while improvement or maintenance of SB is reflected
by a non-positive difference. Accordingly, these differences were used to create
physical activity intensity-specific binary variables of “improvers” and “worseners”.
While “improvers” in MVPA, LPA or CPM increased or maintained their minutes from
SOPHYA1 to SOPHYA2, “improvers” in SB maintained or decreased their minutes sitting
during follow-up. Thus, an “improver” is anyone who maintained or improved active
behaviour.
Main exposure
The primary
exposure was participation in Y+S-supported organised sport during the follow-up period.
We calculated the number of days with at
least one organised sport activity while participants were within the Y+S sports
age (5 to 20 years). We restricted the total number of days to the period 2014–2019
to represent participation in Y+S during the follow-up period from SOPHYA1 to SOPHYA2.
For 14 participants aged over 20 in 2019 and therefore no longer eligible to participate
in Y+S, we assigned 0 days in Y+S to their follow-up time spent at the non-eligible
age, thus ignoring any time actually spent in organised sport. Participants without
a match in the Y+S database were assigned 0 days with at least one activity in organised
sport.
Covariates
A set of covariates, selected a priori, were
investigated as confounders or effect modifiers:
- Sociodemographic characteristics
at baseline in SOPHYA1: Age (years), sex (male; female),
parental education (up to secondary level; tertiary education), household income
(CHF <9000; CHF ≥9000; no information provided) and residential language region (German
including Romansh; French; Italian).
- BMI at baseline in SOPHYA1: Participants self-reported their height and weight through the paper-based
survey at baseline. For the sensitivity analysis, BMI-for-age percentiles were calculated
from the BMI percentile curves updated by Cole and Lobstein et al. 2012 [40].
- Technical variables at the time
point of accelerometry: Season of measurement (spring,
summer, autumn, winter) for SOPHYA1 and SOPHYA2; accelerometer wear time (minutes,
continuous) for SOPHYA1 and SOPHYA2; measurement interval between SOPHYA1 and SOPHYA2
(years, continuous).
Statistical analysis
For all analyses, Stata 16.1 and R 4.3.3.
were used.
Participants included in the analysis were required
to have consent and complete accelerometer data for both measurement time points;
for the a priori selected covariates
at SOPHYA1: age, sex, parental education, household income, residential language
region, BMI percentiles (continuous); and for the technical variables for both measurement
points (season of measurement; accelerometer wear time; follow-up duration).
One participant was excluded from the analysis
due to suspiciously high accelerometer data. If the BMI of a participant was missing
at SOPHYA1 (n = 8), it was imputed by regressing it on the BMI value available from
SOPHYA2 while adjusting for age, sex and time interval between the two time points.
We used logistic
regression models to examine the association between the
primary predictor participation in organised sport (total number of days between
2014 and 2019) and the binary outcome (improvers versus worseners). Separate models
were run for each
of the four binary outcome variables (SB, LPA, MVPA and CPM). Results are reported
as estimated coefficients and 95% confidence intervals
(CIs) on the logit scale.
Separately for each outcome, the final model
used in the analysis was chosen through a model-selection procedure, searching for
the smallest Bayesian information criterion (BIC) between a maximal and a minimal
model. The maximal model contained the main effects of the technical variables (season
[spring, summer, autumn, winter], accelerometer wear time [continuous] and measurement
interval [continuous]), the main effects of the covariates of interest (baseline
physical activity, age, sex, parental education, household income, residential language
region) and all two-way interactions among covariates of interest, in order to account
for possible effect modification. The minimal model contained all the main effects
of the technical variables regardless of their statistical significance. The
set of main effects and interactions included in the final model was selected using
BIC as a criterion. To visualise the main associations of
interest, we used marginal plots to show the association between participating in
organised sport and being an improver.
A sensitivity analysis was performed to investigate
the role of BMI as a potential confounder or effect modifier in the association
between participating in organised sport and being a physical activity improver.
The four final models were fitted again, including BMI percentiles as an additional
adjusting covariate, and the changes in the coefficients of the other covariates
were inspected.
We investigated the possible presence of attrition bias, i.e. the possibility
that those who dropped out, and participated in SOPHYA 1 but not in SOPHYA2 and
in this current analysis, differed substantially in some of the covariates used
in our models from those who participated on both occasions and therefore contributed
to the estimation of such models, so potentially biasing our conclusions. Out of
the 1111 children with valid measurements and covariates of SOPHYA1 who gave consent
to be contacted again for SOPHYA2, 679 children participated in SOPHYA1 but were
lost to follow-up, and 432 children participated in SOPHYA1 and SOPHYA2 and had
valid data (figure 1).
To check whether any of the covariates included
in our models were strong predictors of non-participation, we implemented a logistic
model with “Non-participation in SOPHYA2” as a binary response (1 = non-participation
in SOPHYA2 [n = 679]; 0 = participation in both SOPHYA1 and SOPHYA2 [n = 432]) and
all the variables used in our analysis as covariates. In particular, the final model
was selected by a bi-directional (both backward and forward) stepwise procedure,
using BIC as the selection criterion, which sought the best model between a minimal
model without interactions containing only main effects (age, sex, parental education,
household income, residential language region, physical activity in all intensity
categories at SOPHYA1, organised sport participation and the technical variables
season of measurement and accelerometer wear time at SOPHYA1) and a maximal model
containing the same main effects plus all two-way interactions between them.
Results
The analysis
included 432 participants with valid longitudinal physical activity and organised
sport participation data and valid covariate information from the baseline assessment
(figure 1). Among the 432 participants, successful linkage with the Y+S database
was found for 275 (64%) participants, whereas 157 (36%) non-linked participants
were assumed to have never participated in Y+S.
In the sample
of 432 participants (aged 6–16 at SOPHYA1), when looking at physical activity intensity
categories descriptively, mean daily CPM decreased between 2014 and 2019 from 574.4
(standard deviation [SD] 181.7) to 450.5 (SD 161.8); mean daily minutes in MVPA
from 84.9 (SD 37.7) minutes to 47.7 (SD 22.6) minutes; mean daily minutes in LPA
from 233.7 (SD 40.1) to 204.7 (SD 51.4). Mean daily minutes in SB increased from
473.8 (SD 86.5) to 580.2 (SD 80.7).
The prevalence of improvers and worseners for
the different physical activity intensity categories are descriptively described
in table 1: The prevalence of CPM improvers was descriptively higher (n = 97, 22.5%)
than the prevalence of MVPA improvers (n = 41, 9.5%) and SB improvers (a decrease
in SB from baseline to follow-up) (n = 42, 9.7%). Descriptively, the highest number
of improvers was found in LPA (n = 116, 26.9%).
Table 1Distribution of socioeconomic
factors at baseline across physical activity improver status in different
intensity categories (CPM, MVPA, LPA and SB).
|
CPM |
MVPA |
LPA |
SB |
| n = 432 |
n = 432 |
n = 432 |
n = 432 |
| Worseners |
Improvers |
Worseners |
Improvers |
Worseners |
Improvers |
Worseners |
Improvers |
| n
(%) |
n
(%) |
n
(%) |
n
(%) |
n
(%) |
n
(%) |
n
(%) |
n
(%) |
| All |
335 (77.5%) |
97 (22.5%) |
391 (90.5%) |
41 (9.5%) |
316 (73.2%) |
116 (26.8%) |
390 (90.3%) |
42 (9.7%) |
| Age |
Mean
(SD) |
9.7 (2.3) |
11.1 (3.0) |
9.7 (2.4) |
12.3 (2.6) |
9.9 (2.4) |
10.3 (3.0) |
9.7 (2.3) |
12.5 (3.1) |
| Sex |
Male
|
163 (78.0%) |
46 (22.0%) |
192 (91.9%) |
17 (8.1%) |
153 (73.2%) |
56 (26.8%) |
189 (90.4%) |
20 (9.6%) |
| Female |
172 (77.1%) |
51 (22.9%) |
199 (89.2%) |
24 (10.8%) |
163 (73.1%) |
60 (26.9%) |
201 (90.1%) |
22 (9.9%) |
| Household income |
CHF
<9000 |
161 (77.8%) |
46 (22.2%) |
187 (90.3%) |
20 (9.7%) |
147 (71.0%) |
60 (29.0%) |
185 (89.4%) |
22 (10.6%) |
| CHF ≥9000 |
140 (76.5%) |
43 (23.5%) |
166 (90.7%) |
17 (9.3%) |
139 (76.0%) |
44 (24.0%) |
166 (90.7%) |
17 (9.3%) |
| No
indication |
34 (81.0%) |
8 (19.0%) |
38 (90.5%) |
4 (9.5%) |
30 (73.4%) |
12 (28.6%) |
39 (92.9%) |
3 (7.1%) |
| Highest education of parents |
Secondary
level |
184 (80.7%) |
44 (19.3%) |
212 (93.0%) |
16 (7.0%) |
173 (75.9%) |
55 (24.1%) |
211 (92.5%) |
17 (7.5%) |
| Tertiary
education |
151 (74.0%) |
53 (26.0%) |
179 (87.7%) |
25 (12.3%) |
143 (70.1%) |
(61 (29.9%) |
179 (87.8%) |
25 (12.2%) |
| Language region |
German |
240 (79.5%) |
62 (20.5%) |
278 (92.0%) |
24 (8.0%) |
218 (72.2%) |
84 (27.8%) |
275 (91.1%) |
27 (8.9%) |
| French |
67 (72.8%) |
25 (27.2%) |
82 (89.1%) |
10 (10.9%) |
72 (78.3%) |
20 (21.7%) |
79 (85.9%) |
13 (14.1%) |
| Italian |
28 (73.7%) |
10 (26.3%) |
31 (81.6%) |
7 (18.4%) |
26 (68.4%) |
12 (31.6%) |
36 (94.7%) |
2 (5.3%) |
Table 1 also presents the distribution of improver/worsener
status according to socioeconomic characteristics descriptively. Improvers descriptively
had a higher age at baseline. Youth with a higher educational level descriptively
were more often improvers for CPM, MVPA and SB. Children and adolescents from French-
or Italian-speaking regions descriptively were more often improvers in CPM and MVPA
than youth from German-speaking regions.
Table S1 in the appendix shows the distribution
of socioeconomic factors and physical activity at baseline according to participation
in organised sport (no participation = no days in organised sport from 2014 to 2019;
participation = minimum 1 day in organised sport from 2014 to 2019).
Table 2 presents the descriptive averages of
total CPM or mean daily minutes in physical activity intensity categories, respectively,
in SOPHYA1 and SOPHYA2 as well as organised sport participation during follow-up
(number of days in organised sport from 2014 to 2019), stratified by improvers and
worseners in the respective intensity category (see appendix table S2 for the comprehensive
overview of averages of activities in all intensity categories according to improver
status based on all intensity categories). Descriptively, improvers exhibited less
favourable activity parameters at baseline in SOPHYA1 than worseners. Improvers
in CPM, MVPA and LPA descriptively had more organised sport activities during the
follow-up compared to worseners. In contrast, improvers in SB (i.e. less SB) descriptively
had slightly fewer organised sport activities than SB improvers.
Table 2Distribution of physical activity
intensity categories (SOPHYA1; SOPHYA2) and participation in organised sports
(SOPHYA1 to SOPHYA2), stratified by physical activity improver status.
|
CPM |
MVPA |
LPA |
SB |
| n = 432 |
n = 432 |
n = 432 |
n = 432 |
| Worseners |
Improvers |
Worseners |
Improvers |
Worseners |
Improvers |
Worseners |
Improvers |
| n =
335 |
n =
97 |
n =
391 |
n =
41 |
n =
316 |
n =
116 |
n =
390 |
n =
42 |
| Mean
counts per
minute (SD) |
Mean
minutes in moderate-to-vigorous
activity per day (SD) |
Mean
minutes in
light activity per day (SD) |
Mean
minutes in
sedentary behaviour per day (SD) |
| Mean
counts per
minute (CPM) or minutes of physical activity in the respective intensity category
(MVPA, LPA, SB) per day |
SOPHYA1 |
607.7
(179.3) |
459.4
(138.3) |
88.9
(36.9) |
46.4
(19.4) |
240.3
(38.4) |
215.5
(39.3) |
462.4
(79.3) |
580.4
(78.0) |
| SOPHYA2 |
418.9
(136.1) |
559.6
(194.1) |
47.0
(22.8) |
54.7
(19.0) |
187.4
(41.9) |
251.9
(45.0) |
586.0
(79.3) |
525.8
(73.6) |
|
Mean
days in organised sports* |
Mean
days in organised sports* |
Mean
days in organised sports* |
Mean
days in organised sports* |
| Mean
days in organised sports* |
SOPHYA1
– SOPHYA2 |
156.3
(207.2) |
189.8
(253.5) |
155.9
(207.6) |
239.3
(297.0) |
156.1
(209.7) |
185.0
(240.8) |
165.9
(212.6) |
144.5
(269.9) |
Table 3 presents the results of the physical
activity intensity-specific models for estimating the adjusted associations of days
engaging in organised sport from baseline to follow-up with the physical activity
improvements status. Given the model-selection procedure described in the “Statistical
analysis” section, the variables included in the model vary by physical activity
intensity category. Organised sport engagement was not found to interact with any
covariate in any of the models. The results of the separate models are summarised
in the paragraphs below and graphically in figures 2A–D (see supplementary
figures S1–S3 for a graphical summary of outcome model-specific statistically significant
interactions between covariates).
Table 3Adjusted associations of days
spent in organised sports with being an improver in mean counts per minute
(CPM), in moderate-to-vigorous activity (MVPA), in light physical activity
(LPA) and in sedentary behaviour (SB). All models were adjusted for season of
measurement, accelerometer wear time and measurement interval between SOPHYA1
and SOPHYA2. Additional covariates were retained in the model according to model-selection
procedures applied to each outcome separately, explaining differences between
the covariates included in the intensity-specific models.
| Log
odds (95% CI) of
being improver in: |
Mean counts per minute (CPM) |
Moderate-to-vigorous activity*(MVPA) |
Light activity*(LPA) |
Sedentary behaviour* (SB) |
| Intercept |
−4.56
(−11.48; 2.34) |
5.28
(−3.27; 14.23) |
1.66 (−3.44; 6.79) |
17.58
(5.75; 30.93) |
| Number
of days in organised sports** |
1.29 × 10⁻³ (0.04 × 10⁻³; 2.56 × 10⁻³) |
2.01 × 10⁻³ (0.27 × 10⁻³; 3.84 × 10⁻³ ) |
0.37 × 10⁻³ (0.74 × 10⁻³; 1.48 × 10⁻³) |
1.96 × 10⁻³ (−0.50 × 10⁻³; 4.65 × 10⁻³) |
| Age |
0.66
(0.26; 1.07) |
0.08
(−0.19; 0.36) |
−0.10 (−0.26; 0.05) |
−0.46
(−0.90; −0.05) |
| Sex |
Male
(ref.) |
|
|
|
|
| Female |
−0.80
(−1.38; −0.22) |
−0.71
(−1.60; 0.17) |
−0.25 (−0.75; 0.25) |
−11.36
(−18.09; −5.66) |
| Language
region |
German
(ref.) |
|
|
|
|
| French |
0.11
(−0.58; 0.78) |
−0.60
(−1.83; 0.52) |
−0.47 (−1.15; 0.18) |
−0.08
(−1.35; 1.14) |
| Italian |
−0.12
(−1.11; 0.80) |
0.88
(−0.44; 2.14) |
0.04 (−0.90; 0.494) |
−2.12
(−5.51; 0.41) |
| Household
income |
CHF <9000
(ref.) |
|
|
|
|
| CHF ≥9000
|
0.28
(−0.32; 0.88) |
0.28
(−0.62; 1.19) |
−0.32 (−0.86; 0.22) |
−0.86
(−2.32; 0.48) |
| No
indication |
0.14
(−0.90; 1.09) |
0.80
(−0.72; 2.18) |
−0.13 (−1.02; 0.70) |
−1.84
(−4.63; 0.52) |
| Parental
education |
Lower
education (ref.) |
|
|
|
|
| Higher
education |
0.59
(0.02; 1.17) |
0.86 (1.84 × 10⁻³; 1.75) |
0.51 (–0.47 × 10⁻³; 1.03) |
−0.08
(−1.67; 1.47) |
| Baseline
physical activity*** |
4.65 × 10⁻³ (–3.34 × 10⁻³; 0.01) |
−0.08
(−0.11; −0.05) |
−0.03 (−0.04; −0.02) |
0.04
(0.03; 0.06) |
| Age:
Baseline physical activity* |
–1.35 × 10⁻³ (–2.19 × 10⁻³; –0.52 × 10⁻³) |
– |
– |
– |
| Age:
Sex |
– |
– |
– |
0.78
(0.33; 1.30) |
| Sex:
Parental education |
– |
– |
– |
3.03
(0.74; 5.63) |
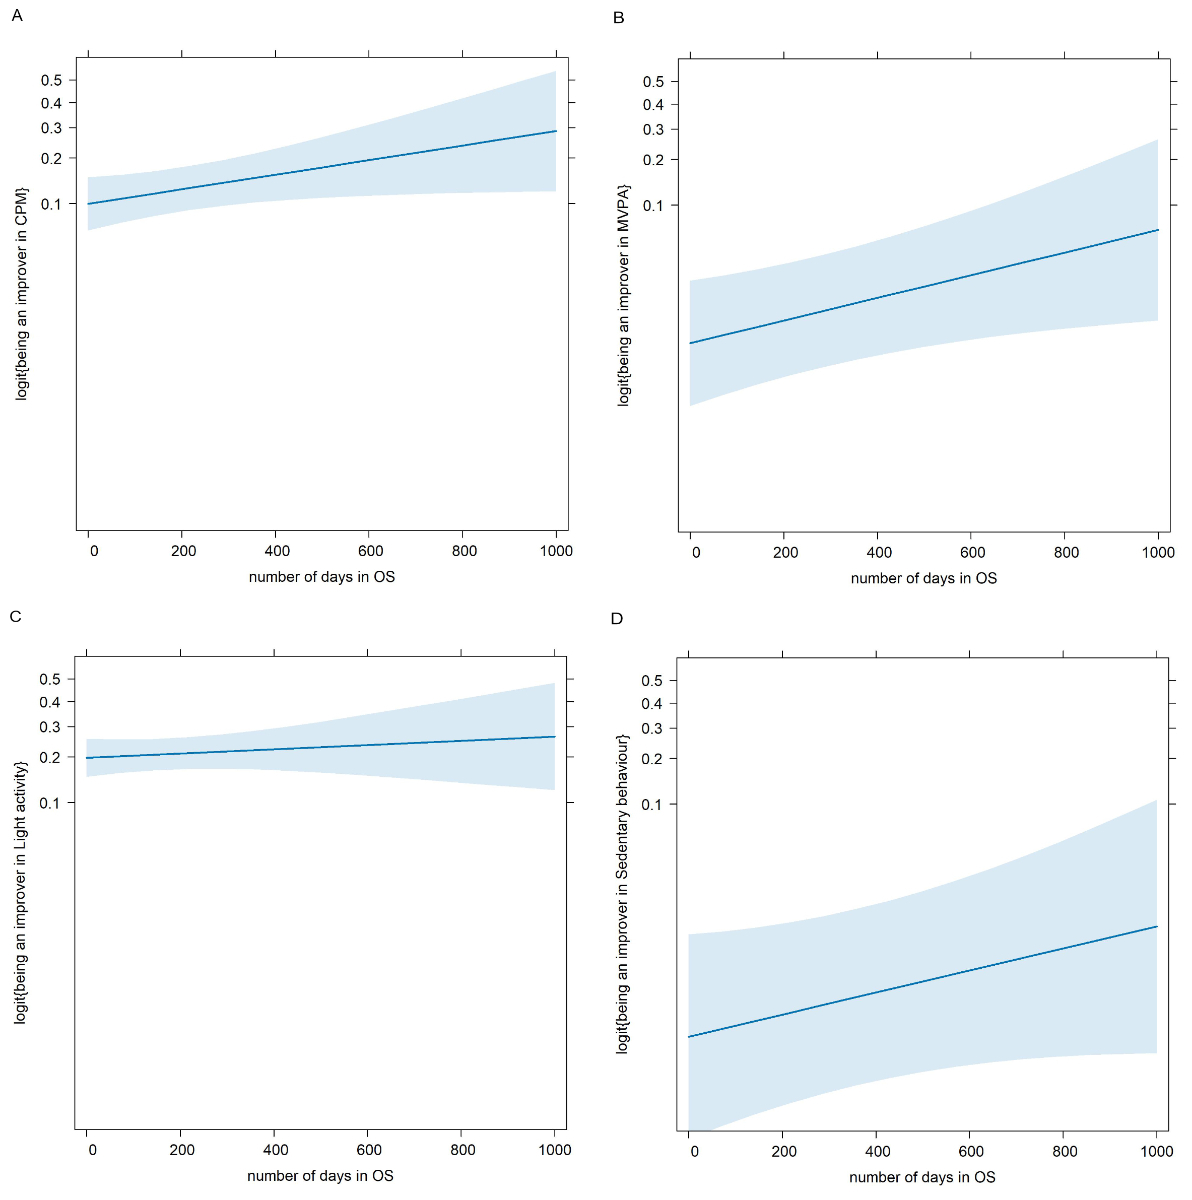
Figure 2Association of the number of days in
organised sports (OS) with the logit of the probability of being an improver in
(A) mean counts per minute (CPM) (B) moderate-to-vigorous activity
(MVPA), (C) light physical activity and (D) sedentary behaviour.
With regard to CPM, the number of days engaged in organised sport activities during follow-up
was positively and statistically significantly associated with being an improver
in CPM. This association suggests that, for 30 additional days of participation
in organised sport within the five years of the study, the odds of being an improver
vs being a worsener increased by a factor of exp(0.0013 × 30) =
1.0396, i.e. the odds of being an improver are about 4.0% greater than that of being
a worsener. Age and CPM at SOPHYA1, as well as their interaction were statistically
significantly associated with being an improver, in a positive direction for the
main effects and in a negative direction for the interaction term. The negative
coefficient for the interaction term suggests that the impact of baseline physical
activity on the odds of being an improver depends on age. For younger individuals,
higher baseline physical activity was associated with decreased odds of being an
improver, but with increasing age at baseline this inverse association became weaker.
Being female decreased the odds of being an improver vs being a worsener by a factor
of exp(−0.7962) = 0.4511, meaning for girls the odds of being an improver was
54.9% lower than for boys, independently of their participation in organised sport.
Individuals with parents having a tertiary education had approximately 80.3% higher
odds of achieving CPM improver status than individuals of parents with a lower education.
Household income and language region were not associated with CPM improver status.
With regard to MVPA, the number of days engaged in organised sport between 2014 and 2019
was also positively and statistically significantly associated with being an improver
in MVPA. For 30 additional days of participation in organised sport within the five
years of the study, the odds of being an MVPA improver vs a worsener increased by
a factor of exp(0.0020 × 30) = 1.0622, i.e. the odds of being an improver
vs a worsener increased by about 6.2%. Baseline MVPA was negatively associated with
being an improver in MVPA. The odds of being an MVPA improver vs a worsener decreased
by a factor of exp(−0.0774) = 0.9256. For each minute increase in baseline MVPA, the
odds
of being an MVPA improver vs a worsener decreased by about 7.4%. Contrary to CPM
endpoint, sex, age and parental education were not associated with being an improver
in MVPA. Consistent with CPM, household income and language region were not associated
with MVPA improver status.
With regard to LPA, the number of days engaged in organised sport during the five follow-up
years was not associated with improver status. Baseline LPA was negatively associated
with being an improver in LPA. The odds of being an LPA improver vs a worsener decreased
by a factor of exp(−0.0263) = 0.9741. This means that for every minute increase in
baseline
LPA, the odds of being an improver in LPA decrease by about 2.6%. Sex, parental
education, household income and language region did not show an association with
being an improver in LPA.
With regard to SB, the number of days engaged in organised sport during the five years
were associated with SB improver status, but not as strong as with CPM and MVPA
improver status. For 30 additional days of participation in organised sport within
the five years of the study, the odds of being an SB improver vs a worsener increased
by a factor of exp(0.0020 × 30) = 1.0605; i.e. the odds of being an improver vs
a worsener increased by about 6.0%. Sex exhibited a statistically significant interaction
with age and with parental education with regard to the odds of being an SB improver,
suggesting that the impact of age and parental education on the odds of reducing
sedentary time differs between the two sexes. In particular, older ages have a larger
positive effect on the odds of being an improver in SB among females than among
males; similarly, the positive effect of higher parental education on such odds
is stronger for females than for males. Language region and household income were
not associated with a reduction in sedentary time.
Results of the sensitivity analyses with additional
adjustment of the above models for BMI percentiles are presented in table S3 in
the appendix. No association of BMI percentiles with being an improver in each
of CPM, MVPA, LPA or SB was observed. The additional BMI adjustment did not materially
modify the association of organised sport activity with being an improver in the
respective physical activity intensity category.
As for the
assessment of attrition bias, table S4 in the appendix shows the result of the final
logistic model chosen by the selection procedure described in the “Statistical analysis”
section for assessing the association of participation at follow-up with baseline
characteristics. No two-way interactions were included in the final model. There
is limited evidence for attrition bias: only one variable, age, turned out to be
a statistically significant predictor of non-participation in SOPHYA2, while parental
education had a marginally significant effect on non-participation. Participation
at follow-up was not associated with physical activity at baseline.
Discussion
The results of this study confirm epidemiological
evidence that as children and adolescents age, their physical activity generally
decreases in all intensity categories while their SB tends to increase. These results
are in line with previous research [9–12].
Of public health relevance are the identified
groups of youth who were able to overcome this age effect: the 22.5% of individuals
who maintained or increased their physical activity in terms of CPM; the 9.5% who
maintained or increased their MVPA; the 26.9% who maintained or increased their
LPA; and the 9.7% who reduced SB over the course of five years. To the best of our
knowledge, the approach of modelling the odds of sustaining or increasing CPM, MVPA
and LPA or decreasing SB is novel.
Our study is in agreement with a potentially
important role of participation in a broad range of sports activities organised
by the Swiss national Y+S programme in improving CPM and MVPA activities and reducing
SB at an absolute level. Previous studies also investigated the longitudinal associations
between sports club participation and device-based physical activity, but either
modelled the change of MVPA or explored whether organised sport predicts physical
activity instead of investigating whether organised sport can maintain physical
activity.
Results of previous studies were inconsistent
in showing a longitudinal benefit of sports participation on physical activity.
Ikeda et al. 2022 [46] reported a (non-significant) trend for the association between
self-reported participation in organised sport and the subsequent change in MVPA.
Basterfield et al. 2011 [47] found that sports club participation at the age of
9 did not predict MVPA or SB at the age of 12. Brooke et al. 2014 [48] found no
association between self-reported participation in organised sport and subsequent
change in physical activity, despite considering the variety and frequency of organised
sport. Organised sport in these studies was self-reported at a single time point.
In contrast to these studies, in the SOPHYA cohort we could rely on continuous data
on participation in organised sport extending from the study
start to the second measurement. Objectively obtained data on continuous participation
in organised sport is likely to have smaller measurement errors in assessing participation
in organised sport compared to self-reported information from only a single time
point at baseline, as drop-outs, re-entries and the intensity of sports club participation
are considered.
Studies more similar to ours in obtaining the
same information on sports activities over time also found positive associations
with high physical activity and low SB. Yang et al. 2022 [49] identified three self-reported
organised sport trajectories in a longitudinal study over nine years in youth aged
9–18 and found that sustained participation in organised sport predicted high MVPA
and low SB. Shull et al. 2020 [34] assessed sustained self-reported participation
in community or school sports teams, and the development of accelerometer-measured
physical activity and SB in children from middle to high school. They also found
that sustainable sports participation was consistently associated with higher levels
of average physical activity, and also with lower levels of average SB, even though
physical activity declined during the transition from 7th to 9th grade. In the SOPHYA
cohort, the association between participation in organised sport and reduction
in sedentary time was less strong than for the improvement of CPM and MVPA, but
still visible.
We are unaware of any studies investigating
the association between participation in organised sport and the development of
LPA. LPA has only recently become the focus of physical activity research and has
been shown to be longitudinally associated with depressive symptoms [50]. The authors
suggest that increasing LPA and decreasing SB during adolescence could be an important
target for public health interventions aimed at reducing the prevalence of depression.
We found no association between participation in organised sport and being an improver
in LPA. This lack of association may be attributed to organised sport potentially
affecting higher-intensity activities such as MVPA or reducing lower-intensity activities
such as SB, and LPA might be less affected.
While organised
sport was important in independently improving CPM and MVPA and reducing SB as youth
aged, it is of interest to note that higher baseline physical activity in all intensity
categories and lower baseline SB decreased the odds of being an improver in the
respective intensity category in models adjusting for organised sport and other
covariates. In the case of CPM, this adverse association was stronger in children
with a younger age at baseline. We can only speculate about the reasons, one of
which might be that any beneficial effect of high physical activity on not decreasing
physical activity with ageing is captured by the organised sport participation of
active children. This implies that it is not just any form of physical activity,
but rather structured and organised physical activity, like organised sport, that
is particularly effective in counteracting the age-related physical activity decline.
Growth and maturation could also play a role in younger children who may experience
a greater drop in physical activity when going through a developmental transition
as the association between the physical activity and the timing of maturation might
vary in children of the same chronological age [51].
In addition to evaluating sustained organised
sport as a predictor of improver status, we additionally studied the independent
predictive value of personal characteristics in maintaining or improving physical
activity and SB behaviour, irrespective of organised sport participation. The results
confirm the general observation that boys and children raised in families with higher
parental education are generally more likely to be active, but also point to important
interactions. We found that female participants were less likely to be improvers
in CPM. We also observed an association between parental education and being an
improver in CPM. The impact of age and parental education on the odds of reducing
SB time differed between girls and boys, where older age and a higher parental education
had a larger positive effect on the odds of being an improver in SB among girls
compared to boys. On average, girls and young women are less likely to engage in
physical activity and more likely to exhibit SB behaviour [11, 52, 53]. This difference
was also observed at the SOPHYA baseline accelerometer study [36]. Studies investigating
socioeconomic factors in relation to accelerometer-based physical activity often
report no significant sociodemographic differences in physical activity [54, 55],
a finding consistent with the SOPHYA1 study [37]. Of interest to our results is
the fact that a) the observed sex, age and education differences persist after adjustment
for organised sport participation and b) the covariates do not interact with organised
sport. Future studies need to better understand the organised sport-independent
pathways that explain why, for example, boys are more likely to be improvers.
In Switzerland,
there is an increase in organised sport from 11–12; however, after the age of 12,
drop-outs increase and entries decrease [38]. Thus, preventing drop-outs and reducing
barriers to entry into organised sport could help young people benefit more from
the potential effect of participation in organised sport in counteracting the age-related
decline in physical activity behaviour.
Strengths and limitations
The strength of our study is the longitudinal
design, including device-based physical activity measurement, a continuous and objective
recording of participation in organised sport financially supported by Y+S and a
stringent approach to statistical model building. Longitudinal studies investigating
the association between organised sport and the development of device-based physical
activity are still rare. Another strength of our study is the novel approach of
identifying improvers of CPM, MVPA, LPA and SB. This approach is different to tracking
studies that mainly used the development of ranking among peers because it looks
at the actual individual change and not only the within-individual difference compared
to peers. Examining what factors influence the odds of being an improver may be
more sensitive for assessing the benefit of sustained organised sport participation.
Our study also has some limitations. First,
given the observational nature of the study the reported association is consistent
with the hypothesis that organised sport participation supported by the Swiss Y+S
programme can prevent the age-related decline in physical activity, but it is not
proof of a cause-effect relationship. Second, as in any cohort the study encountered
losses to follow-up. But the careful assessment of potential attrition bias suggests
that it is likely to be of little concern. We
decided not to take any specific action to counteract the risk of attrition bias,
considering that, since the association of age with non-participation is positive
(i.e. older children have a slightly higher probability of non-participation in
SOPHYA2) and the association of age with being an improver in all physical activity
intensity categories is also positive (i.e. older children have a higher probability
of being improvers, see table 3), then attrition bias, if present, would act in
the direction of attenuating the results found in our models, and therefore such
results would be confirmed, and strengthened, in analyses that explicitly took selection
bias into consideration (e.g. applying inverse probability weighting). In addition,
physical activity at baseline was not associated with follow-up participation, further
decreasing the likelihood of substantial attrition bias. Third, our measure of participation
in organised sport was reduced to sports
courses that were financially supported by Y+S. The fact that we found an association
of organised sport supported by Y+S with being an improver in CPM and MVPA, even
though our variable does not capture sports activities not financially supported
by Y+S, speaks for the strength of the true association which we more likely underestimated
by focusing on Y+S only. The same applies to the fact that accelerometers were not
worn during water-based activities whereas organised sport includes swimming courses.
Again, if water-related organised sport was influential in the association of organised
sport with improver status, our study may underestimate any true association by
not capturing water-based physical activity. Fourth, as in most physical activity
studies we did not consider the compositional nature of our physical activity outcomes,
namely time spent in MVPA, time spent in LPA and time spent in SB, which always
adds up to 100% of the wear time. This means for example that if LPA is increased,
it will be at the expense of time in either MVPA or SB. This may have contributed
to not finding an association of organised sport with LPA improver status. Future
studies should also focus on compositional data [56] to account for these changes
in intensity categories and better understand the nature of PA development. Finally,
in the absence of detailed information on children’s health status, we cannot assess
the generalisability of the results to subgroups of children with specific health
conditions. Similarly, in the absence of detailed information on types of organised
sport we cannot assess the generalisability of the observed associations to subgroups
of specific sports activities.
Conclusion
Participation
in organised sport in the context of the national Y+S programme appears to be associated
with prevention of the age-related decline of PA and the age-related increase in
SB from childhood to adolescence and from adolescence to young adulthood. In the SOPHYA
study, the group of youths who could
maintain or improve physical activity, particularly in the MVPA category, was small.
If a potentially beneficial effect of specific Y+S sports programmes in increasing
this youth group was confirmed, this would be of substantial public health relevance.
Further research
in larger longitudinal samples should investigate the association of specific sports
activities supported or non-supported by the Y+S programme on the maintenance of
physical activity over time. These studies need to take into consideration who enters
and who stays in the respective sports programmes.
Acknowledgments
We thank all the children, adolescents, young
adults and parents for participating in the study. We thank our fieldworkers Simone
Isler, Maria Schmucki, Seline Gerosa, Matthias Zedi, Annina Rigassi, Maximilian
Witz, Jane Tedesco, Tiffanie Simone, Lindit Osdautaj, Nicolas Bringolf, Meret Hofer,
Camille Heinkel and Carine Jaquier for the data collection. We thank Markus Lamprecht
for the collaboration and the SOPHYA-study group for their support. The SOPHYA-study
group: Nadja Mahler (FOSPO), Alain Dössegger (FOSPO), Thomas Wyss (FOSPO), Urs Mäder
(FOSPO), Andrea Poffet (FOPH), Nadine Stoffel-Kurth (FOPH), Kathrin Favero (FOPH),
Lisa Guggenbühl (Health Promotion Switzerland) and Charlotte Braun-Fahrländer (Swiss
TPH).
Nicole Probst-Hensch
Swiss Tropical and Public Health Institute
Kreuzstrasse 2
CH-4123 Allschwil
nicole.probst[at]swisstph.ch
References
1. Poitras VJ, Gray CE, Borghese MM, Carson V, Chaput JP, Janssen I, et al. Systematic
review of the relationships between objectively measured physical activity and health
indicators in school-aged children and youth. Appl Physiol Nutr Metab. 2016 Jun;41(6 Suppl
3):S197–239. doi: https://doi.org/10.1139/apnm-2015-0663
2. Bull FC, Al-Ansari SS, Biddle S, Borodulin K, Buman MP, Cardon G, et al. World Health
Organization 2020 guidelines on physical activity and sedentary behaviour. Br J Sports
Med. 2020 Dec;54(24):1451–62. doi: https://doi.org/10.1136/bjsports-2020-102955
3. Warburton DE, Bredin SS. Health benefits of physical activity: a systematic review
of current systematic reviews. Curr Opin Cardiol. 2017 Sep;32(5):541–56. doi: https://doi.org/10.1097/HCO.0000000000000437
4. Schuch FB, Vancampfort D, Firth J, Rosenbaum S, Ward PB, Silva ES, et al. Physical
Activity and Incident Depression: A Meta-Analysis of Prospective Cohort Studies. Am
J Psychiatry. 2018 Jul;175(7):631–48. doi: https://doi.org/10.1176/appi.ajp.2018.17111194
5. Lubans D, Richards J, Hillman C, Faulkner G, Beauchamp M, Nilsson M, et al. Physical
Activity for Cognitive and Mental Health in Youth: A Systematic Review of Mechanisms.
Pediatrics. 2016 Sep;138(3):e20161642. doi: https://doi.org/10.1542/peds.2016-1642
6. Bermejo-Cantarero A, Sánchez-López M, Álvarez-Bueno C, Redondo-Tébar A, García-Hermoso A,
Martínez-Vizcaino V. Are Physical Activity Interventions Effective in Improving Health-Related
Quality of Life in Children and Adolescents? A Systematic Review and Meta-Analysis.
Sports Health. 2023 Aug 22:19417381231190885. doi: https://doi.org/10.1177/19417381231190885
7. Marquez DX, Aguiñaga S, Vásquez PM, Conroy DE, Erickson KI, Hillman C, et al. A systematic
review of physical activity and quality of life and well-being. Transl Behav Med.
2020 Oct;10(5):1098–109. doi: https://doi.org/10.1093/tbm/ibz198
8. Wu XY, Han LH, Zhang JH, Luo S, Hu JW, Sun K. The influence of physical activity,
sedentary behavior on health-related quality of life among the general population
of children and adolescents: A systematic review. PLoS One. 2017 Nov;12(11):e0187668.
doi: https://doi.org/10.1371/journal.pone.0187668
9. Pereira S, Reyes AC, Chaves R, Santos C, Vasconcelos O, Tani GO, et al. Correlates
of the Physical Activity Decline during Childhood. Med Sci Sports Exerc. 2022 Dec;54(12):2129–37.
doi: https://doi.org/10.1249/MSS.0000000000003013
10. Farooq A, Martin A, Janssen X, Wilson MG, Gibson AM, Hughes A, et al. Longitudinal
changes in moderate-to-vigorous-intensity physical activity in children and adolescents:
A systematic review and meta-analysis. Obes Rev. 2020 Jan;21(1):e12953. doi: https://doi.org/10.1111/obr.12953
11. Cooper AR, Goodman A, Page AS, Sherar LB, Esliger DW, van Sluijs EM, et al. Objectively
measured physical activity and sedentary time in youth: the International children’s
accelerometry database (ICAD). Int J Behav Nutr Phys Act. 2015 Sep;12(1):113. doi: https://doi.org/10.1186/s12966-015-0274-5
12. Corder K, Winpenny E, Love R, Brown HE, White M, Sluijs EV. Change in physical activity
from adolescence to early adulthood: a systematic review and meta-analysis of longitudinal
cohort studies. Br J Sports Med. 2019 Apr;53(8):496–503. doi: https://doi.org/10.1136/bjsports-2016-097330
13. Ingram DK. Age-related decline in physical activity: generalization to nonhumans.
Med Sci Sports Exerc. 2000 Sep;32(9):1623–9. doi: https://doi.org/10.1097/00005768-200009000-00016
14. Dumith SC, Gigante DP, Domingues MR, Kohl HW 3rd. Physical activity change during
adolescence: a systematic review and a pooled analysis. Int J Epidemiol. 2011 Jun;40(3):685–98.
doi: https://doi.org/10.1093/ije/dyq272
15. Vanhelst J, Béghin L, Drumez E, Labreuche J, Polito A, De Ruyter T, et al. Changes
in physical activity patterns from adolescence to young adulthood: the BELINDA study.
European Journal of Pediatrics. 2023 2023/06/01;182(6):2891-902.
16. Malina RM. Tracking of physical activity and physical fitness across the lifespan.
Res Q Exerc Sport. 1996 Sep;67(3 Suppl):S48–57. doi: https://doi.org/10.1080/02701367.1996.10608853
17. Downing KL, Hinkley T, Timperio A, Salmon J, Carver A, Cliff DP, et al. Volume and
accumulation patterns of physical activity and sedentary time: longitudinal changes
and tracking from early to late childhood. Int J Behav Nutr Phys Act. 2021 Mar;18(1):39.
doi: https://doi.org/10.1186/s12966-021-01105-y
18. Jones RA, Hinkley T, Okely AD, Salmon J. Tracking physical activity and sedentary
behavior in childhood: a systematic review. Am J Prev Med. 2013 Jun;44(6):651–8. doi: https://doi.org/10.1016/j.amepre.2013.03.001
19. Herman KM, Craig CL, Gauvin L, Katzmarzyk PT. Tracking of obesity and physical activity
from childhood to adulthood: the Physical Activity Longitudinal Study. Int J Pediatr
Obes. 2009;4(4):281–8. doi: https://doi.org/10.3109/17477160802596171
20. Telama R, Yang X, Leskinen E, Kankaanpää A, Hirvensalo M, Tammelin T, et al. Tracking
of physical activity from early childhood through youth into adulthood. Med Sci Sports
Exerc. 2014;46(5):955–62. doi: https://doi.org/10.1249/MSS.0000000000000181
21. Malina RM. Adherence to Physical Activity From Childhood to Adulthood: A Perspective
From Tracking Studies. Quest. 2001 2001/08/01;53(3):346-55. doi: https://doi.org/10.1080/00336297.2001.10491751
22. Malina RM. Physical activity and fitness: pathways from childhood to adulthood. Am
J Hum Biol. 2001;13(2):162–72. doi: https://doi.org/10.1002/1520-6300(200102/03)13:2<162::AID-AJHB1025>3.0.CO;2-T
23. Howie EK, McVeigh JA, Smith AJ, Zabatiero J, Bucks RS, Mori TA, et al. Physical activity
trajectories from childhood to late adolescence and their implications for health
in young adulthood. Prev Med. 2020 Oct;139:106224. doi: https://doi.org/10.1016/j.ypmed.2020.106224
24. Pate RR, Schenkelberg MA, Dowda M, McIver KL. Group-based physical activity trajectories
in children transitioning from elementary to high school. BMC Public Health. 2019 Mar;19(1):323.
doi: https://doi.org/10.1186/s12889-019-6630-7
25. Kwon S, Janz KF, Letuchy EM, Burns TL, Levy SM. Developmental Trajectories of Physical
Activity, Sports, and Television Viewing During Childhood to Young Adulthood: Iowa
Bone Development Study. JAMA Pediatr. 2015 Jul;169(7):666–72. doi: https://doi.org/10.1001/jamapediatrics.2015.0327
26. Telama R. Tracking of physical activity from childhood to adulthood: a review. Obes
Facts. 2009;2(3):187–95. doi: https://doi.org/10.1159/000222244
27. Kristensen PL, Møller NC, Korsholm L, Wedderkopp N, Andersen LB, Froberg K. Tracking
of objectively measured physical activity from childhood to adolescence: the European
youth heart study. Scand J Med Sci Sports. 2008 Apr;18(2):171–8. doi: https://doi.org/10.1111/j.1600-0838.2006.00622.x
28. Sallis JF. Age-related decline in physical activity: a synthesis of human and animal
studies. Med Sci Sports Exerc. 2000 Sep;32(9):1598–600. doi: https://doi.org/10.1097/00005768-200009000-00012
29. Sterdt E, Liersch S, Walter U. Correlates of physical activity of children and adolescents:
A systematic review of reviews. Health Educ J. 2014;73(1):72–89. doi: https://doi.org/10.1177/0017896912469578
30. Howie EK, McVeigh JA, Smith AJ, Straker LM. Organized Sport Trajectories from Childhood
to Adolescence and Health Associations. Med Sci Sports Exerc. 2016 Jul;48(7):1331–9.
doi: https://doi.org/10.1249/MSS.0000000000000894
31. Mooses K, Kull M. The participation in organised sport doubles the odds of meeting
physical activity recommendations in 7-12-year-old children. Eur J Sport Sci. 2020 May;20(4):563–9.
doi: https://doi.org/10.1080/17461391.2019.1645887
32. Marques A, Ekelund U, Sardinha LB. Associations between organized sports participation
and objectively measured physical activity, sedentary time and weight status in youth.
J Sci Med Sport. 2016 Feb;19(2):154–7. doi: https://doi.org/10.1016/j.jsams.2015.02.007
33. Lykkegaard CR, Andersen HS, Wehberg S, Holden S, Waldorff FB, Søndergaard J, et al. The
association between childhood motor performance and developmental trajectories of
sport participation over 5 years in Danish students aged 6-16-year-old. Sci Rep. 2023 Mar;13(1):4133.
doi: https://doi.org/10.1038/s41598-023-31344-x
34. Shull ER, Dowda M, Saunders RP, McIver K, Pate RR. Sport participation, physical activity
and sedentary behavior in the transition from middle school to high school. J Sci
Med Sport. 2020 Apr;23(4):385–9. doi: https://doi.org/10.1016/j.jsams.2019.10.017
35. Rovio SP, Yang X, Kankaanpää A, Aalto V, Hirvensalo M, Telama R, et al. Longitudinal
physical activity trajectories from childhood to adulthood and their determinants:
The Young Finns Study. Scand J Med Sci Sports. 2018 Mar;28(3):1073–83. doi: https://doi.org/10.1111/sms.12988
36. Bringolf-Isler B, Schindler C, de Hoogh K, Kayser B, Suggs LS, Dössegger A, et al.;
SOPHYA Study Group. Association of objectively measured and perceived environment
with accelerometer-based physical activity and cycling: a Swiss population-based cross-sectional
study of children. Int J Public Health. 2019 May;64(4):499–510. doi: https://doi.org/10.1007/s00038-019-01206-3
37. Bringolf-Isler B, Schindler C, Kayser B, Suggs LS, Probst-Hensch N, Group SS; SOPHYA
Study Group. Objectively measured physical activity in population-representative parent-child
pairs: parental modelling matters and is context-specific. BMC Public Health. 2018 Aug;18(1):1024.
doi: https://doi.org/10.1186/s12889-018-5949-9
38. Lamprecht M, Bürgi R, Gebert A, Stamm HP. Sport Schweiz 2020: Kinder- und Jugendbericht.
Magglingen: Bundesamt für Sport BASPO2021. Available from https://www.sportobs.ch/inhalte/Downloads/Kinder_und_Jugendbericht_2020_d.pdf
39. Lamprecht M, Fischer A, Wiegand D, Stamm HP. Sport Schweiz 2014: Kinder- und Jugendbericht.
Magglingen: Bundesamt für Sport BASPO2015. Available from https://www.swissolympic.ch/dam/jcr:45d4cf9c-ba54-4c00-acf9-45e33fb94e74/sport_schweiz_2014_kinder_und_jugendbericht_d.pdf
40. Cole TJ, Lobstein T. Extended international (IOTF) body mass index cut-offs for thinness,
overweight and obesity. Pediatr Obes. 2012 Aug;7(4):284–94. doi: https://doi.org/10.1111/j.2047-6310.2012.00064.x
41. Vanhelst J, Mikulovic J, Bui-Xuan G, Dieu O, Blondeau T, Fardy P, Béghin L. Comparison
of two ActiGraph accelerometer generations in the assessment of physical activity
in free living conditions. BMC Research Notes. 2012 2012/04/25;5(1):187. doi: https://doi.org/10.1186/1756-0500-5-187
42. Trost SG, Loprinzi PD, Moore R, Pfeiffer KA. Comparison of accelerometer cut points
for predicting activity intensity in youth. Med Sci Sports Exerc. 2011 Jul;43(7):1360–8.
doi: https://doi.org/10.1249/MSS.0b013e318206476e
43. Freedson P, Pober D, Janz KF. Calibration of accelerometer output for children. Med
Sci Sports Exerc. 2005 Nov;37(11 Suppl):S523–30. doi: https://doi.org/10.1249/01.mss.0000185658.28284.ba
44. Troiano RP, Berrigan D, Dodd KW, Mâsse LC, Tilert T, McDowell M. Physical activity
in the United States measured by accelerometer. Med Sci Sports Exerc. 2008 Jan;40(1):181–8.
doi: https://doi.org/10.1249/mss.0b013e31815a51b3
45. Jugend und Sport. (J+S) Statistiken 2023. 2023; Available from: https://backend.jugendundsport.ch/fileservice/sdweb-docs-prod-jugdsport-files/files/2024/04/24/d674c058-b521-4e0b-b839-8d4e5c153e1b.pdf
46. Ikeda E, Guagliano JM, Atkin AJ, Sherar LB, Ekelund U, Hansen B, et al.; International
Children’s Accelerometry Database (ICAD) Collaborators. Cross-sectional and longitudinal
associations of active travel, organised sport and physical education with accelerometer-assessed
moderate-to-vigorous physical activity in young people: the International Children’s
Accelerometry Database. Int J Behav Nutr Phys Act. 2022 Apr;19(1):41. doi: https://doi.org/10.1186/s12966-022-01282-4
47. Basterfield L, Adamson A, Frary J, Parkinson K, Pearce M, Reilly J. Team ftGMSC. Longitudinal
Study of Physical Activity and Sedentary Behavior in Children. Pediatrics. 2011;127(1):e24–30.
doi: https://doi.org/10.1542/peds.2010-1935
48. Brooke HL, Corder K, Griffin SJ, van Sluijs EM. Physical activity maintenance in the
transition to adolescence: a longitudinal study of the roles of sport and lifestyle
activities in British youth. PLoS One. 2014 Feb;9(2):e89028. doi: https://doi.org/10.1371/journal.pone.0089028
49. Yang X, Kukko T, Lounassalo I, Kulmala J, Hakonen H, Rovio SP, et al. Organized Youth
Sports Trajectories and Adult Health Outcomes: The Young Finns Study. Am J Prev Med.
2022 Dec;63(6):962–70. doi: https://doi.org/10.1016/j.amepre.2022.06.018
50. Kandola A, Lewis G, Osborn DP, Stubbs B, Hayes JF. Depressive symptoms and objectively
measured physical activity and sedentary behaviour throughout adolescence: a prospective
cohort study. Lancet Psychiatry. 2020 Mar;7(3):262–71. doi: https://doi.org/10.1016/S2215-0366(20)30034-1
51. Machado Rodrigues AM, Coelho e Silva MJ, Mota J, Cumming SP, Sherar LB, Neville H,
et al. Confounding effect of biologic maturation on sex differences in physical activity
and sedentary behavior in adolescents. Pediatr Exerc Sci. 2010 Aug;22(3):442–53. doi: https://doi.org/10.1123/pes.22.3.442
52. Steene-Johannessen J, Hansen BH, Dalene KE, Kolle E, Northstone K, Møller NC, et al.;
Determinants of Diet and Physical Activity knowledge hub (DEDIPAC); International
Children’s Accelerometry Database (ICAD) Collaborators, IDEFICS Consortium and HELENA
Consortium. Variations in accelerometry measured physical activity and sedentary time
across Europe - harmonized analyses of 47,497 children and adolescents. Int J Behav
Nutr Phys Act. 2020 Mar;17(1):38. doi: https://doi.org/10.1186/s12966-020-00930-x
53. Corder K, Sharp SJ, Atkin AJ, Andersen LB, Cardon G, Page A, et al.; International
Children’s Accelerometry Database (ICAD) Collaborators. Age-related patterns of vigorous-intensity
physical activity in youth: The International Children’s Accelerometry Database. Prev
Med Rep. 2016 May;4:17–22. doi: https://doi.org/10.1016/j.pmedr.2016.05.006
54. Kelly LA, Reilly JJ, Fisher A, Montgomery C, Williamson A, McColl JH, et al. Effect
of socioeconomic status on objectively measured physical activity. Arch Dis Child.
2006 Jan;91(1):35–8. doi: https://doi.org/10.1136/adc.2005.080275
55. Brodersen NH, Steptoe A, Boniface DR, Wardle J. Trends in physical activity and sedentary
behaviour in adolescence: ethnic and socioeconomic differences. Br J Sports Med. 2007 Mar;41(3):140–4.
doi: https://doi.org/10.1136/bjsm.2006.031138
56. Janssen I, Clarke AE, Carson V, Chaput JP, Giangregorio LM, Kho ME, et al. A systematic
review of compositional data analysis studies examining associations between sleep,
sedentary behaviour, and physical activity with health outcomes in adults. Appl Physiol
Nutr Metab. 2020 Oct;45(10 (Suppl. 2) Suppl. 2):S248–57. doi: https://doi.org/10.1139/apnm-2020-0160
Appendix: supplementary figures and tables
The appendix is available in the pdf version of the article.