Prognostic impact of carotid plaque imaging using total plaque area added to SCORE2
in middle-aged subjects: the ARteris Cardiovascular Outcome (ARCO) cohort study
DOI: https://doi.org/https://doi.org/10.57187/s.3735
Michel Romanensa,
Ansgar Adamsb,
Michel Wengerc,
Walter
Warmuthd,
Isabella
Sudanoe
a Vascular
Risk Foundation (Varifo), Olten, Switzerland
b BAD
Gesundheitsvorsorge und Sicherheitstechnik GmbH, Bonn, Germany
c Sanacare Centramed Medical Centre, Basel, Switzerland
d Gesundheitsforen Leipzig, Leipzig, Germany
e University
Heart Centre, Cardiology, University Hospital Zurich, Zurich, Switzerland
Summary
AIMS: Many cardiovascular events occur in seemingly
healthy individuals.We set out to
assess the predictive value of atherosclerosis imaging in combination with
cardiovascular risk calculators in subjects aged 40–65 years.
METHODS: We compared PROCAM (PROspective CArdiovascular
Münster study), SCORE (Systematic COronary Risk Evaluation) and SCORE2 with
carotid ultrasound (total plaque area, TPA) in subjects without cardiovascular
disease. In this prospective cohort study, follow-up was obtained by phone or
mail from patients; or from clinical records, if needed.
RESULTS: In 2842 subjects (mean age 50±8 years; 38%
women), cardiovascular events occurred in 154 (5.4%) of them over an mean follow-up
period of 5.9 (range 1–12) years, specifically: 41 cases of AMI
(myocardial infarction), 16 strokes, 21 CABG (coronary artery bypass grafting),
41 PTCA (percutaneous transluminal coronary angioplasty) and 35 CAD (coronary
artery disease). Mean PROCAM risk was 5±6%, mean SCORE risk was 1.3±1.6%
and mean SCORE2 risk was 5±3%. Both for the primary outcome (major adverse
cardiovascular events, MACEs, i.e. AMI + strokes) and the secondary outcome
(atherosclerotic cardiovascular disease, ASCVD, i.e. MACEs + CABG + CAD + PTCA),
hazards increased significantly for TPA tertiles and SCORE2 post-test risk between
6.7 to 12.8 after adjustment for risk factors (age, smoke, sex, systolic blood
pressure, lipids, medication) and after adjustment for results from PROCAM,
SCORE and SCORE2. Model performance was statistically improved regarding model
fit in all models using TPA. Net reclassification improvement for SCORE2 with TPA
post-test risk increased significantly by 24% for MACEs (p = 0.01) and 39% for
ASCVD (p <0.0001).
CONCLUSIONS: Integration of TPA post-test risk into
SCORE2 adds prognostic information, supporting the use of carotid ultrasound
when assessing ASCVD risk in subjects aged 40–65 years.
List of abbreviations
- 3D
-
three-dimensional
- AGLA
-
Arbeitsgruppe
Lipide und Atherosklerose (Swiss Atherosclerosis Association)
- AMI
-
fatal
or nonfatal myocardial infarction
- AUC
-
area
under the curve
- ASCVD
-
atherosclerotic
cardiovascular disease
- CABG
-
coronary
bypass grafting
- CAD
-
coronary
artery disease with luminal narrowing of 50% or more
- CI
-
confidence
interval
- EAS
-
European
Atherosclerosis Society
- ESC
-
European
Society of Cardiology
- HDL
-
high-density
lipoprotein
- HL
-
Hosmer
& Lemeshow test
- JASE
-
Journal
of American Society of Echocardiography
- LDL
-
low-density
lipoprotein
- MACE
-
major
adverse cardiovascular event (fatal or nonfatal acute myocardial infarction or
stroke
- NRI
-
net
reclassification improvement
- PESA
-
Progression
of Early Subclinical Atherosclerosis study
- ROC
-
receiver
operating characteristic
- PROCAM
-
Prospective
Cardiovascular Münster Study (myocardial infarction)
- PROCAMcvd
-
Prospective
Cardiovascular Münster Study for fatal and nonfatal myocardial infarction and
stroke
- PTCA
-
percutaneous
transluminal coronary angioplasty
- TPA
-
total
plaque area (carotid plaque)
- SCORE
-
Systematic COronary Risk Evaluation,
European Society of Cardiology, for fatal cardiovascular events
- SCORE2
-
Systematic
COronary Risk Evaluation, European Society of Cardiology, for fatal and
non-fatal cardiovascular events
- SCORE2ptp
-
Post-test
risk of SCORE and TPA based on the Bayes theorem
- STROKE
-
fatal or
nonfatal stroke
Introduction
In January 2021, the SCORE2 working group and European
Society of Cardiology Cardiovascular Risk Collaboration published new
prediction algorithms to estimate 10-year risk of cardiovascular disease in
Europe [1]. Previously, the European
society of cardiology and European Atherosclerosis Society had issued a
guideline for dyslipidaemia treatment and suggested use of arterial (carotid
and/or coronary calcified) plaque burden as a risk modifier in individuals at
low or moderate risk [2]. This
recommendation was based on the performance of SCORE (Systematic COronary Risk
Evaluation), a risk algorithm for cardiovascular mortality only [3]. With SCORE2,
risk classification was
extended to include nonfatal cardiovascular events such as myocardial
infarction (AMI) and stroke and risk categories were also modified according to
an individual’s age at the time of the risk assessment. In subjects aged below
50 years, <2.5% risk is defined as low to intermediate and ≥7.5% is defined
as very high risk, whereas in subjects aged 50–69 years the cut-offs are <5.0%
and ≥10.0%, respectively. This important modification makes it possible to estimate
lifetime
risks. In view of the changes introduced in SCORE2, it may no longer be
necessary to perform additional ultrasound imaging tests to detect carotid or
femoral plaque as risk category modifiers.
In order to determine whether additional ultrasound
plaque imaging in carotid arteries may still be indicated as a risk modifier in
primary prevention, we used the data from our previously published cohort study
[4] and performed a joint German and
Swiss prospective cohort study in subjects aged 40–65 years. Specifically, we aimed
to answer two questions: Does SCORE2 outperform other risk prediction
algorithms used in Germany and Switzerland, namely PROCAM [5] and SCORE, with regard
to calibration,
discrimination and reclassification? Does carotid plaque in itself or as a post-test
risk integrated into SCORE2 add additional information above and beyond SCORE2?
Materials and methods
We used the prospective cohort method to detect
cardiovascular events and used medical imaging (carotid total plaque area [TPA])
compared to coronary/cardiovascular risk equations as predictors, as previously
described [4].
As reported in [4],
we calculated a minimum sample size of n = 252 with 12 events for receiver
operating characteristic (ROC) analysis, n = 2208 with 138 events for
comparative ROC analysis. Patients with previous ASCVD or diabetes mellitus
were excluded and consecutive patients aged 40–65 years were included in the
study. All data were entered into an Excel spreadsheet for data processing and
pseudonymisation.
Subject selection
At the Swiss Imaging Centre in Olten, subjects
self-referred to the Vascular Risk Foundation in response to public
advertisements approved by the local ethics committee; data were collected
between 2003 and 2018. At the German centre in Koblenz, subjects self-referred
within an employment setting (after the employer recommended the service to the
employees) and data were collected between 2008 and 2019. Subjects had no cardiovascular
symptoms or disease, did not have diabetes mellitus and were aged 40–65 years; most
patients were not taking antihypertensive drugs or statins. Laboratory values
were provided by local accredited laboratories and obtained via the referral
data of treating primary care physicians. Lipid data was usually obtained in
the fasting state; systolic blood pressure was measured in the sitting position
after a brief resting period with a plethysmographic method and averaging the
second and third measurements. Laboratory data and medical history were entered
into an Excel spreadsheet (Microsoft, Richmond, WA, USA). At baseline, we
recorded 556 (20%) patients on statins and/or antihypertensive drugs,
consisting of 514 (19%) on antihypertensive drugs, 28 (1%) on statins and 14
(0.5%) on a combination of statins and antihypertensive drugs.
Patient information
Smoking status, a family history of premature coronary
disease and presence of diabetes mellitus were self-reported.
Follow-up information
As reported in [4],
we contacted patients by telephone, email or mail in order to find out whether a
cardiovascular event had occurred. “Cardiovascular event” was defined as fatal
or nonfatal AMI, percutaneous transluminal coronary angioplasty (PTCA),
coronary artery bypass grafting (CABG), fatal or nonfatal stroke or transient
ischaemic attack or presence of a significant (≥50%) stenosis assessed by
invasive coronary angiography. Furthermore, in unclear situations, we obtained
clinical records from treating physicians. When coronary revascularisation was
performed in patients with an acute AMI, the endpoint was adjudicated to AMI,
as reported in [4]. The primary endpoint
was major cardiovascular event (MACE), a composite endpoint of AMI or stroke.
The secondary endpoint included the primary endpoint plus CABG, PTCA and
coronary artery disease (ASCVD).
Sensitivity analysis
As reported in [4],
because 18% of subjects were not available for follow-up, we performed a
sensitivity analysis using a comparison between patients with complete
follow-up and the total number of patients available for our cohort study.
Ethical aspects
As reported in [4],
Swiss subjects with self-referral to the Vascular Risk Foundation gave written
consent. The study protocol was approved by the local ethics committee of
Solothurn, Switzerland [6]. German subjects
were entered into an anonymised study registry, for which current legislation
in Switzerland and Germany does not require formal ethics committee consent.
Carotid imaging
As reported in [4],
we measured the burden of carotid atherosclerosis using a longitudinal carotid
plaque surface measurement with a high-resolution ultrasound linear transducer
probe (7.5–12.0 MHz), which identified plaques with intimal thickening ≥1.0 mm.
The longitudinal area of all plaques was summed to yield the TPA in mm2.
The sum of longitudinal
areas of all plaques seen between the clavicle and the angle of the jaw was
taken as the total plaque area. Large calcified carotid plaques creating areas
of shadowing were rarely seen in subjects aged 40–65 years, therefore, this was
not a significant problem when assessing total carotid atherosclerotic burden. As
reported in [4], we calculated the intraobserver
(MR) reproducibility for the right carotid artery in 57 patients with a
correlation coefficient of r2 = 0.964 (left carotid artery: r2
= 0.944; left and right: r2 = 0.986). For the cut-off values 0–9 mm2,
10–49 mm2, 50–99 mm2 and ≥100 mm2, the kappa
value was 0.69 (95% CI: 0.54–0.84) [7, 8].
For this study, all TPA measurements were made by AA in Koblenz and by MR
in Olten.
Calculation of cardiovascular risk
As reported in [4],
we assessed cardiovascular risk using published risk formulas in an Excel
spreadsheet. We used the ESC point score system for low-risk populations in
Switzerland and for intermediate risk in Germany (SCORE2 [1]) and
calculated the PROCAM/AGLA risk for AMI and stroke online [9]. Further, we calculated
risk based on the
SCORE risk equation [3]. For net
reclassification improvement (NRI) calculations, we calculated sensitivity and
specificity of TPA tertiles and derived post-test risk calculations for SCORE2
using the Bayes theorem as described elsewhere [10].
The sensitivities and specificities for the Bayes formula are given in table S1
in the appendix (for TPA tertiles); a negative test was defined as a TPA value
in the 1st tertile (<22 mm2), while a positive test was defined
as a TPA value in the 2nd (22–61 mm2) or 3rd (≥62 mm2)
tertile.
Statistics
As reported in [4],
we used MedCalc® Statistical Software version 20.014 (MedCalc Software Ltd,
Ostend, Belgium; https://www.medcalc.org) to calculate Cox proportional-hazards
regressions, and ROC curves and their comparisons [11]. Groups in table 1 were compared
using the Mann-Whitney test
for independent samples (due to non-normal distribution regarding blood
pressure, BMI, lipids and results from risk charts and post-test probabilities)
and the chi-squared test for categorical variables.
Table 1Baseline
characteristics, results from risk scores and imaging.
| |
Type of outcome |
| MACE (A) |
ASCVD |
No ASCVD (NA) |
p A vs NA |
All |
| Patient characteristics |
n |
57 |
154 |
2688 |
|
2842 |
| Male, n (%) |
54 (92%) |
141 (94%) |
1636 (60%) |
<0.00001 |
1765 (62%) |
| Female, n (%) |
3 (8%) |
13 (6%) |
1068 (40%) |
— |
1081 (38%) |
| Age + SD |
55 + 6 |
55 + 6 |
50 + 8 |
<0.0001 |
50 + 8 |
| Smoker, n (%) |
32 (56%) |
72 (47%) |
537 (20%) |
<0.00001 |
609 (21%) |
| Systolic blood pressure + SD, mm Hg |
139 + 20 |
133 + 18 |
125 + 15 |
<0.0001 |
125.7 + 15.5 |
| BMI + SD |
27 + 4 |
27 + 4 |
26 + 4 |
0.01 |
26 + 4 |
| Lipids |
Cholesterol + SD, mmol/l |
6.3 + 1.1 |
6.3 + 1.1 |
6.0 + 1.1 |
0.0054 |
6.0 + 1.1 |
| HDL + SD, mmol/l |
1.3 + 0.3 |
1.3 + 0.3 |
1.5 + 0.4 |
0.004 |
1.5 + 0.4 |
| LDL + SD, mmol/l |
4.1 + 0.9 |
4.1 + 0.9 |
3.7 + 0.9 |
0.0002 |
3.7 + 0.9 |
| Triglycerides + SD, mmol/l |
1.8 + 1.3 |
2.0 + 1.3 |
1.6 + 1.1 |
0.026 |
1.6 + 1.1 |
| Imaging |
TPA + SD, mm2 |
127 + 98 |
134 + 85 |
39 + 47 |
<0.0001 |
42 + 54 |
| Risk algorithms |
PROCAM* + SD |
13 + 8 |
13 + 9 |
4 + 6 |
<0.0001 |
5 + 6 |
| PROCAMcvd** + SD |
16 + 9 |
16 + 10 |
6 + 7 |
<0.0001 |
6.0 + 8.0 |
| SCORE + SD |
3.8 + 3.0 |
3.0 + 2.0 |
1.2 + 1.5 |
<0.0001 |
1.3 + 1.6 |
| SCORE2 + SD |
9 + 4 |
8 + 4 |
4 + 3 |
<0.0001 |
5.0 + 3.0 |
| SCORE2ptp + SD |
21 + 10 |
22 + 10 |
6 + 8 |
<0.0001 |
7.0 + 9.0 |
Net reclassification improvements (NRIs) were
calculated as described elsewhere [12]. NRI
is a statistical tool proposed to assess improvement in model performance
offered by a new method of classification compared to a reference one. The NRI indicates
how much more frequently appropriate reclassification occurs than inappropriate
reclassification with the use of a new model of classification. It is based on
reclassification tables constructed separately for participants with and
without the event in question, and quantifies the correct movement in
categories, upwards for events and downwards for non-events. This defines
upward movement (up) as a change into a higher category based on the new
algorithm and downward movement (down) as a change in the opposite direction.
The NRI is defined as a proportion P as follows:
NRI = P(up|event) − P(down|event) + P(down|non-event)
− P(up|non-event). The null hypothesis for NRI = 0 is tested using the z
statistic following the McNemar asymptotic test for correlated proportions.
We used the following formula for the calculation of
post-test probabilities (PTP, Bayes theorem) [10]:
PTP positive (TPA >21 mm2): (PV × SE) / [PV
× SE + (1 – PV) × ( 1 – SP) ]
PTP negative (TPA <22 mm2): [PV × (1 – SE)]
/ [PV × (1 – SE) + SP × (1 – PV)], where PV denotes prevalence (which equals
prior probability which corresponds to the results from SCORE2 risk), SE
denotes sensitivity, SP denotes specificity of the TPA test. SCORE2ptp is
therefore the post-test risk result based on the Bayes theorem and the
information from TPA.For post-test calculations based on the Bayes formula,
we uniformly used the sensitivities and specificities for ASCVD (table S1 in
the appendix), because of the higher number of events and therefore higher
robustness of the post-test results.
We used Cox proportional-hazards regression after
adjustment for clinical variables and risk algorithms for both MACE and ASCVD.
Further, we assessed model performance using model fit (chi-squared),
discrimination (ROC analysis) and calibration (Hosmer-Lemeshow test). The level
of statistical significance was set at p <0.05.
Results
The cohort is composed of subjects of the vascular
risk foundation (VARIFO) in Olten, Switzerland (n = 1050) and the prevention
centre in Koblenz, Germany (n = 3326) as reported in [4]. All patients were living
in central Europe or Switzerland and they were predominantly
Caucasian. Of the 1050 VARIFO subjects, subjects were excluded for age
below 40 or over 65 years (n = 237) or diabetes (n = 30) or death of unknown cause
(n = 5); in the Koblenz cohort, 124 subjects were excluded due to diabetes and
528 due to age. The remaining 3452 subjects were eligible for study entry and
follow-up could be obtained for 2842 (82.3%) subjects, with the German cohort
making up 80% of these 2842 patientsand accounting for 123 of the 154 ASCVD events
(80%).
Events were confirmed by medical records in 75% and by telephone interview in
25%. Patients without follow-up were excluded from the study.
As previously published [4], in the VARIFO cohort, 16 deaths occurred, of which 5
were due
to an unknown cause and hence excluded from the study. The remaining 11 deaths
were attributed to AMI (n = 9) and stroke (n = 2). All ASCVD deaths had a TPA
in the 3rd tertile, except for n = 1 with TPA in the 2nd tertile (mean TPA for all ASCVD deaths: 136 mm2). In the Koblenz cohort, there
were 10 deaths, of which 8 were attributed to AMI and 2 to stroke. In all these
patients, TPA was in the 3rd tertile (range: 62–260 mm2; mean:
149 mm2).
The number of events for the primary endpoint (MACE) was 41 AMI
and 16 strokes (giving a total of 57 MACE); other events were 21 CABG, 41 PTCA
and 35 CAD (i.e. 97 events in addition to MACE, giving 154 ASCVD events).
The mean follow-up time was 5.9±2.9 years (range: 3–144
months) and the ASCVD event rate was 5.4% or, by linear extrapolation, 9.2% in
10 years. There were 728 patients without a plaque; and 720, 687 and 707 patients
in the 1st, 2nd and 3rd TPA tertiles, respectively.
For the actual analysis, we
produced the following information: Table 1 shows
clinical baseline characteristics and cardiovascular risks of those with and
without a cardiovascular event. Compared to those without ASCVD, patients with MACE
and ASCVD as compared to absence of an ASCVD event were significantly more likely
to be male (92% and 94% respectively versus 60% (p <0.0001), older (55 and 55 versus
50 years, p <0.001) and smokers (56% and 47% versus 20%, p <0.00001). The lipid profile
in
those with ASCVD was less favourable, with higher triglycerides, higher total
and LDL cholesterol and lower HDL cholesterol. Mean TPA was 127 mm2
in MACE and 134 mm2 in ASCVD versus 39 mm2 in those
without ASCVD. Assessment with risk algorithms placed patients with ASCVD into
the moderate-risk category, while those without ASCVD were usually in the
low-risk category when assessed with PROCAM, SCORE and SCORE2.
Table 2 shows the discrimination of MACE and ASCVD
using area under the curve (AUC) for PROCAM, PROCAMcvd, SCORE, SCORE2,
SCORE2ptp and TPA. For the discrimination of MACEs, all AUCs were between 0.83
and 0.86 with significantly better discrimination for SCORE2ptp vs SCORE2 and
vs TPA. For the discrimination of ASCVD, we found PROCAM vs
PROCAMcvd p = 0.0002; PROCAM vs SCORE2PTP p = 0.0001; PROCAM vs TPA p = 0.0006;
PROCAMcvd vs SCORE2PTP p = 0.0008; PROCAMcvd vs TPA p = 0.0049; SCORE vs SCORE2PTP
p <0.0001; SCORE
vs TPA p = 0.0004; SCORE2 vs SCORE2ptp p <0.0001; SCORE2 vs TPA p = 0.0001;
all others p = non-significant. Figure S1 in the appendix shows the AUC for
ASCVD.
Table 2Area under the curve
(AUC) for MACEs and ASCVD using predictors of discrimination from risk algorithms,
ultrasound plaque imaging and post-test SCORE2 risk derived from TPA. MACE
denotes major adverse cardiovascular event (fatal or nonfatal stroke or AMI). ASCVD
denotes atherosclerotic cardiovascular disease (adding coronary bypass
grafting, coronary artery diseas e and percutaneous transluminal coronary
angioplasty to MACE). cvd denotes AMI and stroke assessed by the PROCAM risk
calculator, whereas PROCAM assesses the risk for AMI only. ptp denotes post-test
probability.
| |
MACE |
ASCVD |
| Variable |
AUC |
95% CI |
AUC |
95% CI |
| PROCAM |
0.83 |
0.819–0.847 |
0.83 |
0.811–0.839 |
| PROCAMcvd |
0.84 |
0.830–0.857 |
0.84 |
0.824–0.851 |
| SCORE |
0.83 |
0.814–0.842 |
0.82 |
0.809–0.838 |
| SCORE2 |
0.83 |
0.813–0.842 |
0.82 |
0.805–0.833 |
| SCORE2PTP |
0.86 |
0.846–0.872 |
0.87 |
0.861–0.885 |
| TPA |
0.83 |
0.815–0.843 |
0.88 |
0.865–0.890 |
Table S1 in the appendix shows the sensitivities and specificities of TPA tertiles
for detecting
MACE and ASCVD.
Table
S2a in the appendix shows the sensitivity and
specificity for detecting ASCVD for PROCAMcvd, SCORE, SCORE2, SCORE2ptp
intermediate and high risk or for TPA 2nd and 3rd tertile. For the
discrimination of intermediate risk, PROCAMcvd showed only a moderate sensitivity
(66%) compared to SCORE, SCORE2 and TPA (88–95%), while specificity was best
for PROCAMcvd (84%) and significantly lower for SCORE, SCORE2 and TPA (48–60%).
For the discrimination of high risk, PROCAMcvd, SCORE and SCORE2 showed only a
low sensitivity (18–31%) compared to SCOREptp and TPA (72–82%), while
specificity was best for PROCAMcvd, SCORE and SCORE 2 (95–98%) and
significantly lower for SCORE2ptp and TPA (78–79%). These results are shown in figure
1 (for ASCVD only).
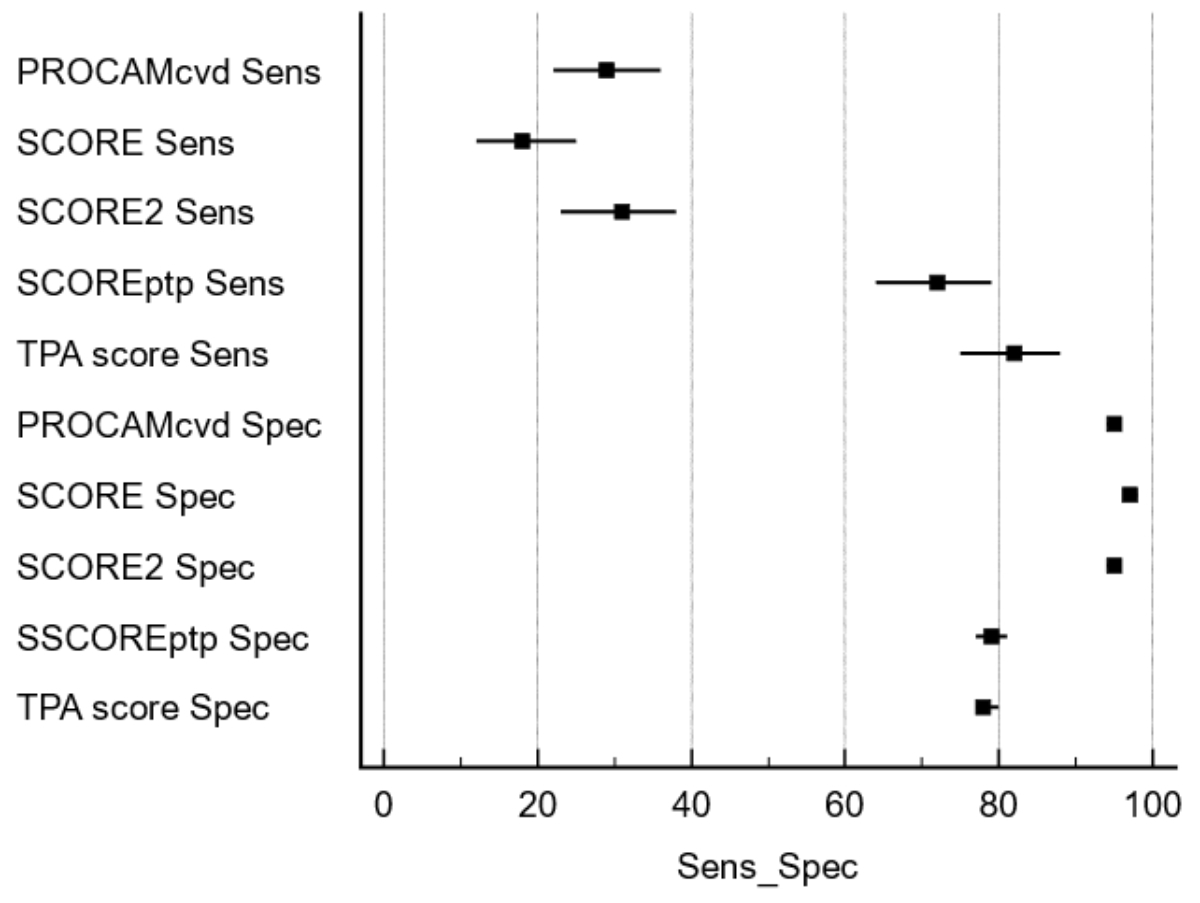
Figure 1Sensitivity and specificity of risk calculators for MACE. Risk
calculators have a sensitivity below 40% for detecting MACE, while specificity
is above 90%. With the inclusion of the TPA information, sensitivity is
improved to above 75%, while specificity is reduced to about 80%.
Table
S2b in the appendix shows the observed
MACE and ASCVD numbers stratified by risk category and risk assessment tools.
Compared to PROCAM, where 46% MACE and 49% ASCVD events were observed in the
low-risk category, such events occurred only rarely in people at low risk
defined by SCORE (12% and 10% respectively), by SCORE2 (7% and 12%), but in the
risk tools using TPA, only 5% events occurred. Only 19% of MACE and 20% of
ASCVD occurred in the PROCAM high-risk category, whereas almost all events
occurred in the 3rd tertile of TPA (74% and 82% respectively).
Table
3 shows a logistic regression
of the various risk prediction tools as a measure of model fit to determine
calibration. Goodness of fit was not significant regarding PROCAM, PROCAMcvd,
SCORE and SCORE2 for MACE and ASCVD outcomes. Only with the addition of carotid
plaque information derived from TPA did model fit become significant both for
MACE and ASCVD. Figure 2 shows
examples of the graphical representation of ASCVD using the Hosmer-Lemeshow
test for PROCAM, SCORE, SCORE2 and SCORE2ptp.
Table 3Model fit based on
logistic regression for MACE and ASCVD. MACE denotes major
adverse cardiovascular event (fatal or nonfatal stroke or AMI). ASCVD denotes
atherosclerotic cardiovascular disease (adding coronary bypass grafting,
coronary artery disease and percutaneous luminal coronary angioplasty to MACE).
cvd denotes AMI and stroke assessed by the PROCAM risk calculator, whereas
PROCAM assesses the risk for AMI only. ptp denotes post-test probability.
| Logistic regression coefficients and standard errors |
|
MACE |
ASCVD |
| Variable |
Coefficient |
Standard error |
Wald |
p |
Coefficient |
Standard error |
Wald |
p |
| PROCAM |
0.034396 |
0.10236 |
0.1129 |
0.7368 |
0.0093995 |
0.076332 |
0.01516 |
0.902 |
| PROCAMcvd |
–0.05124 |
0.10135 |
0.2556 |
0.6132 |
0.0038108 |
0.074856 |
0.002592 |
0.9594 |
| SCORE |
0.04495 |
0.094698 |
0.2253 |
0.635 |
–0.065648 |
0.080755 |
0.6609 |
0.4163 |
| SCORE2 |
0.049788 |
0.12904 |
0.1489 |
0.6996 |
–0.090538 |
0.096034 |
0.8888 |
0.3458 |
| SCORE2ptp |
0.093332 |
0.043528 |
4.5975 |
0.032 |
0.11324 |
0.031809 |
12.6732 |
0.0004 |
| TPA |
0.0054614 |
0.0021587 |
6.4007 |
0.0114 |
0.010778 |
0.0019269 |
31.2897 |
<0.0001 |
| Constant |
–5.68804 |
0.37657 |
228.1624 |
<0.0001 |
–4.65204 |
0.25037 |
345.2385 |
<0.0001 |

Figure 2Examples of the graphical representation of
ASCVD using the Hosmer-Lemeshow test for PROCAM, SCORE, SCORE2 and SCORE2ptp.
The straight line denotes the perfect match between observed and expected
probabilities (from a logistic regression model) and the Pearson chi-squared goodness-of-fit
test (p value) of HL (Hosmer-Lemeshow contingency table).
Table
4 shows a multivariate Cox proportional-hazards
model which included using a forward-step approach regarding clinical variables
(age, sex, family history, blood pressure, smoking and lipids) for the MACE and
the ASCVD outcome. For MACE, significant predictors were sex, smoking, family
history, blood pressure and intermediate or high post-test SCORE2 risk (which
includes results from TPA). For ASCVD, significant predictors were age, sex,
smoking, family history, cholesterol and intermediate or high post-test SCORE2
risk.
Table 4Cox proportional-hazards model using clinical
variables and post-test risk categories of SCORE2 for MACE and ASCVD. Sex_Code
denotes male or female. SMOKE-Code denotes the presence or absence of smoking. Fam_CODE
denotes the presence or absence of a premature cardiovascular event in the
patient’s family (father, mother, brothers, sisters having occurred below age
60). SCORE2ptpCODE
= 2 or = 3 denotes the 2nd and 3rd TPA tertiles.
| Coefficients and standard errors for MACE* |
| Covariate |
b |
SE |
Wald |
p |
Exp(b) |
95% CI of Exp(b) |
| Sex_Code |
–1.3707 |
0.5263 |
6.7825 |
0.0092 |
0.2539 |
0.0905–0.7124 |
| SMOKE_Code |
1.385 |
0.2688 |
26.555 |
<0.0001 |
3.9948 |
2.3589–6.7650 |
| Fam_Code |
0.6119 |
0.28 |
4.7776 |
0.0288 |
1.844 |
1.0652–3.1920 |
| Blood pressure |
0.03007 |
0.00739 |
16.5617 |
<0.0001 |
1.0305 |
1.0157–1.0456 |
| SCORE2ptpCode = 2 |
1.9595 |
0.639 |
9.4032 |
0.0022 |
7.096 |
2.0280–24.8292 |
| SCORE2ptpCode = 3 |
2.6139 |
0.6095 |
18.3925 |
<0.0001 |
13.6516 |
4.1341–45.0800 |
| Coefficients and standard errors for ASCVD** |
| Covariate |
b |
SE |
Wald |
P |
Exp(b) |
95% CI of Exp(b) |
| Age |
0.0563 |
0.01749 |
10.3575 |
0.0013 |
1.0579 |
1.0223–1.0948 |
| Sex_Code |
–1.4573 |
0.3141 |
21.5225 |
<0.0001 |
0.2329 |
0.1258–0.4310 |
| SMOKE_Code |
1.1289 |
0.1689 |
44.6811 |
<0.0001 |
3.0921 |
2.2208–4.3054 |
| Fam_Code |
0.6178 |
0.1718 |
12.9262 |
0.0003 |
1.8548 |
1.3244–2.5976 |
| CHOL |
0.1509 |
0.06055 |
6.2085 |
0.0127 |
1.1629 |
1.0327–1.3094 |
| SCORE2ptpCode = 2 |
1.9083 |
0.3942 |
23.4358 |
<0.0001 |
6.7419 |
3.1134–14.5994 |
| SCORE2ptpCode = 3 |
2.4088 |
0.409 |
34.6866 |
<0.0001 |
11.1204 |
4.9886–24.7892 |
Table
5 shows a multivariate Cox proportional-hazards
model which included risk algorithms (PROCAM, PROCAMcvd, SCORE, SCORE2) for
MACE and ASCVD. For MACE, significant predictors were the SCORE2 calculators
only. For ASCVD, significant predictors were PROCAMcvd and the SCORE/SCORE2
calculators.
Table 5Cox proportional-hazards model using risk
algorithms and post-test risk categories of SCORE2 for MACE and ASCVD.
Adjustments in Cox proportional hazards were made for risk tables (PROCAM,
PROCAMcvd, SCORE, SCORE2, SCORE2ptp). The coding of SCORE2ptp refers to 1 = low
to intermediate, 2 = high, 3 = very high risk.
| Coefficients
and standard errors for MACE* |
| Covariate |
b |
SE |
Wald |
p |
Exp(b) |
95% CI of Exp(b) |
| SCORE2 |
0.2506 |
0.03684 |
46.2794 |
<0.0001 |
1.2848 |
1.1953–1.3810 |
| SCORE2ptpCode
= 2 |
2.1516 |
0.6371 |
11.4043 |
0.0007 |
8.5989 |
2.4666–29.9769 |
| SCORE2ptpCode
= 3 |
2.1977 |
0.6374 |
11.8879 |
0.0006 |
9.0044 |
2.5816–31.4071 |
| Coefficients
and standard errors for ASCVD** |
| Covariate |
b |
SE |
Wald |
p |
Exp(b) |
95% CI of Exp(b) |
| PROCAMcvd |
0.01936 |
0.01077 |
3.2288 |
0.0724 |
1.0195 |
0.9982–1.0413 |
| SCORE |
–0.1455 |
0.06178 |
5.5499 |
0.0185 |
0.8646 |
0.7660–0.9758 |
| SCORE2 |
0.2397 |
0.0478 |
25.1415 |
<0.0001 |
1.2708 |
1.1572–1.3957 |
| SCORE2ptpCode
= 2 |
2.1097 |
0.3932 |
28.7926 |
<0.0001 |
8.2459 |
3.8156–17.8202 |
| SCORE2ptpCode
= 3 |
2.552 |
0.3892 |
42.9891 |
<0.0001 |
12.833 |
5.9843–27.5200 |
Figure
3 displays the adjusted Cox proportional-hazards
models as calculated in tables 4 and 5; figure S2 in the appendix shows a forest plot
of ASCVD-predicting
clinical variables.
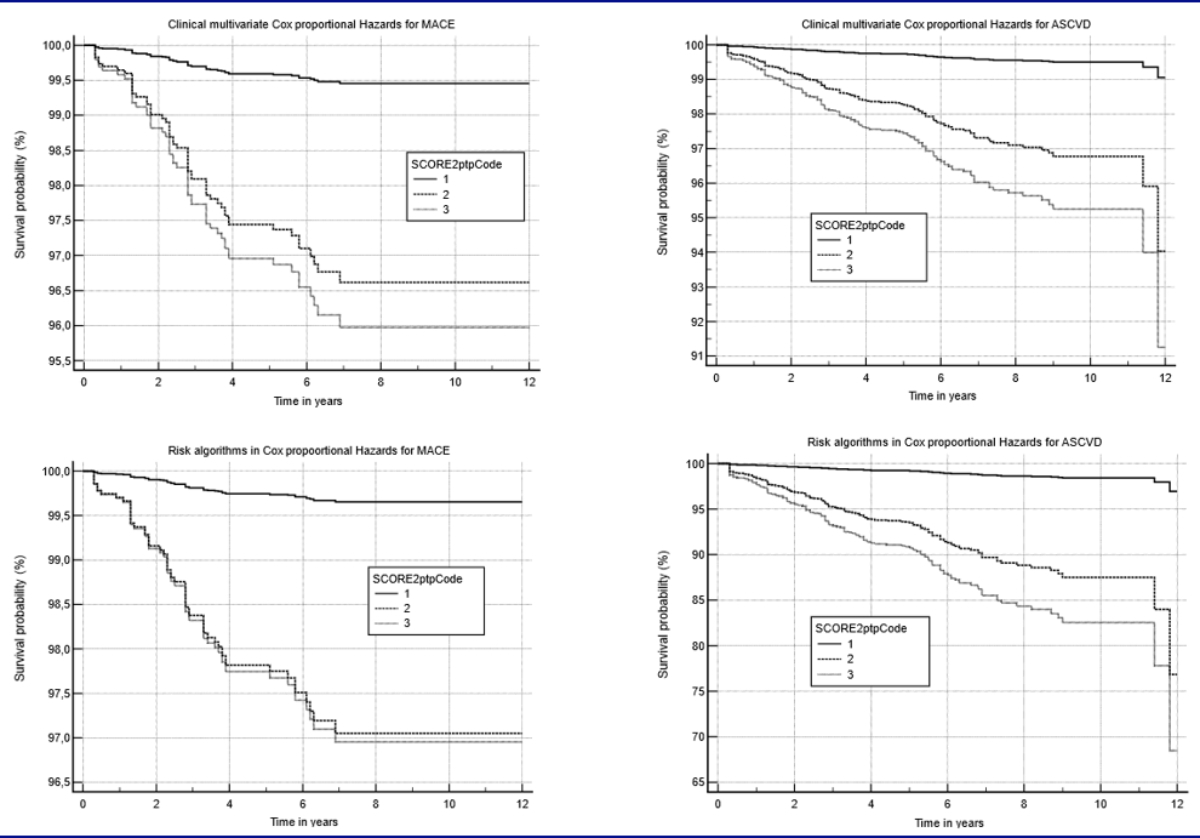
Figure 3Adjusted Cox proportional-hazards models for
MACE and ASCVD for SCORE2ptp. The two graphs on the left display the curves for
MACE, while the two graphs on the right display the curves for ASCVD.
Adjustments in Cox proportional hazards were made with clinical input variables
(age, sex, smoke, family history of ASCVD, blood pressure, total cholesterol,
HDL, LDL, triglycerides) and for risk tables (PROCAM, PROCAMcvd, SCORE, SCORE2,
SCORE2ptp). The coding of SCORE2ptp refers to 1 = low to intermediate, 2 = high,
3 = very high risk.
We performed net
reclassification improvement statistics for SCORE2ptp (table S3 in the appendix).
For MACE, net reclassification improvement was 24% (p = 0.01) and for ASCVD, net
reclassification improvement was 39% (p <0.00001).
Sensitivity analysis showed that, compared to the
whole group of patients (n = 5314), those with complete follow-up (n = 2842) were
comparable regarding sex (37% vs 36% women), mean age (50 vs 52 years), smoking
habit (21% vs 22%), blood pressure (126 vs 126 mm Hg), total cholesterol (6.0
vs 6.0 mmol/l), HDL (1.5 vs 1.5 mmol/l), LDL (3.7 vs 3.7 mmol/l), triglycerides
(1.6 vs 1.5 mmol/l) and TPA (42 vs 46 mm2).
Discussion
TPA added prognostic information to conventional risk
equations available for PROCAM, SCORE and FRAMINGHAM, confirming
previously published results. This supports the joint assessment of ASCVD risk
with carotid ultrasound in subjects aged 40–65 years [4]. We found this approach to
be cost-effective [13]; European guidelines support carotid
plaque imaging as an ASCVD risk modifier [14].
The major finding of this study is that adding the
information from carotid plaque ultrasound quantification using the TPA method
and associated sensitivities and specificities for post-test risk calculations
to SCORE2 (SCORE2ptp) resulted in a significant improvement of reclassification,
discrimination and calibration.
Regarding discrimination for MACE, SCORE2ptp was a
significantly better predictor with an AUC of 0.86 (p = 0.003) when compared to
SCORE and SCORE2 (table 2). For the prediction of ASCVD, discrimination with SCORE2ptp
and TPA (0.87 and 0.88, respectively) was significantly better than with risk
assessment tools not incorporating TPA. Furthermore, over 70% MACE and ASCVD
occurred in the high-risk group of SCORE2ptp and TPA (PROCAM 19% and 20%,
respectively; table S2b).
Reliability of discrimination is improved with TPA and
associated post-test risk in our study. Reliability of calibration is also
significantly improved using model fit (logistic regression model, table 3, figure
2). When TPA was used to define SCORE2ptp, we observed a significantly better
result in the Cox proportional-hazards model for MACE and ASCVD when compared
to PROCAM and SCORE (table 5, figure 3).
The SCORE2 algorithm is a major step forward in
cardiovascular risk prediction for two reasons: (1) lowering the risk threshold
for intermediate risk from 5.0% to 2.5% in subjects aged <50 years accounts
for the increased lifetime risk by expecting (with linear extrapolation) that
e.g. a risk of 4.0% in 10 years will translate into a risk of 12% in 30 years.
Therefore, apparently low-risk, as known from previous risk charts is not
trivial in younger age (2). The trade-off between poor sensitivity and high specificity
at the traditional <10% intermediate-risk threshold was lowered to <2.5%
in subjects aged below 50 years and to <5.0% in subjects aged 50–69 years, which
is now labelled in SCORE2 as the low or intermediate risk threshold (e.g.
avoiding a separate intermediate risk category) and which is expected to
increase sensitivity (desired preventive effect), but may decrease specificity
(unwanted effect because of treatment allocated to patients who will not
experience an event in 10 years). By increasing the perception of risk to 30
instead of 10 years, patients cannot become healthier (e.g. true-negatives will
remain true-negatives, if no event occurs: the number of true- negatives cannot
increase). However, events occurring in the period between 11–30 years will
change true-negatives into false-negatives. If we consider the situation with 50
true-positives, 50 false-positives, 50 false-negatives and 850 true-negatives,
then sensitivity is 50% and specificity is 94%, a situation traditionally known
from calculators such as PROCAM. Over 30 years, true-positives will occur in
150 rather than 50 patients, which reduces the number of true-negatives,
resulting in 750 true-negatives and 150 true-positives, which increases
sensitivity from 50% to 75% while specificity is preserved at 94% at an
increase of disease prevalence from 9% to 19%.
Thus, it may be argued that additional tests like TPA
may not be necessary with SCORE2. In order to test this hypothesis, we analysed
our cohort study data. First, we performed sensitivity and specificity analyses
and found that SCORE and SCORE2, when compared to PROCAM for detecting ASCVD at
the intermediate-risk threshold, was significantly higher for sensitivity, but
significantly lower for specificity and at the high-risk threshold results were
comparable for PROCAM, SCORE and SCORE2 regarding specificity. Therefore, the
higher sensitivity for SCORE2 when compared to PROCAM could be reproduced;
however, SCORE and SCORE2 sensitivity performance was very similar, and this
again is most likely due to the low threshold for intermediate risk in SCORE,
which was chosen to be 1.0% for cardiovascular mortality, instead of e.g. 2.5%.
Therefore, lower risk thresholds increase sensitivity while sacrificing specificity,
as expected and reproduced by our data.
Recently, a writing group by Johri et al. of the
American Society of Echocardiography (ASE) recommended against the use of TPA
for cardiovascular risk assessment, mainly due to the problem of correctly
identifying the best imaging plane of a plaque [15].
This view was contradicted by Spence et al. in a letter to the ASE in which
they highlighted the excellent reproducibility of the TPA method [8]. Furthermore,
TPA is a full carotid vessel measurement and the 3D approach recommended by the
ASE writing group for plaque quantification suffers from the recognised problem
of overlapping plaque images, whereby a plaque may be quantified twice.
Further, ASE recommended measurements of carotid intima-media thickness (CIMT)
even though CIMT measurement is even more dependent on the imaging plane than TPA
due to the small structures quantified and moreover does not reflect
atherosclerosis but “arterial injury” only [16].
ASE also recommended measurements of maximum plaque thickness, which is
problematic because it does not directly quantify total plaque burden of the
carotid arteries (e.g. two plaques might have different lengths but the same height,
so area and volume would be different). TPA has an excellent prognostic power,
as we have shown in our cohort study [4] and
in a review [17], is rapidly performed,
reproducible and can be tracked accurately over time. Available 3D technology
for the presence and volume of carotid plaque has also been tested with an
automated 3D probe in the Progression of Early Subclinical Atherosclerosis
Study [18]. The prevalence of carotid
plaques in men aged 50–54 years was 48%, whereas we found a prevalence of any
plaque of 86% and a prevalence of plaque with a total plaque area >21 mm2,
which corresponds to the 1st/2nd tertile cut-off, of 66% [4]. This apparent difference
is attributable
to two important technical differences. First, in the Progression of Early
Subclinical Atherosclerosis Study, carotid plaque volume was measured using the
Philips iU 22 ultrasound system equipped with a single-sweep volumetric VL 13–5
transducer, which only covers a volume of 38 mm × 30° of the carotid artery [19] and
visualises the distal part of the
common carotid artery, the bulb and the proximal parts of the internal carotid
artery [17]. Offline software then calculates
the plaque areas from all obtained cross-sectional images in order to determine
the total plaque volume (TPV), a time-consuming method when compared to TPA.
Since the field of view is only 38 mm × 30°, some plaques proximal or distal to
the transducer are missed and these plaques are included in the total plaque
area derived from longitudinal carotid images [20].
Second, a plaque definition of intima-media-thickness (IMT) greater than 1.5 mm
is likely to miss substantial amounts of atherosclerosis and associated
cardiovascular risk, as is known form IMT studies where risk substantially
increases with IMT >1.0 mm [21]. The
advantage of longitudinal plaque imaging (TPA technique) is its high
reproducibility [8, 22], vendor
independence (no additional costs for surface tracings) and the possibility of obtaining
results without additional software.
Statistical procedures should be introduced in order
to reclassify subjects not just based on presence / absence of plaques. Using TPA
tertiles and cardiovascular event outcomes, sensitivities and specificities are
evidence-based [4] and can be used to
calculate the post-test risk based upon the Bayes theorem [10]. Our observations indicate
that more than
30% of subjects aged 40–65 years can be reclassified using the pretest
calculator SCORE2 and our post-test risk calculations.
TPA is measured easily within the whole tree of the
carotid / subclavian arteries and does not require exposure of the inguinal region,
which may create a source of discomfort for examiners and patients. Since the TPA
measurement has been validated in numerous studies and the prognostic
significance of this measurement has been established [17], it is sufficient to first
sonicate the carotids in a
sequential test procedure. Based on our data, we suggest however to perform
additional imaging tests in subjects only if pretest risk is substantial (e.g.
SCORE2 risk >7.5%) and no carotid plaque is found. In this case, femoral,
subclavian, aortic arch, abdominal aorta plaque or coronary calcium may be used
to assess the presence of atherosclerosis. Usually, if atherosclerotic plaques
are detected by ultrasound, preventive therapy is indicated and further
diagnostic work-up with the Calcium Score is avoidable.
In contrast to the Calcium Score [23], TPA can track the effects of preventive
efforts over time, which is especially attractive and motivating for patients,
since good control of cardiovascular risk factors in patients with advanced
atherosclerosis is not only likely to reduce cardiovascular events [24] but also the
amount of TPA [25–27] and arterial age [4].
As reported in [4],
and addressing the limitations of our study, and similar to other studies [28, 29],
we were able to assess only a limited
number of follow-ups (82%), which rules out derivation of absolute risk.
However, limited number of follow-ups does not bias the relative
diagnostic power of risk markers and our sensitivity analysis makes a selection
bias unlikely. We were able to include only a limited number of women and a
limited number of cardiovascular events from the Olten centre; however,
previous studies have also assessed sufficiently high numbers of women and
found similar predictive strengths in women [17,
30]. Further, we did not use an independent outcome committee; however,
results of single risk factors
and risk estimators significantly detected events, therefore, misclassification
in our records is very unlikely.
SCORE2, like SCORE, performs well in categorising
patients with events as medium- or high-risk when compared to PROCAM.
Additional information regarding calibration and discrimination of SCORE2
compared to PROCAM and SCORE was small. The addition of the TPA-Bayes criterion
to SCORE2 as well as TPA itself outperformed risk models without incorporation
of TPA regarding MACE and ASCVD. TPA contains important clinical information
beyond SCORE2 and should be used jointly in order to allocate preventive
resources as soon and in as personalised a manner as possible.
Acknowledgments
Authors’
contributions: in
accordance with ICMJE guidelines, all 5 named individuals meet all 4 of the
stated criteria for authorship.
Michel
Romanens, MD
Vascular
Risk Foundation
Spitalstrasse 9
CH-4600
Olten
michel.romanens[at]hin.ch
References
1. Collaboration S working group and EC risk, Achenbach S, Aleksandrova K, Amiano P,
Sebastian D-S, Amouyel P, et al. SCORE2 risk prediction algorithms: new models to
estimate 10-year risk of cardiovascular disease in Europe. Eur Heart J. Oxford University
Press (OUP); 2021;42(25):2439–54.
2. Mach F, Baigent C, Catapano AL, Koskinas KC, Casula M, Badimon L, et al.; ESC Scientific
Document Group. 2019 ESC/EAS Guidelines for the management of dyslipidaemias: lipid
modification to reduce cardiovascular risk. Eur Heart J. 2020 Jan;41(1):111–88. 10.1093/eurheartj/ehz455
3. Conroy RM, Pyörälä K, Fitzgerald AP, Sans S, Menotti A, De Backer G, et al.; SCORE
project group. Estimation of ten-year risk of fatal cardiovascular disease in Europe:
the SCORE project. Eur Heart J. 2003 Jun;24(11):987–1003. 10.1016/S0195-668X(03)00114-3
4. Romanens M, Adams A, Sudano I, Bojara W, Balint S, Warmuth W, et al. Prediction of
cardiovascular events with traditional risk equations and total plaque area of carotid
atherosclerosis: The Arteris Cardiovascular Outcome (ARCO) cohort study. Prev Med.
2021 Jun;147:106525. 10.1016/j.ypmed.2021.106525
5. Assmann G, Schulte H, Seedorf U. Cardiovascular risk assessment in the metabolic syndrome:
results from the Prospective Cardiovascular Munster (PROCAM) Study. Int J Obes (Lond).
2008 May;32(S2 Suppl 2):S11–6. 10.1038/ijo.2008.29
6. Cordicare II Ethikkomissions Beschluss 122005S.
7. Romanens M, Mortensen MB, Sudano I, Szucs T, Adams A. Extensive carotid atherosclerosis
and the diagnostic accuracy of coronary risk calculators. Prev Med Rep. 2017 Mar;6:182–6.
10.1016/j.pmedr.2017.03.006
8. Azarpazhooh MR, Mathiesen E, Rundek T, Romanens M, Adams A, Armando L, et al. Reliability,
reproducibility and advantages of measuring carotid total plaque area. J Am Soc Echocardiogr.
2022 May;35(5):530–2. 10.1016/j.echo.2021.12.016
9. Voss R, Cullen P, Schulte H, Assmann G. Prediction of risk of coronary events in middle-aged
men in the Prospective Cardiovascular Münster Study (PROCAM) using neural networks.
Int J Epidemiol. 2002 Dec;31(6):1253–62. 10.1093/ije/31.6.1253
10. Romanens M, Ackermann F, Spence JD, Darioli R, Rodondi N, Corti R, et al. Improvement
of cardiovascular risk prediction: time to review current knowledge, debates, and
fundamentals on how to assess test characteristics. Eur J Cardiovasc Prev Rehabil.
2010 Feb;17(1):18–23. 10.1097/HJR.0b013e3283347059
11. DeLong ER, DeLong DM, Clarke-Pearson DL. Comparing the areas under two or more correlated
receiver operating characteristic curves: a nonparametric approach. Biometrics. 1988 Sep;44(3):837–45.
10.2307/2531595
12. Melander O, Newton-Cheh C, Almgren P, Hedblad B, Berglund G, Engström G, et al. Novel
and conventional biomarkers for prediction of incident cardiovascular events in the
community. JAMA. 2009 Jul;302(1):49–57. 10.1001/jama.2009.943
13. Romanens M, Adams A, Bojara W, Balint S, Warmuth W. Cost-effectiveness analysis of
statins in primary care: results from the Arteris cohort study. Swiss Med Wkly. 2021 Apr;151(1516):w20498.
10.4414/smw.2021.20498
14. Visseren F. Mach Francois, Smulders Yvo, Carballo David, Koskina Konstantinos et al.
2021 ESC Guidelines on cardiovascular diseaseprevention in clinical practice. Konstantinos
P Tsioufis [Internet]. Bryan Williams; [cited 2022 Nov 26];5. Available from: https://academic.oup.com/eurheartj/advance-article/doi/10.1093/eurheartj/ehab484/6358713
15. Johri AM, Nambi V, Naqvi TZ, Feinstein SB, Park MM, Becher H, et al. Recommendations
for the Assessment of Carotid Arterial Plaque by Ultrasound for the Characterization
of Atherosclerosis and Evaluation of Cardiovascular Risk: From the American Society
of Echocardiography (in press). J Am Soc Echocardiogr. 2020;27713(8):1–17. 10.1016/j.echo.2020.04.021
16. Raggi Paolo, Stein James H. Carotid intima-media thickness should not be referred
to as subclinical atherosclerosis: A recommended update to the editorial policy at
Atherosclerosis. Atherosclerosis. Elsevier BV; 2020 Sep;
17. Romanens M, Sudano I, Adams A, Schober EA. Sonographic assessment of carotid atherosclerosis:
preferred risk indicator for future cardiovascular events? Swiss Med Wkly. 2019 Dec;149:w20142.
10.4414/smw.2019.20142
18. Fernández-Friera L, Peñalvo JL, Fernández-Ortiz A, Ibañez B, López-Melgar B, Laclaustra M,
et al. Prevalence, Vascular Distribution, and Multiterritorial Extent of Subclinical
Atherosclerosis in a Middle-Aged Cohort: The PESA (Progression of Early Subclinical
Atherosclerosis) Study. Circulation. 2015 Jun;131(24):2104–13. 10.1161/CIRCULATIONAHA.114.014310
19. Philips MS. VL13-5 transducer with specifications. [Internet]. Available from: https://www.usa.philips.com/healthcare/product/HC989605409591/vl13-5-broadband-linear-volume-array-transducer
20. Spence JD, Eliasziw M, DiCicco M, Hackam DG, Galil R, Lohmann T. Carotid plaque area:
a tool for targeting and evaluating vascular preventive therapy. Stroke. 2002 Dec;33(12):2916–22.
10.1161/01.STR.0000042207.16156.B9
21. Prati P, Tosetto A, Vanuzzo D, Bader G, Casaroli M, Canciani L, et al. Carotid intima
media thickness and plaques can predict the occurrence of ischemic cerebrovascular
events. Stroke. 2008 Sep;39(9):2470–6. 10.1161/STROKEAHA.107.511584
22. David Spence J. The importance of distinguishing between diffuse carotid intima-media
thickening and focal plaque. Can J Cardiol. 2008;24:61C–4C. 10.1016/S0828-282X(08)71041-9
23. Schmermund A, Achenbach S, Budde T, Buziashvili Y, Förster A, Friedrich G, et al. Effect
of intensive versus standard lipid-lowering treatment with atorvastatin on the progression
of calcified coronary atherosclerosis over 12 months: a multicenter, randomized, double-blind
trial. Circulation. 2006 Jan;113(3):427–37. 10.1161/CIRCULATIONAHA.105.568147
24. Adams A, Bojara W, Romanens M. Effect of Statin Treatment in Patients With Advanced
Carotid Atherosclerosis: An Observational Outcome Study. Cardiol Res. 2021 Dec;12(6):335–9.
10.14740/cr1318
25. Spence JD, Hackam DG, Spence D, Hackam DG, Spence JD, Hackam DG. Treating arteries
instead of risk factors: a paradigm change in management of atherosclerosis. Stroke.
2010 Jun;41(6):1193–9. 10.1161/STROKEAHA.110.577973
26. Herder M, Arntzen KA, Johnsen SH, Eggen AE, Mathiesen EB. Long-term use of lipid-lowering
drugs slows progression of carotid atherosclerosis: the Tromso study 1994 to 2008.
Arterioscler Thromb Vasc Biol. 2013 Apr;33(4):858–62. 10.1161/ATVBAHA.112.300767
27. Sturlaugsdottir R, Aspelund T, Bjornsdottir G, Sigurdsson S, Thorsson B, Eiriksdottir G,
et al. Predictors of carotid plaque progression over a 4-year follow-up in the Reykjavik
REFINE-study. Atherosclerosis. 2018 Feb;269:57–62. 10.1016/j.atherosclerosis.2017.12.005
28. Belcaro G, Nicolaides AN, Ramaswami G, Cesarone MR, De Sanctis M, Incandela L, et
al. Carotid and femoral ultrasound morphology screening and cardiovascular events
in low risk subjects: a 10-year follow-up study (the CAFES-CAVE study(1)). Atherosclerosis.
2001 Jun;156(2):379–87. 10.1016/S0021-9150(00)00665-1
29. Baber U, Mehran R, Sartori S, Schoos M, Falk E, Sillesen H, et al. Detection and Impact
of Subclinical Coronary and Carotid Atherosclerosis on Cardiovascular Risk Prediction
and Reclassification in Asymptomatic Us Adults: Insights From the High Risk Plaque
Bioimage Study. J Am Coll Cardiol. 2014;63(12):A998. 10.1016/S0735-1097(14)60998-0
30. Brunner FJ, Waldeyer C, Ojeda F, Salomaa V, Kee F, Sans S, et al.; Multinational Cardiovascular
Risk Consortium. Application of non-HDL cholesterol for population-based cardiovascular
risk stratification: results from the Multinational Cardiovascular Risk Consortium.
Lancet. 2019 Dec;394(10215):2173–83. 10.1016/S0140-6736(19)32519-X
Appendix
Table S1Sensitivities and specificities of TPA
tertiles for detecting MACE and ASCVD, respectively. Plaque area: <22 mm2, 22–61 mm2, ≥62 mm2
in 1st, 2nd, 3rd tertile.
| |
Criterion |
Sensitivity |
95% CI |
Specificity |
95% CI |
| MACE, TPA tertiles |
≥0 |
100% |
93.7–100.0% |
0% |
0.0–0.1% |
| >0 |
98.25% |
90.6–100.0% |
26.1% |
24.5–27.8% |
| >1 |
94.74% |
85.4–98.9% |
50.74% |
48.9–52.6% |
| >2 |
73.68% |
60.3–84.5% |
76.12% |
74.5–77.7% |
| >3 |
0% |
0.0–6.3% |
100% |
99.9–100.0% |
| ASCVD, TPA tertiles |
≥0 |
100% |
97.6–100.0% |
0% |
0.0–0.1% |
| >0 |
98.7% |
95.4–99.8% |
27.01% |
25.3–28.7% |
| >1 |
95.45% |
90.9–98.2% |
52.42% |
50.5–54.3% |
| >2 |
81.82% |
74.8–87.6% |
78.39% |
76.8–79.9% |
| >3 |
0% |
0.0–2.4% |
100% |
99.9–100.0% |
Table S2aSensitivity
(SENS) and specificity (SPEC) of risk categories for intermediate or high ASCVD
risk.
| |
Cut-off for intermediate
risk |
Cut-off for high risk |
| Risk tool |
SENS, 95% CI |
SPEC, 95% CI |
SENS, 95% CI |
SPEC, 95% CI |
| PROCAMcvd |
65.58% |
57.5–73.0% |
83.74% |
82.3–85.1% |
28.57% |
21.6–36.4% |
95.09% |
94.2–95.9% |
| SCORE |
89.61% |
83.7–93.9% |
59.56% |
57.7–61.4% |
18.18% |
12.4–25.2% |
97.66% |
97.0–98.2% |
| SCORE2 |
88.31% |
82.2–92.9% |
47.73% |
45.8–49.6% |
30.52% |
23.4–38.4% |
95.09% |
94.2–95.9% |
| SCORE2ptp |
94.81% |
90.0–97.7% |
55.88% |
54.0–57.8% |
72.08% |
64.3–79.0% |
78.98% |
77.4–80.5% |
| TPA score |
95.45% |
90.9–98.2% |
52.42% |
50.5–54.3% |
81.82% |
74.8–87.6% |
78.39% |
76.8–79.9% |
Table 2bObserved
MACE and ASCVD by risk category (low, medium, high) and risk assessment tool
(PROCAM, SCORE, SCORE2, SCORE2ptp, TPA tertiles).
| |
All |
MACE |
% |
|
ASCVD |
% |
| Risk tool |
n = |
57 (2.0%) |
100% |
n = |
154 (5.4%) |
100 |
| PROCAM low |
2439 |
26 (1.1%) |
46% |
2439 |
76 (3.1%) |
49% |
| PROCAM med |
288 |
20 (6.9%) |
35% |
288 |
47 (16.3%) |
31% |
| PROCAM high |
115 |
11 (9.6%) |
19% |
115 |
31 (27.0%) |
20% |
| SCORE low |
1617 |
7 (0.4%) |
12% |
1617 |
16 (1.0%) |
10% |
| SCORE med |
1134 |
34 (3.0%) |
60% |
1134 |
110 (9.7%) |
71% |
| SCORE high |
91 |
16(17.6%) |
28% |
91 |
28 (30.8%) |
18% |
| SCORE2 low to intermediate |
1301 |
4 (0.3%) |
7% |
1301 |
18 (1.4%) |
12% |
| SCORE2 high |
1295 |
26 (2.0%) |
46% |
1295 |
79 (6.1%) |
58% |
| SCORE2 very high |
246 |
27(11.0%) |
47% |
246 |
57 (23.2%) |
31% |
| SCORE2ptp low to intermediate |
1510 |
3 (0.2%) |
5% |
1510 |
8 (0.5%) |
5% |
| SCORE2 high |
427 |
6 (1.4%) |
11% |
427 |
15 (3.5%) |
10% |
| SCORE2 very high |
905 |
48 (5.3%) |
84% |
905 |
131 (14.5%) |
85% |
| TPA 0–1 |
688 |
2 (0.3%) |
4% |
688 |
5(0.7%) |
3% |
| TPA 2 |
719 |
12 (1.7%) |
21% |
719 |
21 (2.9%) |
14% |
| TPA 3 |
707 |
42 (5.9%) |
74% |
707 |
126 (17.8%) |
82% |
Table S3Net
reclassification improvement for ASCVD and MACE with SCORE2ptp as compared to
SCORE2 risk categories (low or intermediate, high, very high).
| MACE |
Moving up |
Moving down |
| EVENT |
25 |
3 |
| NO EVENT |
963 |
558 |
| Net reclassification improvement |
24.05% |
|
| Standard error |
9.39% |
|
| Z statistic |
2.56 |
|
| p value |
0.0104 |
|
| ASCVD |
Moving up |
Moving down |
| EVENT |
85 |
5 |
| NO EVENT |
903 |
556 |
| Net reclassification improvement |
39.03% |
|
| Standard error |
6.32% |
|
| Z statistic |
6.17 |
|
| p value |
0.00000000066 |
|
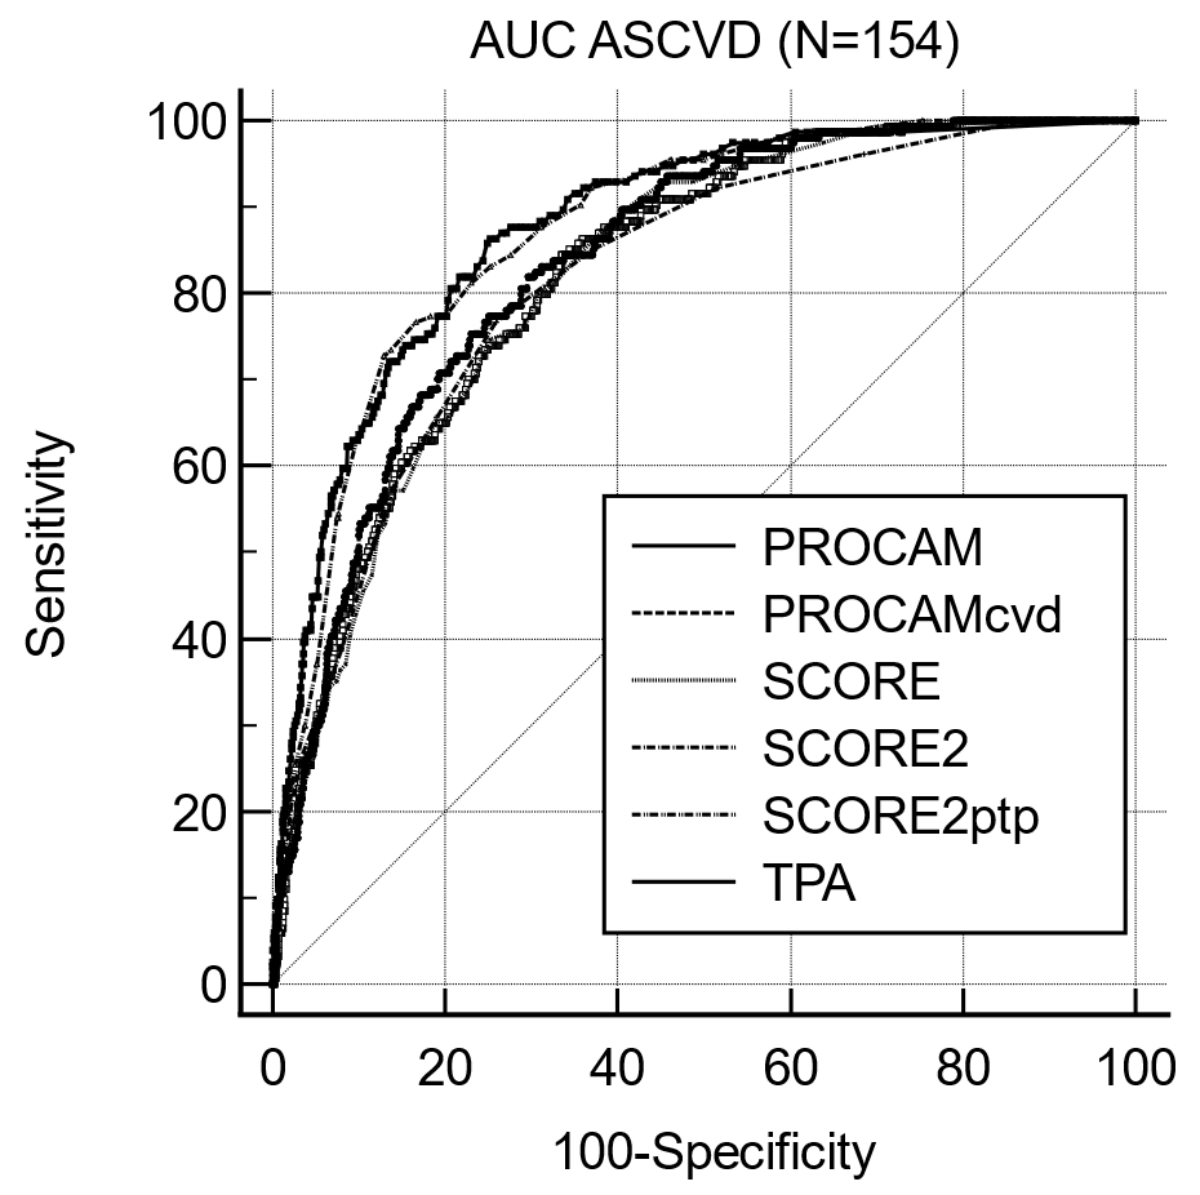
Figure S1Area under the curve (AUC) for ASCVD
using discrimination predictors from risk algorithms (PROCAM, SCORE), from
ultrasound imaging (TPA) and from post-test risk (SCORE2ptp).
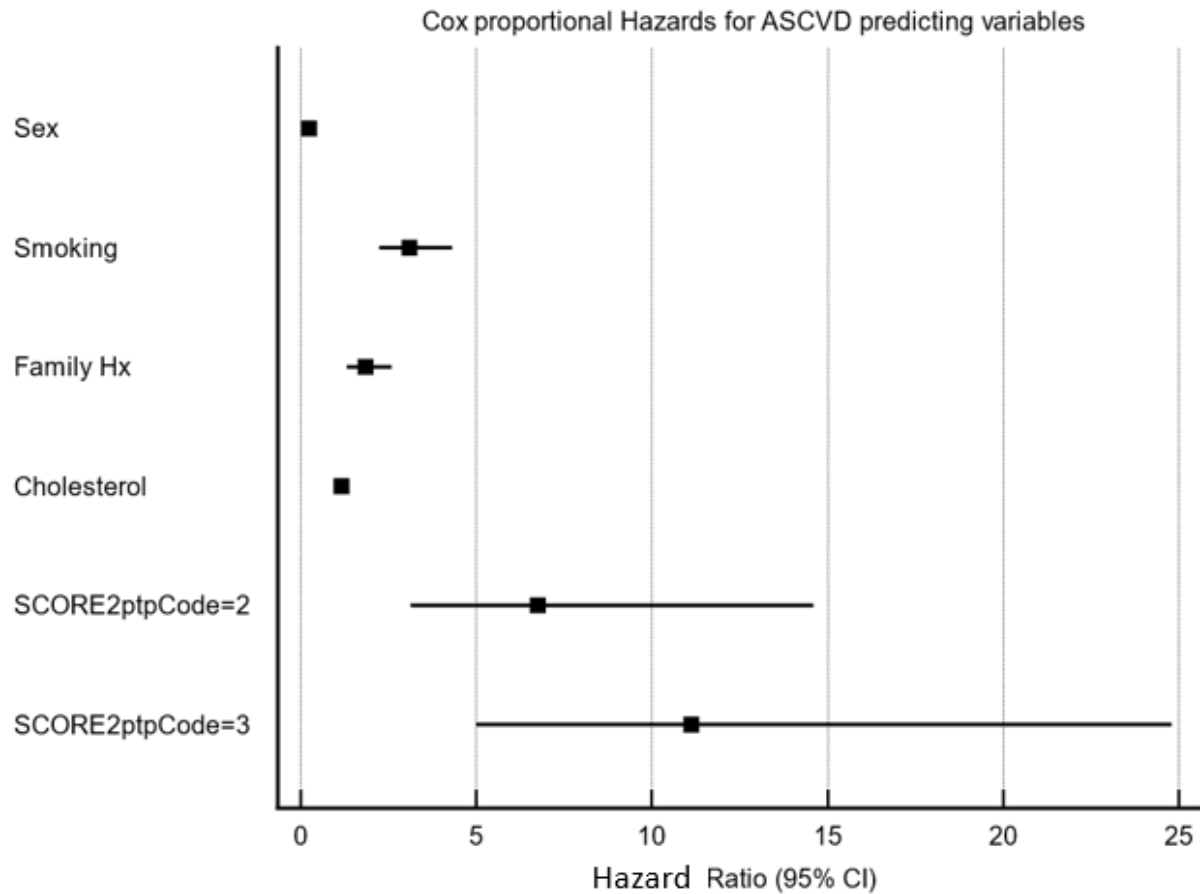
Figure S2Forest plot of ASCVD hazard ratios and 95% CIs
predicted by clinical variables and post-test risk categories based on TPA and
SCORE2 (source: table 5).