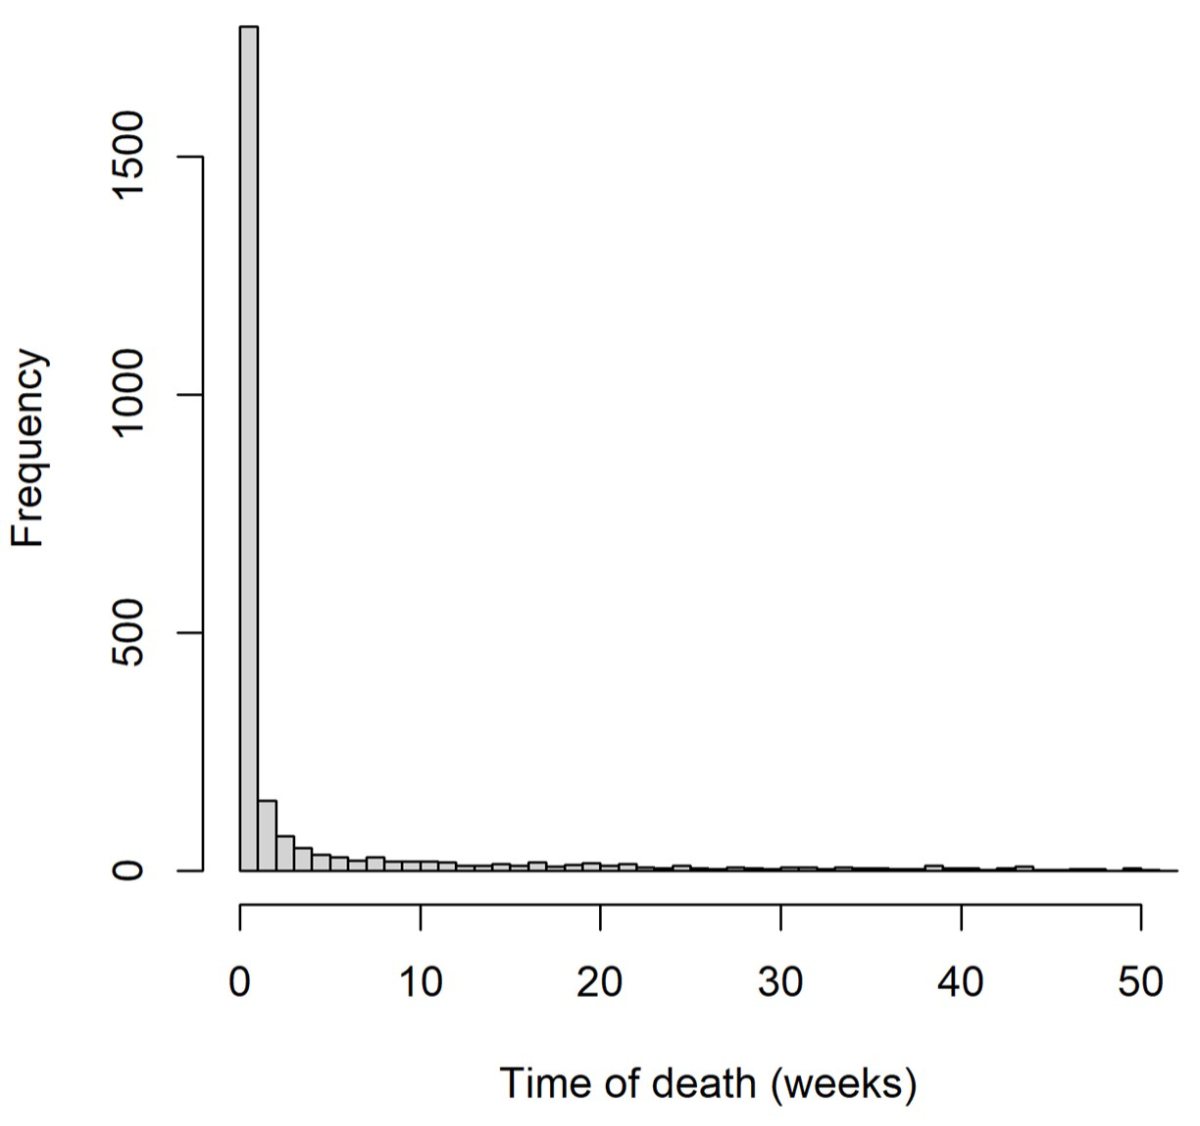
Figure 1Distribution of time to death among all infant deaths in 2011–2018 registered in Switzerland.
DOI: https://doi.org/10.57187/s.3682
Switzerland has comparatively high neonatal and infant mortality rates. The Global Burden of Disease Study reported for 2019 a neonatal mortality rate of 2.57 per 1000 live births for Switzerland [1]. Among high-income countries, only the United States (US), Greenland, Canada and some southern Latin American countries rated worse. In Western Europe, average neonatal mortality was 2.00 per 1000 live births. While the United Kingdom (UK) and Malta were roughly comparable to Switzerland, all neighbouring countries (Austria, France, Germany and Italy) reported rates around or below 2.00 per 1000 live births. Since Switzerland has a high overall standard of living, universal healthcare with compulsory health insurance, high government expenditure on health [2] and ranks well on other health indicators such as life expectancy [3], the rates are surprising.
Social and regional inequalities in health – health variations not explained by genetic or constitutional factors – highlight the extent of avoidable ill health in a society and show possibilities for better healthcare with more equitable distribution of resources. We previously reported significant spatial variations of birth weight and gestational age in Switzerland, which were mainly explained by language region, along with urbanisation, parental nationality, civil status and altitude [4]. Other studies from Switzerland – focused on parental income and migrant status – showed increased mortality among infants of parents with low incomes, yet reduced risks if mothers originated from European Union or European Free Trade Association countries compared with Swiss-born mothers [5, 6]. Until now, other social and regional determinants of infant mortality have remained uninvestigated in Switzerland.
We describe neonatal and infant mortality for infants born in Switzerland between 2011 and 2018 and examine associations of mortality rates with parental sociodemographic informations, regional factors and socioeconomic position.
We used data from the longitudinal dataset of the Swiss National Cohort, which consists of information from the live birth and mortality register and from census and structural surveys which had been deterministically linked using encrypted Swiss social security numbers as unique national identifiers [7, 8]. We linked all deaths from the death register with corresponding live births in the live birth register.
Within the Swiss National Cohort dataset, our study used information on all live births from 1 January 2011 to 31 December 2018 and followed up until either death, emigration from Switzerland or survival to 1 year, whichever occurred first. We defined neonatal death as death within 28 days and infant death as any death within 365 days after live birth. We defined neonatal mortality rate as the proportion of all neonatal deaths to all live births and infant mortality rate as the proportion of all infant deaths to all live births.
We first identified variables previously established as important predictors of early mortality or as potential confounders between socioeconomic position (SEP) and early mortality [9–13]. We included neonatal- and pregnancy-related variables, such as newborn sex, multiple birth (singletons, twins, etc), birth rank (sibling order from the same mother), gestational age and birth weight. Parental sociodemographic factors included parental age, nationality, education, maternal civil status, place of residence and religion. Regional factors included urbanisation level and language region. We recorded socioeconomic position using the Swiss neighbourhood index of socioeconomic position (Swiss-SEP index) – an area-based socioeconomic measure of maternal residence [14]. In the appendix, supplementary text S1 describes the Swiss-SEP index, data sources and definitions of variables.
We calculated crude neonatal and infant mortality rates – among all eligible live births and across levels of variables – including Swiss-SEP index quintiles. To better understand relationships between socioeconomic position indicators, we plotted binary relationships between the socioeconomic position index and other predictors. To assess the effect of sociodemographic and other determinants on mortality, we fitted Poisson regression models [15] with robust standard errors.
We excluded observations with missing values for any used predictors from analyses. For unmarried parents in Switzerland, fathers often register long after birth; therefore, for children who died early, paternal information was more likely missing (missing not at random); thus, we excluded it from our analyses. Further, we did not adjust for gestational age and birth weight since they possibly reside on causal pathways between socioeconomic position and child mortality. Adjustment for intermediate variables that have common causes with outcome (e.g. maternal smoking, alcohol consumption, maternal medical conditions, etc) is discouraged as it may introduce bias [16–18]. We included all remaining predictors in our main model, except maternal education and religion. In a second model, we included maternal education; in a third model, maternal religion. All models were fitted to subsets with available information. All variables were categorical except for maternal age, which we modelled by quadratic spline with a knot at age 30. For categorical variables, we calculated adjusted mortality rate ratios (aRR) and 95% confidence intervals using robust standard errors. For maternal age, we additionally calculated RR and bootstrap (percentile) confidence intervals at selected ages, using a bootstrap method with 100 samples. We performed all analyses in statistical software R, version 4.1.1 [19], using packages lme4 (v.1.1-34), splines (v.4.3.1), lmtest (v.0.9-40), sandwich (v.3.1-0), Epi (v.2.48), dplyr (v.1.1.2), gtsummary (v1.7.2) and forestplotter (v.1.1.1).
We conducted two sensitivity analyses to test the robustness of the main model, one including only singleton births (comparability with other studies) and one adding a sixth socioeconomic position category for missing values to compare risk of death in the otherwise excluded group. Women with missing socioeconomic position have missing information on residency, which may indicate mothers of recent migration background, asylum seekers, women with unstable home situations or other difficult situations. Observations with missing values for maternal nationality remained excluded (see text S1 in the appendix).
The Swiss National Cohort has been approved by the Ethics Committee of the Canton of Bern (Switzerland).
From January 2011 to December 2018, among 684,716 live births registered in Switzerland, 352,003 (51.4%) were male; 24,440 (3.6%) twins; 682 (0.1%) triplets; and 23 (0.03‰) quadruplets (table 1). Most infant deaths occurred during the first week of life (figure 1). Mean maternal age at birth was 31.4 (standard deviation 6.2) years. Most mothers (77.2%) were married or in registered partnerships; 959 (0.1%) younger than age 18 at delivery; and 2385 (0.4%) aged 45 or older. Most mothers (60.3%) were Swiss nationals, one-third (29.7%) were from other European countries (7.8% from Southern Europe; 12.0% from other countries in the European Economic Area [EEA]; and 9.9% from Non-EEA European countries) and one-tenth (9.9%) from non-European countries.
Table 1Population characteristics of all live births, number of neonatal and infant deaths, and respective mortality rates in Switzerland in years 2011–2018. Characteristics of live births are presented as n and column %, unless otherwise stated. Neonatal and infant deaths are presented as n and mortality rate which is defined as number of neonatal or infant deaths per 1000 live births.
| Predictor | Live births | Neonatal deaths | Infant deaths | |
| n (%) | n (mortality rate per 1000 live births) | n (mortality rate per 1000 live births) | ||
| Total | 684,716 (100%) | 2042 (3.0) | 2545 (3.7) | |
| Sex | Female | 332,713 (48.6%) | 930 (2.8) | 1139 (3.4) |
| Male | 352,003 (51.4%) | 1122 (3.2) | 1406 (4.0) | |
| Multiple birth | Singletons | 659,571 (96.3%) | 1681 (2.5) | 2148 (3.3) |
| Twins | 24,440 (3.6%) | 318 (13.0) | 348 (14.2) | |
| Triplets | 682 (0.1%) | 36 (52.8) | 42 (61.6) | |
| Quadruplets | 23 (0.03‰) | 7 (304.3) | 7 (304.3) | |
| Birth rank | 1st | 333,832 (48.8%) | 982 (2.9) | 1197 (3.6) |
| 2nd | 251,570 (36.7%) | 713 (2.8) | 903 (3.6) | |
| 3rd | 77,222 (11.3%) | 260 (3.4) | 324 (4.2) | |
| ≥4th | 22,092 (3.2%) | 87 (3.9) | 121 (5.5) | |
| Marital status of mother | Married* | 528,890 (77.2%) | 1428 (2.7) | 1808 (3.4) |
| Unmarried | 155,826 (22.8%) | 614 (3.9) | 737 (4.7) | |
| Age of mother (years) | mean (SD) | 31.4 (6.2) | ||
| <18 | 959 (0.1%) | 8 (8.3) | 10 (10.4) | |
| 18–21 | 9168 (1.3%) | 38 (4.1) | 46 (5.0) | |
| 21–25 | 50,830 (7.4%) | 148 (2.9) | 210 (4.1) | |
| 25–30 | 174,852 (25.5%) | 497 (2.8) | 628 (3.6) | |
| 30–35 | 259,543 (37.9%) | 724 (2.8) | 878 (3.4) | |
| 35–40 | 154,235 (22.5%) | 476 (3.1) | 579 (3.8) | |
| 40–45 | 32,744 (4.8%) | 133 (4.1) | 171 (5.2) | |
| ≥45 | 2385 (0.4%) | 18 (7.5) | 23 (9.6) | |
| Nationality of mother** | Switzerland | 412,652 (60.3%) | 1148 (2.8) | 1428 (3.5) |
| Southern Europe | 53,580 (7.8%) | 128 (2.4) | 168 (3.1) | |
| EEA Europe | 82,433 (12.0%) | 252 (3.1) | 301 (3.7) | |
| Non-EEA Europe | 67,932 (9.9%) | 246 (3.6) | 299 (4.4) | |
| Other HIC | 7542 (1.1%) | 21 (2.8) | 28 (3.7) | |
| Other | 59,991 (8.8%) | 239 (4.0) | 313 (5.2) | |
| Missing | 586 (0.1%) | 8 (13.7) | 8 (3.7) | |
| Religion of mother | Protestant | 133,578 (19.5%) | 353 (2.6) | 433 (3.2) |
| Catholic | 216,868 (31.7%) | 568 (2.6) | 723 (3.3) | |
| Other religion | 144,972 (21.2%) | 494 (3.4) | 625 (4.3) | |
| No religion | 94,368 (13.8%) | 190 (2.0) | 238 (2.5) | |
| Missing | 94,930 (13.9%) | 437 (4.6) | 526 (5.5) | |
| Education of mother | Compulsory or less | 33,898 (5.0%) | 121 (3.6) | 158 (4.7) |
| Secondary | 105,262 (15.4%) | 299 (2.8) | 380 (3.6) | |
| Tertiary | 103,802 (15.2%) | 275 (2.6) | 337 (3.2) | |
| Missing | 441,754 (64.5%) | 1347 (3.0) | 1670 (3.8) | |
| Area-based socioeconomic position | 1st quintile (lowest) | 160,635 (23.5%) | 483 (3.0) | 612 (3.8) |
| 2nd quintile | 136,586 (19.9%) | 426 (3.1) | 546 (4.0) | |
| 3rd quintile | 132,950 (19.4%) | 392 (2.9) | 498 (3.7) | |
| 4th quintile | 130,101 (19.0%) | 387 (3.0) | 470 (3.6) | |
| 5th quintile (highest) | 119,910 (17.5%) | 331 (2.8) | 394 (3.3) | |
| Missing | 4534 (0.7%) | 23 (5.1) | 25 (5.5) | |
| Urban level | Urban | 242,605 (35.4%) | 723 (3.0) | 905 (3.7) |
| Peri-urban | 293,615 (42.9%) | 907 (3.1) | 1127 (3.8) | |
| Rural | 148,496 (21.7%) | 412 (2.8) | 513 (3.5) | |
| Language region | German | 484,013 (70.7%) | 1559 (3.2) | 1887 (3.9) |
| French | 175,490 (25.6%) | 429 (2.4) | 585 (3.3) | |
| Italian | 25,213 (3.7%) | 54 (2.1) | 73 (2.9) | |
EEA: European Economic Area; SD: standard deviation
* Includes registered partnerships.
** The list of countries in each category is provided in table S1 in the appendix. Explanation of categories: EEA Europe: other countries in the European Economic Area; Non-EEA Europe: European countries not in the EEA; Other HIC: non-European high-income countries with low national infant mortality.
Figure 1Distribution of time to death among all infant deaths in 2011–2018 registered in Switzerland.
The lowest SEP quintile was slightly overrepresented (23.5%); the highest quintile underrepresented (17.5%). Swiss-SEP index was associated with the proportion of multiple births (A), maternal education (C), maternal nationality (D) and language region (E), and inversely associated with proportion of teenage pregnancies (B) yet not marital status (F) (figure 2). Mothers with missing socioeconomic position (n = 4534; 0.7%) were quite different from the main sample (figure S2), especially in terms of nationality (41% outside Europe, only 4% Swiss), percentage of teenage pregnancies (3.5% compared to <1% in the main sample) and unmarried proportion (34% vs 23% in the main sample).
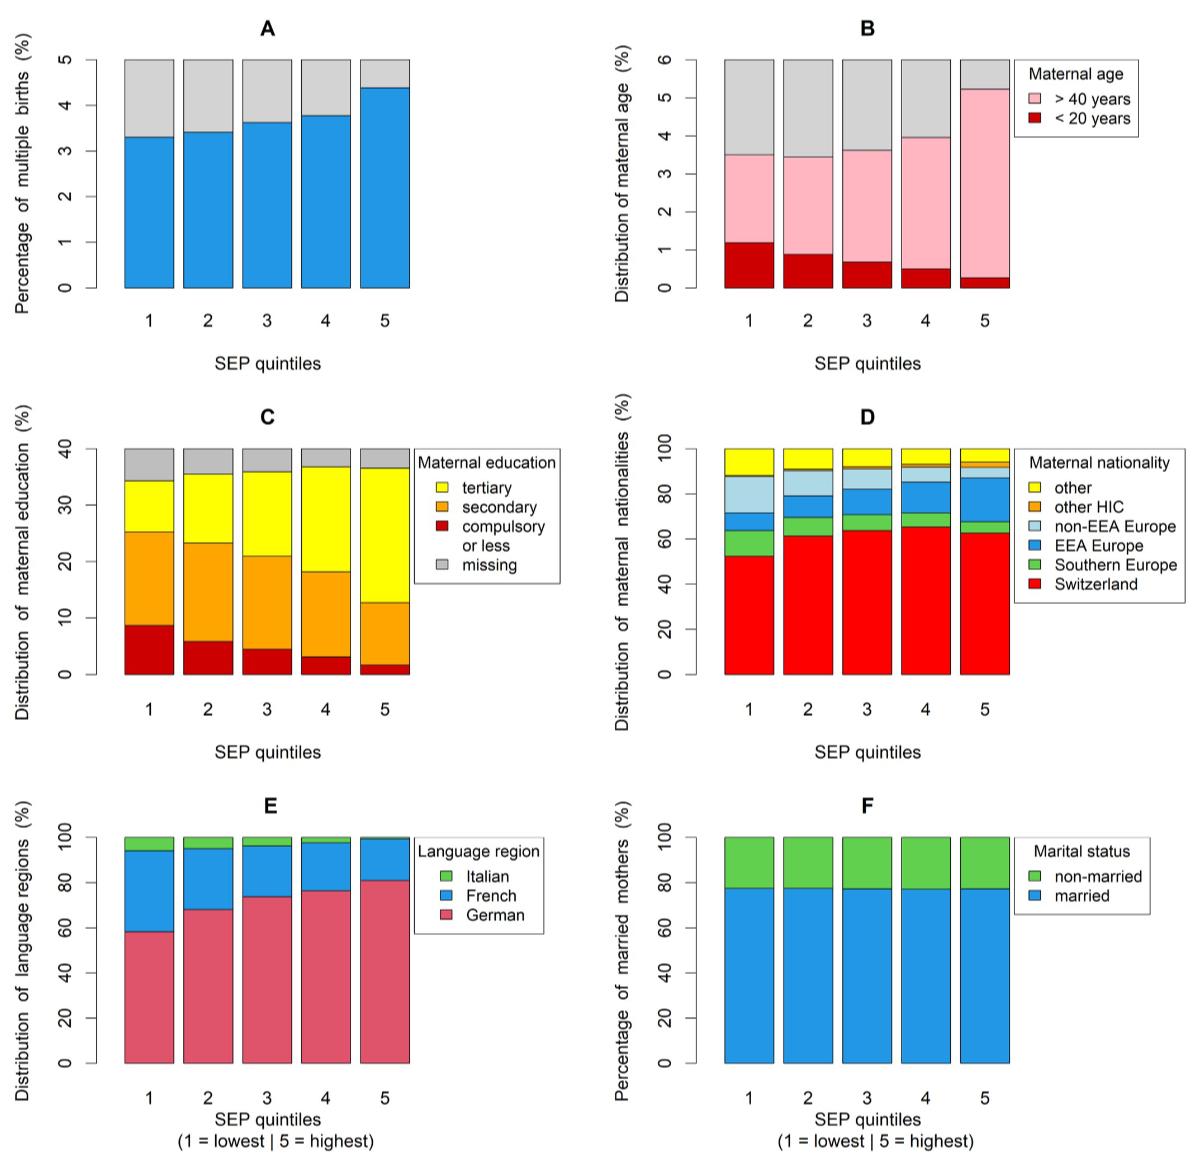
Figure 2Distribution of selected predictors across SEP quintiles; (A) multiple births, (B) teenage pregnancies, (C) maternal education, (D) maternal nationality*, (E) language region and (F) marital status**. *We provide the list of countries for each category in table S1 in the appendix. Explanation of categories: EEA Europe: other countries in the European Economic Area; Non-EEA Europe: European countries not in the EEA; Other HIC: non-European high-income countries with low national infant mortality. **The category “married” includes registered partnerships. SEP: area-based socioeconomic position.
Among 684,716 live births, 2042 neonatal deaths occurred within 28 days and 2545 infant deaths within 365 days from birth – an overall neonatal mortality rate of 3.0 and infant mortality rate of 3.7 per 1000 live births (table 1). As expected, neonatal and infant mortality rates were higher for males, multiple births, increasing birth rank and teenage and older-age mothers. Mortality was higher among infants of unmarried mothers (neonatal mortality rate of 3.9 per 1000 live births vs 2.7 for married mothers) and varied by nationality – highest for infants of mothers who immigrated from low-income countries outside Europe (neonatal mortality rate of 4.0 per 1000 live births vs 2.8 for Swiss mothers). Neonatal mortality rate varied regionally: 3.2 in German-speaking, 2.4 in French-speaking and 2.1 in Italian-speaking Switzerland; regional rates of infant mortality were, respectively, 3.9, 3.3 and 2.9.
We describe unincluded variables in our analyses in table S2 in the appendix. As expected, gestational age and birth weight were strongly associated with mortality. Differences across paternal age, nationality and education showed similar patterns – yet, less pronounced – as corresponding maternal characteristics. Mortality rates in live births with missing paternal age and nationality information were 10-fold higher than in those with non-missing paternal information – a massive violation of the “missing completely at random” assumption, which thereby supports our decision to exclude paternal information from our analyses.
Our main multivariable Poisson regression (table 2, figure 3) used data from 680,077 live births, excluding 4534 (0.7%) with unavailable Swiss-SEP index and 586 with missing maternal nationality (figure 4). Our results confirm well-known associations with sex, multiple births and maternal age, showing a typical U-shaped association (figure S1).
Table 2Main analysis: Neonatal and infant mortality adjusted rate ratios (aRR) in Switzerland 2011–2018, for all live births with available information on all predictors (n = 680,077) based on multivariable Poisson models.
| Neonatal mortality | Infant mortality | ||||
| Predictor | aRR (95% CI) | p-value | aRR (95% CI) | p-value | |
| Sex | 0.003 | <0.001 | |||
| Female | 1 | 1 | |||
| Male | 1.14 (1.05–1.25) | 1.18 (1.09–1.27) | |||
| Multiple birth | <0.001 | <0.001 | |||
| Singletons | 1 | 1 | |||
| Twins | 5.19 (4.58–5.89) | 4.38 (3.89–4.93) | |||
| Triplets | 20.2 (14.5–28.2) | 17.7 (13.1–24.1) | |||
| Quadruplets | 62.9 (21.0–188) | 45.8 (15.2–138) | |||
| Birth rank | 0.53 | 0.39 | |||
| 1st | 1 | 1 | |||
| 2nd | 0.93 (0.84–1.02) | 0.98 (0.90–1.08) | |||
| 3rd | 0.98 (0.84–1.13) | 1.04 (0.91–1.19) | |||
| ≥4th | 0.96 (0.76–1.22) | 1.17 (0.95–1.43) | |||
| Marital status | <0.001 | <0.001 | |||
| Married* | 1 | 1 | |||
| Unmarried | 1.55 (1.40–1.71) | 1.45 (1.32–1.58) | |||
| Age of mother** | <0.001 | <0.001 | |||
| 15 | 1.85 (1.13–3.21) | 2.09 (1.36–3.31) | |||
| 18 | 1.42 (1.06–1.94) | 1.58 (1.20–2.06) | |||
| 20 | 1.25 (1.03–1.51) | 1.36 (1.13–1.60) | |||
| 25 | 1.01 (0.95–1.07) | 1.06 (1.00–1.12) | |||
| 30 | 1 | 1 | |||
| 35 | 1.12 (1.06–1.21) | 1.08 (1.01–1.15) | |||
| 40 | 1.29 (1.17–1.45) | 1.26 (1.12–1.41) | |||
| 45 | 1.55 (1.26–1.85) | 1.59 (1.33–1.86) | |||
| 50 | 1.89 (1.25–2.58) | 2.20 (1.58–2.77) | |||
| Nationality of mother*** | <0.001 | <0.001 | |||
| Switzerland | 1 | 1 | |||
| Southern Europe | 0.92 (0.76–1.11) | 0.94 (0.80–1.11) | |||
| EEA Europe | 1.08 (0.94–1.24) | 1.06 (0.93–1.20) | |||
| Non-EEA Europe | 1.40 (1.20–1.62) | 1.30 (1.14–1.49) | |||
| Other HIC | 1.10 (0.70–1.71) | 1.19 (0.81–1.75) | |||
| Other | 1.49 (1.30–1.72) | 1.53 (1.35–1.73) | |||
| SEP index | 0.06 | 0.003 | |||
| 1st quintile (lowest) | 1.22 (1.05–1.42) | 1.23 (1.07–1.41) | |||
| 2nd quintile | 1.28 (1.10–1.49) | 1.32 (1.15–1.52) | |||
| 3rd quintile | 1.14 (0.98–1.32) | 1.18 (1.03–1.35) | |||
| 4th quintile | 1.19 (1.02–1.37) | 1.18 (1.03–1.34) | |||
| 5th quintile (highest) | 1 | 1 | |||
| Urban level | 0.21 | 0.13 | |||
| Urban | 1 | 1 | |||
| Peri-urban | 1.08 (0.98–1.19) | 1.07 (0.98–1.16) | |||
| Rural | 0.99 (0.87–1.13) | 0.96 (0.86–1.08) | |||
| Language region | <0.001 | <0.001 | |||
| German | 1 | 1 | |||
| French | 0.72 (0.64–0.80) | 0.81 (0.73–0.89) | |||
| Italian | 0.66 (0.51–0.87) | 0.73 (0.58–0.93) | |||
aRR: adjusted rate ratio; CI: confidence interval; EEA: European Economic Area; SEP: area-based socioeconomic position.
* Includes registered partnerships.
** Modelled by a quadratic spline with a knot at 30 years; 95% credible intervals calculated by bootstrap.
*** The list of countries in each category is provided in table S1 in the appendix. Explanation of categories: EEA Europe: other countries in the European Economic Area; Non-EEA Europe: European countries not in the EEA; Other HIC: non-European high-income countries with low national infant mortality. Characteristics are presented as rate ratio and 95% confidence interval.
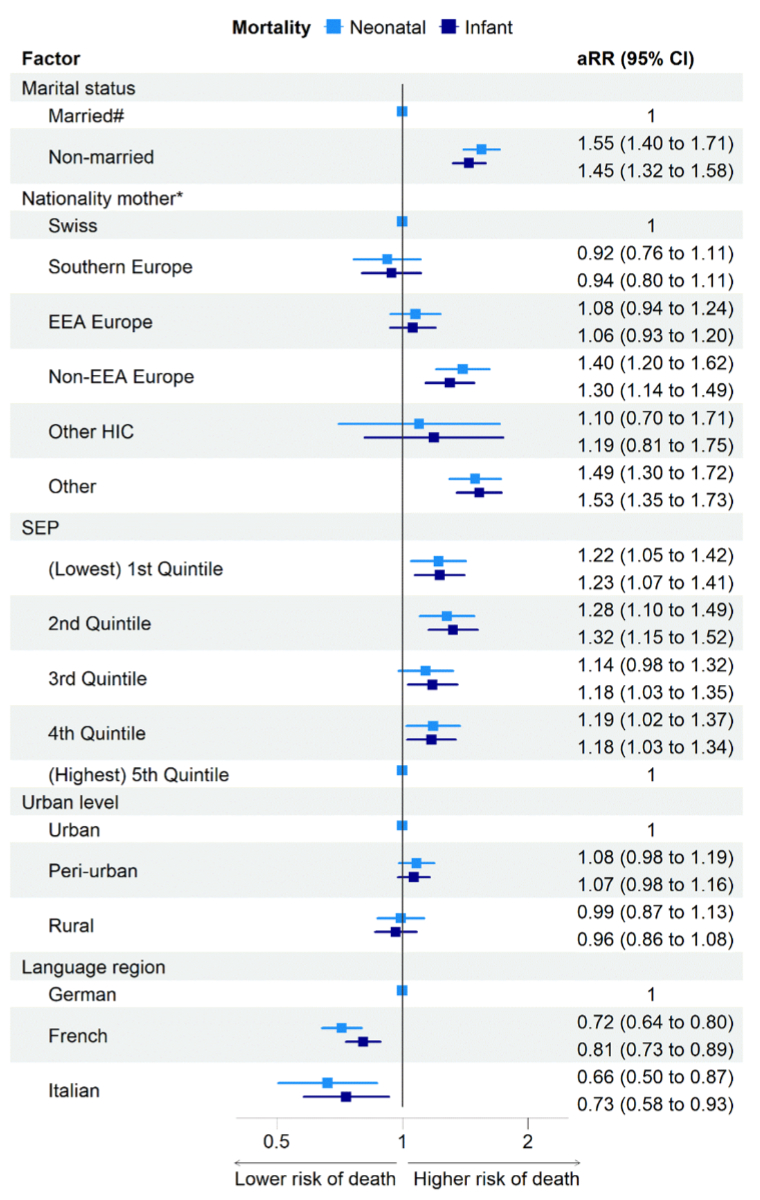
Figure 3Main analysis: Neonatal and infant mortality adjusted rate ratios (aRR) in Switzerland 2011–2018, for all live births with available information on all predictors (n = 680,077), based on multivariable Poisson models‡. ‡Multivariable Poisson models are adjusted for sex, multiple birth, birth rank and age of mother. #Includes registered partnerships. *We list countries in each category in table S1 in the appendix. Explanation of categories: EEA Europe: other countries in the European Economic Area; Non-EEA Europe: European countries not in the EEA; Other HIC: non-European high-income countries with low national infant mortality. aRR: adjusted rate ratio; CI: confidence interval; SEP: area-based socioeconomic position.
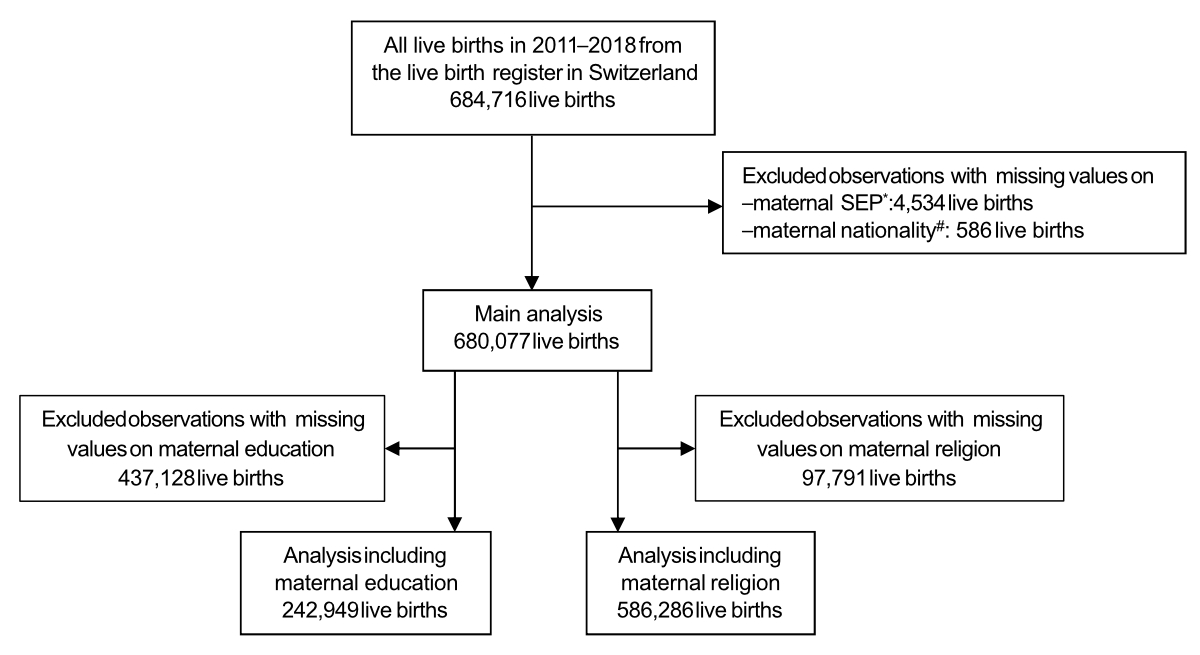
Figure 4Population flowchart.
* Mothers could not be linked to the census database (includes geo-coordinates of residence) due to their missing national identifier, which is used for the linkage.
# Maternal nationality not recorded in the birth certificate and furthermore these mothers also could not be linked to the census database due to missing national identifier (n = 481), or they did not participate in any of the censuses from 2011 to 2019 that collected such information (n = 105). SEP: area-based socioeconomic position.
Children of unmarried mothers had higher mortality than those of married mothers (neonatal [adjusted] aRR 1.55, 95% CI: 1.40–1.71; infant aRR 1.45, 95% CI: 1.32–1.58). Newborns of mothers from non-EEA Europe had higher mortality than offspring of Swiss mothers (neonatal aRR 1.40, 95% CI: 1.21–1.62; infant aRR 1.30, 95% CI: 1.14–1.49); newborns of mothers from outside Europe – excluding high-income countries – had the highest mortality rates (neonatal aRR 1.50, 95% CI: 1.30–1.73; infant aRR 1.53, 95% CI: 1.35–1.73).
Swiss-SEP index was also associated with neonatal and infant mortality, showing approximately 20% higher risks in all SEP quantiles compared with the highest quintile and virtually no evidence for a dose-response relationship. After adjusting for all other factors, mortality rates were lower in French-speaking (neonatal aRR 0.72, 95% CI: 0.64–0.80; infant aRR 0.81, 95% CI: 0.73–0.89) and Italian-speaking (neonatal aRR 0.66, 95% CI: 0.51–0.87; infant aRR 0.73, 95% CI: 0.58–0.93) regions than in the German-speaking region. Urbanisation was not associated. We show results from unadjusted models in table S3 for comparison.
In the first of our two secondary analyses, which included a subset of 242,949 live births with available maternal education information, we showed a trend for higher mortality among children of mothers with compulsory education (neonatal aRR 1.24, 95% CI: 0.95–1.61; infant aRR 1.24, 95% CI: 0.99–1.57) when compared with mothers who completed tertiary education (figure 4, table 3). Associations with all other predictors remained consistent with the main model.
Table 3Secondary analysis: Neonatal and infant mortality adjusted rate ratios (aRR) in Switzerland 2011–2018, for all live births with available information on all predictors including maternal education (n = 242,949) based on multivariable Poisson models.
| Neonatal mortality | Infant mortality | ||||
| Predictor* | aRR (95% CI) | p-value | aRR (95% CI) | p-value | |
| Sex | 0.008 | 0.003 | |||
| Female | 1 | 1 | |||
| Male | 1.23 (1.06–1.43) | 1.22 (1.07–1.40) | |||
| Multiple birth | <0.001 | <0.001 | |||
| Singletons | 1 | 1 | |||
| Twins | 5.57 (4.51–6.87) | 4.59 (3.77–5.60) | |||
| Triplets | 19.1 (9.94–36.6) | 14.1 (7.34–27.0) | |||
| Birth rank | 0.48 | 0.53 | |||
| 1st | 1 | 1 | |||
| 2nd | 0.89 (0.75–1.05) | 0.90 (0.78–1.05) | |||
| 3rd | 0.87 (0.67–1.12) | 0.92 (0.74–1.16) | |||
| ≥4th | 0.86 (0.56–1.31) | 1.06 (0.74–1.51) | |||
| Marital status of mother | <0.001 | <0.001 | |||
| Married** | 1 | 1 | |||
| Unmarried | 1.61 (1.35–1.92) | 1.47 (1.25–1.72) | |||
| Nationality of mother*** | 0.002 | <0.001 | |||
| Switzerland | 1 | 1 | |||
| Southern Europe | 0.84 (0.60–1.17) | 0.79 (0.58–1.07) | |||
| EEA Europe | 1.15 (0.91–1.46) | 1.14 (0.92–1.42) | |||
| Non-EEA Europe | 1.57 (1.21–2.04) | 1.47 (1.16–1.86) | |||
| Other HIC | 1.63 (0.84–3.18) | 1.74 (0.97–3.10) | |||
| Other | 1.41 (1.05–1.88) | 1.53 (1.19–1.96) | |||
| Education of mother | 0.26 | 0.15 | |||
| Tertiary | 1 | 1 | |||
| Secondary | 1.10 (0.92–1.31) | 1.12 (0.95–1.31) | |||
| Compulsory or less | 1.24 (0.95–1.61) | 1.24 (0.99–1.57) | |||
| SEP index | 0.19 | 0.07 | |||
| 1st quintile (lowest) | 1.15 (0.88–1.49) | 1.20 (0.95–1.52) | |||
| 2nd quintile | 1.23 (0.95–1.59) | 1.27 (1.01–1.60) | |||
| 3rd quintile | 1.17 (0.91–1.50) | 1.25 (1.00–1.57) | |||
| 4th quintile | 0.94 (0.73–1.21) | 0.99 (0.78–1.24) | |||
| 5th quintile (highest) | 1 | 1 | |||
| Urban level | 0.88 | 0.71 | |||
| Urban | 1 | 1 | |||
| Peri-urban | 0.98 (0.82–1.16) | 1.00 (0.86–1.17) | |||
| Rural | 0.95 (0.76–1.17) | 0.93 (0.77–1.13) | |||
| Language region | <0.001 | 0.001 | |||
| German | 1 | 1 | |||
| French | 0.67 (0.56–0.81) | 0.78 (0.67–0.92) | |||
| Italian | 0.58 (0.38–0.88) | 0.66 (0.46–0.95) | |||
CI: confidence interval; EEA: European Economic Area; RR: rate ratio; SEP: area-based socioeconomic position.
* Models additionally adjusted for maternal age, modelled by a quadratic spline with a knot at 30 years.
** Includes registered partnership.
*** We list countries in each category in table S1 in the appendix. Explanation of categories: EEA Europe: other countries in the European Economic Area; Non-EEA Europe: European countries not in the EEA; Other HIC: non-European high-income countries with low national infant mortality. Characteristics are presented as rate ratio and 95% confidence interval.
Another secondary analysis included a subset of 586,286 live births with available maternal religion information (figure 4, table S4). We found a strong association between religion and mortality (other religion vs Protestant: neonatal aRR 1.31, 95% CI: 1.11–1.55; no religion vs Protestant: neonatal aRR 0.76, 95% CI: 0.63–0.91), yet no difference between the Protestant and Catholic denominations (Catholic vs Protestant: neonatal aRR 1.05, 95% CI: 0.91–1.20). Associations with other predictors, including language region, remained largely consistent with the main model. We show population characteristics of subsets and characteristics of live births we excluded from our main analyses in the supplementary material in the appendix (table S5). Results from sensitivity analyses remained similar to our main results (tables S6 and S7).
Based on a longitudinal dataset of all children born alive in Switzerland between 2011 and 2018, we confirmed that neonatal mortality (3.0 per 1000 live births) and infant mortality (3.7 per 1000 live births) is higher in Switzerland than most other high-income countries. Adjusting for well-described associations with sex, multiple births and maternal age, we found additional variation by sociodemographic and socioeconomic factors, with higher mortality for mothers who are unmarried, immigrated from low-income countries and living outside the highest quintile of the Swiss-SEP index. Even after adjusting for these factors, a strong association with language region – lower neonatal and infant mortality among inhabitants of French- and Italian-speaking regions – remained.
Ours is the largest of the few studies on neonatal outcomes in Switzerland – it also includes the most comprehensive socioeconomic information. We linked the dataset deterministically, resulting in a cohort study with few overall missing data. Our considerable sample size enabled multivariable analysis and allowed us to model associations, such as maternal age, carefully. We deliberately did not adjust our regression analyses for intermediates, such as birth weight and gestational age, which may be important drivers of associations of interest. Adjustment would have potentially induced collider bias in the estimation of the effect of socioeconomic position – a mechanism described repeatedly in the literature, using terms such as “birth weight paradox” [20–23].
Our study also displays weaknesses. Although we used information from eight consecutive years, the limited dataset size prevented multivariable analysis of postneonatal deaths (n = 503). Further, paternal data were missing for unmarried mothers when children died early. We thus refrained from modelling associations with paternal factors. However, most previous studies showed stronger effects of maternal compared with paternal socioeconomic position [24]. For mothers, we included comprehensive sociodemographic, regional and socioeconomic data, yet lacked data on professional and environmental exposure (e.g. air pollution, other volatile organic compounds); information on lifestyle; health behaviours, such as smoking and alcohol consumption; and maternal health, such as obesity, gestational diabetes, preeclampsia or hypertension. Without professional and environmental exposure information, our possibilities for exploring causal pathways were limited. We also lacked information about healthcare visits, prenatal screening and postnatal care. Finally, an important limitation our study shares with others relates to the so-called “live-birth bias” [23, 25]. We lacked stillbirth and late pregnancy termination data for severe foetal conditions. Although definitions of “late pregnancy termination”, “stillbirth” and “live birth” followed by “early neonatal death” for Swiss vital statistics are the same across Switzerland, there might be regional differences in how these distinctions are handled in real life.
Few studies have investigated social determinants of neonatal and infant mortality in Switzerland. The Federal Statistical Office publishes routine data from single registers, yet datasets remain unlinked and multivariable analyses unperformed [26, 27]. Previous research focused on migrant populations and country origins. For example, issues of pregnancy and delivery were studied in a qualitative study showing that migrant women in Switzerland encounter pregnancy challenges due to stress, communication issues with healthcare providers and experiences of racism and discrimination, emphasising the need for targeted health interventions [28]. A vital statistics analysis reported for 1980–2011 a 29% higher neonatal mortality rate and up to 18% higher infant mortality rate among children with non-Swiss nationalities [6]. A follow-up study for 2011–2017 linked live births, infant deaths and parental income from the Swiss Central Compensation Office [5] and found increased risk for infants of mothers with low income. Associations with maternal country of birth were less clear-cut: infant mortality rate was lower for mothers born in the European Union or the European Free Trade Association (OR 0.83, 95% CI: 0.71–0.97) and higher (OR 1.15, 95% CI: 1.01–1.30) if born in non-OECD countries. Infant mortality rate among asylum seekers was unexpectedly low (OR 0.57, 95% CI: 0.36–0.91) compared with residence permit holders.
More information is available from other countries, particularly the UK – another country with a high neonatal mortality rate and infant mortality rate [29–32]. A systematic review of 35 UK-based studies reported increased odds of stillbirth, perinatal and neonatal mortality, preterm birth and low birth weight for women from lower levels of social class [29]. Zylberszteijn et al. compared neonatal, postneonatal and child mortality between England and Sweden; they attributed 77% of excess neonatal mortality in England to birth characteristics (gestational age, birth weight, sex and congenital malformations) and only 3% to socioeconomic factors, which included maternal age [32]. It is likely that this study has underestimated the role of socioeconomic position, since some socioeconomic position effects are mediated through gestational age and birth weight, which they included in their models. Studies from other countries obtained similar findings. In Michigan (US), socioeconomic position and maternal risk behaviours explained nearly one-third of infant mortality disparity [33]. In Spain, stillbirth risk was doubled for mothers with secondary or lower education and among mothers from African countries [11, 34]. Studies from The Netherlands [35–38], Italy [10, 39, 40] and Canada [13, 41] also reported consistent findings based on individual patient data or ecological studies.
Overall, we found some variation due to socioeconomic factors: lower socioeconomic position was associated with increased mortality, though less than we expected. In addition, we found consistent, somewhat surprising differences between regions. Besides people speaking German, French or Italian as their mother tongue, other aspects such as cultural, social and behavioural factors, including diet, tobacco smoking and alcohol consumption, voting behaviour at referendums, social policies and organisation of public healthcare likely vary by region [4, 42–45]. Interpretation of our findings requires nuance and further research.
Several mechanisms possibly explain the lower risk of neonatal mortality in French- and Italian-speaking Switzerland. First, maternal and foetal health are possibly better from a truly lower incidence of chromosomal abnormalities, severe congenital malformations and pregnancy complications. However, we consider this rather unlikely – we found lower rather than higher birth weight and gestational age in French and Italian language regions, endpoints often taken as proxies for general foetal and maternal health [4]. Second, even if regions showed similar underlying maternal and foetal health, regions possibly report stillbirth registrations and early neonatal deaths slightly differently. For example, neonates with anencephaly might be reported as stillbirths or neonatal deaths. Third, offers or uptake of prenatal screening and decisions or methods for terminating pregnancy possibly vary. In Switzerland, one-third of neonatal deaths before 28 weeks’ gestation are due to late pregnancy terminations for medically confirmed imminent maternal harm or maternal major psychological distress about foetal problems with poor prognosis, such as congenital malformations and chromosomal aberrations [46]. Under such circumstances, infants are stillborn if foeticide is conducted prior to birth, yet if pregnancy termination is solely performed by inducing labour, infants may be born alive and die shortly thereafter [47]. Although live births are registered for all infants with signs of life – regardless of gestational age or birth weight – neonatal deaths are only reported from 22 weeks’ gestation or for birth weights above 500 grams. Given that 63% of neonatal deaths in our dataset occurred before 28 weeks’ gestation (table S2), regional practice variations combined with primary resuscitation differences for preterm infants born at limits of viability perhaps strongly influenced neonatal mortality rates [48].
We thus suggest that systematic differences in pregnancy-related policies and actions by parents and physicians possibly explain at least part of our findings. This hypothesis is also supported by associations with religion and lower neonatal mortality among couples reporting “no religion”. We could reasonably hypothesise that such parents are more likely to terminate pregnancies with lethal malformations.
We suggest future studies using routine administrative data ideally integrate information about stillbirths and late pregnancy terminations. Larger datasets would allow for differentiating between risk factors for perinatal, late neonatal and postneonatal death. Strong evidence shows social patterning differs between these two outcome measures, with socioeconomic position explaining mainly postneonatal deaths, particularly sudden infant death syndrome [13, 49]. Including more information about the birth mechanism, such as Caesarean section or instrumental deliveries, and health behaviours, such as smoking, in routine Swiss statistics would further improve exploration of causal pathways. Finally, we need qualitative interview studies with healthcare providers, policymakers and parents in different language regions and within population strata to shed light on potential mechanisms and develop policies.
Overall, our national cohort study confirmed high neonatal and infant mortality rates in Switzerland, which showed some variation by sociodemographic and socioeconomic factors, such as nationality, civil status and area-based socioeconomic position, and revealed robust differences between language regions. While infant mortality in German-speaking regions was high (neonatal mortality rate of 3.2 per 1000 live births), rates in French- and Italian-speaking regions were more comparable to other high-income countries (neonatal mortality rates of 2.4 and 2.1 per 1000 live births, respectively). Further elucidation of relevant pathways and mechanisms is needed to develop evidence-based policies for improving maternal and child health in Switzerland.
Data are available upon reasonable request. Data may be obtained from a third party and are not publicly available.
We thank Kristin Marie Bivens for her editorial work and guidance on our manuscript.
The Swiss National Cohort is funded by the Swiss National Science Foundation (SNSF) cohort grant nº 148415. Our current analysis was funded by SNSF project grant nº 163452. ME was supported by special SNSF project funding (grant nº 189498). LDS was funded by an SNSF grant to CEK (SNSF 320030B_192804/1).
All authors have completed and submitted the International Committee of Medical Journal Editors form for disclosure of potential conflicts of interest. No potential conflict of interest related to the content of this manuscript was disclosed.
1. Paulson KR, Kamath AM, Alam T, Bienhoff K, Abady GG, Abbas J, et al.; GBD 2019 Under-5 Mortality Collaborators. Global, regional, and national progress towards Sustainable Development Goal 3.2 for neonatal and child health: all-cause and cause-specific mortality findings from the Global Burden of Disease Study 2019. Lancet. 2021 Sep;398(10303):870–905. doi: https://doi.org/10.1016/S0140-6736(21)01207-1
2. World Health Organization Global Health Expenditure Database. Available from: https://apps.who.int/nha/database/Country_Profile/Index/en
3. World Health Organization Life expectancy and Healthy life expectancy. Available from: https://apps.who.int/gho/data/node.main.688
4. Skrivankova V, Zwahlen M, Adams M, Low N, Kuehni C, Egger M. Spatial epidemiology of gestational age and birth weight in Switzerland: census-based linkage study. BMJ Open. 2019 Oct;9(10):e027834. doi: https://doi.org/10.1136/bmjopen-2018-027834
5. Wanner P. Adverse perinatal outcomes among children in Switzerland: the impact of national origin and socio-economic group. Int J Public Health. 2020 Dec;65(9):1613–21. doi: https://doi.org/10.1007/s00038-020-01492-2
6. Wanner P, Bollini P. The contribution of the foreign population to the high level of infant mortality in Switzerland: a demographic analysis. BMC Pregnancy Childbirth. 2017 May;17(1):151. doi: https://doi.org/10.1186/s12884-017-1332-6
7. Bopp M, Spoerri A, Zwahlen M, Gutzwiller F, Paccaud F, Braun-Fahrländer C, et al. Cohort Profile: the Swiss National Cohort—a longitudinal study of 6.8 million people. Int J Epidemiol. 2009 Apr;38(2):379–84. doi: https://doi.org/10.1093/ije/dyn042
8. Spoerri A, Zwahlen M, Egger M, Bopp M. The Swiss National Cohort: a unique database for national and international researchers. Int J Public Health. 2010 Aug;55(4):239–42. doi: https://doi.org/10.1007/s00038-010-0160-5
9. Devlieger H, Martens G, Bekaert A. Social inequalities in perinatal and infant mortality in the northern region of Belgium (the Flanders). Eur J Public Health. 2005 Feb;15(1):15–9. doi: https://doi.org/10.1093/eurpub/cki104
10. Dallolio L, Di Gregori V, Lenzi J, Franchino G, Calugi S, Domenighetti G, et al. Socio-economic factors associated with infant mortality in Italy: an ecological study. Int J Equity Health. 2012 Aug;11(1):45. doi: https://doi.org/10.1186/1475-9276-11-45
11. Luque-Fernandez MA, Thomas A, Gelaye B, Racape J, Sanchez MJ, Williams MA. Secular trends in stillbirth by maternal socioeconomic status in Spain 2007-15: a population-based study of 4 million births. Eur J Public Health. 2019 Dec;29(6):1043–8. doi: https://doi.org/10.1093/eurpub/ckz086
12. Tromp M, Eskes M, Reitsma JB, Erwich JJ, Brouwers HA, Rijninks-van Driel GC, et al. Regional perinatal mortality differences in the Netherlands; care is the question. BMC Public Health. 2009 Apr;9(1):102. doi: https://doi.org/10.1186/1471-2458-9-102
13. Gilbert NL, Auger N, Wilkins R, Kramer MS. Neighbourhood income and neonatal, postneonatal and sudden infant death syndrome (SIDS) mortality in Canada, 1991-2005. Can J Public Health. 2013 Mar;104(3):e187–92. doi: https://doi.org/10.17269/cjph.104.3739
14. Panczak R, Galobardes B, Voorpostel M, Spoerri A, Zwahlen M, Egger M; Swiss National Cohort and Swiss Household Panel. A Swiss neighbourhood index of socioeconomic position: development and association with mortality. J Epidemiol Community Health. 2012 Dec;66(12):1129–36. doi: https://doi.org/10.1136/jech-2011-200699
15. Zou G. A modified poisson regression approach to prospective studies with binary data. Am J Epidemiol. 2004 Apr;159(7):702–6. doi: https://doi.org/10.1093/aje/kwh090
16. Cole SR, Hernán MA. Fallibility in estimating direct effects. Int J Epidemiol. 2002 Feb;31(1):163–5. doi: https://doi.org/10.1093/ije/31.1.163
17. Hernán MA, Hernández-Díaz S, Werler MM, Mitchell AA. Causal knowledge as a prerequisite for confounding evaluation: an application to birth defects epidemiology. Am J Epidemiol. 2002 Jan;155(2):176–84. doi: https://doi.org/10.1093/aje/155.2.176
18. Wilcox AJ, Weinberg CR, Basso O. On the pitfalls of adjusting for gestational age at birth. Am J Epidemiol. 2011 Nov;174(9):1062–8. doi: https://doi.org/10.1093/aje/kwr230
19. R Core Team. (2021). R: A language and environment for statistical computing. R Foundation for Statistical Computing, Vienna, Austria.; Available from: https://www.R-project.org/
20. Wilcox AJ. On the importance—and the unimportance—of birthweight. Int J Epidemiol. 2001 Dec;30(6):1233–41. doi: https://doi.org/10.1093/ije/30.6.1233
21. Hernández-Díaz S, Schisterman EF, Hernán MA. The birth weight “paradox” uncovered? Am J Epidemiol. 2006 Dec;164(11):1115–20. doi: https://doi.org/10.1093/aje/kwj275
22. Hernández-Díaz S, Wilcox AJ, Schisterman EF, Hernán MA. From causal diagrams to birth weight-specific curves of infant mortality. Eur J Epidemiol. 2008;23(3):163–6. doi: https://doi.org/10.1007/s10654-007-9220-4
23. Neophytou AM, Kioumourtzoglou MA, Goin DE, Darwin KC, Casey JA. Educational note: addressing special cases of bias that frequently occur in perinatal epidemiology. Int J Epidemiol. 2021 Mar;50(1):337–45. doi: https://doi.org/10.1093/ije/dyaa252
24. Balaj M, York HW, Sripada K, Besnier E, Vonen HD, Aravkin A, et al. Parental education and inequalities in child mortality: a global systematic review and meta-analysis. Lancet. 2021 Aug;398(10300):608–20. doi: https://doi.org/10.1016/S0140-6736(21)00534-1
25. Liew Z, Olsen J, Cui X, Ritz B, Arah OA. Bias from conditioning on live birth in pregnancy cohorts: an illustration based on neurodevelopment in children after prenatal exposure to organic pollutants. Int J Epidemiol. 2015 Feb;44(1):345–54. doi: https://doi.org/10.1093/ije/dyu249
26. Schwangerschaften und Geburten unter schwierigen Bedingungen. 2022, Neuchâtel: Bundesamt für Statistik (BFS). 12. Available from: https://www.swissstats.bfs.admin.ch/collection/ch.admin.bfs.swissstat.de.issue22012382201/article/issue22012382201-01
27. Totgeburten und Säuglingssterblichkeit 2003-2010. 2012, Neuchâtel: Bundesamt für Statistik (BFS). Available from: https://www.admin.ch/gov/de/start/dokumentation/medienmitteilungen.msg-id-43824.html
28. Bollini P, Stotzer U, Wanner P. Pregnancy outcomes and migration in Switzerland: results from a focus group study. Int J Public Health. 2007;52(2):78–86. doi: https://doi.org/10.1007/s00038-007-6003-3
29. Thomson K, Moffat M, Arisa O, Jesurasa A, Richmond C, Odeniyi A, et al. Socioeconomic inequalities and adverse pregnancy outcomes in the UK and Republic of Ireland: a systematic review and meta-analysis. BMJ Open. 2021 Mar;11(3):e042753. doi: https://doi.org/10.1136/bmjopen-2020-042753
30. Best KE, Seaton SE, Draper ES, Field DJ, Kurinczuk JJ, Manktelow BN, et al. Assessing the deprivation gap in stillbirths and neonatal deaths by cause of death: a national population-based study. Arch Dis Child Fetal Neonatal Ed. 2019 Nov;104(6):F624–30. doi: https://doi.org/10.1136/archdischild-2018-316124
31. Kroll ME, Kurinczuk JJ, Hollowell J, Macfarlane A, Li Y, Quigley MA. Ethnic and socioeconomic variation in cause-specific preterm infant mortality by gestational age at birth: national cohort study. Arch Dis Child Fetal Neonatal Ed. 2020 Jan;105(1):56–63. doi: https://doi.org/10.1136/archdischild-2018-316463
32. Zylbersztejn A, Gilbert R, Hjern A, Wijlaars L, Hardelid P. Child mortality in England compared with Sweden: a birth cohort study. Lancet. 2018 May;391(10134):2008–18. doi: https://doi.org/10.1016/S0140-6736(18)30670-6
33. El-Sayed AM, Finkton DW Jr, Paczkowski M, Keyes KM, Galea S. Socioeconomic position, health behaviors, and racial disparities in cause-specific infant mortality in Michigan, USA. Prev Med. 2015 Jul;76:8–13. doi: https://doi.org/10.1016/j.ypmed.2015.03.021
34. Luque-Fernández MÁ, Lone NI, Gutiérrez-Garitano I, Bueno-Cavanillas A. Stillbirth risk by maternal socio-economic status and country of origin: a population-based observational study in Spain, 2007-08. Eur J Public Health. 2012 Aug;22(4):524–9. doi: https://doi.org/10.1093/eurpub/ckr074
35. Bertens LC, Burgos Ochoa L, Van Ourti T, Steegers EA, Been JV. Persisting inequalities in birth outcomes related to neighbourhood deprivation. J Epidemiol Community Health. 2020 Mar;74(3):232–9. doi: https://doi.org/10.1136/jech-2019-213162
36. Burgos Ochoa L, Bertens LC, Garcia-Gomez P, Van Ourti T, Steegers EA, Been JV. Association of neighbourhood socioeconomic trajectories with preterm birth and small-for-gestational-age in the Netherlands: a nationwide population-based study. Lancet Reg Health Eur. 2021 Aug;10:100205. doi: https://doi.org/10.1016/j.lanepe.2021.100205
37. Vidiella-Martin J, Been JV, Van Doorslaer E, García-Gómez P, Van Ourti T; Association Between Income and Perinatal Mortality in the Netherlands Across Gestational Age. Association Between Income and Perinatal Mortality in the Netherlands Across Gestational Age. JAMA Netw Open. 2021 Nov;4(11):e2132124. doi: https://doi.org/10.1001/jamanetworkopen.2021.32124
38. Vos AA, Denktaş S, Borsboom GJ, Bonsel GJ, Steegers EA. Differences in perinatal morbidity and mortality on the neighbourhood level in Dutch municipalities: a population based cohort study. BMC Pregnancy Childbirth. 2015 Sep;15(1):201. doi: https://doi.org/10.1186/s12884-015-0628-7
39. Dallolio L, Lenzi J, Fantini MP. Temporal and geographical trends in infant, neonatal and post-neonatal mortality in Italy between 1991 and 2009. Ital J Pediatr. 2013 Mar;39(1):19. doi: https://doi.org/10.1186/1824-7288-39-19
40. Simeoni S, Frova L, De Curtis M. Inequalities in infant mortality in Italy. Ital J Pediatr. 2019 Jan;45(1):11. doi: https://doi.org/10.1186/s13052-018-0594-6
41. Miao Q, Dunn S, Wen SW, Lougheed J, Reszel J, Lavin Venegas C, et al. Neighbourhood maternal socioeconomic status indicators and risk of congenital heart disease. BMC Pregnancy Childbirth. 2021 Jan;21(1):72. doi: https://doi.org/10.1186/s12884-020-03512-8
42. Pestoni G, Krieger JP, Sych JM, Faeh D, Rohrmann S. Cultural Differences in Diet and Determinants of Diet Quality in Switzerland: Results from the National Nutrition Survey menuCH. Nutrients. 2019 Jan;11(1):126. doi: https://doi.org/10.3390/nu11010126
43. Wanner M, Probst-Hensch N, Kriemler S, Meier F, Autenrieth C, Martin BW. Validation of the long international physical activity questionnaire: influence of age and language region. Prev Med Rep. 2016 Mar;3:250–6. doi: https://doi.org/10.1016/j.pmedr.2016.03.003
44. Roser K, Mader L, Baenziger J, Sommer G, Kuehni CE, Michel G. Health-related quality of life in Switzerland: normative data for the SF-36v2 questionnaire. Qual Life Res. 2019 Jul;28(7):1963–77. doi: https://doi.org/10.1007/s11136-019-02161-5
45. Matthes KL, Zuberbuehler CA, Rohrmann S, Hartmann C, Siegrist M, Burnier M, et al. Selling, buying and eating – a synthesis study on dietary patterns across language regions in Switzerland. Br Food J. 2022;124(5):1502–18. doi: https://doi.org/10.1108/BFJ-02-2021-0141
46. Berger TM, Steurer MA, Bucher HU, Fauchère JC, Adams M, Pfister RE, et al.; Swiss Neonatal End-of-Life Study Group. Retrospective cohort study of all deaths among infants born between 22 and 27 completed weeks of gestation in Switzerland over a 3-year period. BMJ Open. 2017 Jun;7(6):e015179. doi: https://doi.org/10.1136/bmjopen-2016-015179
47. Rey AM, Seidenberg A. Schwangerschaftsabbruch: die Praxis der Spitäler und Kliniken in der Schweiz. Schweiz Arzteztg. 2010;(91):551–4.
48. Berger, F., et al., Overlapping borders: limit of viability and late terminations of pregnancy - a retrospective multicentre observational study. Swiss Med Wkly, 2020.150(0506):w20186.
49. Wood AM, Pasupathy D, Pell JP, Fleming M, Smith GC. Trends in socioeconomic inequalities in risk of sudden infant death syndrome, other causes of infant mortality, and stillbirth in Scotland: population based study. BMJ. 2012 Mar;344 mar16 2:e1552. doi: https://doi.org/10.1136/bmj.e1552
50. Panczak R, Berlin C, Voorpostel M, Zwahlen M, Egger M. The Swiss neighbourhood index of socioeconomic position: update and re-validation. Swiss Med Wkly. 2023 Jan;153(1):40028. doi: https://doi.org/10.57187/smw.2023.40028
The appendix is available in the pdf version of the article at https://doi.org/10.57187/s.3682.