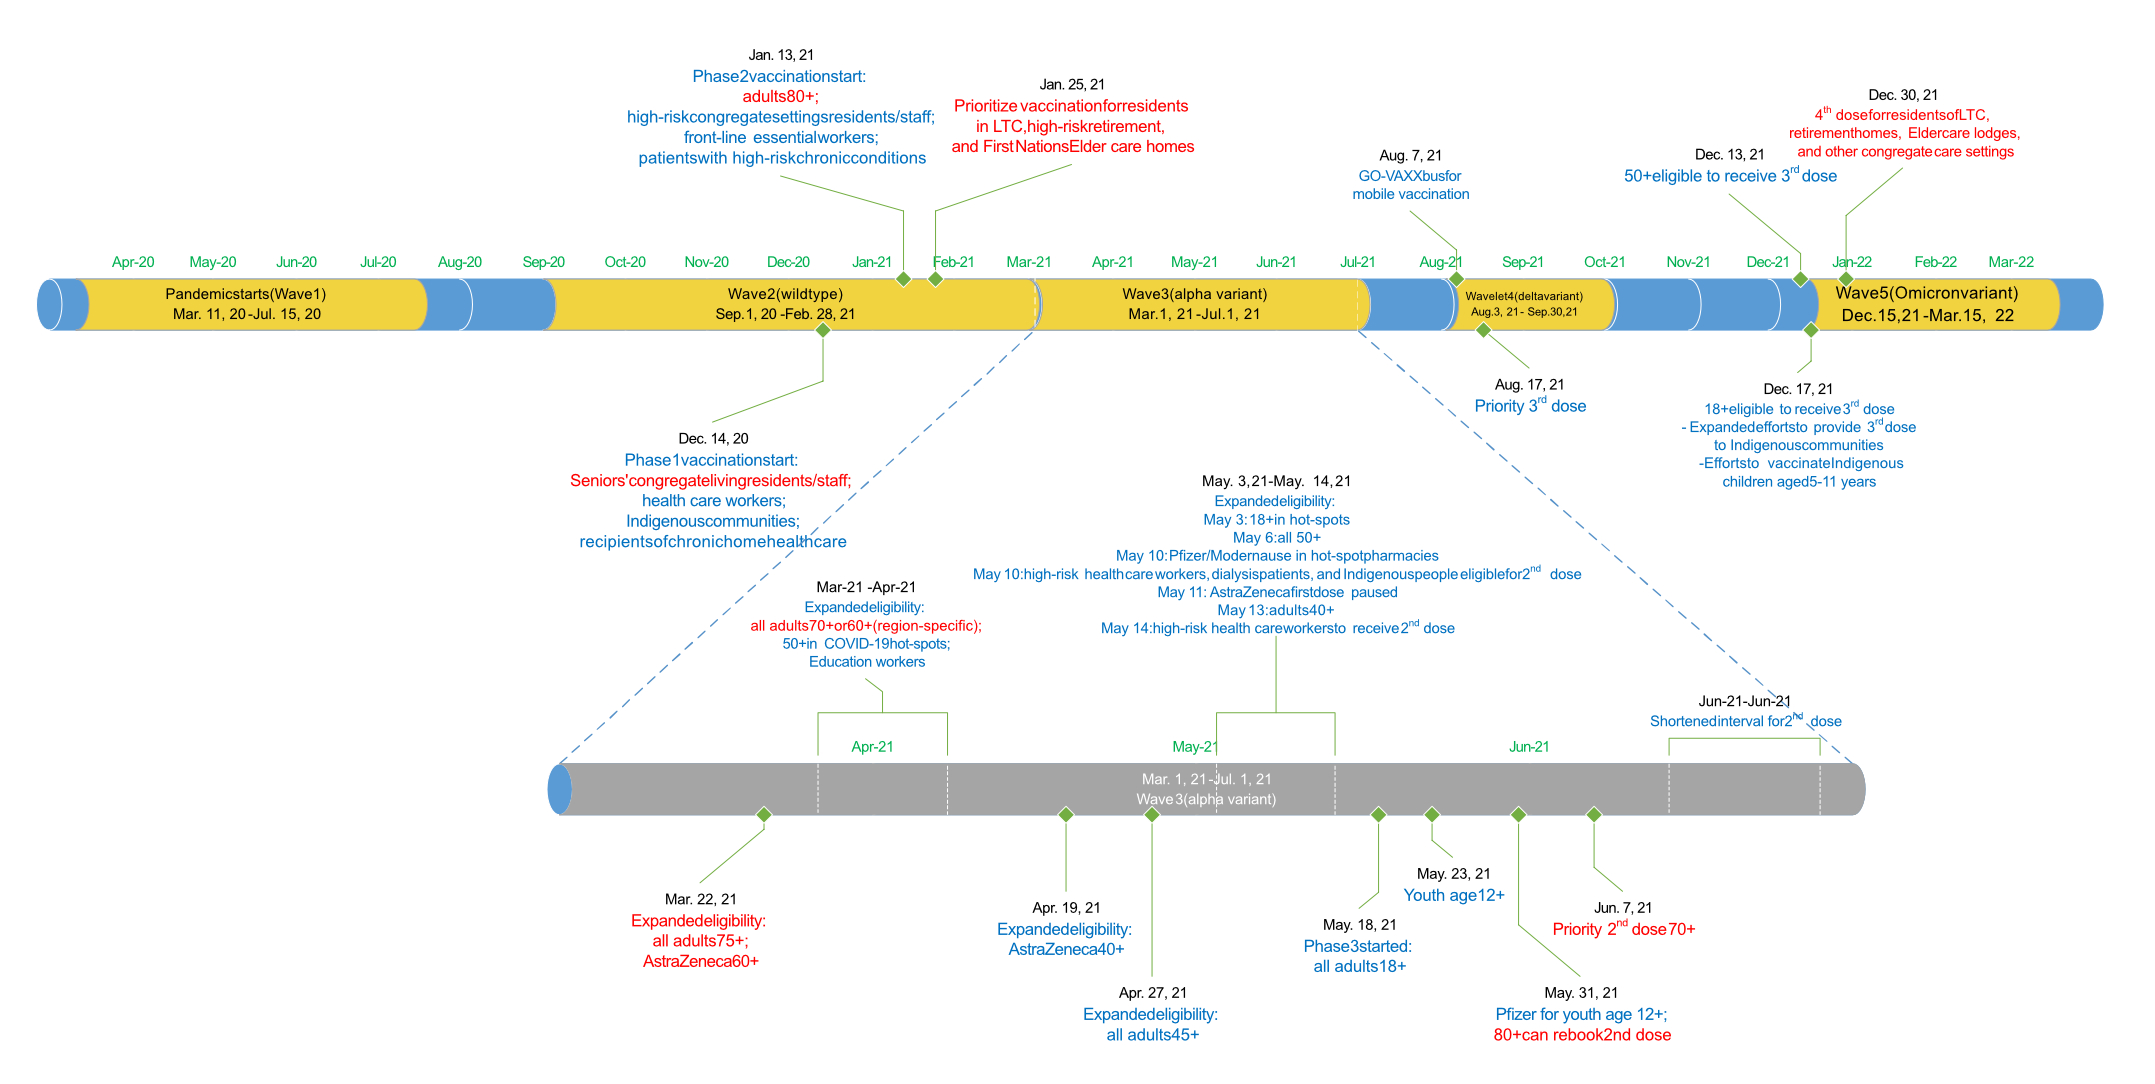
Figure 1Timeline of important events as it relates to COVID-19 waves, vaccination roll-out and vaccination eligibility.
DOI: https://doi.org/https://doi.org/10.57187/s.3636
Since the start of the COVID-19 pandemic in the province of Ontario, Canada, the social and epidemiological circumstances surrounding infection and its consequences have changed with each wave of infection. There have been varying degrees of social behavioural adaptations (e.g. wearing a mask, working from home, avoiding large crowds) and social regulations (e.g. restrictions and closures); differences in the predominant SARS-CoV-2 (Severe Acute Respiratory Syndrome Coronavirus 2) variants circulating (wild-type, Alpha, Delta, Omicron) associated with observed differences in virulence and transmissibility; and changes in population-level immunity acquired through vaccination or prior infections [1–4].
Although Omicron was more transmissible than previous variants, some studies from the United States did not report substantial differences in mortality between Omicron and Delta, even after accounting for vaccination status [5]. Conversely, other studies from England and Denmark found a lower 30-day mortality rate with Omicron after similar adjustment [6, 7]. One study from the Northeastern United States demonstrated better survival with the Omicron variant, but this finding was observed only for the BA.2 Omicron subvariant, with similar mortality between Delta and the original Omicron subvariant B.1.1.529 [8]. Generally, Canadian studies agreed that the severity of infection was lower with the Omicron variant, but more information is needed to reflect changes in severity and patient characteristics over time, and more follow-up is needed to reliably ascertain differences in mortality [9–11].
Considering that testing and surveillance measures have changed throughout the pandemic, the population susceptible to recorded SARS-CoV-2 infection in the province may have shifted across waves. In March 2020, non-essential workplaces, schools and the Canada-United States border closed. Simultaneously, physical distancing and infection prevention and control requirements were implemented [1]. Following the first wave, restrictions were gradually removed during the summer of 2020; however they were reinstated in the second wave of autumn 2020 and the beginning of winter 2021. Initial vaccination roll-out targeted higher-risk individuals (e.g. the elderly and those with chronic disease), “hot spot” neighbourhoods (e.g. more marginalised communities that were exhibiting relatively high rates of SARS-CoV-2 positivity) and settings (e.g. people residing in long-term care facilities; essential workers) [12, 13].
In the present study, we add to the literature by examining the wave-over-wave characteristics and outcomes of patients admitted with SARS-CoV-2 at the population level. The primary outcome examined was 90-day mortality. Secondary outcomes were use of critical care and total hospital length of stay. Patient characteristics examined included both clinical and sociodemographic attributes.
Ontario is Canada’s most populous province (15 million people). Healthcare is provisioned under a single-payer universal healthcare system. During the study period, Ontario experienced five distinct waves of COVID-19 where infection was predominantly caused by a specific variant. Waves 1 and 2 corresponded to the wild-type variant, wave 3 Alpha, wave 4 Delta and wave 5 Omicron. Approximate start dates for each wave correspond to an inflection point in the number of cases in the population (figure 1), with the end date of each wave defined as the start of the next wave (31 March 2022 for wave 5) [14].
Figure 1Timeline of important events as it relates to COVID-19 waves, vaccination roll-out and vaccination eligibility.
Hospital admissions were captured from the Discharge Abstract Database (DAD), which comprehensively captures all hospitalisations in Ontario (figure S1 in the Appendix). To avoid duplicate counting of admissions due to hospital transfers, admission records were resolved into episodes using information about the time of admission since the previous discharge, evidence of inter- or intra-hospital transfers and planned versus unplanned (re)admissions [15]. We started with the definition reported by the Canadian Institute for Health Information: an inpatient episode of care included admissions occurring within 6 hours of previous discharge or admissions occurring within 12 hours of previous discharge but with evidence of a transfer (e.g. “transfer to” from the prior admission or a “transfer from” for the current admission) [16, 17]. Admissions known to be planned (readmit code 1) were classified as admissions that belonged to the previous episode until 1 week after the previous discharge.
Data were extracted on 15 August 2022. Episodes starting between 26 February 2020 (the start of the COVID-19 pandemic in Ontario) and 31 March 2022 were included. All admission records had a valid health card number, a unique encoded identifier used to link between datasets.
To determine whether an admission episode was related to SARS-CoV-2, we searched all diagnostic codes (up to 25) during the entire episode for the ICD-10 code U071 (COVID-19 infection, known) or U072 (COVID-19 infection, suspected). We also searched for U071 or U072 from outpatient hospital encounters (any of the 10 diagnostic codes in NACRS, the National Ambulatory Care Reporting System) during and within 2 weeks prior to the start of each admission episode [18]. Lastly, we also captured positive SARS-CoV-2 polymerase chain reaction or rapid antigen tests from the Ontario Laboratories Information System (OLIS). OLIS includes data from approximately 90% of labs in Ontario conducting SARS-CoV-2 tests since the start of the pandemic [19]. We considered an admission episode to be related to SARS-CoV-2 if any source indicated SARS-CoV-2 positivity during (DAD, NACRS, OLIS) or within 2 weeks prior (NACRS, OLIS) to the admission episode (Technical Appendix). Since our index date is the first admission related to SARS-CoV-2, we did not apply a hierarchy to these sources of evidence. The first ever admission episode was retained per patient.
The index date was defined as the start of the first hospital admission episode related to SARS-CoV-2. Patients were omitted if they could not be linked to the Registered Persons Database or their death date preceded the admission date.
Comorbidity was derived using ICD-10 codes for the year prior using DAD or NACRS. Residence in a long-term care (LTC) facility or similar was defined using the Ontario Health Insurance Plan (any billing code starting with “W”) or DAD/NACRS with a transfer code to/from a LTC facility. Sociodemographic characteristics included urban/rural residence, neighbourhood-level material deprivation quintiles and ethnic diversity quintiles from the Ontario Marginalization Index and transfer from supportive/group housing (defined using transfer codes to/from such housing). Material deprivation, residential instability, dependency and ethnic diversity were neighbourhood-level indices derived from the 2016 Census [20]. SARS-CoV-2 was considered the most responsible diagnosis (MRDx) if the admission record that started the episode indicated either U071 or U072 as such.
The primary outcome was 90-day all-cause mortality since the start of the admission episode. The date of death was obtained from the Registered Persons Database. Patients with no death date were assumed to have been alive at 90 days. For Kaplan-Meier plots, the follow-up time was calculated as the date of death minus the date the admission episode started. The date 31 July 2022 was used as the censor date (the most recent date mortality data were available). Secondary outcomes included use of critical care during the episode and total length of stay (LOS). Use of critical care involved any stay in either an adult or neonatal intensive care unit. The total length of stay was calculated, in hours, using the date-time from the admission that started the admission episode until the date-time of the discharge from the admission episode.
Wave-over-wave patient and admission characteristics were presented using descriptive statistics. All-cause survival was presented using Kaplan-Meier plots. 90-day mortality was compared using modified Poisson regression, reporting risk ratios (RR) with 95% confidence intervals (CI) [21]. To examine whether 90-day mortality changed over wave for certain patients, we also introduced interaction terms between that patient’s characteritic and wave. If the interaction term p value <0.05, then we reported the RR of wave on 90-day mortality stratified by that characteristic.
Use of critical care during the admission was assessed using logistic regression, reporting odds ratios (OR) with 95% CI. Linear regression was used to compare hospital LOS, reporting beta coefficient and 95% CI, representing the effect of a 1-unit change of the covariate on the total LOS (in days). Homoscedasticity was assessed via inspection of residual-versus-predictor plots and the modified Park test for linear-normal, log-gamma, and log-Poisson models, but heteroscedasticity could not be resolved. We instead used a heteroscedasticity-consistent standard error estimator of OLS parameter estimates (HC3), which does not require the assumption of homoscedasticity for valid inferences [22].
To estimate the effect of wave of COVID-19 on outcomes, unless otherwise stated, all effect measures were adjusted for age at admission, sex, SARS-CoV-2 as the most responsible diagnosis, rurality, neighbourhood marginalisation quintiles, long-term care residence, transfer from supportive housing residence, comorbidity (continuous), ambulance arrival, urgent admission, overnight admission and hospital transfer because these were all believed to be confounders for the effect of COVID-19 wave on the outcome. For 90-day mortality, we also adjusted for use of critical care since this may be a strong predictor of SARS-CoV-2-related severity. All analyses were performed at Ontario Health using Statistical Analysis Software version 9.4 (SAS Institute Inc., Cary, NC, USA). Only complete-case analyses were employed.
This study was compliant with section 45(1) of PHIPA (Ontario Health is a prescribed entity): ethics review and patient consent were not required. The health card number was used to link between data sources (unique identifier). A protocol was not prepared for this work.
There were a total of 73,201 SARS-CoV-2-related admission episodes: 6127 (8%) during wave 1, 14,371 (20%) during wave 2, 16,653 (23%) during wave 3, 5678 (8%) during wave 4 (significantly smaller than the others) and 30,372 (42%) during wave 5 (table 1). Most cases were identified from hospital administrative databases (ICD-10 diagnostic codes [n = 64,213 or 88%] rather than OLIS [n = 8988 or 12%]). Among those identified using ICD-10 codes, 1010 (1.2%) were suspected cases (only code U072 present in any position) and not corroborated by OLIS and 155 admissions were based on U072 but corroborated by OLIS. SARS-CoV-2 was the most responsible diagnosis for the admission record starting the episode in 70% of all admission episodes during waves 1–2, which increased to 76% (12,691) in wave 3 and subsequently declined to 59% (3345) in wave 4 and 43% (13,065) in wave 5. Patients admitted with SARS-CoV-2 as the most responsible diagnosis were younger (p = 0.02), were more likely to be male (OR: 1.29 [1.21–1.37]), had fewer comorbidities (OR: 0.91 [0.89–0.93]), lived in a neighbourhood with the highest ethnic diversity (OR: 1.30 [1.15–1.47]), were more likely to have arrived by ambulance (OR: 1.22 [1.13–1.32]) and to have been admitted urgently (OR: 3.01 [2.30–3.94]), but were less likely to reside in a LTC facility (OR: 0.89 [0.81–0.97]) or have been transferred from supportive housing (OR: 0.76 [0.70–0.83]) (table 2).
Table 1Characteristics of admissions by COVID-19 wave.
| Wave 1 | Wave 2 | Wave 3 | Wave 4 | Wave 5 | ||
| Wild-type | Wild-type | Alpha | Delta | Omicron | ||
| n | 6127 | 14,371 | 16,653 | 5678 | 30,372 | |
| COVID-19 diagnosis type | Most responsible diagnosis | 4234 (69%) | 10,072 (70%) | 12,691 (76%) | 3345 (59%) | 13,065 (43%) |
| Other | 610 (10%) | 1297 (9%) | 1317 (8%) | 888 (16%) | 4876 (16%) | |
| None (OLIS only) | 1283 (21%) | 3002 (21%) | 2645 (16%) | 1445 (25%) | 12,431 (41%) | |
| Patient characteristics | ||||||
| Age (years) | 67.2 (SD: 19.2) | 68.2 (SD: 19.6) | 59.4 (SD: 19.2) | 60.4 (SD: 21.5) | 61.3 (SD: 25.2) | |
| ≤6 months | 11 (<1%) | 65 (<1%) | 63 (<1%) | 43 (1%) | 555 (2%) | |
| >6 months to 18 years | 81 (1%) | 196 (1%) | 323 (2%) | 162 (3%) | 1704 (6%) | |
| >18 to 40 years | 487 (8%) | 1176 (8%) | 2420 (15%) | 890 (16%) | 4719 (16%) | |
| >40 to 50 years | 452 (7%) | 927 (6%) | 2004 (12%) | 592 (10%) | 1882 (6%) | |
| >50 to 60 years | 961 (16%) | 1780 (12%) | 3229 (19%) | 823 (15%) | 2834 (9%) | |
| >60 to 70 years | 1126 (18%) | 2582 (18%) | 3310 (20%) | 1023 (18%) | 4542 (15%) | |
| >70 to 80 years | 1192 (19%) | 3067 (21%) | 2833 (17%) | 988 (17%) | 5945 (20%) | |
| >80 years | 1815 (30%) | 4578 (32%) | 2471 (15%) | 1157 (20%) | 8191 (27%) | |
| Male | 3249 (53%) | 7698 (54%) | 9066 (54%) | 3077 (54%) | 14,994 (49%) | |
| Rurality | Rural | 268 (4.4%) | 610 (4.3%) | 725 (4.4%) | 622 (11%) | 3262 (11%) |
| Urban | 5830 (96%) | 13,710 (96%) | 15,850 (96%) | 5036 (89%) | 26,997 (89%) | |
| Missing | 29 (<1%) | 51 (<1%) | 78 (<1%) | 20 (<1%) | 113 (<1%) | |
| Deprivation quintile | 1 (least marginalised) | 923 (15%) | 2180 (15%) | 2349 (14%) | 859 (16%) | 4771 (16%) |
| 2 | 988 (17%) | 2353 (17%) | 2701 (17%) | 944 (17%) | 5146 (17%) | |
| 3 | 1152 (19%) | 2613 (19%) | 3009 (19%) | 1002 (18%) | 5560 (19%) | |
| 4 | 1207 (20%) | 3049 (22%) | 3442 (21%) | 1157 (21%) | 6119 (21%) | |
| 5 (most marginalised) | 1707 (29%) | 3931 (28%) | 4743 (29%) | 1531 (28%) | 7932 (27%) | |
| Missing | 150 (2.4%) | 245 (1.7%) | 409 (2.5%) | 185 (3.3%) | 844 (2.8%) | |
| Instability quintile | 1 (least marginalised) | 988 (17%) | 2774 (20%) | 3509 (22%) | 1062 (19%) | 4638 (16%) |
| 2 | 795 (13%) | 2034 (14%) | 2461 (15%) | 925 (17%) | 4693 (16%) | |
| 3 | 1019 (17%) | 2059 (15%) | 2400 (15%) | 956 (17%) | 5110 (17%) | |
| 4 | 1255 (21%) | 2609 (18%) | 2897 (18%) | 985 (18%) | 6108 (21%) | |
| 5 (most marginalised) | 1920 (32%) | 4650 (33%) | 4977 (31%) | 1565 (28%) | 8979 (30%) | |
| Missing | 150 (2.4%) | 245 (1.7%) | 409 (2.5%) | 185 (3.3%) | 844 (2.8%) | |
| Dependency quintile | 1 (least marginalised) | 1372 (23%) | 3457 (24%) | 4857 (30%) | 1248 (23%) | 6329 (21%) |
| 2 | 1160 (19%) | 2764 (20%) | 3609 (22%) | 1121 (20%) | 5524 (19%) | |
| 3 | 1083 (18%) | 2291 (16%) | 2742 (17%) | 932 (17%) | 5110 (17%) | |
| 4 | 960 (16%) | 2369 (17%) | 2438 (15%) | 962 (18%) | 5337 (18%) | |
| 5 (most marginalised) | 1402 (23%) | 3245 (23%) | 2598 (16%) | 1230 (22%) | 7228 (24%) | |
| Missing | 150 (2.4%) | 245 (1.7%) | 409 (2.5%) | 185 (3.3%) | 844 (2.8%) | |
| Ethnic diversity quintile | 1 (least diverse) | 496 (8%) | 1125 (7%) | 1188 (7%) | 800 (14%) | 5101 (17%) |
| 2 | 705 (11%) | 1486 (10%) | 1606 (9%) | 977 (18%) | 5151 (18%) | |
| 3 | 910 (15%) | 1895 (13%) | 2177 (13%) | 1049 (19%) | 5307 (17%) | |
| 4 | 1211 (20%) | 3201 (23%) | 3590 (22%) | 1199 (22%) | 5982 (20%) | |
| 5 (most diverse) | 2728 (46%) | 6495 (46%) | 7783 (48%) | 1493 (27%) | 8280 (28%) | |
| Missing | 77 (1.3%) | 169 (1.2%) | 309 (1.9%) | 160 (2.8%) | 551 (1.8%) | |
| Long-term care resident | 1111 (18%) | 1468 (10%) | 252 (2%) | 133 (2%) | 1273 (4%) | |
| Supportive housing | 718 (12%) | 1320 (9%) | 410 (2%) | 271 (5%) | 1765 (6%) | |
| Charlson comorbidity score | 0.66 (SD: 1.51) | 0.68 (SD: 1.57) | 0.41 (SD: 1.25) | 0.55 (SD: 1.41) | 0.76 (SD: 1.65) | |
| Admission characteristics | ||||||
| Ambulance | 3693 (60%) | 9561 (67%) | 10,297 (62%) | 3351 (59%) | 16,603 (55%) | |
| Urgent | 5923 (97%) | 13,741 (96%) | 16,022 (96%) | 5350 (94%) | 27,174 (89%) | |
| Overnight admission | 2136 (35%) | 5368 (37%) | 6119 (37%) | 1988 (35%) | 10,829 (36%) | |
| Inter-hospital transfer | 476 (8%) | 1981 (14%) | 3489 (21%) | 799 (14%) | 1797 (6%) | |
| Outcomes | ||||||
| 90-day mortality | 1552 (25%) | 3684 (26%) | 2549 (15%) | 903 (16%) | 4944 (16%) | |
| Use of critical care | 1424 (24%) | 3155 (22%) | 4237 (25%) | 1517 (27%) | 4393 (14%) | |
| Total length of stay (days) | Mean (SD) days | 21.7 (39.4) | 18.7 (30.6) | 14.2 (24.8) | 25.4 (37.0) | 10.5 (14.3) |
| Median (IQR) days | 8.5 (3.6–23.8) | 9.0 (4.0–20.1) | 7.2 (3.7–14.7) | 8.9 (4.0–29.6) | 5.3 (2.2–12.6) | |
| Diagnostic codes associated with admission episode* | ||||||
| Infections or parasites (A, B) | 1434 (23%) | 3083 (21%) | 2978 (18%) | 1238 (22%) | 4886 (16%) | |
| Malignancy (C) | 373 (6%) | 1036 (7%) | 839 (5%) | 390 (7%) | 2851 (9%) | |
| Pre-malignancy (D) | 821 (13%) | 2063 (14%) | 2072 (12%) | 876 (15%) | 4243 (14%) | |
| Endocrine disorder (E) | 3057 (50%) | 7691 (54%) | 7780 (47%) | 2440 (43%) | 12,696 (42%) | |
| Mental health / addiction (F) | 1682 (27%) | 3911 (27%) | 3043 (18%) | 1297 (23%) | 6379 (21%) | |
| Nervous system disorder (G) | 712 (12%) | 1603 (11%) | 1358 (8%) | 646 (11%) | 2893 (10%) | |
| Eye/ear disorder (H) | 91 (1%) | 207 (1%) | 230 (1%) | 96 (2%) | 427 (1%) | |
| Circulatory system disorder (I) | 2833 (46%) | 7173 (50%) | 6978 (42%) | 2327 (41%) | 12,626 (42%) | |
| Respiratory system disorder (J) | 4006 (65%) | 10,041 (70%) | 12,632 (76%) | 3766 (66%) | 13,018 (43%) | |
| Digestive system disorder (K) | 878 (14%) | 2332 (16%) | 2277 (14%) | 916 (16%) | 5064 (17%) | |
| Skin disorder (L) | 454 (7%) | 1041 (7%) | 810 (5%) | 494 (9%) | 1560 (5%) | |
| Musculoskeletal system (M) | 730 (12%) | 1948 (14%) | 1703 (10%) | 781 (14%) | 3221 (11%) | |
| Genitourinary system (N) | 2144 (35%) | 5221 (36%) | 4494 (27%) | 1725 (30%) | 8819 (29%) | |
| Pregnancy or childbirth (O) | 87 (1.4%) | 403 (2.8%) | 564 (3.4%) | 253 (4.5%) | 2637 (8.7%) | |
| Perinatal condition (P) | 6 (<1%) | 18 (<1%) | 10 (<1%) | 11 (<1%) | 94 (<1%) | |
| Congenital condition (Q) | 39 (1%) | 79 (1%) | 100 (1%) | 36 (1%) | 247 (1%) | |
| AbnormaIab (R) | 2138 (35%) | 5331 (37%) | 5469 (33%) | 1975 (35%) | 9488 (31%) | |
| Injury / poisoning (S, T) | 602 (10%) | 1418 (10%) | 1375 (8%) | 787 (8%) | 3237 (11%) | |
IQR: interquartile range (25th–75th percentile); OLIS: Ontario Laboratories Information System; SD: standard deviation.
* Not mutually exclusive, any diagnostic position and type (ICD-10 diagnostic code starts with the indicated letter).
Table 2COVID-19 as most responsible diagnosis.
| Most responsible diagnosis was COVID-19 vs was not | |||
| OR (95% CI)* / ** | p value | ||
| COVID-19 wave (SARS-CoV-2 subvariant) | Wave 1 (wild-type) | 1.0 (ref) | <0.0001 |
| Wave 2 (wild-type) | 1.03 (0.91–1.16) | ||
| Wave 3 (Alpha-dominant) | 0.99 (0.86–1.14) | ||
| Wave 4 (Delta-dominant) | 0.36 (0.31–0.42) | ||
| Wave 5 (Omicron-dominant) | 0.46 (0.41–0.52) | ||
| Patient characteristics | |||
| Age (per decade) | 0.92 (0.87–0.99) | 0.02 | |
| Sex (male vs female) | 1.29 (1.21–1.37) | <0.0001 | |
| Rurality (rural vs urban) | 0.90 (0.79–1.04) | 0.14 | |
| Deprivation (vs least marginalised) | 0.74 | ||
| 2 | 1.07 (0.96–1.18) | ||
| 3 | 1.00 (0.91–1.11) | ||
| 4 | 1.01 (0.91–1.12) | ||
| 5 (most marginalised) | 1.01 (0.90–1.12) | ||
| Instability (vs least marginalised) | 0.05 | ||
| 2 | 0.89 (0.79–1.00) | ||
| 3 | 0.85 (0.75–0.95) | ||
| 4 | 0.95 (0.84–1.06) | ||
| 5 (most marginalised) | 0.90 (0.81–1.01) | ||
| Dependency (vs least marginalised) | 0.006 | ||
| 2 | 0.97 (0.87–1.09) | ||
| 3 | 0.99 (0.88–1.01) | ||
| 4 | 0.90 (0.81–1.01) | ||
| 5 (most marginalised) | 0.85 (0.76–0.95) | ||
| Ethnic diversity (vs least diverse) | <0.0001 | ||
| 2 | 0.86 (0.77–0.97) | ||
| 3 | 1.02 (0.91–1.14) | ||
| 4 | 1.11 (0.99–1.25) | ||
| 5 (most diverse) | 1.30 (1.15–1.47) | ||
| Long-term care resident (yes vs no) | 0.89 (0.81–0.97) | 0.01 | |
| Supportive housing (yes vs no) | 0.76 (0.70–0.83) | <0.0001 | |
| Charlson comorbidity score (per 1-point increase) | 0.91 (0.89–0.93) | <0.0001 | |
| Admission characteristics | |||
| Ambulance (yes vs no) | 1.22 (1.13–1.32) | <0.0001 | |
| Urgent (yes vs no) | 3.01 (2.30–3.94) | <0.0001 | |
| Overnight admission (yes vs no) | 1.04 (0.98–1.11) | 0.23 | |
| Hospital transfer (yes vs no) | 0.50 (0.45–0.56) | <0.0001 | |
| Critical care (yes vs no) | 1.12 (1.01–1.24) | 0.03 | |
* Odds ratios (OR) with 95% confidence intervals (CI) were derived from a logistic regression model.
** Adjusted for all covariates presented in this table.
During waves 1–3, 96% of all hospital admissions were for patients who lived in an urban region, which dropped to 90% during waves 4–5 (compared with ~86% for the entire Ontario population). Using the marginalisation index quintiles, patients hospitalised with SARS-CoV-2 were more likely to reside in an area having the highest quintile of residential instability (31% over all waves) and were more likely to reside in a neighbourhood assigned the highest quintile of material deprivation (28% over all waves), with little change over time. In contrast, 47% of all admitted patients during waves 1–3 resided in a neighbourhood assigned the highest ethnic diversity quintile, which fell to 29% during waves 4–5. The proportion of admitted patients who were residents of a LTC facility was 18% (n = 1099) during wave 1, which decreased to 10% (n = 1455) in wave 2 and remained <5% thereafter. The proportion of admitted patients who were transferred from supportive housing followed a similar trend as LTC residence. The reduction in mean comorbidity score (lowest in wave 3) was mirrored by a rise in the composition of patients who were <60 years of age (highest in wave 3).
Over the study period, admitted patients were more likely than not to arrive by ambulance (n = 43,505 or 59%) and be admitted during daytime hours (n = 46,761 or 64%). Most admissions were urgent (>95% in waves 1–3; 89% in wave 5). The number of admission episodes with at least one hospital transfer increased from 7.9% in wave 1 to 21% in wave 3, but subsequently declined to 14% in wave 4 and 5.8% in wave 5.
On the admission record starting the episode, with no restriction on diagnosis type, the four most common diagnostic codes were U071 (“COVID-19, identified”, J128 (“other viral pneumonia”), I100 (“benign hypertension”) and N179 (“acute renal failure, unspecified”) (figure S2). Restricting to post-admission diagnostic codes only, the five most common diagnoses were U071, N390 (“urinary tract infection, unspecified”), N179 (“acute renal failure, unspecified”), F059 (“delirium, unspecified”) and J128 (“other viral pneumonia”) (figure S3).
90-day mortality
Since the start of the admission episode, most deaths occurred within the first 3 months of admission, but survival improved beginning in wave 3 (figure 2). There were 3969 (20%) deaths within 30 days of admission during waves 1–2, but 5854 (12%) during waves 3–5. Similarly, 90-day mortality was 26% in waves 1–2 and 16% in waves 3–5.
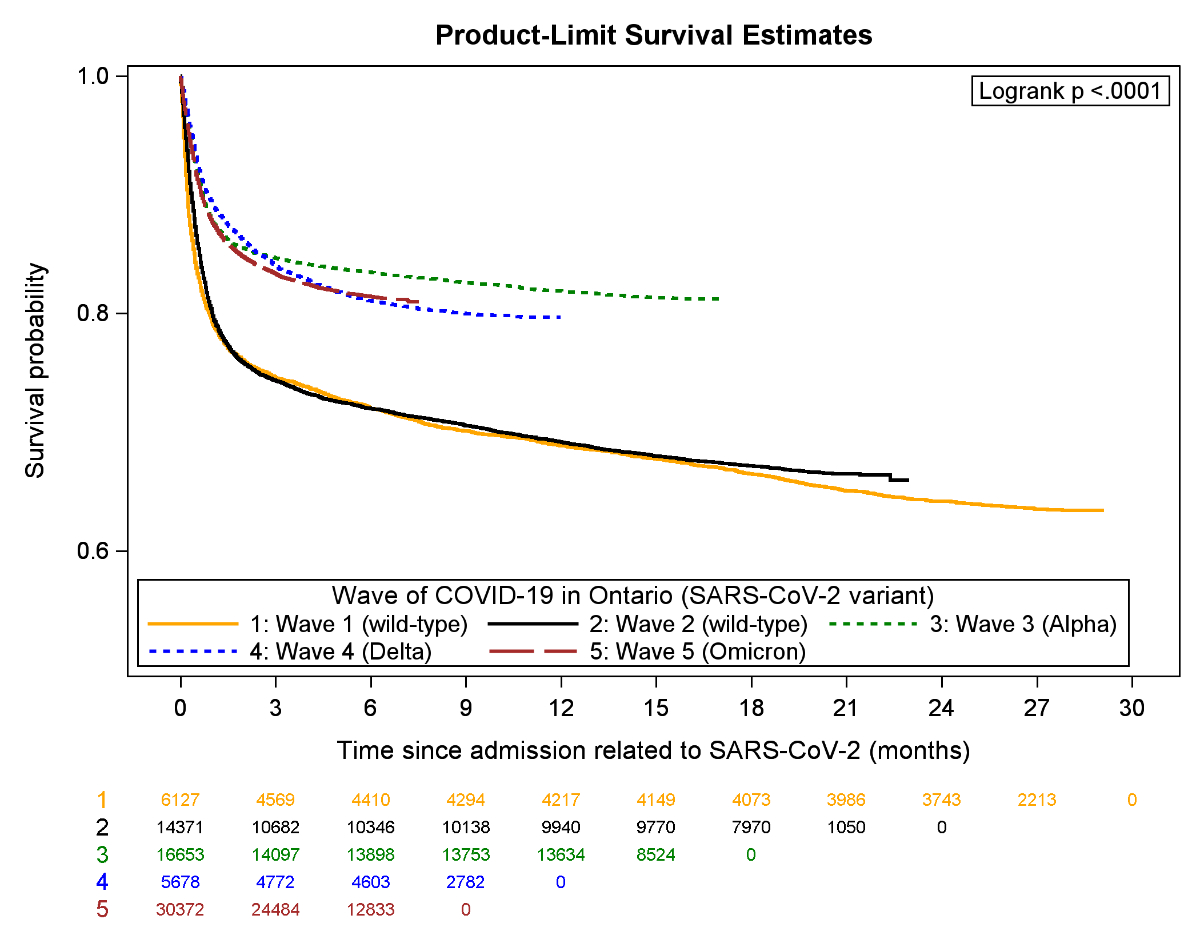
Figure 2Kaplan-Meier plot for overall survival by COVID-19 wave.
After adjustment, 90-day mortality was more likely among older patients (RR: 1.59 [1.57–1.61] per decade), males (RR: 1.19 [1.15–1.22]) and among patients residing in neighbourhoods assigned to the highest deprivation quintile (RR: 1.19 [1.13–1.25]) (table 3). Patients living in a LTC facility had higher mortality (RR: 1.58 [1.51–1.64]), as did patients who arrived by ambulance (RR: 1.36 [1.31–1.41]), were admitted urgently (RR: 1.62 [1.41–1.86]), required critical care (RR: 2.97 [2.88–3.06]), had greater comorbidity (RR: 1.13 [1.12–1.14]) and for whom SARS-CoV-2 was the most responsible diagnosis (p <0.0001).
Compared to wave 1, 90-day mortality risk was similar during wave 2 (RR: 1.00 [0.95–1.04]), but lower during wave 3 (RR: 0.89 [0.85–0.94]), wave 4 (RR: 0.85 [0.79–0.91]) and wave 5 (RR: 0.81 [0.78–0.86]). Using interaction terms with waves, survival changed over time according to whether SARS-CoV-2 was the most responsible diagnosis (p-interaction <0.0001), by age (p-interaction <0.0001), LTC residence (p- interaction = 0.03), ambulance arrival (p-interaction = 0.04), hospital transfer during the admission (p-interaction <0.0001) and use of critical care (p-interaction <0.0001). Stratified by age, mortality did not change over time among patients in their 40s (p = 0.26), 50s (p = 0.51) or 60s (p = 0.36) (table 4). However, among elderly patients, 90-day mortality progressively improved (RR: 0.85 [0.77–0.94] for 70–80-year-olds and RR: 0.75 [0.71–0.80] for >80-year-olds in wave 5 vs wave 1]. Survival did not change over time for patients requiring critical care (p = 0.28), but improved for patients who did not require critical care (RR: 0.77 [0.71–0.81] in wave 5 vs wave 1). Survival improved by wave 5 regardless of whether SARS-CoV-2 was the most responsible diagnosis (RR: 0.88 [0.83–0.94]) or another diagnosis type (RR: 0.79 [0.71–0.87]) (table 5).
Table 3Outcomes.
| 90-day mortality | Critical care | Total length of stay (days) | ||||||
| RR (95% CI)* / ** | p value | p-int*** | OR (95% CI)# | p value | Beta (95% CI)## | p value | ||
| COVID-19 wave (subvariant) | Wave 1 (wild-type) | 1.0 (ref) | <0.0001 | n/a | 1.0 (ref) | <0.0001 | 0 (ref) | |
| Wave 2 (wild-type) | 1.00 (0.95–1.04) | 0.76 (0.71–0.82) | –4.0 (–5.1 to –3.0) | <0.0001 | ||||
| Wave 3 (Alpha) | 0.89 (0.85–0.94) | 0.73 (0.68–0.79) | –7.7 (–8.7 to –6.7) | <0.0001 | ||||
| Wave 4 (Delta) | 0.85 (0.79–0.91) | 0.90 (0.83–0.99) | 3.0 (1.7–4.2) | <0.0001 | ||||
| Wave 5 (Omicron) | 0.83 (0.80–0.88) | 0.50 (0.47–0.54) | –10.4 (–11.4 to –9.4) | <0.0001 | ||||
| COVID-19 diagnosis type | Most responsible diagnosis | 1.0 (ref) | <0.0001 | <0.0001 | 1.0 (ref) | <0.0001 | 0 (ref) | |
| Other | 0.96 (0.92–0.99) | 0.87 (0.83–0.92) | 8.7 (8.2–9.2) | <0.0001 | ||||
| None (OLIS only) | 0.68 (0.64–0.72) | 0.63 (0.59–0.68) | 8.3 (7.5–9.1) | <0.0001 | ||||
| Patient characteristics | ||||||||
| Age (per decade) | 1.59 (1.57–1.61) | <0.0001 | <0.0001 | 0.97 (0.96–0.97) | <0.0001 | 1.7 (1.7–1.8) | <0.0001 | |
| Sex (male vs female) | 1.19 (1.15–1.22) | <0.0001 | 0.38 | 1.49 (1.43–1.55) | <0.0001 | 1.1 (0.7–1.4) | <0.0001 | |
| Rurality (rural vs urban) | 1.01 (0.95–1.08) | 0.77 | 0.20 | 1.16 (1.07–1.26) | 0.0003 | –2.9 (–3.5 to –2.2) | <0.0001 | |
| Deprivation | 1 (least marginalised) | 1.0 (ref) | <0.0001 | 0.98 | 1.0 (ref) | <0.0001 | 0 (ref) | |
| 2 | 1.04 (0.99–1.10) | 1.02 (0.95–1.09) | –0.5 (–1.1 to –0.1) | 0.09 | ||||
| 3 | 1.10 (1.05–1.16) | 1.06 (1.00–1.14) | –0.6 (–1.2 to –0.0) | 0.04 | ||||
| 4 | 1.12 (1.06–1.17) | 1.09 (1.01–1.16) | –0.9 (–1.5 to –0.3) | 0.003 | ||||
| 5 (most marginalised) | 1.19 (1.13–1.25) | 1.21 (1.13–1.29) | –1.1 (–1.7 to –0.6) | 0.0001 | ||||
| Instability | 1 (least marginalised) | 1.0 (ref) | 0.20 | 0.74 | 1.0 (ref) | 0.14 | 0 (ref) | |
| 2 | 1.03 (0.98–1.08) | 1.05 (0.98–1.12) | 0.8 (0.3–1.4) | 0.004 | ||||
| 3 | 1.01 (0.96–1.07) | 0.97 (0.91–1.04) | 1.1 (0.5–1.7) | 0.0001 | ||||
| 4 | 1.00 (0.95–1.05) | 0.97 (0.90–1.03) | 1.7 (1.1–2.3) | <0.0001 | ||||
| 5 (most marginalised) | 0.97 (0.93–1.02) | 0.98 (0.92–1.05) | 2.3 (1.8–2.9) | <0.0001 | ||||
| Dependency | 1 (least marginalised) | 1.0 (ref) | 0.25 | 0.19 | 1.0 (ref) | <0.0001 | 0 (ref) | |
| 2 | 1.00 (0.95–1.05) | 1.01 (0.95–1.07) | 0.3 (–0.2 to 0.8) | 0.28 | ||||
| 3 | 1.00 (0.95–1.05) | 0.91 (0.86–0.97) | 0.6 (0.1–1.2) | 0.02 | ||||
| 4 | 1.01 (0.97–1.06) | 0.98 (0.92–1.05) | 0.0 (–0.6 to 0.5) | 0.96 | ||||
| 5 (most marginalised) | 0.97 (0.91–1.01) | 0.84 (0.79–0.90) | 1.7 (1.1–2.3) | <0.0001 | ||||
| Ethnic diversity | 1 (least diverse) | 1.0 (ref) | 0.07 | 0.13 | 1.0 (ref) | <0.0001 | 0 (ref) | |
| 2 | 0.98 (0.92–1.03) | 0.96 (0.89–1.04) | 1.5 (0.9–2.2) | <0.0001 | ||||
| 3 | 0.95 (0.90–1.01) | 0.84 (0.77–0.91) | 1.0 (0.3–1.7) | 0.003 | ||||
| 4 | 0.93 (0.88–0.98) | 0.78 (0.72–0.85) | 1.2 (0.5–1.9) | 0.0004 | ||||
| 5 (most diverse) | 0.96 (0.91–1.02) | 0.71 (0.66–0.77) | 0.4 (–0.3 to 1.0) | 0.24 | ||||
| Long-term care resident (yes vs no) | 1.58 (1.51–1.64) | <0.0001 | 0.03 | 0.49 (0.44–0.54) | <0.0001 | 0.3 (–0.7 to 1.3) | 0.56 | |
| Supportive housing (yes vs no) | 1.05 (1.00–1.09) | 0.06 | 0.06 | 0.42 (0.38–0.46) | <0.0001 | 3.1 (2.2–4.0) | <0.0001 | |
| Charlson comorbidity score (per unit) | 1.13 (1.12–1.14) | <0.0001 | 0.05 | 1.01 (1.00–1.03) | 0.05 | 0.8 (0.7–0.9) | <0.0001 | |
| Admission characteristics | ||||||||
| Ambulance (yes vs no) | 1.36 (1.31–1.41) | <0.0001 | 0.04 | 1.60 (1.53–1.67) | <0.0001 | 2.1 (1.7–2.5) | <0.0001 | |
| Urgent admission (yes vs no) | 1.62 (1.41–1.86) | <0.0001 | 0.70 | 1.53 (1.37–1.71) | <0.0001 | 2.1 (1.4–2.8) | <0.0001 | |
| Overnight admission (yes vs no) | 0.97 (0.94–1.00) | 0.05 | 0.40 | 0.93 (0.89–0.96) | 0.0002 | 0.0 (–0.4 to 0.3) | 0.93 | |
| Hospital transfer (yes vs no) | 0.89 (0.85–0.93) | <0.0001 | <0.0001 | 3.52 (3.34–3.70) | <0.0001 | 20.1 (19.1–21.0) | <0.0001 | |
| Critical care (yes vs no) | 2.97 (2.88–3.06) | <0.0001 | <0.0001 | – | – | 11.7 (11.1–12.2) | <0.0001 | |
* Risk ratios (RR) with 95% confidence intervals (CI) were derived from a modified Poisson regression model predicting 90-day mortality since the start of the admission episode.
** Adjusted for all covariates presented in this table.
*** p value from interaction term with COVID-19 wave.
# Odds ratio (OR) with 95% confidence intervals (CI) from logistic regression predicting use of critical care anytime during the hospital stay.
## Beta coefficient interpretable as the number of days longer (positive) or shorter (negative) than the reference category, a 10-year increase in age or a 1-unit increase in comorbidity score. Beta coefficients correspond to ordinary least square regression (identity link, normal distribution) with standard errors and p values estimated using heteroscedasticity-consistent standard error estimators.
Table 490-day mortality stratified by covariates with a significant statistical interaction with wave (see table 3). Risk ratios (RR) with 95% confidence intervals (CI) were derived from a modified Poisson regression with wave 1 serving as the reference category. RRs are adjusted for all covariates presented in table 2.
| Characteristic | Wave 1 (wild-type) | Wave 2 (wild-type) | Wave 3 (Alpha) | Wave 4 (Delta) | Wave 5 (Omicron) | Overall | |
| n = 6116 | n = 14,365 | n = 16,646 | n = 5671 | n = 30,368 | p value | ||
| 90-day mortality | n (%) | 1552 (25%) | 3684 (26%) | 2549 (15%) | 903 (16%) | 4944 (16%) | – |
| Crude RR | 1.0 (ref) | 1.01 (0.96–1.06) | 0.60 (0.57–0.64) | 0.63 (0.58–0.68) | 0.64 (0.61–0.67) | <0.0001 | |
| Adjusted RR | 1.0 (ref) | 1.00 (0.95–1.04) | 0.89 (0.85–0.94) | 0.85 (0.79–0.91) | 0.81 (0.80–0.88) | <0.0001 | |
| By age group* | >40 to 50-year-olds | 1.0 (ref) | 0.66 (0.42–1.03) | 0.77 (0.52–1.14) | 0.70 (0.43–1.12) | 0.91 (0.60–1.38) | 0.26 |
| >50 to 60-year-olds | 1.0 (ref) | 1.07 (0.84–1.36) | 1.04 (0.83–1.30) | 1.10 (0.84–1.45) | 1.19 (0.95–1.50) | 0.51 | |
| >60 to 70-year-olds | 1.0 (ref) | 0.91 (0.80–1.05) | 0.89 (0.77–1.02) | 0.85 (0.71–1.02) | 0.87 (0.76–1.00) | 0.36 | |
| >70 to 80-year-olds | 1.0 (ref) | 1.04 (0.94–1.15) | 0.92 (0.83–1.03) | 0.87 (0.76–1.00) | 0.85 (0.77–0.94) | <0.0001 | |
| >80-year-olds | 1.0 (ref) | 1.02 (0.97–1.08) | 0.93 (0.87–1.00) | 0.83 (0.75–0.91) | 0.75 (0.71–0.80) | <0.0001 | |
| By long-term care residence (age 65+)** | Non-resident | 1.0 (ref) | 0.99 (0.93–1.05) | 0.91 (0.86–0.97) | 0.84 (0.77–0.91) | 0.81 (0.76–0.86) | <0.0001 |
| Resident | 1.0 (ref) | 1.09 (1.01–1.18) | 0.85 (0.72–1.01) | 0.83 (0.66–1.04) | 0.76 (0.69–0.84) | <0.0001 | |
| COVID as most responsible diagnosis | Most responsible diagnosis | 1.0 (ref) | 0.98 (0.93–1.04) | 0.89 (0.84–0.95) | 0.92 (0.85–1.00) | 0.88 (0.83–0.94) | <0.0001 |
| Other diagnosis type | 1.0 (ref) | 1.12 (1.01–1.24) | 0.94 (0.84–1.06) | 0.84 (0.73–0.97) | 0.79 (0.71–0.87) | <0.0001 | |
| OLIS | 1.0 (ref) | 0.85 (0.68–1.06) | 0.85 (0.67–1.08) | 0.61 (0.47–0.79) | 0.86 (0.71–1.05) | 0.002 | |
| Critical care | No | 1.0 (ref) | 1.02 (0.96–1.08) | 0.82 (0.76–0.88) | 0.73 (0.66–0.80) | 0.77 (0.72–0.81) | <0.0001 |
| Yes | 1.0 (ref) | 1.04 (0.96–1.12) | 1.00 (0.93–1.08) | 1.06 (0.96–1.17) | 1.06 (0.98–1.15) | 0.28 | |
| Ambulance arrival | No | 1.0 (ref) | 1.06 (0.95–1.20) | 1.00 (0.88–1.13) | 0.97 (0.84–1.13) | 0.89 (0.80–1.00) | 0.007 |
| Yes | 1.0 (ref) | 0.98 (0.93–1.03) | 0.86 (0.81–0.91) | 0.81 (0.75–0.88) | 0.82 (0.77–0.86) | <0.0001 | |
| Hospital transfer | No | 1.0 (ref) | 0.98 (0.93–1.030 | 0.87 (0.83–0.92) | 0.84 (0.78–0.90) | 0.80 (0.76–0.84) | <0.0001 |
| Yes | 1.0 (ref) | 1.32 (1.08–1.61) | 1.11 (0.91–1.36) | 1.09 (0.85–1.39) | 1.31 (1.06–1.61) | 0.0004 | |
OLIS: Ontario Laboratories Information System.
* Very few deaths occurred for patients <40 years.
** p = 0.054 for interaction between wave and long-term care residence.
Table 5Outcomes by COVID-19 diagnosis type.
| Characteristic | Wave 1 (wild-type) | Wave 2 (wild-type) | Wave 3 (Alpha) | Wave 4 (Delta) | Wave 5 (Omicron) | ||
| n = 6116 | n = 14,365 | n = 16,646 | n = 5671 | n = 30,368 | |||
| 90-day mortality | RR (95% CI) | RR (95% CI) | RR (95% CI) | RR (95% CI) | p value* | ||
| COVID-19 as most responsible diagnosis | 1.0 (ref) | 0.98 (0.93–1.04) | 0.89 (0.84–0.95) | 0.92 (0.85–1.00) | 0.88 (0.83–0.94) | <0.0001 | |
| COVID-19 as other diagnosis type | 1.0 (ref) | 1.12 (1.01–1.24) | 0.94 (0.84–1.06) | 0.84 (0.73–0.97) | 0.79 (0.71–0.87) | <0.0001 | |
| COVID-19 identified only through OLIS | 1.0 (ref) | 0.85 (0.68–1.06) | 0.85 (0.67–1.08) | 0.61 (0.47–0.79) | 0.86 (0.71–1.05) | 0.002 | |
| Use of critical care | OR (95% CI) | OR (95% CI) | OR (95% CI) | OR (95% CI) | p value* | ||
| COVID-19 as most responsible diagnosis | 1.0 (ref) | 0.69 (0.63–0.75) | 0.65 (0.59–0.71) | 0.80 (0.72–0.89) | 0.39 (0.36–0.43) | <0.0001 | |
| COVID-19 as other diagnosis type | 1.0 (ref) | 1.08 (0.90–1.30) | 1.19 (0.99–1.43) | 1.31 (1.07–1.61) | 0.81 (0.69–0.96) | <0.0001 | |
| COVID-19 identified only through OLIS | 1.0 (ref) | 0.97 (0.73–1.29) | 0.94 (0.71–1.26) | 1.17 (0.88–1.57) | 0.92 (0.71–1.18) | 0.21 | |
| Total length of stay | Beta (95% CI) | Beta (95% CI) | Beta (95% CI) | Beta (95% CI) | p value* | ||
| COVID-19 as most responsible diagnosis | 0.0 (ref) | –5.1 (–5.7 to –4.5) | –6.4 (–7.0 to –5.8) | –4.9 (–5.7 to –4.1) | –7.1 (–7.7 to –6.5) | <0.0001 | |
| COVID-19 as other diagnosis type | 0.0 (ref) | 2.0 (0.2–3.7) | –5.1 (–6.9 to –3.2) | 16.5 (14.5–18.6) | –9.7 (–11.3 to –8.1) | <0.0001 | |
| COVID-19 identified only through OLIS | 0.0 (ref) | –4.2 (–7.3 to –1.0) | –11.5 (–14.7 to –8.4) | 7.0 (3.6–10.4) | –14.8 (–17.6 to –12.0) | <0.0001 | |
Beta: coefficient from linear regression, in days; CI: Confidence interval; OLIS: Ontario Laboratories Information System; OR: Odds ratio (coefficient from logistic regression); RR: Risk ratio (coefficient from modified Poisson regression).
* Adjusted for all variables in table 3.
Critical care
Use of critical care was least likely during wave 5 (OR: 0.50 [0.47–0.54]) and more likely if SARS-CoV-2 was the most responsible diagnosis (p<0.0001). Use of critical care was also more likely among males (OR: 1.49 [1.43–1.55]), younger patients (OR: 0.97 [0.96–0.97] per 10-year increase in age), patients residing in the highest deprivation quintile (OR: 1.21 [1.13–1.29] vs least deprived), patients arriving by ambulance (OR: 1.60 [1.53–1.67]) and patients admitted urgently (OR: 1.53 [1.37–1.71]). Use of critical care was less likely among patients residing in the most dependent quintile (OR: 0.84 [0.79–0.90] vs least dependent), neighbourhoods with the highest ethnic diversity (OR: 0.71 [0.66–0.77] vs lowest ethnic diversity), LTC residents (OR: 0.49 [0.44–0.54]) and patients transferred from supportive housing (OR: 0.42 [0.38–0.46]).
Stratified by the diagnosis type, use of critical care decreased wave-over-wave more substantially when SARS-CoV-2 was the most responsible diagnosis (OR: 0.39 [0.36–0.43] for wave 5 versus 1), although there was little effect for patients where SARS-CoV-2 was not the most responsible diagnosis (OR: 0.81 [0.69–0.96] for wave 5 vs wave 1) or if diagnosed by Ontario Laboratories Information System alone (OR: 0.92 [0.71–1.18] for wave 5 vs wave 1) (table 5).
Length of stay
The total crude hospital length of stay was shortest during wave 5 (mean ± SD: 10.5 ± 14.3 days). After adjustment for patient and admission characteristics, the total admission length was a mean 7.8 (95% CI: 7.1–8.5) days and 10.5 (95% CI: 9.9–11.2) days shorter for patients admitted in wave 2 and 5, respectively, vs wave 1. The total length of stay was a mean 11.4 (95% CI: 11.0–11.8) days longer for patients requiring critical care and 8–9 days shorter if SARS-CoV-2 was the most responsible diagnosis. After additionally adjusting for 30-day mortality, these associations were qualitatively similar. Stratified by whether SARS-CoV-2 was the MRDx, wave-over-wave variation in LOS was substantial when SARS-CoV-2 was not the MRDx (longest LOS during wave 4 and shortest in wave 5), but remained somewhat steady across all waves when SARS-CoV-2 was the MRDx (range was 5–7 days shorter between waves 2–5 versus wave 1) (table 5).
We found that the wave-over-wave characteristics of patients hospitalised with COVID-19 changed markedly throughout the pandemic. Many of the sociodemographic disparities observed during the first two waves of the pandemic (e.g. higher rate of admission among the elderly, people from ethnically diverse neighbourhoods, residents of long-term care or supportive housing) were reduced by the third (Alpha-dominant) or fourth (Delta-dominant) waves as vaccination efforts beginning in the middle of wave 2 prioritised high-risk populations (figure 1). These efforts may have translated into an improved 90-day mortality, specifically among elderly patients.
Patients admitted with SARS-CoV-2 in the first wave were predominantly urban dwellers (96% compared with 85% in the rural areas) and were more likely to live in neighbourhoods in the quintile with the highest material deprivation (29%), the highest residential instability (32%) and the highest ethnic diversity (46%) [23]. By waves 4 (Delta-dominant) and 5 (Omicron-dominant), however, 89% of admitted patients resided in an urban area and 28% of admitted patients resided in neighbourhoods having the highest ethnic diversity. These findings are consistent with other studies demonstrating that more-marginalised communities were disproportionately affected by COVID-19 [12, 24, 25]. Active health system monitoring of SARS-CoV-2 positivity identified communities disproportionately affected by COVID-19, resulting in targeted vaccination efforts (figure 1) and prioritised modernisation of LTC facilities [1, 13, 26–28]. While wave-over-wave shift to rural residents may reflect the natural progression of viral transmission to less population-dense regions [29], reduced disparities based on ethnic diversity and LTC residency suggests that these efforts were successful in reducing (but not eliminating) the disproportionate burden of COVID-19 in marginalised neighbourhoods.
There were some indications that the severity of SARS-CoV-2 admissions attenuated over time, particularly with the Omicron variant (wave 5 in Ontario) [30–32]. We observed a small reduction in wave 5 in the proportion of admissions deemed urgent, patients arriving by ambulance, the proportion of admissions requiring critical care and the mean total length of stay. During waves 4–5, SARS-CoV-2 was the most responsible diagnosis in only 46% of patients admitted (compared with 73% in the first 3 waves). This observation may be driven by increases in incidental diagnoses, protection from prior immune responses and higher transmission despite lower case fatality associated with the Omicron variant [33–35]. Even after adjusting for important sociodemographic and clinical characteristics, we observed a reduction in 90-day mortality beginning in wave 3 for most groups of patients. Changes in survival were not observed among patients aged 40–69 years, which was unexpected since vaccination eligibility was expanded to 18+ four months before the start of the fourth wave (a wavelet attributed to the Delta variant) and 8 months before the start of the fifth wave (driven by the Omicron variant). Although survival was generally higher among younger patients, the lack of wave-over-wave improvement in this group requires further investigation and is likely multifactorial (e.g. vaccine hesitancy among young adults, small room for improvement or changing case mix) [14, 36].
Studies in the literature reported similar shifts in sociodemographic characteristics, with reductions in age and comorbidities across waves [37–42]. In particular, several studies reported lower age over time, including studies conducted in the United Kingdom [37], United States [38, 39], Europe [40, 42], South America [41] and Canada [11]. One study found that individuals with Omicron tended to be 20–40 years old, whereas Delta infections were more often found in children 12 years or younger or in adults 60 years or older [9]. In one study, there was a higher number of black patients hospitalised in the third wave compared to the first two waves [38]. Additionally, the Delta variant had a more uniform geographical spread, whereas Omicron was more concentrated within urban geographical regions in British Columbia [9]. Similar to our study, admitted patients were less likely to be LTC residents by wave 3 [43].
Owing to a multitude of factors (e.g. decreasing age and comorbidity, vaccination efforts, change in treatment), several studies internationally reported reductions in total admission length of stay or use of critical care over time [11, 38–42, 44–46]. One Canadian study found no difference in mortality among older adults (≥65 years) after adjusting for age, sex, number of comorbidities, ICU admission, frailty and delirium between waves 1–3. [43]. This aligns with our study, where we observed improvement in survival among patients ≥70 years by the Delta and Omicron waves. In one English study that stratified the results by ethnic group, a lower mortality was reported over time during the first two waves of the pandemic, but the decline in mortality was more pronounced among the white group [47]. One Canadian study from Alberta and Ontario observed a 2-fold increase in mortality in the Delta wave compared to previous waves [11]. A more recent Canadian study demonstrated reduced mortality with Omicron compared with wild-type and Alpha, but no difference with Delta, but did not assess changing use of critical care and was not population-based (comprised a subcohort of an angiotensin receptor blocker observational cohort) [48]. A study from Copenhagen observed a 40% reduction in 6-day mortality after admission with Omicron versus Delta [7].
One of the strengths of this study is the examination of patient characteristics and outcomes over time and stratified by important sociodemographic characteristics. Our findings are consistent with reports from the early pandemic for 90-day mortality (24.4% in Brazil, 20.3% from the United States) and total length of stay, in addition to the sociodemographic characteristics associated with hospitalisations [49, 50]. Thus, we expect our results to be generalisable to other jurisdictions. Moreover, this is the first population-based study in Ontario (Canada’s most populous province) that includes the Omicron wave.
The hypothesis-generating nature of this study is another strength of this work. The most common post-admission diagnosis was SARS-CoV-2, which may represent a subset of patients who contracted SARS-CoV-2 during their hospital admission or were diagnosed incidentally during their admission [51]. The next most common post-admission diagnoses included urinary tract infection and acute renal failure [51]. Acute kidney injury has been documented as a common and serious adverse event associated with SARS-CoV-2 infection. Acute kidney injury is a risk factor for end-stage renal disease [52], but whether this relationship holds when SARS-CoV-2 is the aetiological agent remains to be established. These represent important avenues for future work.
One limitation is that SARS-CoV-2 vaccination data were unavailable for analysis. Vaccination efforts prioritised high-risk populations based on existing morbidity (e.g. chronic kidney disease), setting (e.g. long-term care facility) and geography (e.g. neighbourhoods with high marginalisation indices based on postcode). The drastic changes in patient sociodemographics since the early pandemic suggests that these efforts were effective, but the high prevalence of acute kidney failure among patients hospitalised with SARS-CoV-2 requires further examination. Second, without individual-level sociodemographic information, we instead relied on neighbourhood-level characteristics. While these were informative and valid for this work (e.g. since public health measures were often made at the neighbourhood-level), neighbourhood-level features are not a substitute for individual-level data such as race and ethnicity [53]. Third, there is no gold-standard definition for SARS-CoV-2-related admission. Although pressure on laboratories and the resulting backlog is unlikely to affect hospitalised patients who may be prioritised over community testing, validation is needed. Our survival analysis suggests that using DAD, even in the absence of evidence from Ontario Laboratories Information System, identified many patients hospitalised for SARS-CoV-2 that may not be captured by OLIS. The 90% coverage by OLIS that we observed is expected, since not all laboratories report to OLIS. Fourth, the characteristics of patients admitted for SARS-CoV-2 infection may differ from those admitted with SARS-CoV-2 infection. We used COVID-19 as the most responsible diagnosis as a surrogate for this, but validation is needed. Fifth, we only retained the first-ever admission episode per patient related to SARS-CoV-2 infection. This was done in order to reduce bias when comparing outcomes between different waves, since the likelihood of previous admissions increases over time and may influence the outcomes for subsequent admissions.
Over the course of the pandemic, the sociodemographic characteristics of patients hospitalised with SARS-CoV-2 changed significantly, but SARS-CoV-2 hospitalisations still disproportionately affected more-marginalised regions. Improved survival and reduced use of critical care during the Omicron wave are reassuring.
Ontario Health is prohibited from making the data used in this research publicly accessible if it includes potentially identifiable personal health information and/or personal information as defined in Ontario law, specifically the Personal Health Information Protection Act (PHIPA) and the Freedom of Information and Protection of Privacy Act (FIPPA). Due to these legal and ethical restrictions, data will not be made publicly available. However, upon request, data deidentified to a level suitable for public release may be provided.
Data source acknowledgments: Parts of this material are based on data and information compiled and provided by the Canadian Institute of Health Information (CIHI) and the Ministry of Health (MOH). However, the analyses, conclusions, opinions and statements expressed herein are those of the authors, and not necessarily those of CIHI or MOH.
We acknowledge the support of the Ministry of Health in this report. All views expressed are those of the authors of this report and do not necessarily reflect those of Ontario Health or the Ministry.
This research received no specific grant from any funding agency.
All authors have completed and submitted the International Committee of Medical Journal Editors form for disclosure of potential conflicts of interest. No potential conflict of interest related to the content of this manuscript was disclosed.
1. COVID-19 Intervention Timeline in Canada | CIHI [Internet]. [cited 2022 Sep 14]. Available from: https://www.cihi.ca/en/covid-19-intervention-timeline-in-canada
2. Lee JK, Bullen C, Ben Amor Y, Bush SR, Colombo F, Gaviria A, et al.; The Lancet COVID-19 Commission Task Force for Public Health Measures to Suppress the Pandemic. Institutional and behaviour-change interventions to support COVID-19 public health measures: a review by the Lancet Commission Task Force on public health measures to suppress the pandemic. Int Health. 2021 Sep;13(5):399–409. 10.1093/inthealth/ihab022
3. Lopez-Leon S, Forero DA, Ruiz-Díaz P. Recommendations for working from home during the COVID-19 pandemic (and beyond). Work. 2020;66(2):371–5. 10.3233/WOR-203187
4. Feikin DR, Higdon MM, Abu-Raddad LJ, Andrews N, Araos R, Goldberg Y, et al. Duration of effectiveness of vaccines against SARS-CoV-2 infection and COVID-19 disease: results of a systematic review and meta-regression. Lancet. 2022 Mar;399(10328):924–44. 10.1016/S0140-6736(22)00152-0
5. Tabatabai M, Juarez PD, Matthews-Juarez P, Wilus DM, Ramesh A, Alcendor DJ, et al. An Analysis of COVID-19 Mortality During the Dominancy of Alpha, Delta, and Omicron in the USA. J Prim Care Community Health. 2023;14:21501319231170164. 10.1177/21501319231170164
6. Nyberg T, Ferguson NM, Nash SG, Webster HH, Flaxman S, Andrews N, et al.; COVID-19 Genomics UK (COG-UK) consortium. Comparative analysis of the risks of hospitalisation and death associated with SARS-CoV-2 omicron (B.1.1.529) and delta (B.1.617.2) variants in England: a cohort study. Lancet. 2022 Apr;399(10332):1303–12. 10.1016/S0140-6736(22)00462-7
7. COVID-19 Omicron Delta study group. Clinical progression, disease severity, and mortality among adults hospitalized with COVID-19 caused by the Omicron and Delta SARS-CoV-2 variants: A population-based, matched cohort study. PLoS One. 2023 Apr;18(4):e0282806. 10.1371/journal.pone.0282806
8. Strasser ZH, Greifer N, Hadavand A, Murphy SN, Estiri H. Estimates of SARS-CoV-2 Omicron BA.2 Subvariant Severity in New England. JAMA Netw Open. 2022 Oct;5(10):e2238354. 10.1001/jamanetworkopen.2022.38354
9. Harrigan SP, Wilton J, Chong M, Abdia Y, Velasquez Garcia H, Rose C, et al. Clinical Severity of Severe Acute Respiratory Syndrome Coronavirus 2 Omicron Variant Relative to Delta in British Columbia, Canada: A Retrospective Analysis of Whole-Genome Sequenced Cases. Clin Infect Dis. 2023 Feb;76(3):e18–25. 10.1093/cid/ciac705
10. Ulloa AC, Buchan SA, Daneman N, Brown KA. Estimates of SARS-CoV-2 Omicron Variant Severity in Ontario, Canada. JAMA. 2022 Apr;327(13):1286–8. 10.1001/jama.2022.2274
11. McAlister FA, Nabipoor M, Chu A, Lee DS, Saxinger L, Bakal JA. The impact of shifting demographics, variants of concern and vaccination on outcomes during the first 3 COVID-19 waves in Alberta and Ontario: a retrospective cohort study. C open. 2022 Apr 1;10(2):E400–8.
12. Wang L, Calzavara A, Baral S, Smylie J, Chan AK, Sander B, et al. Differential Patterns by Area-Level Social Determinants of Health in Coronavirus Disease 2019 (COVID-19)-Related Mortality and Non-COVID-19 Mortality: A Population-Based Study of 11.8 Million People in Ontario, Canada. Clin Infect Dis. 2023 Mar;76(6):1110–20. 10.1093/cid/ciac850
13. Mishra S, Stall NM, Ma H, Odutayo A, Kwong JC, Allen U, et al. A Vaccination Strategy for Ontario COVID-19 Hotspots and Essential Workers. 2021 Apr 23; 10.47326/ocsat.2021.02.26.1.0
14. Ontario Agency for Health Protection and Promotion (Public Health Ontario). Hospitalizations and Deaths among COVID-19 Cases in Ontario by Age: Waves 1, 2, 3, 4 and 5 [Internet]. Ontario Agency for Health Protection and Promotion (Public Health Ontario). Toronto, ON: Queen’s Printer for Ontario; 2022.
15. Habbous S, Lambrinos A, Petersen S, Hellsten E. The effect of the COVID-19 pandemic on hospital admissions and outpatient visits in Ontario, Canada. Ann Thorac Med. 2023;18(2):70–8. 10.4103/atm.atm_376_22
16. Canadian Institute for Health Information. Indicator Library: General Methodology Notes — Clinical Indicators [Internet]. Ottawa; 2021.
17. Sheehan KJ, Sobolev B, Guy P, Bohm E, Hellsten E, Sutherland JM, et al.; Canadian Collaborative Study on Hip Fractures. Constructing an episode of care from acute hospitalization records for studying effects of timing of hip fracture surgery. J Orthop Res. 2016 Feb;34(2):197–204. 10.1002/jor.22997
18. Faes C, Abrams S, Van Beckhoven D, Meyfroidt G, Vlieghe E, Hens N; Belgian Collaborative Group on COVID-19 Hospital Surveillance. Time between Symptom Onset, Hospitalisation and Recovery or Death: Statistical Analysis of Belgian COVID-19 Patients. Int J Environ Res Public Health. 2020 Oct;17(20):1–18. 10.3390/ijerph17207560
19. Chung H, Azimaee M, Bronskill SE, Cartagena R, Guttmann A, Ho MM, et al. Pivoting data and analytic capacity to support Ontario’s COVID-19 response. Int J Popul Data Sci. 2022 Jan;5(3):1682. 10.23889/ijpds.v5i4.1682
20. Matheson FI, Moloney G, van Ingen T; Ontario Agency for Health Protection and Promotion. (Public Health Ontario). 2016 Ontario marginalization index: user guide [Internet]. 1st revisi. Toronto, ON: St. Michael’s Hospital (Unity Health Toronto). Joint publication with Public Health Ontario; 2022.
21. Zou G. A modified poisson regression approach to prospective studies with binary data. Am J Epidemiol. 2004 Apr;159(7):702–6. 10.1093/aje/kwh090
22. Hayes AF, Cai L. Using heteroskedasticity-consistent standard error estimators in OLS regression: an introduction and software implementation. Behav Res Methods. 2007 Nov;39(4):709–22. 10.3758/BF03192961
23. Nana-Sinkam P, Kraschnewski J, Sacco R, Chavez J, Fouad M, Gal T, et al. Health disparities and equity in the era of COVID-19. J Clin Transl Sci. 2021 Mar;5(1):e99. 10.1017/cts.2021.23
24. McGowan VJ, Bambra C. COVID-19 mortality and deprivation: pandemic, syndemic, and endemic health inequalities. Lancet Public Health. 2022 Nov;7(11):e966–75. 10.1016/S2468-2667(22)00223-7
25. Khanijahani A, Iezadi S, Gholipour K, Azami-Aghdash S, Naghibi D. A systematic review of racial/ethnic and socioeconomic disparities in COVID-19. Int J Equity Health. 2021 Nov;20(1):248. 10.1186/s12939-021-01582-4
26. Saad A, Magwood O, Benjamen J, Haridas R, Hashmi SS, Girard V, et al. Health Equity Implications of the COVID-19 Lockdown and Visitation Strategies in Long-Term Care Homes in Ontario: A Mixed Method Study. Int J Environ Res Public Health. 2022 Apr;19(7):4275. 10.3390/ijerph19074275
27. Liu M, Maxwell CJ, Armstrong P, Schwandt M, Moser A, McGregor MJ, et al. COVID-19 in long-term care homes in Ontario and British Columbia. CMAJ. 2020 Nov;192(47):E1540–6. 10.1503/cmaj.201860
28. Wong BM, Rotteau L, Feldman S, Lamb M, Liang K, Moser A, et al. A Novel Collaborative Care Program to Augment Nursing Home Care During and After the COVID-19 Pandemic. J Am Med Dir Assoc. 2022 Feb;23(2):304–307.e3. 10.1016/j.jamda.2021.11.018
29. Siraj A, Worku A, Berhane K, Aregawi M, Eshetu M, Mirkuzie A, et al. Early estimates of COVID-19 infections in small, medium and large population clusters. BMJ Glob Health. 2020 Sep;5(9):3055. 10.1136/bmjgh-2020-003055
30. Abdullah F, Myers J, Basu D, Tintinger G, Ueckermann V, Mathebula M, et al. Decreased severity of disease during the first global omicron variant covid-19 outbreak in a large hospital in tshwane, south africa. Int J Infect Dis. 2022 Mar;116:38–42. 10.1016/j.ijid.2021.12.357
31. Iuliano AD, Brunkard JM, Boehmer TK, Peterson E, Adjei S, Binder AM, et al. Trends in Disease Severity and Health Care Utilization During the Early Omicron Variant Period Compared with Previous SARS-CoV-2 High Transmission Periods - United States, December 2020-January 2022. MMWR Morb Mortal Wkly Rep. 2022 Jan;71(4):146–52. 10.15585/mmwr.mm7104e4
32. Taylor CA, Patel K, Pham H, Whitaker M, Anglin O, Kambhampati AK, et al.; COVID-NET Surveillance Team. Severity of Disease Among Adults Hospitalized with Laboratory-Confirmed COVID-19 Before and During the Period of SARS-CoV-2 B.1.617.2 (Delta) Predominance - COVID-NET, 14 States, January-August 2021. MMWR Morb Mortal Wkly Rep. 2021 Oct;70(43):1513–9. 10.15585/mmwr.mm7043e1
33. Péré H, Védie B, Vernet R, Demory N, Kassis N, Mirault T, et al. Unexpected diagnosis of COVID-19-associated disorders by SARS-CoV-2-specific serology. J Clin Virol. 2020 Nov;132:104568. 10.1016/j.jcv.2020.104568
34. Wang C, Liu B, Zhang S, Huang N, Zhao T, Lu QB, et al. Differences in incidence and fatality of COVID-19 by SARS-CoV-2 Omicron variant versus Delta variant in relation to vaccine coverage: A world-wide review. J Med Virol. 2023 Jan;95(1):e28118. 10.1002/jmv.28118
35. Danza P, Koo TH, Haddix M, Fisher R, Traub E, OYong K, et al. SARS-CoV-2 Infection and Hospitalization Among Adults Aged ≥18 Years, by Vaccination Status, Before and During SARS-CoV-2 B.1.1.529 (Omicron) Variant Predominance - Los Angeles County, California, November 7, 2021-January 8, 2022. MMWR Morb Mortal Wkly Rep. 2022 Feb;71(5):177–81. 10.15585/mmwr.mm7105e1
36. Guay M, Maquiling A, Chen R, Lavergne V, Baysac DJ, Kokaua J, et al. Sociodemographic disparities in COVID-19 vaccine uptake and vaccination intent in Canada. Health Rep. 2022 Dec;33(12):37–54.
37. Fluck D, Rankin S, Lewis A, Robin J, Rees J, Finch J, et al. Comparison of characteristics and outcomes of patients admitted to hospital with COVID-19 during wave 1 and wave 2 of the current pandemic. Intern Emerg Med. 2022 Apr;17(3):675–84. 10.1007/s11739-021-02842-5
38. Alebna PL, Chung J, Rashid M, Hoban D, LaForgia M, Khera S, et al. Interventions and outcomes of COVID-19 patients in a community hospital-A single center study comparing the first and second waves. PLoS One. 2022 Dec;17(12):e0279208. 10.1371/journal.pone.0279208
39. Tandon P, Leibner ES, Hackett A, Maguire K, Mashriqi N, Kohli-Seth R. The Third Wave: Comparing Seasonal Trends in COVID-19 Patient Data at a Large Hospital System in New York City. Crit Care Explor. 2022 Mar;4(3):e0653. 10.1097/CCE.0000000000000653
40. Diebold M, Martinez AE, Adam KM, Bassetti S, Osthoff M, Kassi E, et al. Temporal trends of COVID-19 related in-hospital mortality and demographics in Switzerland - a retrospective single centre cohort study. Swiss Med Wkly. 2021 Jul;151(29–30):w20572. 10.4414/smw.2021.20572
41. Santos RS, Barros DS, Moraes TM, Hayashi CY, Ralio RB, Minenelli FF, et al. Clinical characteristics and outcomes of hospitalized patients with COVID-19 in a Brazilian hospital: a retrospective study of the first and second waves. IJID Reg. 2022 Jun;3:189–95. 10.1016/j.ijregi.2022.04.002
42. Caramello V, Catalano A, Macciotta A, Dansero L, Sacerdote C, Costa G, et al. Improvements throughout the Three Waves of COVID-19 Pandemic: Results from 4 Million Inhabitants of North-West Italy. J Clin Med. 2022 Jul;11(15):4304. 10.3390/jcm11154304
43. Wong EK, Watt J, Zou H, Chandraraj A, Zhang AW, Norman R, et al. Mortality in hospitalized older adults with COVID-19 during three waves: A multicenter retrospective cohort study. Heal. Sci Rep. 2022 May;5(3).
44. Bociąga-Jasik M, Wojciechowska W, Terlecki M, Wizner B, Rajzer M, Garlicki A, et al. Comparison between COVID‑19 outcomes in the first 3 waves of the pandemic: a reference hospital report. Pol Arch Intern Med. 2022 Oct;132(10):16286. 10.20452/pamw.16286
45. Iftimie S, López-Azcona AF, Lozano-Olmo MJ, Hernández-Aguilera A, Sarrà-Moretó S, Joven J, et al. Characteristics of hospitalized patients with SARS-CoV-2 infection during successive waves of the COVID-19 pandemic in a reference hospital in Spain. Sci Rep. 2022 Oct;12(1):17384. 10.1038/s41598-022-22145-9
46. Oladunjoye O, Gallagher M, Wasser T, Oladunjoye A, Paladugu S, Donato A. Mortality due to COVID-19 infection: A comparison of first and second waves. J Community Hosp Intern Med Perspect. 2021 Nov;11(6):747–52. 10.1080/20009666.2021.1978154
47. Gray WK, Navaratnam AV, Day J, Wendon J, Briggs TW. COVID-19 hospital activity and in-hospital mortality during the first and second waves of the pandemic in England: an observational study. Thorax. 2022 Nov;77(11):1113–20. 10.1136/thoraxjnl-2021-218025
48. Lee T, Cheng MP, Vinh DC, Lee TC, Tran KC, Winston BW, et al. Outcomes and characteristics of patients hospitalized for COVID-19 in British Columbia, Ontario and Quebec during the Omicron wave. C open. 2023 Jul 1;11(4):E672–83.
49. de Andrade CL, Pereira CC, Martins M, Lima SM, Portela MC. COVID-19 hospitalizations in Brazil’s Unified Health System (SUS). PLoS One. 2020 Dec;15(12):e0243126. 10.1371/journal.pone.0243126
50. Yehia BR, Winegar A, Fogel R, Fakih M, Ottenbacher A, Jesser C, et al. Association of Race With Mortality Among Patients Hospitalized With Coronavirus Disease 2019 (COVID-19) at 92 US Hospitals. JAMA Netw Open. 2020 Aug;3(8):e2018039. 10.1001/jamanetworkopen.2020.18039
51. Vuichard-Gysin D, Abbas M, Harbarth S. In-hospital COVID-19 outbreak investigation: A practical approach to root cause analysis. Intensive Crit Care Nurs. 2021 Dec;67:103132. 10.1016/j.iccn.2021.103132
52. Coca SG, Yusuf B, Shlipak MG, Garg AX, Parikh CR. Long-term risk of mortality and other adverse outcomes after acute kidney injury: a systematic review and meta-analysis. Am J Kidney Dis. 2009 Jun;53(6):961–73. 10.1053/j.ajkd.2008.11.034
53. Blair A, Warsame K, Naik H, Byrne W, Parnia A, Siddiqi A. Identifying gaps in COVID-19 health equity data reporting in Canada using a scorecard approach. Can J Public Health. 2021 Jun;112(3):352–62. 10.17269/s41997-021-00496-6
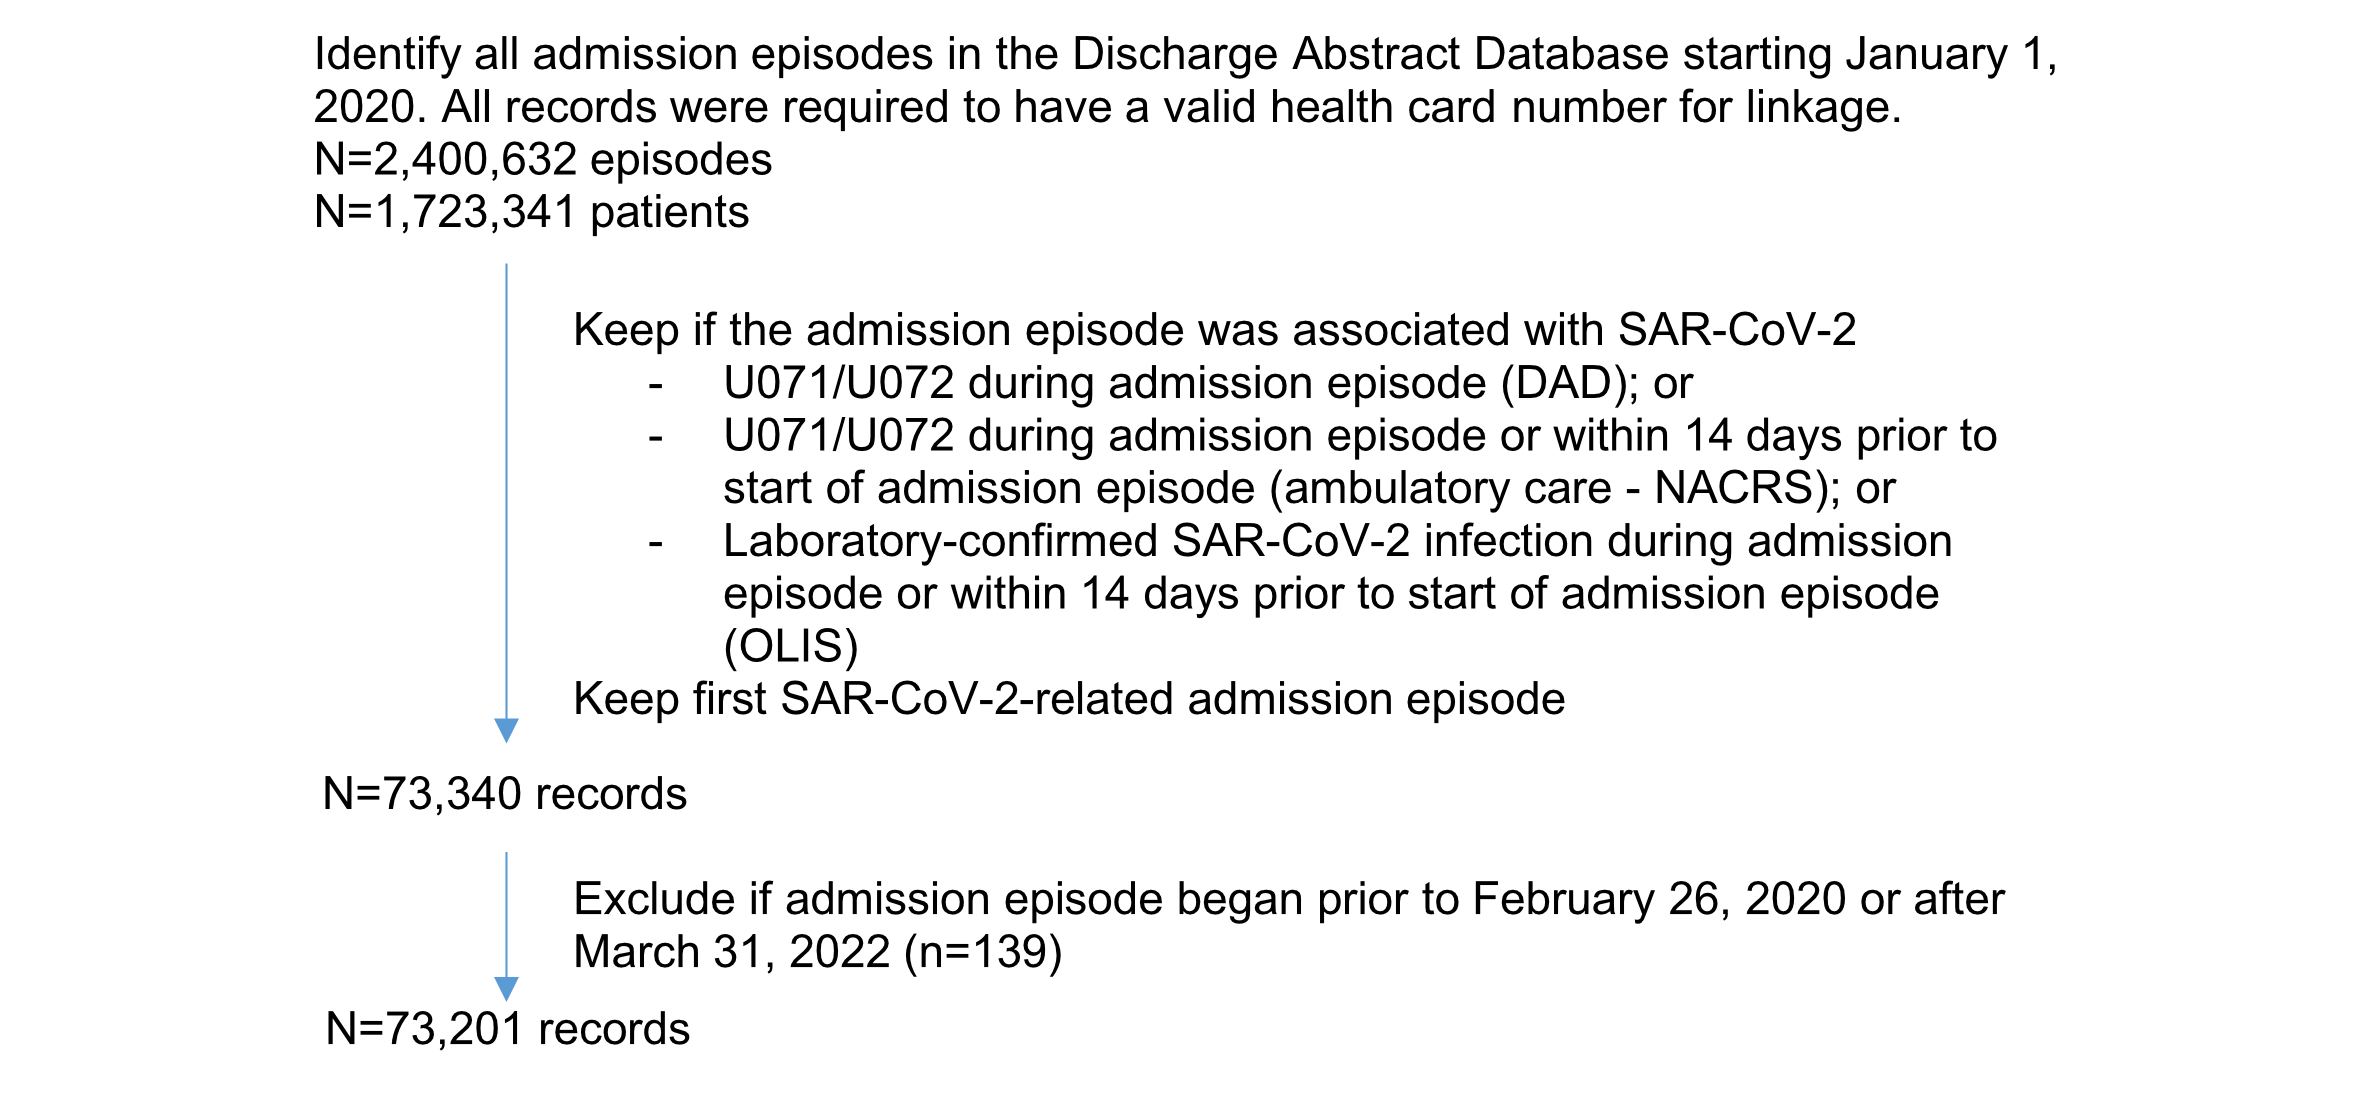
Figure S1Cohort creation.
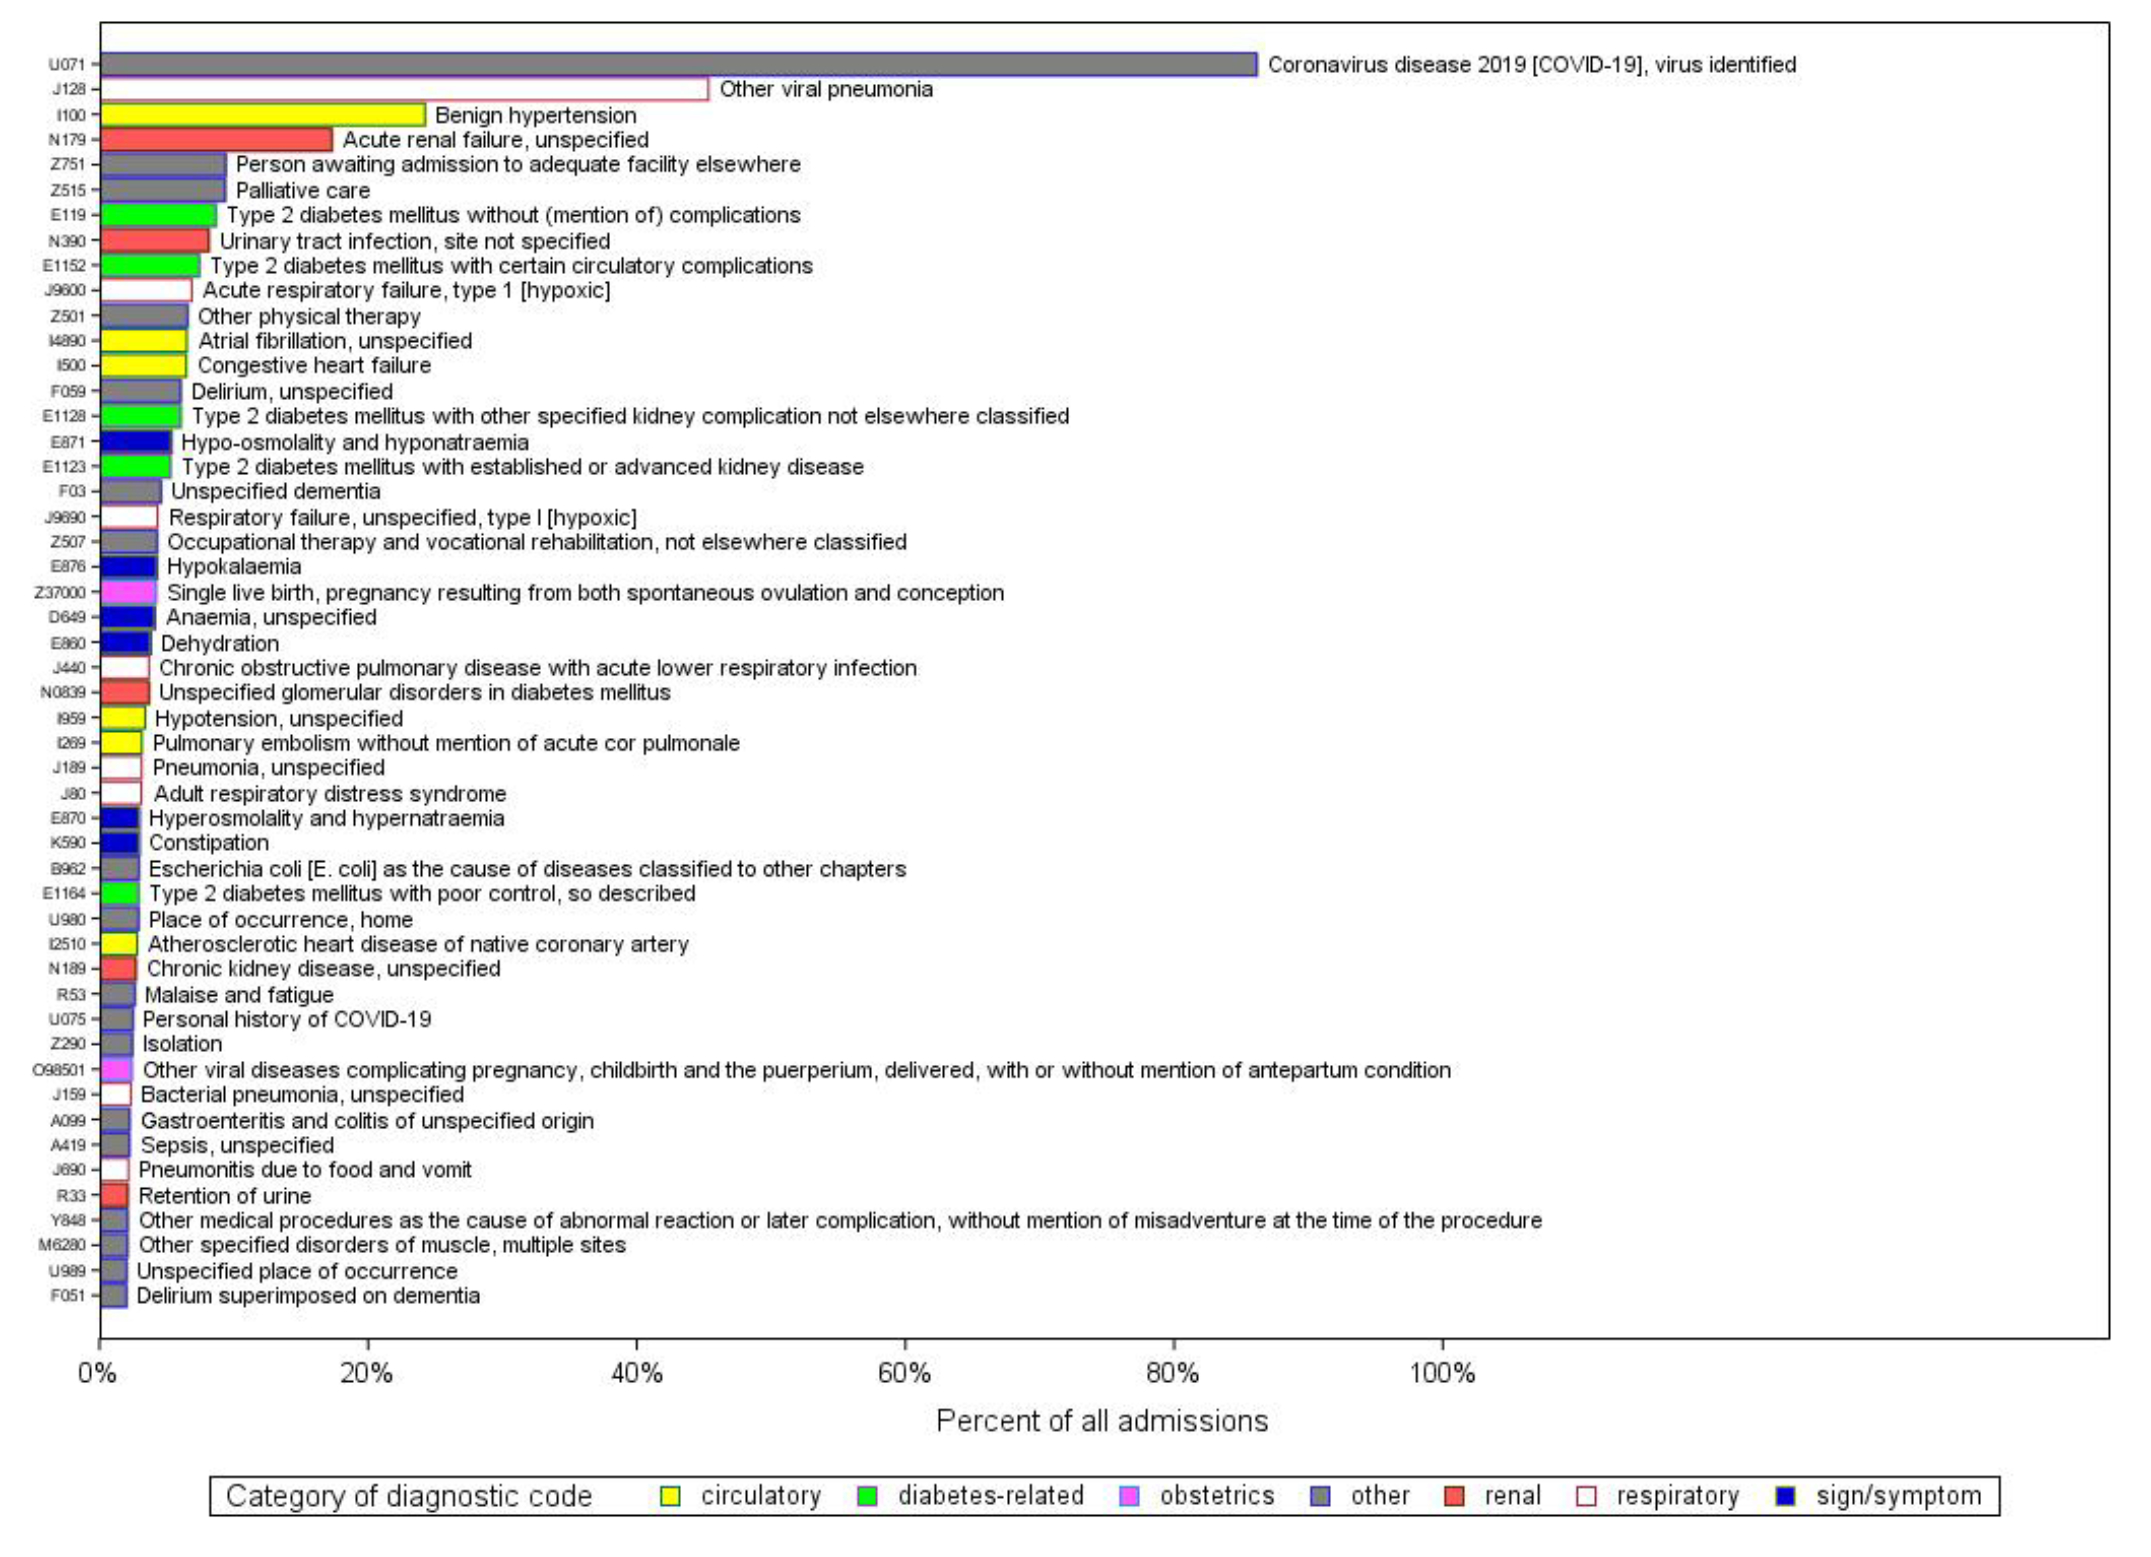
Figure S2Diagnostic codes. Any diagnosis type.
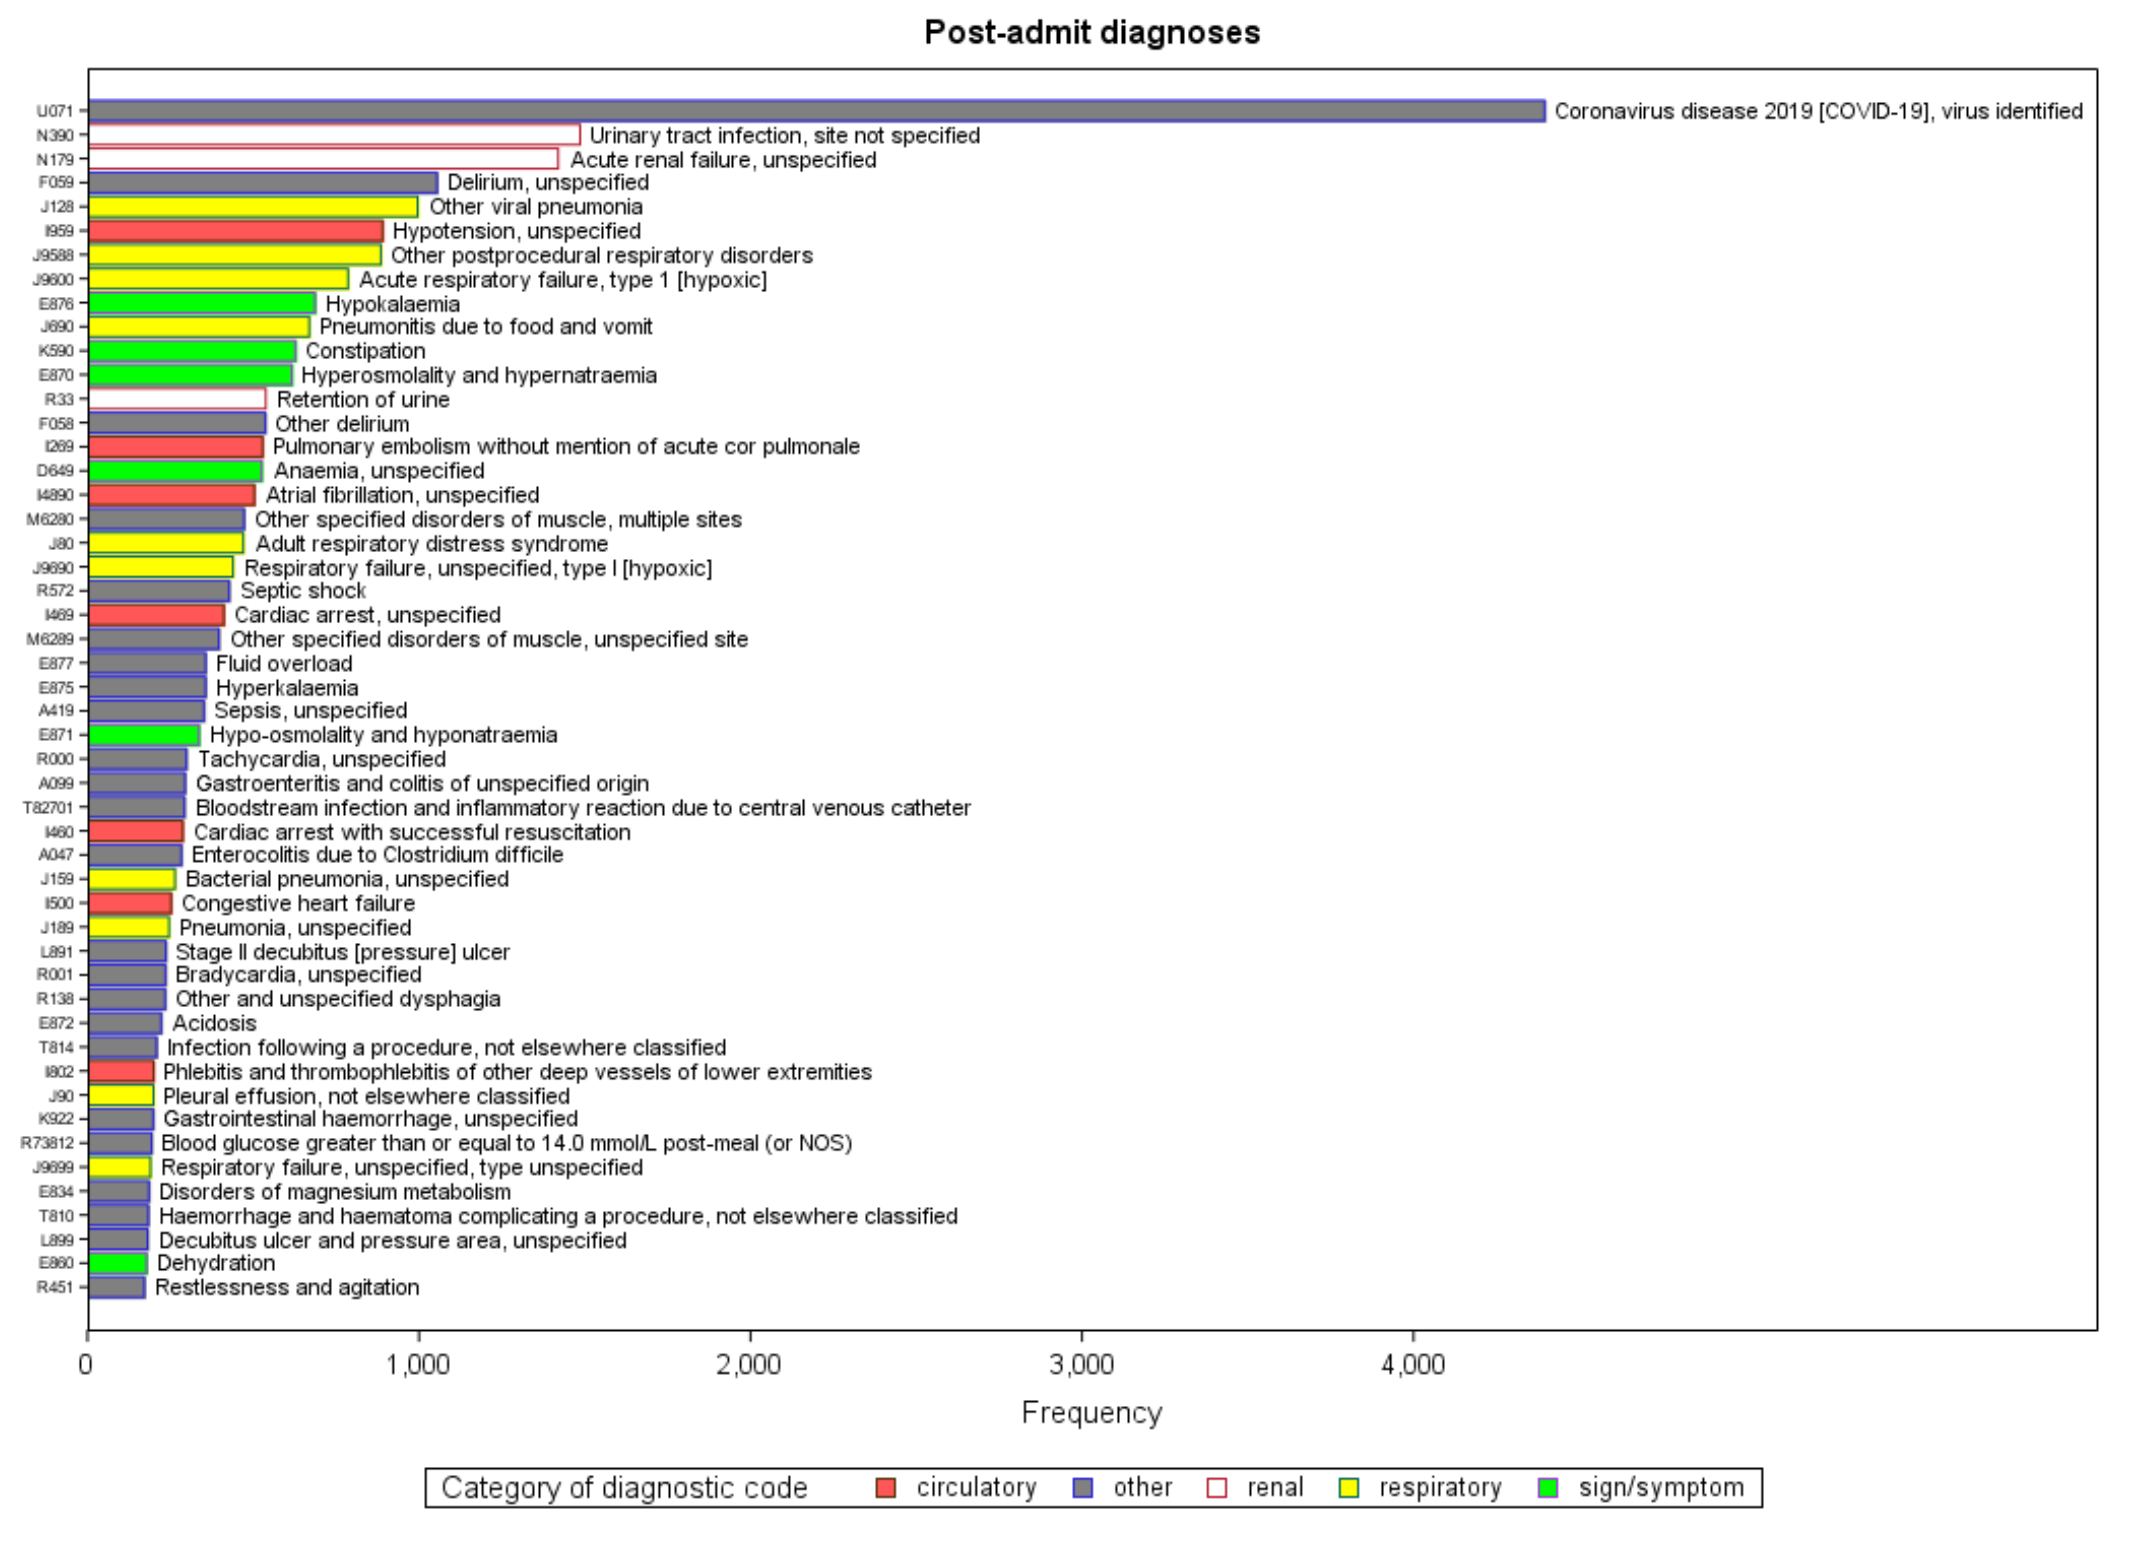
Figure S3Diagnostic codes. Post-admission complication only.
Technical appendix: Ascertainment of SARS-CoV-2-related admission episode
Among all admission episodes (n = 2,048,525), 63,601 (3.1%) had U071/2 coded in DAD, 50,052 (2.4%) had at least one positive SARS-CoV-2 test from Ontario Laboratories Information System and 27,853 (1.3%) had a U071/2 diagnostic code in NACRS any time during the admission episode (table S1). The DAD or NACRS record containing the first U071/2 diagnostic code occurred on the date the admission episode started for at least 95% of admissions. In contrast, the date of the SARS-CoV-2-positive test in Ontario Laboratories Information System occurred a median 1 day after the admission start (90th percentile: 12 days).
A total of 16,607 patients had evidence of SARS-CoV-2 in NACRS within 1 week prior to the admission and 17,976 within 2 weeks (total 40,464 during the admission or within 2 weeks prior). Using Ontario Laboratories Information System, substantially more patients were flagged as having had a positive SARS-CoV-2 test when the look-back window was extended from 1 week (n = 15,168) to 2 weeks (n = 21,010) (total 64,658 during the admission or within 2 weeks prior).
Among the 63,601 SARS-CoV-2-related admissions according to DAD, 44,931 (71%) had a corresponding Ontario Laboratories Information System record during the admission and 57,151 (90%) had an OLIS record during the admission or within 2 weeks prior (figure A1). Similarly, 26,867 (42%) and 38,130 (60%) had corresponding evidence in NACRS during the admission and/or within 2 weeks prior to the admission episode, respectively. Among the 40,464 admissions with evidence of SARS-CoV-2 in NACRS (during or within 2 weeks prior), OLIS corroborated 36,550 (90%) of these (during or within 2 weeks prior). Among the 6450 (10%) of DAD admissions without a corresponding OLIS record, 2672 (41%) had corresponding evidence in NACRS within 2 weeks before or during the admission. Using overall survival as an indicator for the definition of a SARS-CoV-2-related admission, when captured in DAD, overall survival curves were similar regardless of corroboration from OLIS (figure A2a). Among admissions not captured by DAD, survival curves were qualitatively similar if identified from NACRS, regardless of corroboration from OLIS (figure A2b). Additionally, whether defined by NACRS or OLIS, overall survival was worse than if absent from all sources.
We therefore considered an admission episode to be related to SARS-CoV-2 if any source indicated SARS-CoV-2 positivity during (DAD, NACRS, OLIS) or within 2 weeks prior (NACRS, OLIS) to the admission episode. Since our index date is the first admission related to SARS-CoV-2, we did not apply a hierarchy to these sources of evidence.
Table S1Agreement between DAD, NACRS and OLIS. n = 2,059,517 admission episodes; Restricted to admission episodes starting between 1 April 2020 (when ICD-10 codes became available for use) and 31 March 2022 (most recent data available).
| Time since episode start | |||||
| During episode* | n (%) | Median (IQR) | 90percentile | 95 percentile | 99 percentile |
| DAD | 63,099 (3.1%) | 0 (0–0) | 0 | 0 | 9 |
| NACRS | 26,868 (1.3%) | 0 (0–0) | 0 | 0 | 0 |
| OLIS | 49,490 (2.4%) | 1 (0–2) | 12 | 25 | 77 |
| Time until episode start | |||||
| Before episode** | n (%) | Median (IQR) | 90 percentile | ||
| NACRS (≤7 d) | 16,607 | 1 (1–2) | 4 | ||
| NACRS (≤14 d) | 17,976 | 1 (1–3) | 6 | ||
| NACRS (any time) | 33,700 | 8 (1–141) | 320 | ||
| OLIS (≤7 d) | 15,168 | 4 (2–6) | 7 | ||
| OLIS (≤14 d) | 21,010 | 5 (3–8) | 11 | ||
| OLIS (any time) | 71,422 | 67 (10–221) | 353 | ||
DAD: Discharge Abstract Database; IQR: interquartile range (25th–75th percentile); NACRS: National Ambulatory Care Reporting System; OLIS: Ontario Laboratories Information System.
* Anytime (inclusive) between the episode start and end dates.
** Anytime between the episode start date (exclusive) and 7 days (or 14 days) prior (inclusive).
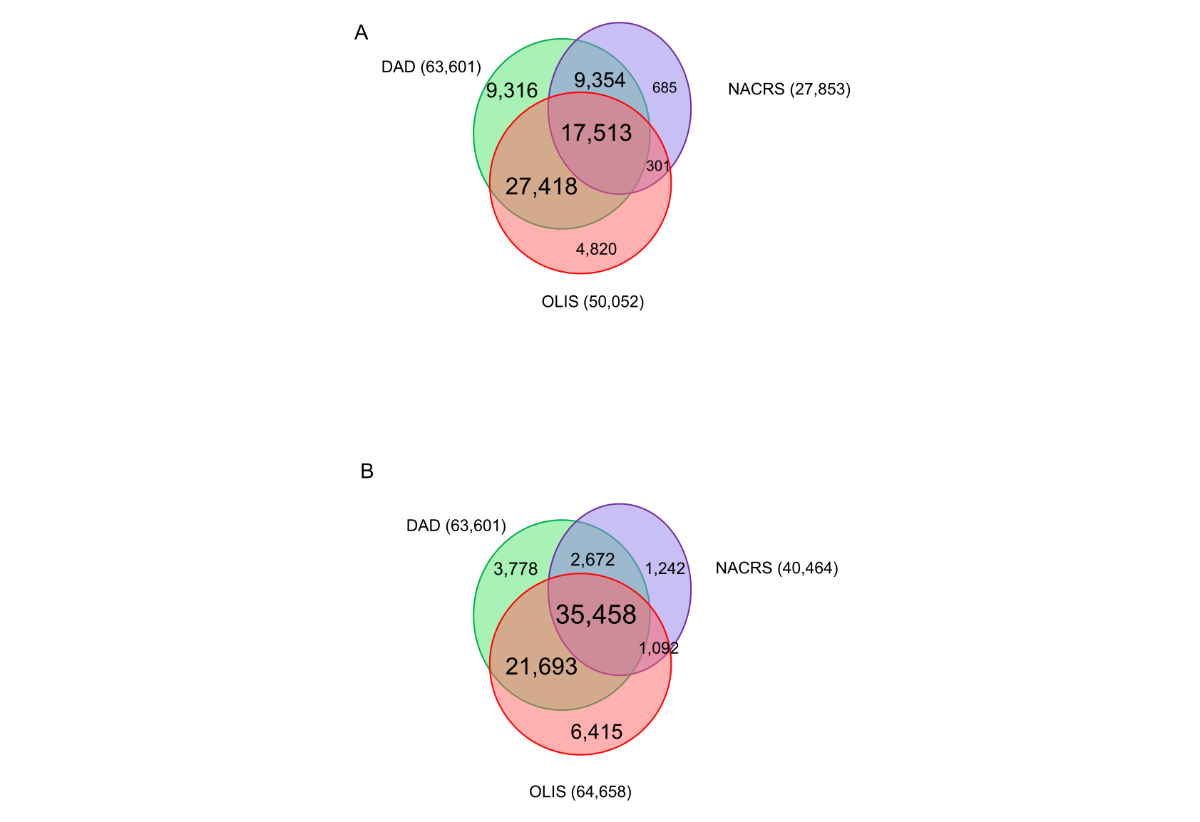
Figure S4Overlap between sources of evidence for SARS-CoV-2-related hospitalisations.(A) Evidence of SARS-CoV-2 in NACRS and Ontario Laboratories Information System (OLIS) during the admission episode. (B) Evidence of SARS-CoV-2 in NACRS and OLIS during or 2 weeks before the admission episode.
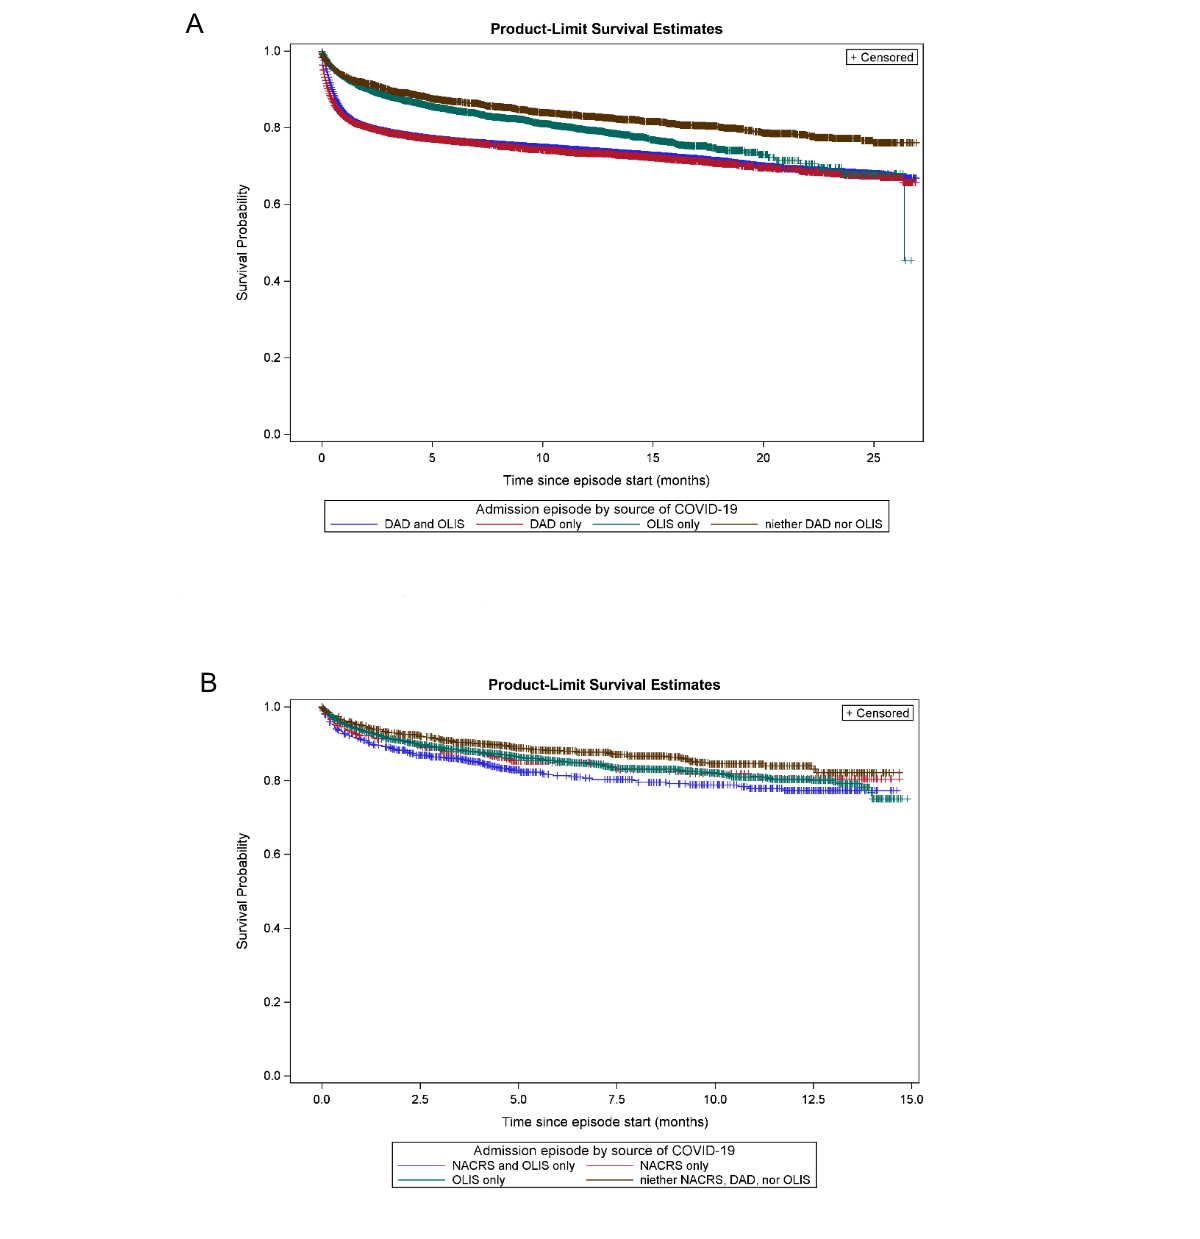
Figure S5Overall survival as an outcome indicator for defining a SARS-CoV-2-related admission. (A) Admission episodes flagged as SARS-CoV-2-related by source. (B) Admission episodes flagged as SARS-CoV-2-related by source, if missing in DAD.