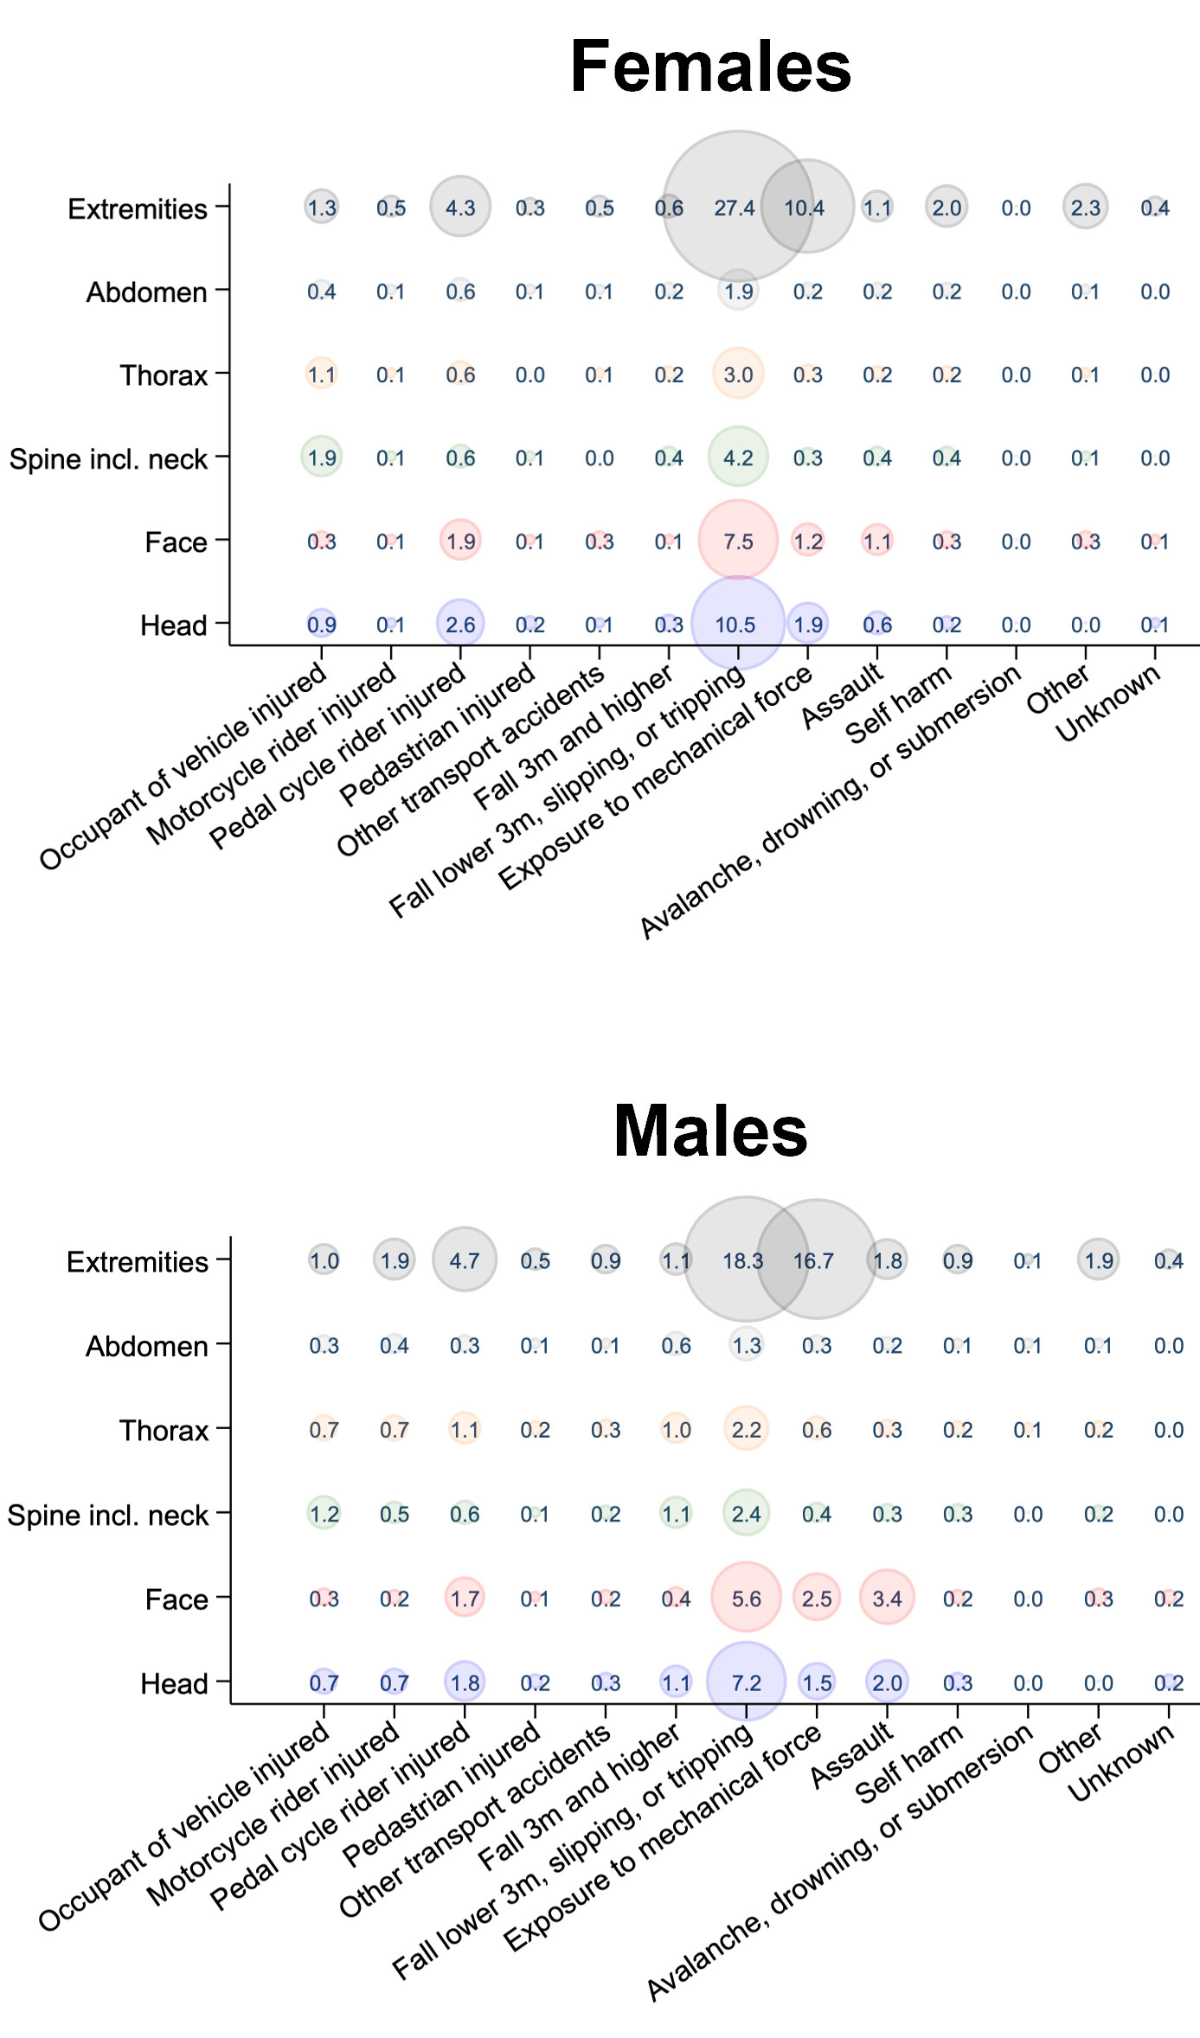
Figure 1Mechanism of injury by body region and sex. Each bubble shows the frequency of injuries for a given body region and trauma mechanism, as indicated by the number (in %) and bubble size.
DOI: https://doi.org/10.57187/s.3539
During the COVID-19 pandemic, unprecedented restrictions on population mobility were implemented worldwide [1], and these resulted in important changes in the behaviour of the general population. Numerous publications in different countries have found heterogeneous changes in the number and composition of patients presenting to emergency departments (EDs) [2–6]. A reduction in the incidence of road traffic accidents has been reported, with inconsistent results for pedal cycle accidents [7–9]. There have been alarming reports of increases in domestic [8, 10, 11] and interpersonal violence [12–14]. Some studies have shown an increase in geriatric trauma and associated morbidity [15, 16].
For the Swiss population, a previous study conducted in our ED focusing on major trauma showed a reduction in the number of severely injured patients, although the severity of trauma increased [17]. However, to the best of our knowledge, there have been no studies in the general Swiss trauma population that have included minor trauma patients. The Swiss population has several specific characteristics, such as a high life expectancy and a high proportion of trauma related to snow sports [18, 19]. In Switzerland, the restrictions included bans on large gatherings and the closure of non-essential businesses and services, including schools. Restrictions peaked from 21 March to 27 April 2020 and were then gradually eased [20].
Better understanding of the impact of the pandemic may enable clinicians and healthcare institutions to improve resource allocation and emergency management in the hospital, as well as to guide prevention programmes targeted at vulnerable populations (e.g. preventing falls in the elderly, psychological support, prevention of road traffic accidents).
The objective of this study was to assess changes in trauma-related ED presentations during the first wave of the COVID-19 pandemic, as compared to the same period in the previous year, with a particular focus on vulnerable patient populations.
A descriptive, retrospective, single-centre analysis was conducted in our ED, one of the largest in Switzerland, treating about 55,000 patients per year. On admission to our ED, a diagnosis group is recorded for each patient according to the chief complaint e.g. “trauma”, “gastrointestinal” or “respiratory”. All patients presenting to our ED between 1 January and 30 June in 2019 and in 2020 with “trauma” as their chief complaint were included in the analysis. Patients under 16 years of age and those with missing data were excluded from the analysis.
All patient information was documented in the clinical information system (E.care ED, Mesalvo Turnhout BV, Turnhout, Belgium). Data were fully anonymised prior to analysis. Data were coded by two independent, trained physicians who manually reviewed the medical records and extracted the following data: age, sex, injured body region, injury severity and trauma mechanism (i.e. the cause). The severity was assessed according to the international Injury Severity Score (ISS) and the Abbreviated Injury Scale (AIS) [21, 22]. The trauma mechanism was extracted from the medical history or the documented diagnosis on discharge, as recorded in the clinical information system. Causal relationships with sports or snow sports were additionally assessed as binary variables. Any discrepancies in the classification of the trauma mechanism or the severity of the trauma were discussed by the reviewers and agreement was reached. Missing trauma mechanisms were classified as “unknown”.
The chi-squared test was used to compare the observed frequencies of parameters e.g. trauma mechanism between the different time periods. Non-normally distributed data were assessed using the Wilcoxon rank-sum test; medians and interquartile ranges (IQRs) were determined. The statistical analysis was performed using STATA® 16.1 (StataCorp, The College Station, Texas, USA). Supplementary information on the statistical analysis can be found in the appendix.
To compare the data before and during the pandemic, we analysed the total number of patients admitted in the first half of 2019 (2019 H1) compared to the first half of 2020 (2020 H1). As the most severe restrictions were in force in March and April 2020, each six-month period was divided into three two-month periods, so the second period in 2020 had the most severe restrictions. As trauma related to sports (especially snow sports) was very frequent in our centre, we performed a subgroup analysis of this population.
The study was classified as a quality evaluation study by the ethics committee of the canton of Bern, Switzerland, and informed consent was waived (KEK-2023-00145).
During the study period, we registered 46,029 consultations in our emergency department (2019: 24,522; 2020: 21,507). Overall, 6316 patients were treated with “trauma” as the chief complaint. We excluded 234 cases due to incomplete documentation and 243 patients whose trauma was not recent. A total of 5839 trauma-related consultations were included in the analysis, representing 12.7% of all ED admissions. In 2019 H1, 3163 consultations were included (12.9% of all ED admissions) and in 2020 H1, 2676 consultations (12.4% of all ED admissions). 39.9% of the patients were female and the median age was 40 (IQR: 27–60) years. The demographic characteristics of the study population did not differ significantly between 2019 and 2020 (table 1).
Table 1Demographic characteristics of the study population.
| Total population (n = 5839) | Subgroups | p value | ||||||
| 2019 H1 | n = 3163 | 2020 H1 | n = 2676 | |||||
| Patient characteristics | ||||||||
| Sex | Female | 2332 (39.9%) | 1248 (39.5%) | 1084 (40.5%) | ||||
| Male | 3507 (60.1%) | 1915 (60.5%) | 1592 (59.5%) | 0.413 | ||||
| Age in years, median (IQR) | 40 (27–60) | 40 (26–59) | 41 (27–60) | 0.129 | ||||
| Age groups | 18–24 | 1219 (20.9%) | 685 (21.7%) | 534 (20.0%) | 0.111 | |||
| 25–44 | 2021 (34.6%) | 1078 (34.1%) | 943 (35.2%) | 0.354 | ||||
| 45–64 | 1431 (24.5%) | 770 (24.3%) | 661 (24.7%) | 0.752 | ||||
| 65–84 | 868 (14.9%) | 473 (15.0%) | 395 (14.8%) | 0.836 | ||||
| >84 | 300 (5.1%) | 157 (5.0%) | 143 (5.3%) | 0.512 | ||||
| Consultation characteristics | ||||||||
| Type of admission | Ambulance | 1737 (29.7%) | 889 (28.1%) | 848 (31.7%) | 0.003* | |||
| General Practitioner | 197 (3.4%) | 106 (3.4%) | 91 (3.4%) | 0.917 | ||||
| External hospital | 352 (6.0%) | 201 (6.4%) | 151 (5.6%) | 0.255 | ||||
| Police | 28 (0.5%) | 13 (0.4%) | 15 (0.6%) | 0.410 | ||||
| Repatriation | 10 (0.2%) | 6 (0.2%) | 4 (0.1%) | 0.711 | ||||
| Walk-in | 2254 (38.6%) | 1193 (37.7%) | 1061 (39.6%) | 0.131 | ||||
| Internal referral | 88 (1.5%) | 47 (1.5%) | 41 (1.5%) | 0.885 | ||||
| Urgent care centre/doctor | 72 (1.2%) | 41 (1.3%) | 31 (1.2%) | 0.635 | ||||
| Not specified | 1101 (18.9%) | 667 (21.1%) | 434 (16.2%) | <0.001* | ||||
| Triage | Life-threatening | 392 (6.7%) | 205 (6.5%) | 187 (7.0%) | 0.441 | |||
| Highly urgent | 1445 (24.7%) | 773 (24.4%) | 672 (25.1%) | 0.553 | ||||
| Urgent | 3716 (63.6%) | 2018 (63.8%) | 1698 (63.5%) | 0.783 | ||||
| Semi-urgent | 285 (4.9%) | 166 (5.2%) | 119 (4.4%) | 0.157 | ||||
| Not specified | 1 (0.0%) | 1 (0.0%) | 0 (0.0%) | 0.358 | ||||
IQR: interquartile range.
* p <0.05
In both study periods, the most common site of injury was the upper extremities, with 38.8% of cases (35.4% in females, 41.1% in males), followed by the lower extremities (28.5%; 31.9% in females and 26.3% in males) and the head (25.2%; 23.3% in females and 21.5% in males) (figure 1). In 71.2% of the cases, patients were discharged home, while 24.1% were admitted for inpatient treatment. Trauma-related death occurred in 0.1% of the cases (table 2).
Table 2Injury characteristics and trauma mechanism.
| Total population (n = 5839) | Subgroups | p value | ||||||
| 2019 H1 | n = 3163 | 2020 H1 | n = 2676 | |||||
| Injury characteristics | ||||||||
| Trauma mechanisms | Injury of occupant of vehicle | 218 (3.7%) | 120 (3.8%) | 98 (3.7%) | 0.791 | |||
| Injury of motorcycle rider | 112 (1.9%) | 50 (1.6%) | 62 (2.3%) | 0.041 | ||||
| Injury of pedal cycle rider | 472 (8.1%) | 207 (6.5%) | 265 (9.9%) | <0.001* | ||||
| Injury of pedestrian | 41 (0.7%) | 26 (0.8%) | 15 (0.6%) | 0.233 | ||||
| Other transport accidents | 71 (1.2%) | 35 (1.1%) | 36 (1.3%) | 0.407 | ||||
| Fall of at least 3 m | 113 (1.9%) | 66 (2.1%) | 47 (1.8%) | 0.361 | ||||
| Fall of less than 3 m, slip or trip | 2683 (45.9%) | 1500 (47.4%) | 1183 (44.2%) | 0.014* | ||||
| Exposure to mechanical force | 1390 (23.8%) | 734 (23.2%) | 656 (24.5%) | 0.242 | ||||
| Assault | 333 (5.7%) | 179 (5.7%) | 154 (5.8%) | 0.875 | ||||
| Self-harm | 151 (2.6%) | 78 (2.5%) | 73 (2.7%) | 0.530 | ||||
| Exposure to heat/fire/electricity/pressure | 78 (1.3%) | 43 (1.4%) | 35 (1.3%) | 0.864 | ||||
| Avalanche, drowning or submersion | 10 (0.2%) | 7 (0.2%) | 3 (0.1%) | 0.315 | ||||
| Other | 120 (2.1%) | 96 (3.0%) | 24 (0.9%) | <0.001* | ||||
| Unknown | 47 (0.8%) | 22 (0.7%) | 25 (0.9%) | <0.309 | ||||
| Sports-related injuries | Total | 755 (12.9%) | 444 (14.0%) | 311 (11.6%) | 0.006* | |||
| Snow sports-related injuries | 274 (4.7%) | 162 (5.1%) | 112 (4.2%) | 0.092 | ||||
| Severe trauma | 271 (4.6%) | 161 (5.1%) | 110 (4.1%) | 0.076 | ||||
| Injured body regions | ||||||||
| Head | 1299 (22.2%) | 675 (21.3%) | 624 (23.3%) | 0.070 | ||||
| Face | 1121 (19.2%) | 597 (18.9%) | 524 (19.6%) | 0.494 | ||||
| Neck | 277 (4.7%) | 155 (4.9%) | 122 (4.6%) | 0.541 | ||||
| Thorax | 536 (9.2%) | 279 (8.8%) | 257 (9.6%) | 0.302 | ||||
| Abdomen | 295 (5.1%) | 167 (5.3%) | 128 (4.8%) | 0.388 | ||||
| Spine | 327 (5.6%) | 184 (5.8%) | 143 (5.3%) | 0.433 | ||||
| Upper extremities | 2268 (38.8%) | 1197 (37.8%) | 1071 (40.0%) | 0.089 | ||||
| Lower extremities | 1667 (28.5%) | 895 (28.3%) | 772 (28.8%) | 0.641 | ||||
| Other injury | 2 (0.0%) | 1 (0.0%) | 1 (0.0%) | 0.906 | ||||
| Procedural outcomes | ||||||||
| Discharge | Death | 6 (0.1%) | 2 (0.1%) | 4 (0.1%) | 0.305 | |||
| Discharge to home | 4159 (71.2%) | 2259 (71.4%) | 1900 (71.0%) | 0.725 | ||||
| Hospital admission | 1406 (24.1%) | 753 (23.8%) | 653 (24.4%) | 0.596 | ||||
| Transfer to external hospital | 212 (3.6%) | 113 (3.6%) | 99 (3.7%) | 0.796 | ||||
| Not specified | 56 (1.0%) | 36 (1.1%) | 20 (0.7%) | 0.127 | ||||
| LoS ED in hours, median (IQR) | 3.6 (2.3–5.3) | 3.7 (2.4–5.4) | 3.5 (2.3–5.1) | 0.001* | ||||
IQR: interquartile range; LoS ED: length of stay in the emergency department.
* p <0.05
Figure 1Mechanism of injury by body region and sex. Each bubble shows the frequency of injuries for a given body region and trauma mechanism, as indicated by the number (in %) and bubble size.
In 2020 H1, 2676 patients were treated in our ED, corresponding to a 15.5% decrease compared to 2019 H1. This decrease was particularly marked in the 2-month March/April period, with a decrease of 36.8% (1033 to 653 from March/April 2019 to March/April 2020) (figure 2).
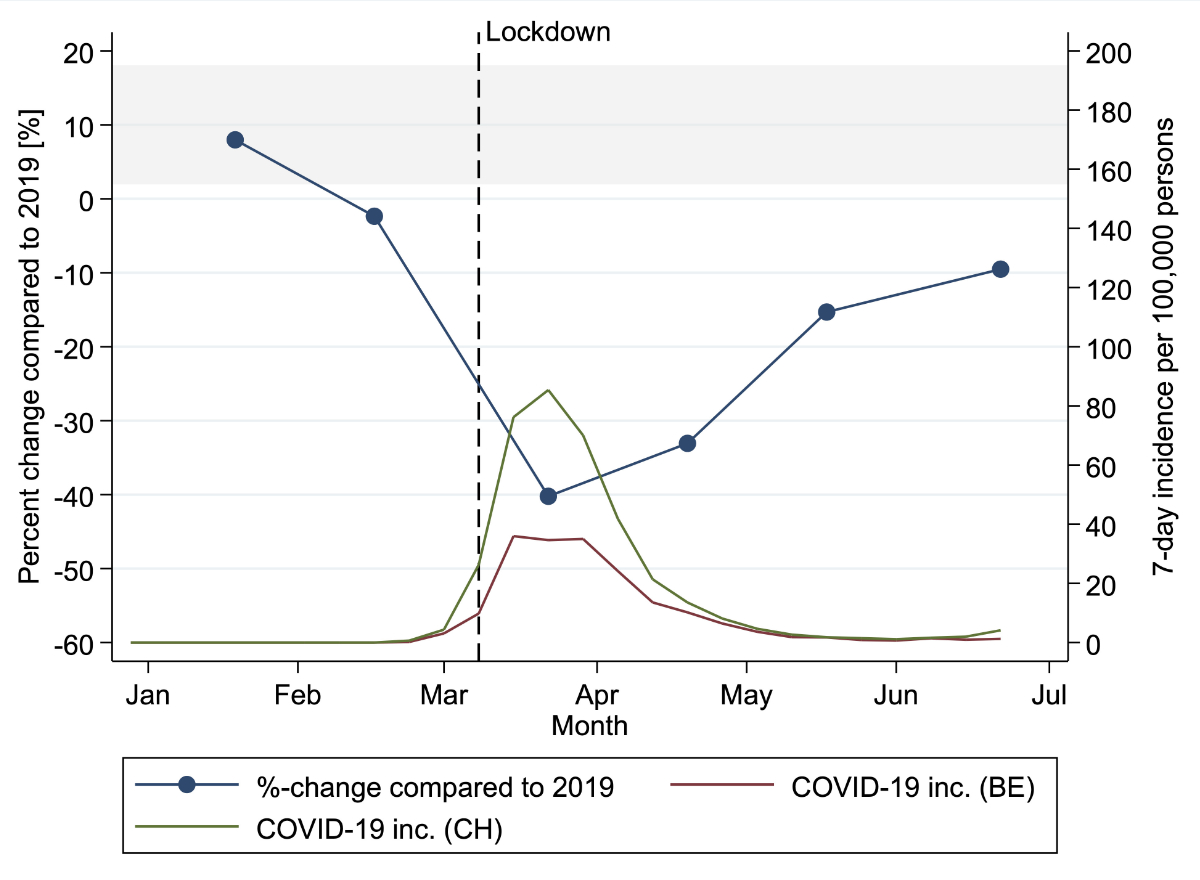
Figure 2Incidence of COVID-19 in Switzerland (CH, green) and the canton of Bern (BE, red) in 2020 and change in trauma cases.
For geriatric trauma patients, we found an absolute reduction of 92 patients aged over 65 years in 2020 H1 compared to 2019 H1, while the relative numbers remained stable at 20.1% and 20.0% of the general trauma population, respectively (p = 0.859). Similar results were seen for March/April 2020 vs March/April 2019, with stable relative numbers of 20.3% and 20.1%, respectively (p = 0.902) (tables 2, figure 3 and tables S1 and S2 in the appendix).
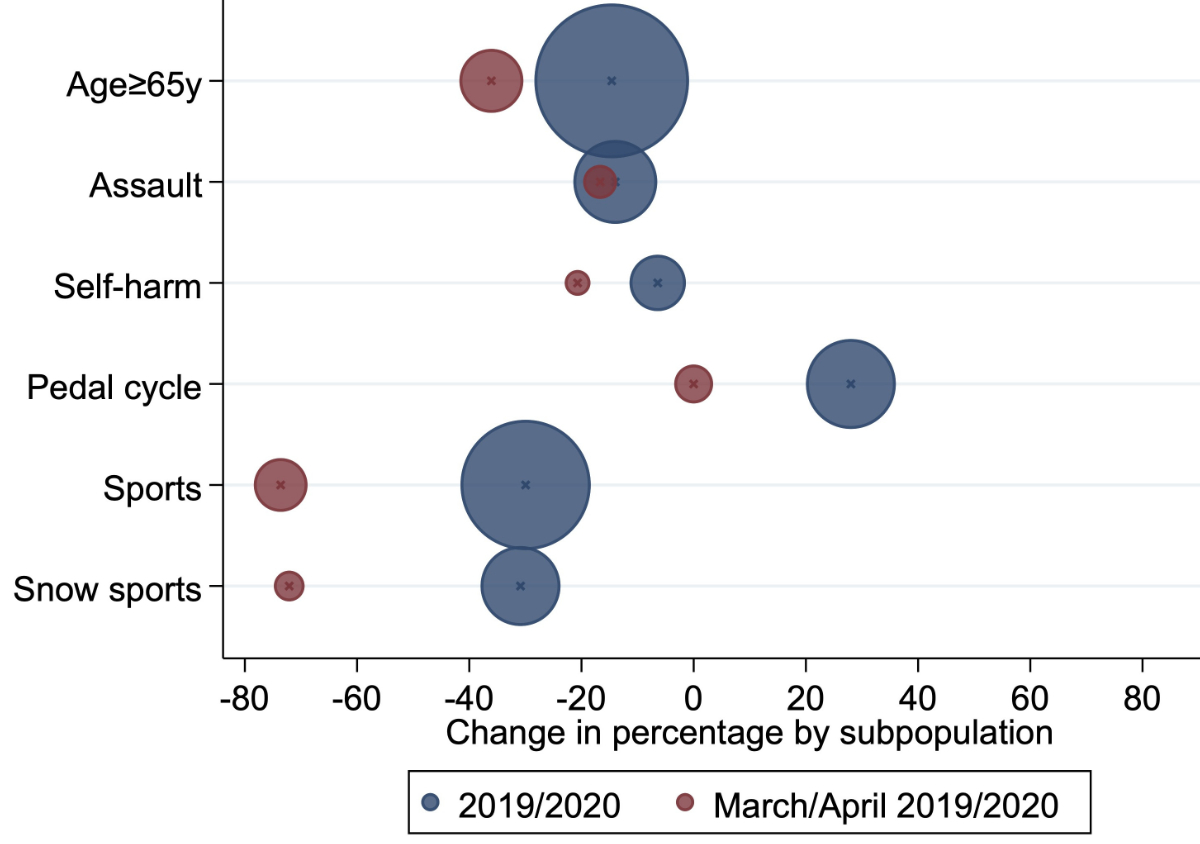
Figure 3Percent changes in absolute ED presentations by trauma subpopulation. The diameter of a bubble corresponds to the total number of consultations in the subgroup in 2019.
As regards the mechanism of injury, there was a significant reduction in the number of falls of less than 3 metres (p = 0.014) and a smaller, non-significant decrease in the number of injuries due to mechanical force (p = 0.242) (table 2). In pedal cycle-related accidents, we found a significant increase of 58 cases (p <0.001), representing 9.9% of the trauma population in 2020 H1 compared to 6.5% in 2019 H1. The absolute numbers of presentations associated with assault and self-harm remained similar over all periods observed, with relative numbers showing a non-significant increase at the peak of the restrictions (figure S1 in the appendix). In March/April, injuries related to self-harm evolved from 2.8% (29/1033) in 2019 H1 to 3.5% (23/653) in 2020 H1. Similarly, assault-related injuries evolved from 5.2% (54/1033) to 6.9% (45/653) of trauma-related ED presentations during the period of the strictest restrictions, but these changes were not significantly different (p = 0.674 and p = 0.551, respectively) (table 2, figure 3, tables S1 and S2).
There was a significant decrease in the proportion of sports trauma – from 14.0% (444/3163) in 2019 H1 to 11.6% (311/2676) in 2020 H1 (p = 0.006) and a trend towards fewer snow sports-related injuries (p = 0.092). This finding was even more pronounced in March/April, with a significant reduction (p <0.001) in sports-related injuries from 13.9% (144/1033) to 5.8% (38/653) and a significant decrease (p <0.001) in snow sports-related injuries, from 4.2% (43/1033) to 1.8% (12/653) (table 2, figure 3, tables S1 and S2).
In this study, we investigated the epidemiology and injury patterns of trauma patients presenting to our level 1 trauma centre before and during the first wave of the COVID-19 pandemic.
In 2019 H1, 3163 consultations were recorded, as compared to 2676 consultations in 2020 H1. The most common mechanisms of injury were “falls less than 3 metres, slipping or tripping” and “exposure to mechanical force”, with “injured pedal cycle rider” in third place. The most frequent injured regions were the upper and lower extremities. These findings are consistent with previous publications [23, 24].
A marked difference in trauma patterns was found between male and female patients. Female patients were more likely to sustain an injury to the extremities associated with “falls less than 3 metres, slipping or tripping”. Low-energy trauma is a frequent cause of osteoporotic fractures, common in women over 50, potentially explaining our findings [25].
As regards the impact of the COVID-19 pandemic on trauma-related ED visits in our study population, we found a 15% reduction in trauma-related ED presentations from 2019 H1 to 2020 H1. This relative reduction peaked at 37% during the most rigorous stay-at-home orders in the months of March and April 2020. There have been a variety of different reports on how pandemic restrictions influenced the number of trauma-related ED presentations. These changes in trauma admissions ranged from a slight increase [26] to a decrease of up to 79.9% [6]. Our findings are in accordance with most publications, which reported a reduction of around 30% [2, 5, 8, 13, 27, 28].
The findings in the general trauma population on the reduction in trauma-related ED visits are similar to those described in the major trauma population at our centre [17].
As regards geriatric trauma patients, we found a reduction in absolute numbers but stable relative numbers for 2020 H1 compared to 2019 H1. Some studies have shown a drop in geriatric trauma, with a decrease in proximal hip fractures and distal radius fractures [23], while a Japanese study showed conflicting results, with an increase in hip fractures [15]. Adiamah et al. showed an increase in trauma in frail patients [5]. In our study, however, older patients were not identified as a particularly vulnerable group for traumatic injuries during the COVID-19 pandemic.
American studies in particular have reported an increase in injuries related to interpersonal violence [26, 29], whereas European studies are less unanimous on this subject [5, 30]. In our study, trauma related to assault and self-harm remained stable throughout the study period, which suggests that this population remained susceptible to injuries even during the most stringent stay-at-home orders.
For accidents related to pedal cycles, we found a significant increase of 28% in 2020 compared to 2019. This result is consistent with a previous study from Berlin, Germany [8], and may be linked to the restrictions on public transport. This effect was more important in this study than the general reduction in road traffic accidents described in other studies [27]. Our previous study in our ED was limited to the major trauma population and found no difference in pedal cycle accidents [17], so that the current results must have been driven by an increase in minor trauma.These results support the importance of preventive measures for users of pedal cycles, especially during the COVID-19 pandemic.
Lastly, we found a marked drop in sports-related accidents, especially in snow sports. Many authors have described a reduction in sports-related injuries, particularly in collective sports [30, 31]. Only a few have described the impact of the stay-at-home order on accidents related to snow sports [32]. This is a particular characteristic of our trauma centre, where a high proportion of accidents are related to snow sports (around 10% of all trauma patients in the high season), which is significantly higher than in other centres [5, 8]. Noticeably, there were relatively few restrictions on outdoor activities (e.g. skiing) in Switzerland [20, 33]. Nevertheless, the marked decrease in injuries related to sports and snow sports suggests that the restrictions were sufficient to greatly reduce the practice of snow sports, the associated risk of injury, and thereby to preserve ED resources for COVID-19 patients.
Our study provides new information on trauma patterns during the first wave of the pandemic, which have not been previously described for a Swiss population. To the best of our knowledge, only a few studies have been published on this topic that included Swiss trauma centres, and all of these focused on major trauma [17, 34, 35].
However, the present study has several limitations. First and foremost, the short observation period and the single-centre design limit the external validity. Second, the observational study design allows confounding factors to alter our findings – such as a possible information bias due to the use of routine data. The analysis of trauma subpopulations may have increased the risk of type 1 error due to a multiplicity issue. Regarding our classification of trauma mechanisms, the “exposure to mechanical force” group could have been further differentiated – especially to identify work-related injuries that could not be differentiated in our analysis. Similarly, characterisation of different fracture types would have helped to determine the impact of osteoporotic fractures in our population. Finally, injuries related to pedal cycles could be categorised as either sports-related or non-sports-related injuries, and this may have biased our results.
Despite these limitations, the present study is the first to include all trauma patients in a Swiss ED population and provides novel information on this topic.
In conclusion, this study showed a significant drop in trauma-related presentations of more than one third during the most rigorous stay-at-home order of the COVID-19 pandemic. We found a marked reduction in snow sports-related accidents, a particular feature of our trauma centre. No change was observed in epidemiology of trauma in the elderly. Self-harm and assault-related trauma remained stable, and injuries related to pedal cycles increased. Our data, derived from all patients but most of whom experienced minor trauma, highlighted populations at risk of trauma during the pandemic in Switzerland in the context of previous international studies. These results may contribute to resource management and awareness of national particularities in a future pandemic.
This research received no specific grant from any funding agency.
All authors have completed and submitted the International Committee of Medical Journal Editors form for disclosure of potential conflicts of interest. No potential conflict of interest related to the content of this manuscript was disclosed.
1. World Health Organization. WHO announces COVID-19 outbreak a pandemic [Internet]. 2020 [zitiert 19. April 2021]. Verfügbar unter: https://www.who.int/europe/emergencies/situations/covid-19
2. Westgard BC, Morgan MW, Vazquez-Benitez G, Erickson LO, Zwank MD. An Analysis of Changes in Emergency Department Visits After a State Declaration During the Time of COVID-19. Ann Emerg Med. 2020 Nov;76(5):595–601. 10.1016/j.annemergmed.2020.06.019
3. Hautz WE, Sauter TC, Exadakytlos AK, Krummrey G, Schauber S, Müller M. Barriers to seeking emergency care during the COVID-19 pandemic may lead to higher morbidity and mortality – a retrospective study from a Swiss university hospital. Swiss Med Wkly [Internet]. 11. August 2020 [zitiert 7. April 2021]; Verfügbar unter: https://doi.emh.ch/smw.2020.20331
4. Giudici R, Lancioni A, Gay H, Bassi G, Chiara O, Mare C, u. a. Impact of the COVID-19 outbreak on severe trauma trends and healthcare system reassessment in Lombardia, Italy: an analysis from the regional trauma registry. World J Emerg Surg. 19. Juli 2021;16(1):39.
5. Adiamah A, Thompson A, Lewis-Lloyd C, Dickson E, Blackburn L, Moody N, et al.; ICON Trauma Study Group. The ICON Trauma Study: the impact of the COVID-19 lockdown on major trauma workload in the UK. Eur J Trauma Emerg Surg. 2021 Jun;47(3):637–45. 10.1007/s00068-020-01593-w
6. Pintado JF, Gibaja W, Vallejos RA, Rosas W, Guerra-Farfan E, Nuñez JH. How COVID-19 has affected emergent visits to a Latin-American trauma department: Experience at a Peruvian national trauma referral center. 2020;7.
7. Sherman WF, Khadra HS, Kale NN, Wu VJ, Gladden PB, Lee OC. How Did the Number and Type of Injuries in Patients Presenting to a Regional Level I Trauma Center Change During the COVID-19 Pandemic with a Stay-at-home Order? Clin Orthop Relat Res. 2021 Feb;479(2):266–75. 10.1097/CORR.0000000000001484
8. Maleitzke T, Pumberger M, Gerlach UA, Herrmann C, Slagman A, Henriksen LS, u. a. Impact of the COVID-19 shutdown on orthopedic trauma numbers and patterns in an academic Level I Trauma Center in Berlin, Germany. PLoS ONE. 16. Februar 2021;16(2):e0246956.
9. Rajput K, Sud A, Rees M, Rutka O. Epidemiology of trauma presentations to a major trauma centre in the North West of England during the COVID-19 level 4 lockdown. Eur J Trauma Emerg Surg [Internet]. 30. September 2020 [zitiert 14. April 2021]; Verfügbar unter: http://link.springer.com/10.1007/s00068-020-01507-w
10. Fraser E. Impact of COVID-19 Pandemic on Violence against Women and Girls. 16 March 2020. 16. März 2020;
11. who. Adressing violence against children, women and older people during Covid-19 Pandemic: Key actions. 17 June 2020This. 17 June 2020This;
12. Mazzolini K, Dzubnar J, Kwak H, Banks K, Mooney C, Tang A, et al. An Epidemic Within the Pandemic: The Rising Tide of Trauma During COVID-19. J Surg Res. 2022 Apr;272:139–45. 10.1016/j.jss.2021.11.016
13. Okoye OG, Olaomi OO, Gwaram UA, Apollo KD. The impact of COVID-19 lockdown on acute trauma patients seen at the National Hospital Trauma Centre Abuja, Nigeria. Pan Afr Med J. 2021 Apr;38:414. 10.11604/pamj.2021.38.414.28431
14. Olding J, Zisman S, Olding C, Fan K. Penetrating trauma during a global pandemic: changing patterns in interpersonal violence, self-harm and domestic violence in the Covid-19 outbreak. Surgeon. 2021 Feb;19(1):e9–13. 10.1016/j.surge.2020.07.004
15. Ishii K, Kurozumi T, Suzuki T, Matsui K, Inui T, Nakayama Y, et al. Impact of the COVID-19 pandemic on a trauma center of a university hospital in Japan. J Orthop Sci. 2022 Jan;27(1):207–10. 10.1016/j.jos.2020.11.018
16. Zhao J, Cai Q, Jiang D, Wang L, He H, Chen S, et al. The Impact of COVID-19 on SARSCoV-2-Negative Elderly Patients with Hip Fractures: A Single-Center Retrospective Study from Shanghai, China. Clin Interv Aging. 2022 Jul;17:991–9. 10.2147/CIA.S374083
17. Anwander H, Klingberg K, Gerber J, Bednarski P, Exadaktylos A, Müller M. Major trauma during COVID-19 in a level 1 trauma centre in Switzerland – a cohort study comparing the years 2020 and 2019. Swiss Med Wkly. 27. August 2021;151(3334):w30010–w30010.
18. Statistik B für. Lebenserwartung [Internet]. [zitiert 24. Januar 2023]. Verfügbar unter: https://www.bfs.admin.ch/bfs/de/home/statistiken/bevoelkerung/geburten-todesfaelle/lebenserwartung.html
19. Beratungsstelle für Unfallverhütung [Internet]. BFU. [zitiert 24. Januar 2023]. Verfügbar unter: https://www.bfu.ch/de
20. Bundesamt für Gesundheit BAG. Covid-19: Massnahmen in der Zeitachse [Internet]. Verfügbar unter: https://www.bern.ch/themen/stadt-recht-und-politik/bern-in-zahlen/covid-19-entwicklungen-in-der-stadt-bern/zusaetzliche-tabellen/covid-19-zeitachse.pdf/view
21. Baker SP, O’Neill B. Haddon WJr, Long WB. The injury severity score: a method for describing patients with multiple injuries and evaluating emergency care. J Trauma Acute Care Surg [Internet]. 1974;14(3). Verfügbar unter: https://journals.lww.com/jtrauma/Fulltext/1974/03000/the_injury_severity_score__a_method_for_describing.1.aspx
22. Copes WS, Champion HR, Sacco WJ, Lawnick MM, Keast SL, Bain LW. The Injury Severity Score Revisited. J Trauma Acute Care Surg [Internet]. 1988;28(1). Verfügbar unter: https://journals.lww.com/jtrauma/Fulltext/1988/01000/The_Injury_Severity_Score_Revisited.10.aspx
23. Nygren H, Kopra J, Kröger H, Kuitunen I, Mattila VM, Ponkilainen V, u. a. The effect of COVID-19 lockdown on the incidence of emergency department visits due to injuries and the most typical fractures in 4 Finnish hospitals. Acta Orthop. 7. März 2022;93:360–6.
24. Bergh C, Wennergren D, Möller M, Brisby H. Fracture incidence in adults in relation to age and gender: A study of 27,169 fractures in the Swedish Fracture Register in a well-defined catchment area. PLoS ONE. 21. Dezember 2020;15(12):e0244291.
25. Ström O, Borgström F, Kanis JA, Compston J, Cooper C, McCloskey EV, et al. Osteoporosis: burden, health care provision and opportunities in the EU: a report prepared in collaboration with the International Osteoporosis Foundation (IOF) and the European Federation of Pharmaceutical Industry Associations (EFPIA). Arch Osteoporos. 2011;6(1-2):59–155. 10.1007/s11657-011-0060-1
26. Thomas AC, Campbell BT, Subacius H, Orlas CP, Bulger E, Stewart RM, et al. National evaluation of the association between stay-at-home orders on mechanism of injury and trauma admission volume. Injury. 2022 Nov;53(11):3655–62. 10.1016/j.injury.2022.09.012
27. Chiba H, Lewis M, Benjamin ER, Jakob DA, Liasidis P, Wong MD, et al. “Safer at home”: the effect of the COVID-19 lockdown on epidemiology, resource utilization, and outcomes at a large urban trauma center. J Trauma Acute Care Surg. 2021 Apr;90(4):708–13. 10.1097/TA.0000000000003061
28. Canal C, Scherer J, Schlögl M, Ziegenhain F, Fahrner R, Neuhaus V. Impact of the first COVID-19 shutdown on traumatological patient volumes in Switzerland. Surg Pract Sci. 2022 Mar;8:100063. 10.1016/j.sipas.2022.100063
29. Pino EC, Gebo E, Dugan E, Jay J. Trends in Violent Penetrating Injuries During the First Year of the COVID-19 Pandemic. JAMA Netw Open. 1. Februar 2022;5(2):e2145708.
30. Sephton BM, Mahapatra P, Shenouda M, Ferran N, Deierl K, Sinnett T, et al. The effect of COVID-19 on a Major Trauma Network. An analysis of mechanism of injury pattern, referral load and operative case-mix. Injury. 2021 Mar;52(3):395–401. 10.1016/j.injury.2021.02.035
31. Bhattacharya R, Pearse M, Bates P, Tahmassebi R, El-Daly I, Jeyaseelan L, et al.; London Major Trauma Collaborative. The impact of COVID-19 on major trauma (ISS>15) in London, across its four Level 1 centres. Ann R Coll Surg Engl. 2022 Jun;104(6):437–42. 10.1308/rcsann.2021.0218
32. Pinggera D, Klein B, Thomé C, Grassner L. The influence of the COVID-19 pandemic on traumatic brain injuries in Tyrol: experiences from a state under lockdown. Eur J Trauma Emerg Surg. 2021 Jun;47(3):653–8. 10.1007/s00068-020-01445-7
33. Zwei Jahre Coronavirus in der Schweiz – ein Rückblick [Internet]. htr.ch. [zitiert 24. Januar 2023]. Verfügbar unter: https://www.htr.ch/story/tourismus/drei-jahre-coronavirus-in-der-schweiz-ein-rueckblick-33531.html
34. Scherer J, Canal C, Kaufmann E, Jensen KO, Pape HC, Neuhaus V. Pre-hospital and Hospital Trauma Care during the Covid-19 Lockdown - Experience in a Metropolitan European Level 1 Trauma Centre. Z Orthopadie Unfallchirurgie. 4. April 2023;
35. Halvachizadeh S, Teuben M, Berk T, Neuhaus V, Pape HC, Pfeifer R. The impact of SARS-CoV-2 (COVID-19) pandemic on trauma bay management and guideline adherence in a European level-one-trauma centre. Int Orthop. 2020 Sep;44(9):1621–7. 10.1007/s00264-020-04740-5
Supplementary information on statistical analysis
For descriptive data, both absolute numbers and relative numbers in percentages were reported. Interquartile ranges were given for the age of the population.
Stata’s (StataCorp, The College Station, Texas, USA) two-way command was used i) to create a bubble plot with frequency weights to illustrate injured body parts and injury mechanisms between males and females and ii) to show the incidence of COVID-19 in Bern canton and in Switzerland, as well as the change in trauma-related visits from 2019 H1 to 2020 H1.
Furthermore, a user-written heat plot command was used to illustrate the change in absolute consultations in different patient subgroups and according to different mechanisms (Ben Jann, 2019. “HEATPLOT: Stata module to create heat plots and hexagon plots”, Statistical Software Components S458598, Boston College Department of Economics, revised 27 Aug 2021).
Supplementary tables and figure
Table S1Demographic characteristics of the study population by two-month period – part 1.
| Total (n = 5839) | Two-month periods | ||||
| 2019 M1–M2 (n = 1023) | 2019 M3–M4 (n = 1033) | 2019 M5–M6 (n = 1107) | |||
| Patient characteristics | |||||
| Sex | Female | 2332 (39.9%) | 439 (42.9%) | 377 (36.5%) | 432 (39.0%) |
| Male | 3507 (60.1%) | 584 (57.1%) | 656 (63.5%) | 675 (61.0%) | |
| Age in years, median (IQR) | 40 (27– 60) | 41 (27–61) | 40 (26–59) | 39 (25–58) | |
| Age group | 18–24 | 1219 (20.9%) | 212 (20.7%) | 226 (21.9%) | 247 (22.3%) |
| 25–44 | 2021 (34.6%) | 331 (32.4%) | 361 (34.9%) | 386 (34.9%) | |
| 45–64 | 1431 (24.5%) | 265 (25.9%) | 238 (23.0%) | 267 (24.1%) | |
| 65–84 | 868 (14.9%) | 161 (15.7%) | 154 (14.9%) | 158 (14.3%) | |
| >84 | 300 (5.1%) | 54 (5.3%) | 54 (5.2%) | 49 (4.4%) | |
| Consultation characteristics | |||||
| Type of admission | Ambulance | 1737 (29.7%) | 275 (26.9%) | 274 (26.5%) | 340 (30.7%) |
| General Practitioner | 197 (3.4%) | 34 (3.3%) | 41 (4.0%) | 31 (2.8%) | |
| External hospital | 352 (6.0%) | 62 (6.1%) | 66 (6.4%) | 73 (6.6%) | |
| Police | 28 (0.5%) | 3 (0.3%) | 5 (0.5%) | 5 (0.5%) | |
| Repatriation | 10 (0.2%) | 2 (0.2%) | 3 (0.3%) | 1 (0.1%) | |
| Walk-in | 2254 (38.6%) | 409 (40.0%) | 377 (36.5%) | 407 (36.8%) | |
| Internal referral | 88 (1.5%) | 18 (1.8%) | 15 (1.5%) | 14 (1.3%) | |
| Urgent care centre/doctor | 72 (1.2%) | 10 (1.0%) | 15 (1.5%) | 16 (1.4%) | |
| Not specified | 1101 (18.9%) | 210 (20.5%) | 237 (22.9%) | 220 (19.9%) | |
| Triage | Life-threatening | 392 (6.7%) | 56 (5.5%) | 61 (5.9%) | 88 (7.9%) |
| Highly urgent | 1445 (24.7%) | 233 (22.8%) | 252 (24.4%) | 288 (26.0%) | |
| Urgent | 3716 (63.6%) | 672 (65.7%) | 678 (65.6%) | 668 (60.3%) | |
| Semi-urgent | 285 (4.9%) | 62 (6.1%) | 42 (4.1%) | 62 (5.6%) | |
| Not specified | 1 (0.0%) | 0 (0.0%) | 0 (0.0%) | 1 (0.1%) | |
| Injury characteristics | |||||
| Trauma mechanism | Injury of occupant of vehicle | 218 (3.7%) | 36 (3.5%) | 33 (3.2%) | 51 (4.6%) |
| Injury of motorcycle rider | 112 (1.9%) | 4 (0.4%) | 23 (2.2%) | 23 (2.1%) | |
| Injury of pedal cycle rider | 472 (8.1%) | 34 (3.3%) | 72 (7.0%) | 101 (9.1%) | |
| Injury of pedestrian | 41 (0.7%) | 14 (1.4%) | 3 (0.3%) | 9 (0.8%) | |
| Other transport accidents | 71 (1.2%) | 6 (0.6%) | 14 (1.4%) | 15 (1.4%) | |
| Fall 3 m and higher | 113 (1.9%) | 17 (1.7%) | 21 (2.0%) | 28 (2.5%) | |
| Fall less than 3m, slip or trip | 2683 (45.9%) | 563 (55.0%) | 475 (46.0%) | 462 (41.7%) | |
| Exposure to mechanical force | 1390 (23.8%) | 213 (20.8%) | 256 (24.8%) | 265 (23.9%) | |
| Assault | 333 (5.7%) | 62 (6.1%) | 54 (5.2%) | 63 (5.7%) | |
| Self-harm | 151 (2.6%) | 24 (2.3%) | 29 (2.8%) | 25 (2.3%) | |
| Exposure to heat/fire/electricity/pressure | 78 (1.3%) | 9 (0.9%) | 14 (1.4%) | 20 (1.8%) | |
| Avalanche, drowning, or submersion | 10 (0.2%) | 4 (0.4%) | 1 (0.1%) | 2 (0.2%) | |
| Other | 120 (2.1%) | 29 (2.7%) | 27 (2.6%) | 40 (3.6%) | |
| Unknown | 47 (0.8%) | 8 (0.8%) | 11 (1.1%) | 3 (0.3%) | |
| Sports-related injuries | Total | 755 (12.9%) | 184 (18.0%) | 144 (13.9%) | 116 (10.5%) |
| Snow sports-related injuries | 274 (4.7%) | 116 (11.3%) | 43 (4.2%) | 3 (0.3%) | |
| Severe trauma | 271 (4.6%) | 48 (4.7%) | 68 (6.6%) | 45 (4.1%) | |
| Inured body region | |||||
| Head | 1299 (22.2%) | 240 (23.5%) | 217 (21.0%) | 218 (19.7%) | |
| Face | 1121 (19.2%) | 193 (18.9%) | 204 (19.7%) | 200 (18.1%) | |
| Neck | 277 (4.7%) | 48 (4.7%) | 58 (5.6%) | 49 (4.4%) | |
| Thorax | 536 (9.2%) | 82 (8.0%) | 85 (8.2%) | 112 (10.1%) | |
| Abdomen | 295 (5.1%) | 51 (5.0%) | 59 (5.7%) | 57 (5.1%) | |
| Spine | 327 (5.6%) | 56 (5.5%) | 58 (5.6%) | 70 (6.3%) | |
| Upper extremities | 2268 (38.8%) | 355 (34.7%) | 381 (36.9%) | 461 (41.6%) | |
| Lower extremities | 1667 (28.5%) | 277 (27.1%) | 283 (27.4%) | 335 (30.3%) | |
| Other injury | 2 (0.0%) | 0 (0.0%) | 0 (0.0%) | 1 (0.1%) | |
| Procedural outcomes | |||||
| Discharge | Death | 6 (0.1%) | 1 (0.1%) | 0 (0.0%) | 1 (0.1%) |
| Discharge to home | 4159 (71.2%) | 741 (72.4%) | 738 (71.4%) | 780 (70.5%) | |
| Hospital admission | 1406 (24.1%) | 230 (22.5%) | 252 (24.4%) | 271 (24.5%) | |
| Transfer to external hospital | 212 (3.6%) | 40 (3.9%) | 31 (3.0%) | 42 (3.8%) | |
| Not specified | 56 (1.0%) | 11 (1.1%) | 12 (1.2%) | 13 (1.2%) | |
| LoS ED in hours, median (IQR) | 3.6 (2.3– 5.3) | 3.8 (2.5–5.5) | 3.5 (2.4–5.3) | 3.7 (2.4–5.6) | |
IQR: interquartile range; LoS ED: length of stay in the emergency department.
* p <0.05
Table S2Demographic characteristics of the study population by two-month period – part 2.
| Two-month periods | |||||||
| 2020 M1–M2 (n = 1052) | 2020 M3–M4 (n = 653) | 2020 M5–M6 (n = 971) | p value | ||||
| Patient characteristics | |||||||
| Sex | Female | 448 (42.6%) | 256 (39.2%) | 380 (39.1%) | |||
| Male | 604 (57.4%) | 397 (60.8%) | 591 (60.9%) | 0.026 | |||
| Age in years, median (IQR) | 42 (27–61) | 42 (28–61) | 39 (26–59) | 0.099 | |||
| Age group | 18–24 | 209 (19.9%) | 113 (17.3%) | 212 (21.8%) | 0.143 | ||
| 25–44 | 360 (34.2%) | 237 (36.3%) | 346 (35.6%) | 0.590 | |||
| 45–64 | 259 (24.6%) | 170 (26.0%) | 232 (23.9%) | 0.639 | |||
| 65–84 | 161 (15.3%) | 106 (16.2%) | 128 (13.2%) | 0.518 | |||
| >84 | 63 (6.0%) | 27 (4.1%) | 53 (5.5%) | 0.504 | |||
| Consultation characteristics | |||||||
| Type of admission | Ambulance | 313 (29.8%) | 222 (34.0%) | 313 (32.2%) | 0.003* | ||
| General Practitioner | 36 (3.4%) | 27 (4.1%) | 28 (2.9%) | 0.531 | |||
| External hospital | 62 (5.9%) | 38 (5.8%) | 51 (5.3%) | 0.852 | |||
| Police | 4 (0.4%) | 5 (0.8%) | 6 (0.6%) | 0.778 | |||
| Repatriation | 3 (0.3%) | 1 (0.2%) | 0 (0.0%) | 0.579 | |||
| Walk-in | 403 (38.3%) | 252 (38.6%) | 406 (41.8%) | 0.127 | |||
| Internal referral | 17 (1.6%) | 11 (1.7%) | 13 (1.3%) | 0.934 | |||
| Urgent care centre/doctor | 13 (1.2%) | 8 (1.2%) | 10 (1.0%) | 0.890 | |||
| Not specified | 201 (19.1%) | 89 (13.6%) | 144 (14.8%) | <0.001* | |||
| Triage | Life-threatening | 67 (6.4%) | 50 (7.7%) | 70 (7.2%) | 0.168 | ||
| Highly urgent | 240 (22.8%) | 162 (24.8%) | 270 (27.8%) | 0.071 | |||
| Urgent | 702 (66.7%) | 405 (62.0%) | 591 (60.9%) | 0.004* | |||
| Semi-urgent | 43 (4.1%) | 36 (5.5%) | 40 (4.1%) | 0.110 | |||
| Not specified | 0 (0.0%) | 0 (0.0%) | 0 (0.0%) | 0.510 | |||
| Injury characteristics | |||||||
| Trauma mechanism | Injury of occupant of vehicle | 35 (3.3%) | 26 (4.0%) | 37 (3.8%) | 0.560 | ||
| Injury of motorcycle rider | 11 (1.0%) | 16 (2.5%) | 35 (3.6%) | <0.001* | |||
| Injury of pedal cycle rider | 63 (6.0%) | 72 (11.0%) | 130 (13.4%) | <0.001* | |||
| Injury of pedestrian | 9 (0.9%) | 3 (0.5%) | 3 (0.3%) | 0.031 | |||
| Other transport accidents | 5 (0.5%) | 13 (2.0%) | 18 (1.9%) | 0.010* | |||
| Fall of at least 3 m | 20 (1.9%) | 8 (1.2%) | 19 (2.0%) | 0.513 | |||
| Fall of less than 3 m, slip or trip | 555 (52.8%) | 261 (40.0%) | 367 (37.8%) | <0.001* | |||
| Exposure to mechanical force | 240 (22.8%) | 161 (24.7%) | 255 (26.3%) | 0.086 | |||
| Assault | 60 (5.7%) | 45 (6.9%) | 49 (5.0%) | 0.674 | |||
| Self-harm | 23 (2.2%) | 23 (3.5%) | 27 (2.8%) | 0.551 | |||
| Exposure to heat/fire/electricity/pressure | 16 (1.5%) | 8 (1.2%) | 11 (1.1%) | 0.533 | |||
| Avalanche, drowning or submersion | 0 (0.0%) | 1 (0.2%) | 2 (0.2%) | 0.402 | |||
| Other | 4 (0.4%) | 10 (1.4%) | 10 (1.0%) | <0.001* | |||
| Unknown | 11 (1.0%) | 6 (0.9%) | 8 (0.8%) | 0.336 | |||
| Sports-related injuries | Total | 204 (19.4%) | 38 (5.8%) | 69 (7.1%) | <0.001* | ||
| Snow sports-related injuries | 99 (9.4%) | 12 (1.8%) | 1 (0.1%) | <0.001* | |||
| Severe trauma | — | 38 (3.6%) | 38 (5.8%) | 34 (3.5%) | 0.004* | ||
| Head | 262 (24.9%) | 142 (21.7%) | 220 (22.7%) | 0.063 | |||
| Face | 221 (21.0%) | 144 (22.1%) | 159 (16.4%) | 0.037* | |||
| Neck | 51 (4.8%) | 22 (3.4%) | 49 (5.0%) | 0.423 | |||
| Thorax | 101 (9.6%) | 57 (8.7%) | 99 (10.2%) | 0.354 | |||
| Abdomen | 58 (5.5%) | 28 (4.3%) | 42 (4.3%) | 0.654 | |||
| Spine | 52 (4.9%) | 21 (3.2%) | 70 (7.2%) | 0.017* | |||
| Upper extremities | 362 (34.4%) | 265 (40.6%) | 444 (45.7%) | <0.001* | |||
| Lower extremities | 329 (31.3%) | 175 (26.8%) | 268 (27.6%) | 0.127 | |||
| Other injury | 0 (0.0%) | 0 (0.0%) | 1 (0.1%) | 0.602 | |||
| Procedural outcomes | |||||||
| Discharge | Death | 1 (0.1%) | 2 (0.3%) | 1 (0.1%) | 0.590 | ||
| Discharge to home | 759 (72.1%) | 456 (69.8%) | 685 (70.5%) | 0.800 | |||
| Hospital admission | 244 (23.2%) | 168 (25.7%) | 241 (24.8%) | 0.655 | |||
| Transfer to external hospital | 41 (3.9%) | 22 (3.4%) | 36 (3.7%) | 0.871 | |||
| Not specified | 7 (0.7%) | 5 (0.8%) | 8 (0.8%) | 0.772 | |||
| LoS ED in hours, median (IQR) | 3.7 (2.4–5.3) | 3.3 (2.0–4.7) | 3.5 (2.3–5.1) | <0.001* | |||
IQR: interquartile range; LoS ED: length of stay in the emergency department.
* p <0.05
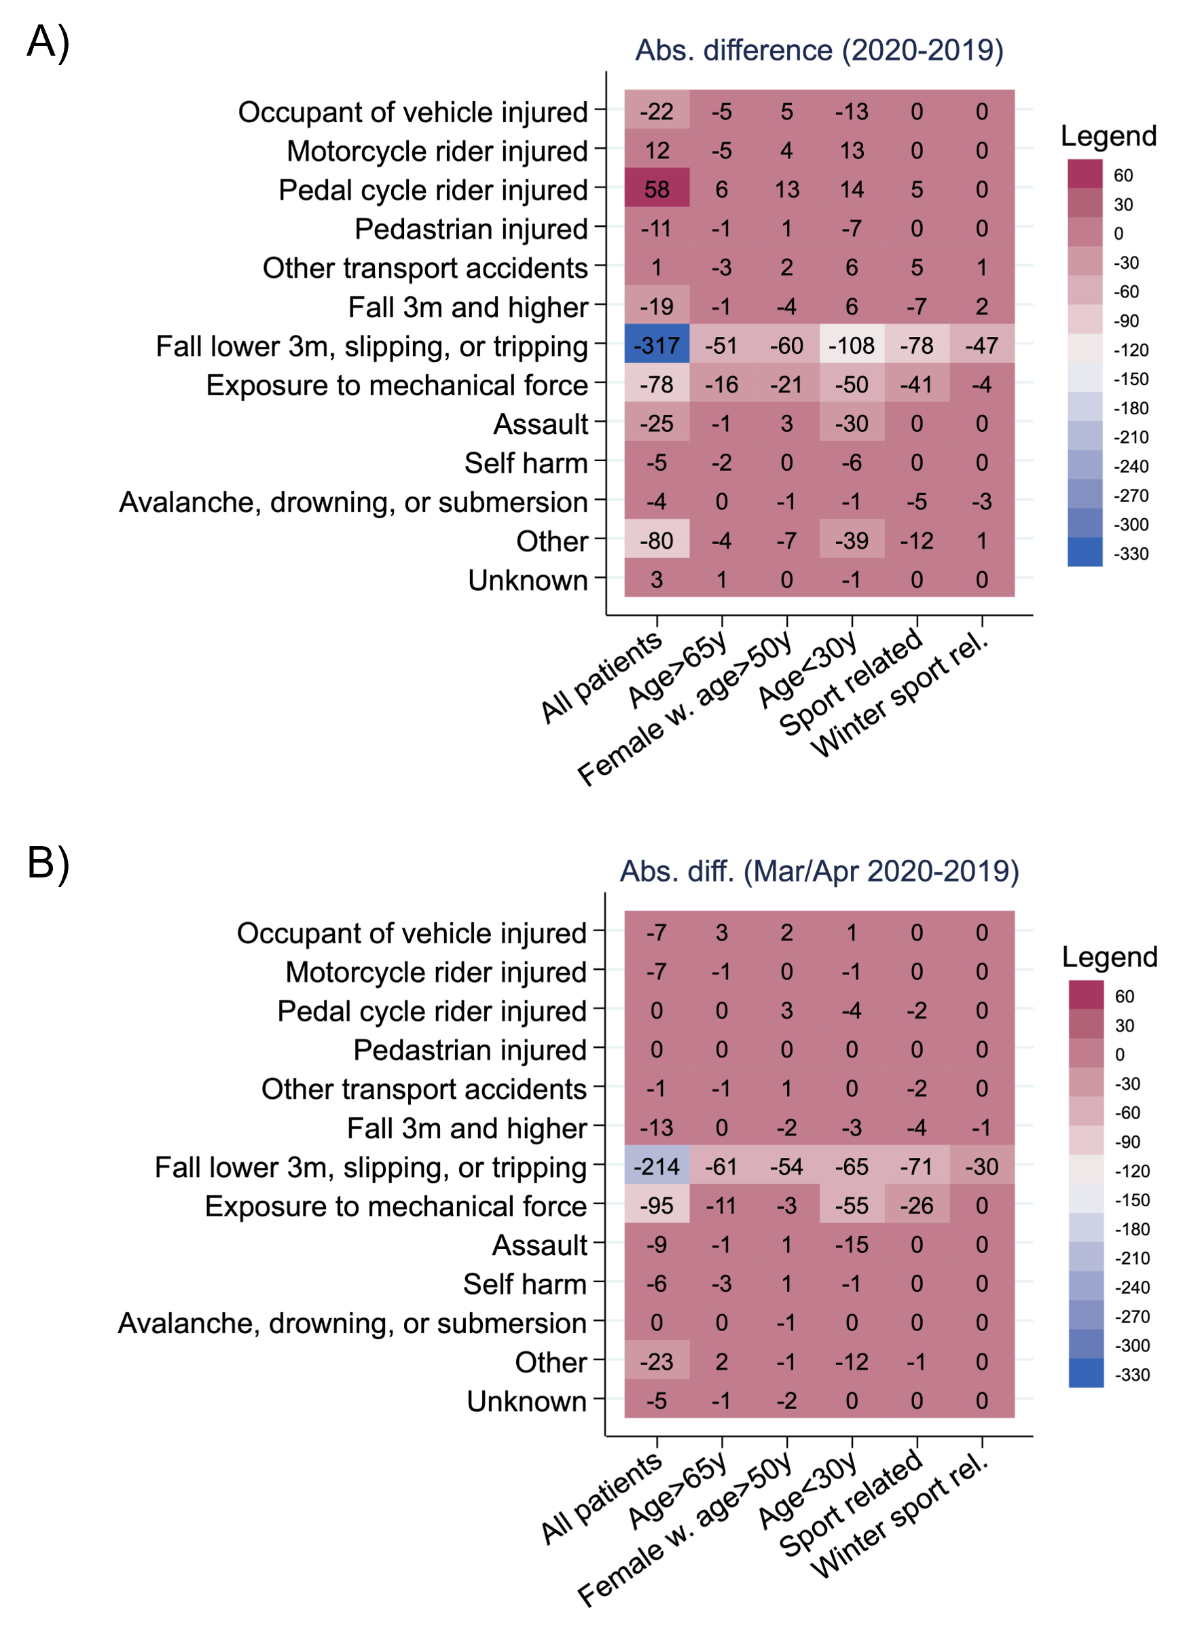
Figure S1Change in trauma cases in specific groups. (A) 2020 vs 2019, (B) March/April 2020 vs March/April 2019.