The key role of base rates: systematic review and meta-analysis of the predictive
value of four risk assessment instruments
DOI: https://doi.org/https://doi.org/10.57187/s.3517
Michael A. Weberabcd*,
Nina Schnyderab*,
Madeleine A. Kirschsteinacd,
Marc Grafcd,
Jérôme Endrassabd,
Astrid Rosseggerabd
a Research and Development, Office of Corrections and Rehabilitation,
Department of Justice and Home Affairs, Canton of Zurich, Zurich, Switzerland
b Department of Psychology, University of Konstanz,
Konstanz, Germany
c Forensic Clinic, University Psychiatric Clinics
Basel, Basel, Switzerland
d Department of Forensic Psychiatry, University of
Basel, Basel, Switzerland
* The first two authors contributed equally to this
work.
Summary
AIMS OF THE STUDY: Many countries have
seen a decline in recidivism rates over the past decades. These base rates are pertinent
information for assessing the recidivism risk of offenders. They provide a foundation
for clinical assessment and an empirical basis for risk assessment instrument norms,
which inform expected recidivism rates. The present study explored the extent to
which base rates influence the validity of risk assessment instruments.
METHODS: We systematically reviewed the
available evidence on the discrimination ability of four well-established risk
assessment instruments used to estimate the probability of recidivism for general
(Level of Service Inventory-Revised [LSI-R]), violent (Violence Risk Appraisal Guide
[VRAG]), sexual (Static-99R), and intimate partner violent offences (Ontario Domestic
Assault Risk Assessment [ODARA]). We conducted a bivariate logit-normal random effects
meta-analysis of sensitivity and false positive rates and modelled the positive
and negative predictive values. We used base rates as reported in (a) the construction
samples of each risk assessment instrument and (b) recent official statistics and
peer-reviewed articles for different offence categories and countries. To assess
the risk of bias, we used the Joanna Briggs Institute Critical Appraisal Checklist
for Diagnostic Test Accuracy Studies.
RESULTS: We screened 644 studies and
subsequently analysed 102, of which 96 were included in the systematic review and
24 in the meta-analyses. Discrimination was comparable for all four instruments
(median area under the curve = 0.68–0.71). The information needed to calculate summary
statistics of sensitivity and false positive rate was often not reported, and a
risk of bias may be present in up to half of the studies. The largest summary sensitivity
and false positive rate were estimated for the ODARA, followed by the LSI-R, the
VRAG, and the Static-99R. If base rates are low, positive predictive values tend
to be relatively low, while negative predictive values are higher: positive
predictive value = 0.032–0.133 and negative predictive value = 0.985–0.989 for sexual
offences; positive predictive value = 188–0.281 and negative predictive value =
0.884–0.964 for intimate partner violence; positive predictive value = 0.218–0.241
and negative predictive value = 0.907–0.942 for violent offences; positive
predictive value = 0.335–0.377 and negative predictive value = 0.809–0.810 for general
offences.
CONCLUSIONS: When interpreting the results
of individual risk assessments, it is not sufficient to provide the discrimination
of the instrument; the risk statement must also address the positive predictive
value and discuss its implications for the specific case. As recidivism rates are
neither stable over time nor uniform across countries or samples, the primary interpretation
of risk assessment instruments should rely on the percentile rank. Expected recidivism
rates should be interpreted with caution. However, our results are drawn from a
limited database, as studies not reporting sufficient information were excluded
from analyses and it was only possible to identify current base rates for modelling
positive and negative predictive values for certain countries. International standards
for consistently collecting and reporting base rates are important to better identify
crime trends. Future research on the validity of risk assessment instruments should
follow rigorous reporting standards.
Abbreviations
- AUC:
-
area under the curve
- LSI-R:
-
Level of Service
Inventory-Revised
- ODARA:
-
Ontario Domestic Assault Risk
Assessment
- Static-99R:
-
sexual recidivism risk
assessment instrument
- VRAG:
-
Violence Risk Appraisal Guide
Introduction
Mental health and criminal justice professionals
are often faced with the task of assessing the probability of future offences by
an individual. These forensic risk assessments inform sentencing, treatment, and
release decisions. There are more than 400 risk assessment instruments worldwide
that support this process [1]. Their use is considered to be state of the art as
these instruments are, on average, better at predicting criminal recidivism than
clinical judgement alone [2–4].
Studies on the validity of risk
assessment instruments focus on two aspects: discrimination and calibration. Discrimination
is an instrument’s ability to differentiate between recidivists and non-recidivists.
In forensic settings, discrimination is most commonly measured using the area under
the curve (AUC) in receiver operating characteristic curve analysis [5]. The AUC
is an overall measure of discrimination, constructed by plotting pairs of sensitivity
(sensitivity, or the true positive rate, is the proportion of recidivists who were
correctly assessed as “high risk”) and specificity (specificity, or the true negative
rate, is the proportion of non-recidivists who were correctly assessed as “low risk”)
across all possible cut-off values. AUC values range from 0 to 1, where 1 indicates
perfect discrimination and values below 0.5 indicate poorer discrimination than
chance. By contrast, calibration assesses whether the expected recidivism rates
in the norm tables of the risk assessment instruments correspond to the actual (observed)
recidivism rates [5].
Although not an exact equivalent to calibration,
positive and negative predictive values provide a more practical indication of the
utility of risk assessments than AUC values, as they focus on the prospective prediction
of adverse outcomes [5]. The positive predictive value reflects the proportion of
individuals assessed as “high risk” who reoffended, and the negative predictive
value the proportion of individuals assessed as “low risk” who did not reoffend.
Positive and negative predictive value depend not only on the risk assessment
instrument’s discriminative ability but also on the base rate of the criterion.
In forensic settings, base rates are typically the observed recidivism rates in
a specific population over a defined period. A risk assessment instrument’s performance
is best when the base rate is 50% [6, 7].
As the base rate decreases, the risk assessment instrument’s positive
predictive value decreases and negative predictive value increases. In populations
with very low base rates, the recidivism risk of individuals classified as high
risk is over-estimated, whereas underestimation is more common in populations with
very high base rates.
Base rates differ greatly depending on
the offence and the characteristics of the sample [8, 9]. They also fluctuate over
time and have shown a declining trend
over the past decades [10–12].
Research objectives
Despite the clear implications for forensic
practitioners and criminal justice decision-makers, the extent to which the predictive
values of a risk assessment instrument vary according to current base rates has
not yet been systematically explored. The present work intended to fill this gap.
We aimed to:
- Conduct a systematic review and meta-analysis
of different aspects relating to the discrimination ability of four frequently used
risk assessment instruments to predict recidivism for general, sexual, violent,
and intimate partner violent offences.
- Examine the positive and negative
predictive values of the risk assessment instruments given current low and high
base rates and discuss the implications for forensic practice.
Materials and methods
Reporting standards
We followed the Preferred Reporting Items
for Systematic Reviews and Meta-Analyses (PRISMA 2020) statement to report the results
of our study transparently and completely [13] (see appendix, supplementary material
S1). A study protocol has not been prepared.
Eligibility criteria
In accordance with PRISMA, we followed
the PFO (population, prognostic factor, and outcome) framework to specify inclusion
and exclusion criteria, as designed for prognostic studies. Our meta-analysis included
instruments used to assess general, violent, sexual, and intimate partner
violent recidivism risks to cover the broad range of forensic risk assessment
instruments. For each of these offence types, we selected one risk assessment
instrument that is widely used in forensic practice and provides expected recidivism
rates, and whose validity has been replicated in several countries [14–17]. The
following four risk assessment instruments were selected:
- Level
of Service Inventory-Revised (LSI-R) [18] for general recidivism
- Violence
Risk Appraisal Guide (VRAG) [19] for violent recidivism
- Static-99R
[20] for sexual recidivism
- Ontario
Domestic Assault Risk Assessment (ODARA) [21] for intimate partner violent recidivism
We specified eligibility criteria regarding
the study design and measures of validity. For the systematic review, studies were
eligible if they reported AUCs, including corresponding measures (i.e., 95% confidence
interval [95% CI] and/or standard error [SE]); for the meta-analysis, studies were
eligible if they reported true/false positives and true/false negatives, sensitivity
and specificity, or positive and negative predictive value (the full list of inclusion
and exclusion criteria is provided in the appendix, supplementary material S2).
The objective of each study was to identify high-risk offenders by utilising the
relevant risk assessment instrument.
Information source and search strategy
We conducted a systematic search in PsycInfo
(EBSCO interface; 1887 onwards) and PubMed (including MEDLINE, PMC, and Bookshelf;
1887 onwards). The search terms consisted of both the full name and acronym of each
of the four risk assessment instruments combined with the terms “[accura* OR replicat*
OR valid*]”. The full search strings are provided in appendix, supplementary material
S3. We restricted the search to peer-reviewed articles and dissertations. We identified
additional sources by screening the reference lists of studies included in this
systematic review as well as those in earlier reviews and meta-analyses [9, 14,
17, 20, 22–31]. The last search was carried out on March 30, 2023.
Selection process
We imported all identified records into
EndNote [32], where duplicates were removed. Two reviewers (MW and an undergraduate
student of psychology) screened all records (titles/abstracts) and reviewed the
full text of the retrieved records to select eligible studies. Some studies were
ineligible for inclusion for more than one reason. We describe the hierarchy of
how we categorised reasons for the exclusion of full texts in appendix, supplementary
material S4.
Data collection process
For each study, two independent reviewers
(MW, NS, or MK) extracted data into a Microsoft Excel spreadsheet. Disagreements
were resolved by discussion between the reviewers, AR, and JE, as well as by re-examination
of the report. Sample data that were used in more than one published article were
only included once. When deciding between multiple articles, we favoured studies
with a higher level of comparability to the construction sample, larger sample sizes,
those published in peer-reviewed journals, and original research rather than re-analyses
of previously collected data. We did not contact study investigators to obtain missing
data.
Study variables
For the outcome variable, we extracted
base rates and data on measures of validity, including AUC values and their corresponding
95% CIs or standard errors; true positive, true negative, false positive, and false
negative; sensitivity and specificity; and predictive values. Additionally, we extracted
data on the study characteristics, including the authors, title, and geographic
region (categorised into Australasia, Europe, North America, and mixed); sample
characteristics, including the mean age, age range and standard deviation (SD),
sample size, and type of index offence; and outcome characteristics, including the
type of recidivism, legal status of recidivism, and length of follow-up (supplementary
material S5 in the appendix).
Risk assessment instruments perform best
under the conditions for which they were originally developed [9, 16, 33]. Therefore,
we assessed the extent to
which each study was comparable to the construction study in terms of offender age
and sex, type of index offence, type and legal status of recidivism, and length
of follow-up (supplementary material S6 in the appendix). We contacted the developers
of each instrument to confirm whether we had correctly specified these comparators
and made changes if needed. If a study did not provide enough information to assess
comparability, we considered the respective characteristic as not met.
Some studies reported outcomes for subgroups
and, therefore, had multiple extractable values. Based on pre-defined decision rules
(supplementary material S7 in the appendix), we extracted only one value for each
study variable.
Base rate scenarios
As base rates are not stable over time,
we did not rely solely on those reported in the construction samples. To identify
current base rates reported in North America, Western Europe, and Australia for
different offence categories, we searched for national statistics and peer-reviewed
publications on recidivism rates (search strategy in appendix, supplementary material
S8). We chose statistics with the highest relevance for forensic practice. The inclusion
criteria for base rates were total cohort studies, adult offenders, fixed follow-up
period, start of time at risk since 2000, and index and recidivism offences of the
same type. Concerning the legal status of recidivism, we considered convictions
for sexual and violent offences, and police records or charges for intimate
partner violent offences. To account for different base rate scenarios, we chose
the lowest and highest base rates identified.
Risk of bias
To assess the risk of bias in the included
studies, we applied the Joanna Briggs Institute Critical Appraisal Checklist for
Diagnostic Test Accuracy Studies [34, 35]. The Joanna Briggs Institute checklist
consists of 10 items that address study design, sampling, attrition, analytical
procedure, and outcomes. The answer categories for each item are yes, no, unclear,
and not applicable. Not all items of the Joanna Briggs Institute checklist were
applicable to our included studies, because risk assessment instruments are not
classic diagnostic tests. Eight items were applicable to the ODARA, Static-99R,
and VRAG studies, and seven were applicable to the LSI-R studies. Even fewer Joanna
Briggs Institute items were applicable for some individual studies due to logical
interdependencies. We dummy-coded the answer categories as yes = 1 and no or unclear
= 0. To assess the overall risk of bias, we first calculated the total number of
items met for each study. Second, we divided this value by the number of items that
were applicable to the study. Because the Joanna Briggs Institute checklist provides
no scheme for evaluating studies as having a low or high risk of bias [34], we dichotomised
the proportions of Joanna Briggs Institute items met as follows: If more than 50%
of the applicable items were met, the study was classified as lower risk; otherwise,
it was classified as higher risk. Two reviewers (of MW, NS, and MK) independently
assessed the risk of bias for each included study. Disagreements were resolved by
discussion and re-examination of the report.
Analytical strategy
We reported the characteristics of studies
included in the systematic review and meta-analysis for each risk assessment
instrument. We calculated the median, minimum, and maximum for sample size, age,
length of follow-up, proportion of female offenders, and base rate. Furthermore,
we summarised counts and percentages for geographic regions, type of index offence,
type and legal status of recidivism, and studies with lower risk of bias.
Systematic review
For each risk assessment instrument,
we calculated the median AUC and median lower and upper bounds of the 95% CIs. We
also reported the smallest and largest AUC, including their corresponding 95% CIs.
As an indicator of between-study differences in AUCs, we examined whether the 95%
CIs of the smallest and largest AUCs overlapped. If the studies provided standard
errors for the AUCs, we calculated 95% CIs with AUC ± 1.96 × standard error.
Meta-analysis of sensitivity
and false positive rates
A meta-analysis of test accuracy studies
requires 2 × 2 contingency tables. If they were not reported in the primary study,
we calculated true positive, true negative, false positive, and false negative based
on sample size (n), base rate (in %), sensitivity (true positive rate), and specificity
(true negative rate) [36] (supplementary material
S9 in the appendix).
Furthermore, between-study heterogeneity
of sensitivities and specificities must be low, otherwise pooling these statistics
would be misleading [36–38]. For each risk assessment instrument, we tested the
equality of sensitivity and specificity with chi-squared tests, and computed correlations
between the measures with rho. We conducted bivariate logit-normal random effects
meta-analysis of sensitivity and false positive rate (1−specificity) for each risk
assessment instrument. We analysed the models using linear mixed model techniques
with restricted maximum likelihood estimation [40]. Bivariate models are more precise
than alternative methods in estimating sensitivities and specificities [38], mainly
because they consider (negative) correlations between the two [40].
Modelling of positive
and negative predictive value
Based on the results of the bivariate
meta-analysis of sensitivity and false positive rate, we calculated the positive
and negative predictive value for three different base rate scenarios (supplementary
material S9). For each risk assessment instrument, we used the lowest and highest
base rates identified in the search alongside the base rate reported for the construction
sample.
Statistical analyses and graphing were
conducted in R version 4.1.3 with the tidyverse, madan, and forestplot packages
[36, 41, 42]. Data and code used for this study are available on the Open Science
Framework (https://osf.io/jbgka/).
Results
Study selection and eligible studies
After importing the search results into EndNote,
116 duplicates were removed. We screened 644 records, of which 543 were identified
through scientific databases and 101 through reference lists. Overall, we reviewed
206 full texts (see figure 1).
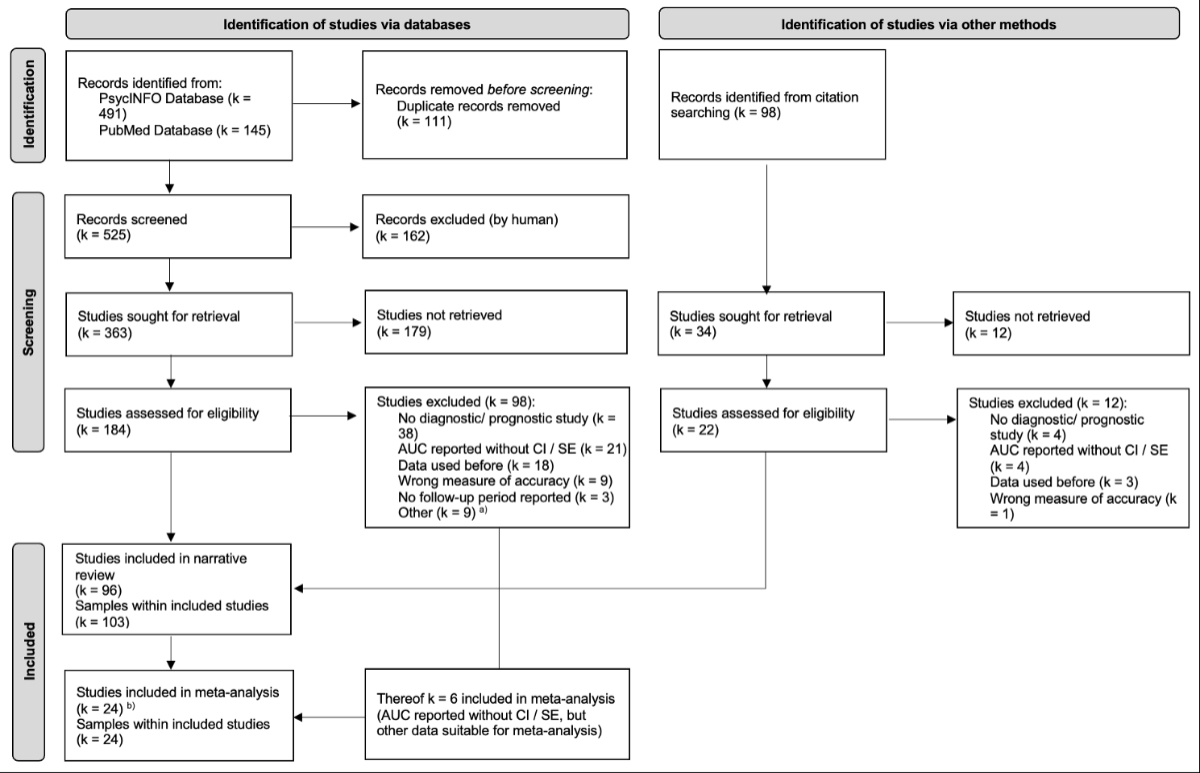
Figure 1PRISMA
2020 Flow Diagram [13]. a Wrong instrument (k = 2); Instrument
modified (k = 2); No base rate reported (k = 2); No index offence
(k = 2); No sample size reported (k = 1). b Thereof k
= 6 not included in the narrative review (area under the curve [AUC] reported
without CI [confidence interval] / SE [standard error]). All records were retrievable.
Only 16 studies were comparable to the construction
samples regarding offender age and sex, type of index offence, type and legal status
of recidivism, and length of follow-up. Of these, six used the LSI-R, three the
ODARA, six the Static-99R, and one the VRAG.
We included 102 studies (109 independent
samples, n = 92,720), of which 96 (103 samples, n = 74,674) were included in the
systematic review and 24 (24 samples, n = 23,398) were included
in the meta-analyses. All studies included in the systematic review reported AUCs
and corresponding 95% CIs or standard error as the measure of discrimination. The
studies included in the meta-analysis were not an exact sub-sample of those included
in the systematic review: Six studies did not report AUCs with corresponding 95%
CIs or standard error, but rather sensitivity and specificity, and were therefore
included in the meta-analysis. Full texts were most commonly excluded for having
a non-diagnostic or non-prognostic study design (e.g., systematic review or meta-analysis),
no reported measure of validity, or overlapping datasets (figure 1).
Study characteristics
The largest number of studies eligible
for the systematic review focused on the Static-99R, followed by the VRAG. The LSI-R
and ODARA were used in the smallest number of eligible studies. Such differences
in the number of eligible studies were not as pronounced for the meta-analysis (table
1). The sample sizes of the eligible studies had large variations (table 1).
The median age of participants in all
eligible studies was between 35 and 40 years. Most studies included predominantly
male participants and were conducted in North America or Europe. In most studies,
the risk assessment instruments were used to assess offenders with an index offence
and predict the types of recidivism for which the instrument was developed. The
LSI-R and VRAG studies had substantial variations in types of index offences and
recidivism (table 1).
The most frequently used category for
the legal status of recidivism was “charge, conviction, or criminal record”, with
two exceptions. In the meta-analysis, LSI-R studies used the category “arrest or
incarceration” most frequently, and ODARA studies used the categories “charge, conviction,
or criminal record” and “police report” equally often (table 1).
Table 1Characteristics of samples included in the systematic
review and meta-analysis by risk assessment instrument.
| Study characteristics |
Systematic review (k = 103) |
Meta-analysis (k = 24) |
|
LSI-R7 |
Static-99R |
ODARA |
VRAG7, 8 |
LSI-R |
Static-99R |
ODARA |
VRAG |
| Total number of samples |
16 |
39 |
14 |
34 |
5 |
7 |
5 |
7 |
| Median sample size count (min/max) |
240.5 (56/9454) |
399 (66/17,455) |
147.5 (30/589) |
126.5 (25/1353) |
516 (112/17,410) |
181 (100/650) |
145 (30/589) |
140 (52/495) |
| Countries, % (count) |
Australasia1 |
0.0% (0) |
17.9% (7) |
7.1% (1) |
– |
40.0% (2) |
14.3% (1) |
20.0% (1) |
– |
| Europe2 |
43.8% (7) |
15.4% (6) |
21.4% (3) |
50.0% (17) |
20.0% (1) |
42.9% (3) |
20.0% (1) |
100.0% (7) |
| North America3 |
56.2% (9) |
64.1% (25) |
71.4% (10) |
47.1% (16) |
40.0% (2) |
42.9% (3) |
60.0% (3) |
– |
| Mixed4 |
– |
2.6% (1) |
– |
– |
– |
– |
– |
– |
| Median age in years (min/max) |
35 (27.7/39.5) |
40.7 (23.5/55.8) |
36.2 (28.6/40.5) |
33.4 (24.7/41.2) |
34.5 (17/35.6) |
39.4 (37.5/47.2) |
37.7 (32.2/40.5) |
35.4 (32/42) |
| Median % females (min/max) |
1.4 (0/100) |
– |
0 (0/100) |
0 (0/100) |
0 (0/50) |
– |
– |
0 (0/10) |
| Type of index offence, % (count) |
Intimate partner violence |
– |
– |
0.0% (0) |
– |
– |
– |
0.0% (0) |
– |
| Violence (excl. sexual) |
12.5% (2) |
– |
– |
38.2% (13) |
– |
– |
– |
28.6% (2) |
| Violence (incl. sexual) |
6.2% (1) |
0.0% (0) |
– |
11.8% (4) |
– |
0.0% (0) |
– |
0.0% (0) |
| General |
18.8% (3) |
– |
– |
17.6% (6) |
0.0% (0) |
– |
– |
28.6% (2) |
| Type of recidivism, % (count) |
Intimate partner violence |
– |
– |
0.0% (0) |
– |
– |
– |
0.0% (0) |
– |
| Violence (excl. sexual) |
6.2% (1) |
– |
0.0% (0) |
23.5% (8) |
– |
– |
0.0% (0) |
57.1% (4) |
| Violence (incl. sexual) |
0.0% (0) |
0.0% (0) |
– |
0.0% (0) |
– |
0.0% (0) |
– |
0.0% (0) |
| General |
18.8% (3) |
0.0% (0) |
– |
73.5% (25) |
0.0% (0) |
– |
– |
– |
| Legal status recidivism, % (count) |
Arrest or incarceration |
18.8% (3) |
30.8% (12) |
0.0% (0) |
2.9% (1) |
60.0% (3) |
14.3% (1) |
20.0% (1) |
– |
| Charge, conviction, or criminal record |
68.8% (11) |
56.4% (22) |
57.1% (8) |
70.6% (24) |
20.0% (1) |
71.4% (5) |
40.0% (2) |
71.4% (5) |
| Police report |
6.2% (1) |
– |
28.6% (4) |
2.9% (1) |
– |
– |
40.0% (2) |
– |
| Other |
6.2% (1) |
12.8% (5) |
14.3% (2) |
20.6% (7) |
– |
14.3% (1) |
– |
28.6% (2) |
| Median length follow-up in years (min/max) |
2 (0/19.7) |
5 (0.1/16.4) |
4.7 (0/11.6) |
4.7 (0/49) |
2 (0.5/5) |
5 (0.2/16.4) |
2.1 (0/11.6) |
6 (0/10) |
| Median base rate in months (min/max) |
38 (9/77) |
8.5 (1.9/24.7) |
23.1 (11.5/44) |
27.5 (4.7/80) |
23 (9.8/58) |
9.9 (4/21) |
20 (11.5/50) |
18 (4.7/32.8) |
| Comparable contextual factors, % (count)5 |
25.0% (4) |
15.4% (6) |
21.4% (3) |
– |
60.0% (3) |
28.6% (2) |
– |
– |
| Joanna Briggs Institute assessment: lower risk of bias6, % (count) |
87.5% (14) |
43.6% (17) |
50.0% (7) |
41.2% (14) |
100.0% (5) |
71.4% (5) |
40.0% (2) |
71.4% (5) |
The median follow-up periods were largely
comparable between instruments. The exceptions were LSI-R studies included in both
the systematic review and meta-analysis and ODARA studies included in the meta-analysis,
which reported shorter follow-up periods (table 1).
Evidence of the risk of bias assessed
with the Joanna Briggs Institute checklist was mixed. For the systematic review,
only half or less than half of the studies on the Static-99R, ODARA, or VRAG had
a lower risk of bias. For the meta-analysis, two out of five studies on the ODARA
had a lower risk of bias (table 1).
Systematic review
The 95% CIs of the median, smallest,
and largest AUCs overlapped for the VRAG, ODARA, and LSI-R; thus, large between-study
differences in AUCs were not present for these risk assessment instruments. However,
for the Static-99R, the 95% CIs of the smallest and largest AUCs did not overlap,
indicating between-study differences in these AUCs (figure 2 and table S1 in
the appendix).
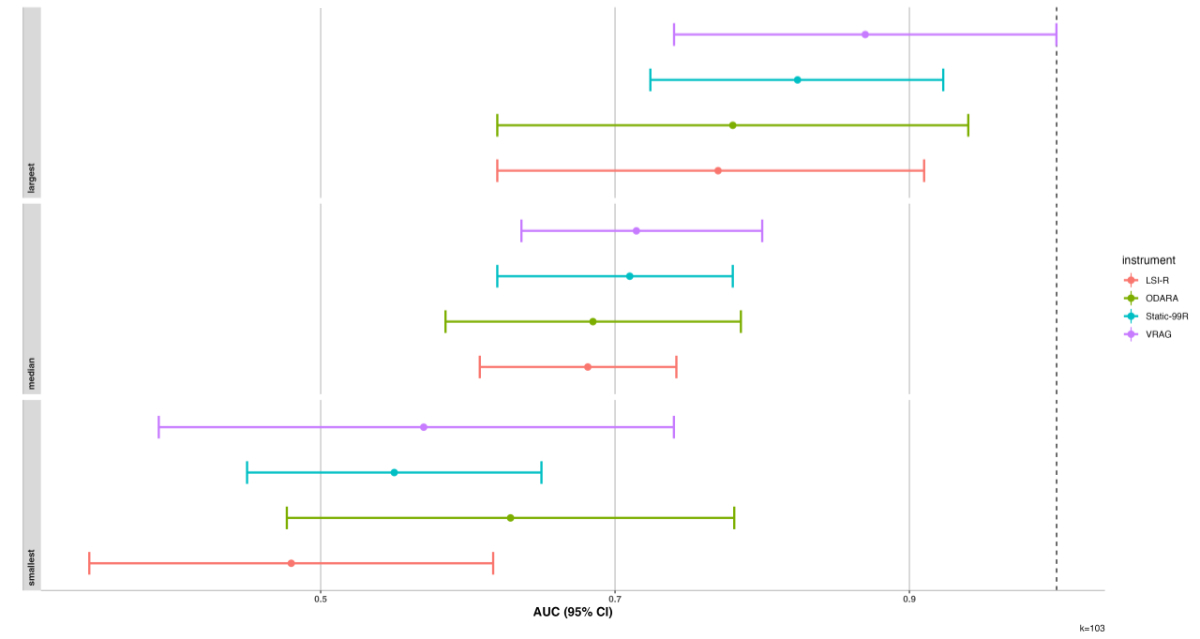
Figure 2Median,
smallest, and largest areas under the curve (AUC) of the four risk assessment instruments
(including their corresponding 95% confidence intervals [CI]). Median corresponds
to the calculated median AUC for each risk assessment instrument. Smallest corresponds
to the smallest AUC of each risk assessment instrument found in our systematic review,
and largest corresponds to the largest AUC found. LSI-R: Level of Service
Inventory-Revised; ODARA: Ontario Domestic Assault Risk Assessment; Static-99R:
sexual recidivism risk assessment instrument; VRAG: Violence Risk Appraisal
Guide.
For the LSI-R, the study reporting the
smallest AUC (AUC = 0.480, 95% CI = 0.343–0.617) was conducted in Germany and had
a sample size of 85 individuals with a migration background, who had been convicted
of violent index and recidivism offences and were followed for a fixed period of
2 years [43]. The study reporting the largest AUC (AUC = 0.770, 95% CI = 0.620–0.910)
was conducted in the USA and had a sample size of 56 individuals who had committed
violent or sexual index offences, were charged with a range of different recidivism
offences, and were followed for a fixed period of 1 year [44].
For the Static-99R, the study reporting
the smallest AUC (AUC = 0.550, 95% CI = 0.450–0.650) was conducted in Canada and
had a sample size of 399 individuals, who had committed sexual index and recidivism
offences and were followed for an average of 2.4 years [45]. The study reporting
the largest AUC (AUC = 0.824, 95% CI = 0.608–0.742) was conducted in the USA and
had a sample size of 338 individuals who had committed a sexual index offence, were
charged with a sexual recidivism offence, and were followed for a fixed period of
5 years [46].
For the ODARA, the study reporting the
smallest AUC (AUC = 0.629, 95% CI = 0.477–0.781) was conducted in Canada and had
a sample size of 97 individuals who had committed an intimate partner violent index
offence, were charged with a violent recidivism offence, and were followed for a
fixed period of 2 years [47]. The study reporting the largest AUC (AUC = 0.780,
95% CI = 0.620–0.940) was conducted in Switzerland and had a sample size of 30 individuals
who had committed an intimate partner violent index offence, were charged or convicted
with a violent recidivism offence, and were followed for an average of 8 years [48].
For the VRAG, the study reporting the
smallest AUC (AUC = 0.570, 95% CI = 0.390–0.740) was conducted in Belgium and had
a sample size of 191 individuals who had committed various types of index offences
but were convicted of violent or sexual recidivism offences, were in psychiatric
care after the index offence and were followed for an average of 2.44 years [49].
The study reporting the largest AUC (AUC = 0.870, 95% CI = 0.740–1.000) was conducted
in the UK and had a sample size of 25 individuals who had committed a general index
offence and a violent recidivism offence in the institution in which they were incarcerated,
and were followed for an average of 6 months [50].
Meta-analysis of sensitivity and false positive
rates
Descriptive summary statistics showed
that the sensitivities and false positive rates were sufficiently equal for all
risk assessment instruments. Correlations of sensitivities and false positive
rates were rho = 0.520 (95% CI = −0.669–0.961) for the LSI-R, rho = 0.922 (95% CI
= 0.213–0.995) for the ODARA, rho = 0.730 (95% CI = −0.051–0.957) for the Static-99R,
and rho = 0.811 (95% CI = 0.148–0.971) for the VRAG.
We estimated the largest summary sensitivity
and false positive rate for studies concerning the ODARA, followed by studies on
the LSI-R and VRAG; the smallest sensitivity for studies on the Static-99R (table
2). The Static-99R correctly identified one in two, both the VRAG and the LSI-R
three in five, and the ODARA four in five recidivists as being at high risk of recidivism.
Conversely, three in five non-recidivists were correctly identified as being at
low risk of recidivism by the ODARA, more than one in two by the LSI-R, seven in
ten by the VRAG, and more than four in five by the Static-99R.
Table 2Summary estimates of sensitivities
and false positive rates.
| Risk assessment instrument |
Sensitivity (95% CI) |
False positive rate (95% CI) |
| Level of Service Inventory-Revised
(LSI-R) (k = 5) |
0.641 (0.598, 0.681) |
0.431 (0.365, 0.499) |
| Static-99R (sexual recidivism risk
assessment instrument) (k = 7) |
0.464 (0.256, 0.686) |
0.138 (0.034, 0.420) |
| Ontario Domestic Assault Risk
Assessment (ODARA) (k = 5) |
0.815 (0.561, 0.938) |
0.394 (0.215, 0.606) |
| Violence
Risk Appraisal Guide (VRAG) (k = 7) |
0.618 (0.460, 0.755) |
0.302 (0.216, 0.404) |
Base rates
The current reconviction rates for violent
recidivism ranged from 13% to 21%. The lowest rate was reported in Austria, for
a fixed follow-up period of 4 years and for offenders who were convicted or released
in 2017; the highest was reported in Germany, for a fixed follow-up period of 6
years and for offenders who were convicted or released in 2004. Both rates were
based on national statistics with large sample sizes and included offenders with
different types of violent index offences (table S2 in the appendix). The base
rate reported in the VRAG construction sample (31%) was higher than current base
rates; however, the VRAG construction sample also showed a time of initial conviction
or release many decades earlier than the samples for the current base rates, and
included Canadian prisoners and psychiatric inpatients [51]. The construction sample
therefore differs from the current samples in terms of geographic region and psychiatric
history, as the current base rates are taken from German-speaking countries among
general offender cohorts.
The current reconviction rates for sexual
recidivism ranged from 2% to 13%. The lowest rate was reported in Germany for a
fixed follow-up period of 3 years, based on a national statistic that included offenders
with sexual abuse as the index and recidivism offences, who were convicted or released
in 2004. The highest rate was reported in Australia for offenders with mental disorders
and a high recidivism risk at baseline, who had been treated in a statutory agency
between 1987 and 2011 and followed for a fixed period of 5 years (table S3 in
the appendix). The base rate reported in the Static-99R construction sample (11%)
[20] was comparable to the highest currently reported base rate. The construction
sample differed from the current sample in the following ways: the base rate was
based on a meta-analysis of 24 samples from Anglo-Saxon and European countries,
whereas the current samples were restricted to individual studies based on total
offender cohorts; and the range of release dates was larger and dated back considerably
longer (1957–2007; see table S3 in the appendix).
Current police-registered intimate
partner violent recidivism over a fixed 1-year follow-up period differed between
countries. The lowest rate was reported in Germany (13%), and the highest was reported
in Australia (46%) (table S4 in the appendix). Both rates were based on total cohorts.
The base rate reported in the ODARA construction sample (30%) [21] lies between
the lowest and highest current base rates.
Table 3Positive and
negative predictive values based on summary sensitivity and false positive rates
for the three base rate scenarios.
| Risk assessment instrument |
Positive
predictive value |
Negative
predictive value |
|
Construction sample (95% CI) |
Low (95% CI) |
High (95% CI) |
Construction sample (95% CI) |
Low (95% CI) |
High (95% CI) |
| Level of Service Inventory-Revised (LSI-R) (k = 5) |
0.508 (0.487, 0.532) |
0.355 (0.335, 0.377) |
0.626 (0.606, 0.649) |
0.694 (0.693–0.694) |
0.810 (0.809, 0.810) |
0.583 (0.582–0.583) |
| Static-99R (sexual recidivism risk assessment
instrument) (k = 7) |
0.294 (0.168, 0.482) |
0.064 (0.032, 0.133) |
0.334 (0.196, 0.529) |
0.929 (0.913, 0.937) |
0.987 (0.985, 0.989) |
0.915 (0.897, 0.925) |
| Ontario Domestic Assault Risk Assessment (ODARA) (k
= 5) |
0.470 (0.399, 0.528) |
0.236 (0.188, 0.281) |
0.638 (0.569, 0.690) |
0.884 (0.807, 0.937) |
0.933 (0.884, 0.964) |
0.794 (0.677, 0.925) |
| Violence Risk
Appraisal Guide (VRAG) (k = 7) |
0.479 (0.456, 0.489) |
0.234 (0.218, 0.241) |
0.352 (0.332, 0.361) |
0.803 (0.764, 0.844) |
0.924 (0.907, 0.942) |
0.873 (0.845, 0.901) |
The current reconviction rates for general
offences over a fixed follow-up period of three years ranged from 27% to 53% (table
S5 in the appendix). The lowest was reported in Austria and the highest in the Netherlands.
Both rates were based on total cohorts. The base rate reported in the LSI-R construction
sample (41%) was in between the highest and lowest current base rates [18].
Base rates varied by length of follow-up,
study population, country, and type of recidivism. For example, in the culturally
comparable countries of Austria and Germany, the base rates of violent recidivism
were higher when the follow-up period was longer. Compared with a national sample
of offenders with all types of sexual index offences in Germany, base rates were
higher when assessing offenders with mental disorders in Australia. Base rates were
generally lower for sexual recidivism compared to other types of recidivism. For
intimate partner violent, the country in which the study was conducted seemed to
affect the base rate. Despite comparable follow-up periods, study designs, and legal
recidivism statuses, the base rate in an Australian sample was higher than that
in a German sample (tables S2–S5 in the appendix).
Modelling of positive and negative predictive
value
Across risk assessment instruments and
base rate scenarios, positive predictive values varied between 6% and 64%. In the
low-base rate scenario, the ODARA and LSI-R demonstrated the highest positive
predictive values, with comparable values, while the VRAG showed a slightly lower
positive predictive value. The Static-99R had the lowest. In the high-base rate
scenario, the LSI-R and ODARA exhibited the highest positive predictive values,
with comparable values, while the Static-99R and VRAG showed lower, comparable positive
predictive values. Negative predictive values were relatively high and comparable
across risk assessment instrument and base rate scenarios, with one exception (table
3). In the high-base rate scenario, the negative predictive value of the LSI-R was
lower than that of the other risk assessment instruments.
A minority of individuals identified
as high risk for recidivism re-offended. The summary sensitivity, false
positive rate, and current base rates were highest for both general and intimate
partner violent recidivism. Specifically, between three and seven out of ten individuals
identified as high risk by the ODARA had a subsequent police registration for another
intimate partner violent offence. A comparable proportion of individuals identified
as high risk by the LSI-R were reconvicted within a three-year period. Summary sensitivity,
false positive rates, and current base rates were lowest for sexual recidivism,
with between 2 in 30 and 3 in 10 individuals identified as high risk being reconvicted
for a sexual offence. For violent recidivism, summary sensitivity, false
positive rate, and current base rates fell between those observed for general, intimate
partner violent, and sexual recidivism, with 2 to 3 in 10 high-risk individuals
being reconvicted for a violent offence (table 3).
Since positive predictive values are
influenced by base rates, as well as by sensitivity and specificity (1−false positive
rate), they also vary based on follow-up length, study population,
country, and the sensitivity/specificity of the risk assessment instruments. Therefore,
low base rates and low sensitivity resulted in low positive predictive values (as
seen in sexual recidivism), while higher base rates and higher sensitivity led to
higher positive predictive values (as observed in general and intimate partner
violent recidivism).
Discussion
In the current study, we examined the
predictive validity of four commonly used risk assessment instruments that were
developed for different offender populations. We modelled positive and negative
predictive value based on a systematic review and meta-analysis of different aspects
of the instruments’ discrimination combined with current base rates.
Our study had four main findings. First,
we found that the majority of the identified validation studies did not report the
necessary information for assessing validity beyond the area under the curve
(AUC). This finding is in line with prior research [16, 52, 53]. Consequently, many
studies could only be included in the systematic review and were excluded from the
meta-analysis.
Second, the median AUCs of all four risk
assessment instruments showed moderate discrimination (0.68–0.71), corresponding to
a medium effect size [54]. These findings are consistent with previous research
[14, 26, 28, 30]. However, AUCs alone have limited practical utility as they do
not inherently include any statement on the prospective prediction of adverse outcomes.
As Harris and Rice [55, p. 1638] have pointed out, “receiver operating
characteristic statistics are independent of base rates, but optimal decisions are
not”.
Third, while sensitivity varied by instrument,
it was rather high. The meta-analysis of sensitivity and false positive rates revealed
a high proportion of recidivists identified by the Ontario Domestic Assault
Risk Assessment (ODARA) and a high proportion of non-recidivists identified by the
Static-99R (sexual recidivism risk assessment instrument). This pattern can be partly
explained by the ODARA’s development as a screening instrument to be used by frontline
workers, thus aiming to maximise sensitivity. However, a high sensitivity does not
correspond to a high probability that an individual who scores highly on the instrument
will actually re-offend.
Fourth, the results of the meta-analysis
of sensitivity and false positive rates showed low positive predictive values, especially
for low-base rate scenarios and offence categories with low base rates, as was the
case for sexual recidivism. However, there were large variations in base rates between
scenarios, leading to a wide range of positive predictive values. Regarding violent
recidivism, the base rate reported in the Violence Risk Appraisal Guide (VRAG) construction
sample was higher than the maximum currently reported base rate, leading to an overestimation
of recidivism risk. This difference in base rates may be explained by the decline
in recidivism rates observed over the past decades. Overall, at low base rates,
high risk assessment instrument scores do not necessarily indicate a high risk of
recidivism, whereas low scores may well indicate a low risk of recidivism.
Implications for research and practice
Base rates are an important anchor for
forensic risk assessment but must be properly collected and reported. Fazel, Wolf,
and Yukhnenko [56] developed a standardised reporting checklist for this purpose.
In health research, the reporting standards
of diagnostic accuracy studies require 2 × 2 contingency tables of the results of
the index test and reference standard [57]. The standards further recommend providing
details on how these estimates were derived and how they should be interpreted [58].
Equivalent standards should be applied to studies examining the validity of risk
assessment instruments and should include reporting of the AUC with corresponding
measures (such as 95% CIs) for comparisons between samples, 2 × 2 contingency tables
with the results of the risk assessment instrument and actual recidivism, including
the cut-off scores, and base rates to enable the calculation of positive and negative
predictive value [5, 59, 60].
Risk assessments often form the basis
for criminal court decisions on sentence severity, including court-mandated treatments
aimed at reducing the recidivism risk. However, both mock jurors and professional
judges tend to overestimate risk, even when specific recidivism rates are provided
[61, 62]. As low base rates will lead to low positive predictive values, there is
a considerable threat of overestimating recidivism risk, which can have considerable
negative consequences for the individuals being assessed. This may, for example,
lead to a negative release decision [52]. Conversely, high negative predictive
values indicate that a large proportion of individuals assessed as low risk do not
re-offend [63]. Therefore, risk assessment instrument results can be particularly
useful in identifying low-risk offenders and excluding them from further assessment
[53, 64]. However, interpretation of expected recidivism rates is not recommended
given the poor calibration across different populations and settings. The result
of a risk assessment instrument can only be interpreted in relation to a reference
group of offenders by using percentiles or categorisation of relative risk levels,
such as below average, average, or above average [17, 65].
Given the far-fetching consequences of
the results of risk assessment instruments [52], forensic experts must appropriately
communicate recidivism risk in court [66]. The interpretation and communication
of the results of risk assessment instruments should be based on information regarding
practically useful performance indices, as it is provided by positive and negative
predictive values [52, 60, 63, 67, 68].
Limitations and future directions
Several limitations of this study are
worth mentioning. First, the Level of Service Inventory-Revised (LSI-R), VRAG, Static-99R,
and ODARA are only a representative selection of established risk assessment
instruments. Although it seems reasonable to assume that other instruments would
produce similar results [68], future research should extend the current findings
to other risk assessment instruments.
Second, the study findings have limited
generalisability. Most of the included studies were conducted in North America and
Western Europe. Due to a lack of information provided in the original studies on
measures of validity, we could only include a small proportion of the identified
studies in the meta-analysis. Furthermore, we did not contact the authors of the
studies to obtain missing information. Future research should use structured reporting
checklists such as STARD 2015 [57] to ensure complete reporting.
Third, identifying current base rates
for modelling positive and negative predictive values proved to be challenging.
For many countries, no information was available. Comparing countries is difficult
for several reasons, including variations in their legal systems [69–72]. Moreover,
base rates are not stable over time, across countries, or between offence categories.
Therefore, future research should update the present meta-analysis. In addition,
base rates are affected by interventions aimed at reducing recidivism [11, 69] and
an ageing prison population, which poses a fairly low recidivism risk [73]. Further
declines in base rates [10, 11] could exacerbate the implications of low positive
predictive values, leading to an overestimation of recidivism risk.
Fourth, sensitivity, specificity, positive
and negative predictive value depend on the chosen cut-off. All studies included
in the meta-analysis selected a clinically meaningful cut-off to identify high-risk
offenders. It is important to note, however, that a major limitation of this study
is that not all studies reported underlying cut-offs; even when reported, the cut-offs
differed between studies even for the same instrument, possibly due to differing
sample characteristics. Thus, it would be useful if future research on the validity
of risk assessment instruments reported the 2 × 2 contingency table of not only
a single cut-off, but also other possible and reasonable cut-offs [67]. This would
make findings more comparable and allow clinicians and criminal justice decision-makers
to choose between different cut-offs depending on the purpose of the risk assessment
(i.e., maximising positive or negative predictive value).
Fifth, up to half of the primary studies
had a higher risk of bias, which indicates that the reporting standards of studies
investigating the accuracy of risk assessment instruments might be questionable.
The cut-off we chose for a study to be of lower or higher risk was somewhat flexible
and based on a reasoned, though not rigid, criterion. If a stricter cut-off were
chosen, even more studies would have been classed as being of higher risk of bias.
Conclusion
In the present study, we modelled positive
and negative predictive value for four commonly used risk assessment instruments.
Collecting internationally comparable base rates proved challenging, and we showed
that primary studies on risk assessment instruments lack clinically relevant measures
of validity. Current base rates tend to be lower than the base rates in the construction
samples of the risk assessment instruments, leading to low positive predictive
values. Relying on the AUC alone as a measure of discrimination can lead to an overestimation
of recidivism risk, resulting in negative consequences for assessed individuals.
Risk communication based on the results of a risk assessment instrument must refer
to the positive predictive value as a clinically relevant measure for the prospective
prediction, and address its implications for the specific case. Due to the dynamic
nature of base rates, expected recidivism rates should be interpreted with caution;
percentile ranking should be the primary method of interpretation of risk
assessment instruments.
Data sharing statement
All data underlying the present research
is secondary data. Data and code used for this study are available on the Open Science
Framework (https://osf.io/jbgka/).
Acknowledgments
The
authors thank the developers of the included risk assessment instruments, Dr James
Bonta, Dr R. Karl Hanson, Dr N. Zoe Hilton, and Dr Vernon Quinsey, for information
regarding the proper use of their instruments, and Dr Bonta for critical feedback
on the study rationale. The authors thank Ulrike Günther for her support in testing
and refining the search strategy as well as the data extraction sheet, and Marcel
Thoma for his help in screening the search results. We also thank Dr Leonel C. Gonçalves
and Dr Stéphanie Baggio for contributing to the conceptualisation of the study.
Michael A. Weber
Canton of Zurich
Department of Justice and Home
Affairs
Corrections and
Rehabilitation, Research and Development
Hohlstrasse 552
CH-8090 Zurich
michael.weber[at]ji.zh.ch
References
1. Singh JP, Bjørkly S, Fazel S. International perspectives on violence risk assessment.
Oxford University Press; 2016.
2. Ægisdóttir S, White MJ, Spengler PM, Maugherman AS, Anderson LA, Cook RS, et al. The
meta-analysis of clinical judgment project: fifty-six years of accumulated research
on clinical versus statistical prediction. Couns Psychol. 2006;34(3):341–82.
3. Grove WM, Zald DH, Lebow BS, Snitz BE, Nelson C. Clinical versus mechanical prediction:
a meta-analysis. Psychol Assess. 2000 Mar;12(1):19–30.
4. Viljoen JL, Vargen LM, Cochrane DM, Jonnson MR, Goossens I, Monjazeb S. Do structured
risk assessments predict violent, any, and sexual offending better than unstructured
judgment? An umbrella review. Psychol Public Policy Law. 2021;27(1):79–97.
5. Singh JP. Predictive validity performance indicators in violence risk assessment:
a methodological primer. Behav Sci Law. 2013;31(1):8–22.
6. Babchishin KM, Helmus LM. The influence of base rates on correlations: an evaluation
of proposed alternative effect sizes with real-world data. Behav Res Methods. 2016 Sep;48(3):1021–31.
7. Milner JS, Campbell JC, Messing JT. Prediction issues for practitioners. In: Campbell JC,
Messing JT, editors. Assessing dangerousness: Domestic violence offenders and child
abusers. 3. Edition. New York (NY): Springer Publishing Company; 2017. pp. 33–54.
10.1891/9780826133274.0006
8. Leguízamo A, Lee SC, Jeglic EL, Calkins C. Utility of the Static-99 and Static-99R
With Latino Sex Offenders. Sex Abuse. 2017 Dec;29(8):765–85.
9. Rossegger A, Gerth J, Seewald K, Urbaniok F, Singh JP, Endrass J. Current obstacles
in replicating risk assessment findings: a systematic review of commonly used actuarial
instruments. Behav Sci Law. 2013;31(1):154–64.
10. Gelb A, Velázquez T. The changing state of recidivism: Fewer people going back to
prison. Philadelphia (PA): The Pew Charitable Trusts; 2018., Retrieved from https://www.pewtrusts.org/en/research-and-analysis/articles/2018/08/01/the-changing-state-of-recidivism-fewer-people-going-back-to-prison
11. Gonçalves LC, Baggio S, Weber M, Urwyler T, Noll T, Singh JP, et al. Recidivism in
Switzerland: the influence of custodial sanctions. Swiss Med Wkly. 2021 Apr;151(1112):w20462.
12. Van Dijk J, Tseloni A, Farrell G. The international crime drop: New directions in
research. New York (NY): Palgrave Macmillan; 2012.
13. Page MJ, McKenzie JE, Bossuyt PM, Boutron I, Hoffmann TC, Mulrow CD, et al. The PRISMA
2020 statement: an updated guideline for reporting systematic reviews. BMJ. 2021 Mar;372(372):n71.
14. Olver ME, Stockdale KC, Wormith JS. Thirty years of research on the level of service
scales: a meta-analytic examination of predictive accuracy and sources of variability.
Psychol Assess. 2014 Mar;26(1):156–76.
15. van Der Put CE, Gubbels J, Assink M. Predicting domestic violence: A meta-analysis
on the predictive validity of risk assessment tools. Aggress Violent Behav. 2019;47:100–16.
10.1016/j.avb.2019.03.008
16. Singh JP, Grann M, Fazel S. A comparative study of violence risk assessment tools:
a systematic review and metaregression analysis of 68 studies involving 25,980 participants.
Clin Psychol Rev. 2011 Apr;31(3):499–513.
17. Helmus LM, Kelley SM, Frazier A, Fernandez YM, Lee SC, Rettenberger M, et al. Static-99R:
Strengths, limitations, predictive accuracy meta-analysis, and legal admissibility
review. Psychol Public Policy Law. 2022;28(3):307–31. 10.1037/law0000351
18. Andrews D, Bonta J. LSI-R: The Level of Service Inventory-Revised. Toronto (ON): Multi-Health
Systems; 1995.
19. Quinsey VL, Harris GT, Rice ME, Cormier CA. Violent offenders: Appraising and managing
risk. Washington (DC): American Psychological Association; 2006. 10.1037/11367-000
20. Helmus L, Thornton D, Hanson RK, Babchishin KM. Improving the predictive accuracy
of Static-99 and Static-2002 with older sex offenders: revised age weights. Sex Abuse.
2012 Feb;24(1):64–101.
21. Hilton NZ, Harris GT, Rice ME, Lang C, Cormier CA, Lines KJ. A brief actuarial assessment
for the prediction of wife assault recidivism: the Ontario domestic assault risk assessment.
Psychol Assess. 2004 Sep;16(3):267–75.
22. Ahmed S, Lee SC, Helmus LM. Predictive accuracy of Static-99R across different racial/ethnic
groups: A meta-analysis. Law Hum Behav. 2023 Feb;47(1):275–91.
23. Babchishin KM, Blais J, Helmus L. Do static risk factors predict differently for Aboriginal
sex offenders? A multi-site comparison using the original and revised static-99 and
static-2002 scales. Can J Criminol Crim Justice. 2012;54(1):1–43. 10.3138/cjccj.2010.E.40
24. Babchishin KM, Hanson RK, Helmus L. Even highly correlated measures can add incrementally
to predicting recidivism among sex offenders. Assessment. 2012 Dec;19(4):442–61.
25. Helmus L, Thornton D. The MATS-1 risk assessment scale: summary of methodological
concerns and an empirical validation. Sex Abuse. 2016 Apr;28(3):160–86.
26. Helmus LM, Hanson RK, Murrie DC, Zabarauckas CL. Field validity of Static-99R and
STABLE-2007 with 4,433 men serving sentences for sexual offences in British Columbia:
new findings and meta-analysis. Psychol Assess. 2021 Jul;33(7):581–95.
27. Lee SC, Hanson RK. Similar predictive accuracy of the Static-99R risk tool for White,
Black, and Hispanic sex offenders in California. Crim Justice Behav. 2017;44(9):1125–40.
10.1177/0093854817711477
28. Lee SC, Hanson RK. Updated 5-year and new 10-year sexual recidivism rate norms for
Static-99R with routine/complete samples. Law Hum Behav. 2021 Feb;45(1):24–38.
29. McGrath RJ, Lasher MP, Cumming GF, Langton CM, Hoke SE. Development of Vermont assessment
of sex offender risk-2 (VASOR-2) reoffense risk scale. Sex Abuse. 2014 Jun;26(3):271–90.
30. Messing JT, Thaller J. The average predictive validity of intimate partner violence
risk assessment instruments. J Interpers Violence. 2013 May;28(7):1537–58.
31. Nicholls TL, Pritchard MM, Reeves KA, Hilterman E. Risk assessment in intimate partner
violence: A systematic review of contemporary approaches. Partn Abus. 2013;4(1):76–168.
10.1891/1946-6560.4.1.76
32. The EndNote Team. EndNote 20. Philadelphia (PA): Clarivate; 2020.
33. Edens JF, Boccaccini MT. Taking forensic mental health assessment “out of the lab”
and into “the real world”: introduction to the special issue on the field utility
of forensic assessment instruments and procedures. Psychol Assess. 2017 Jun;29(6):599–610.
34. Campbell JM, Klugar M, Ding S, Carmody DP, Hakonsen SJ, Jadotte YT, et al. Diagnostic
test accuracy: methods for systematic review and meta-analysis. Int J Evid-Based Healthc.
2015 Sep;13(3):154–62.
35. Whiting PF, Rutjes AW, Westwood ME, Mallett S, Deeks JJ, Reitsma JB, et al.; QUADAS-2
Group. QUADAS-2: a revised tool for the quality assessment of diagnostic accuracy
studies. Ann Intern Med. 2011 Oct;155(8):529–36.
36. Doebler P. mada: Meta-Analysis of Diagnostic Accuracy. R package version 0.5.10: https://CRAN.R-project.org/package=mada; 2020.
37. Gatsonis C, Paliwal P. Meta-analysis of diagnostic and screening test accuracy evaluations:
methodologic primer. AJR Am J Roentgenol. 2006 Aug;187(2):271–81.
38. Harbord RM, Whiting P, Sterne JA, Egger M, Deeks JJ, Shang A, et al. An empirical
comparison of methods for meta-analysis of diagnostic accuracy showed hierarchical
models are necessary. J Clin Epidemiol. 2008 Nov;61(11):1095–103.
39. Glas AS, Lijmer JG, Prins MH, Bonsel GJ, Bossuyt PM. The diagnostic odds ratio: a
single indicator of test performance. J Clin Epidemiol. 2003 Nov;56(11):1129–35.
40. Reitsma JB, Glas AS, Rutjes AW, Scholten RJ, Bossuyt PM, Zwinderman AH. Bivariate
analysis of sensitivity and specificity produces informative summary measures in diagnostic
reviews. J Clin Epidemiol. 2005 Oct;58(10):982–90.
41. Gordon M, Lumley T. forestplot: Advanced Forest Plot Using 'grid' Graphics. 2021.
R package version 2.0.1: https://CRAN.R-project.org/package=forestplot
42. R Core Team. R: A language and environment for statistical computing. Vienna: R Foundation
for Statistical Computing. https://www.R-project.org/; 2022.
43. Dahle KP, Schmidt S. Prognostische validität des level of service inventory-revised:
Vergleichende analyse bei jungen gewaltstraftätern mit migrationshintergrund aus einem
muslimisch geprägten kulturkreis und einheimischen tätern = Predictive validity of
the level of service inventory-revised: Comparative study of violent juvenile offenders
with a migrant background from a predominantly Muslim cultural background and native
German offenders. Forens Psychiatr Psychol Kriminol. 2014;8(2):104–15. 10.1007/s11757-014-0256-5
44. Manchak SM, Skeem JL, Douglas KS, Siranosian M. Does gender moderate the predictive
utility of the Level of Service Inventory—Revised (LSI-R) for serious violent offenders? Crim
Justice Behav. 2009;36(5):425–42. 10.1177/0093854809333058
45. Sowden JN, Olver ME. Use of the Violence Risk Scale-Sexual Offender Version and the
Stable 2007 to assess dynamic sexual violence risk in a sample of treated sexual offenders.
Psychol Assess. 2017 Mar;29(3):293–303.
46. Hanson RK, Lunetta A, Phenix A, Neeley J, Epperson D. The field validity of Static-99/R
sex offender risk assessment tool in California. J Threat Assess Manag. 2014;1(2):102–17.
10.1037/tam0000014
47. Jung S, Himmen MK, Velupillai N, Buro K. Does stalking behavior improve risk prediction
of intimate partner violence? Vict Offender; 2021. pp. 1–18. 10.1080/15564886.2021.1963899
48. Seewald K, Rossegger A, Urbaniok F, Endrass J. Assessing the risk of intimate partner
violence: Expert evaluations versus the Ontario Domestic Assault Risk Assessment.
J Forensic Psychol Res Pract. 2017;17(4):217–31. 10.1080/24732850.2017.1326268
49. van Heesch B, Jeandarme I, Pouls C, Vervaeke G. Validity and reliability of the VRAG
in a forensic psychiatric medium security population in Flanders. Psychol Crime Law.
2016;22(6):530–7. 10.1080/1068316X.2016.1168423
50. Fitzgerald S, Gray NS, Alexander RT, Bagshaw R, Chesterman P, Huckle P, et al. Predicting
institutional violence in offenders with intellectual disabilities: the predictive
efficacy of the VRAG and the HCR-20. J Appl Res Intellect Disabil. 2013 Sep;26(5):384–93.
51. Harris GT, Rice ME, Quinsey VL. Violent recidivism of mentally disordered offenders:
the development of a statistical prediction instrument. Crim Justice Behav. 1993;20(4):315–35.
52. Fazel S, Burghart M, Fanshawe T, Gil SD, Monahan J, Yu R. The predictive performance
of criminal risk assessment tools used at sentencing: systematic review of validation
studies. J Crim Justice. 2022;81:101902.
53. Fazel S, Singh JP, Doll H, Grann M. Use of risk assessment instruments to predict
violence and antisocial behaviour in 73 samples involving 24 827 people: systematic
review and meta-analysis. BMJ. 2012 Jul;345:e4692.
54. Rice ME, Harris GT. Comparing effect sizes in follow-up studies: ROC Area, Cohen’s
d, and r. Law Hum Behav. 2005 Oct;29(5):615–20.
55. Harris GT, Rice ME. Characterizing the value of actuarial violence risk assessments.
Crim Justice Behav. 2007;34(12):1638–58. 10.1177/0093854807307029
56. Fazel S, Wolf A, Yukhnenko D. Recidivism reporting checklist: Open Science Framework.
Retrieved from https://osf.io/qvtfb/; 2019.
57. Bossuyt PM, Reitsma JB, Bruns DE, Gatsonis CA, Glasziou PP, Irwig L, et al.; STARD
Group. STARD 2015: an updated list of essential items for reporting diagnostic accuracy
studies. Radiology. 2015 Dec;277(3):826–32.
58. Trevethan R. Sensitivity, Specificity, and Predictive Values: Foundations, Pliabilities,
and Pitfalls in Research and Practice. Front Public Health. 2017 Nov;5:307.
59. Mills JF, Kroner DG. The effect of base-rate information on the perception of risk
for reoffense. Am J Forensic Psychol. 2006;24(3):45–56.
60. Fazel S, Bjørkly S. Methodological considerations in risk assessment research. In:
Singh JP, Bjørkly S, Fazel S, editors. International perspectives on violence risk
assessment. New York (NY): Oxford University Press; 2016. pp. 16–25.
61. Batastini AB, Hoeffner CE, Vitacco MJ, Morgan RD, Coaker LC, Lester ME. Does the format
of the message affect what is heard? A two-part study on the communication of violence
risk assessment data. J Forensic Psychol Res Pract. 2019;19(1):44–71.
62. Ellman IM, Ellman T. Frightening and high: the Supreme Court’s crucial mistake about
sex crime statistics. Const Comment. 2015;30:495–508. Available from: https://scholarship.law.umn.edu/concomm/419/
63. Eher R, Olver ME, Heurix I, Schilling F, Rettenberger M. Predicting reoffense in pedophilic
child molesters by clinical diagnoses and risk assessment. Law Hum Behav. 2015 Dec;39(6):571–80.
64. Cartwright JK. Assessment and measurement of violence in adults with mental illness.
Raleigh (NC): North Carolina State University; 2018.
65. Hanson RK, Babchishin KM, Helmus LM, Thornton D, Phenix A. Communicating the results
of criterion referenced prediction measures: risk categories for the Static-99R and
Static-2002R sexual offender risk assessment tools. Psychol Assess. 2017 May;29(5):582–97.
66. Helmus LM. Sex offender risk assessment: where are we and where are we going? Curr
Psychiatry Rep. 2018 May;20(6):46.
67. Neller DJ, Frederick RI. Classification accuracy of actuarial risk assessment instruments.
Behav Sci Law. 2013;31(1):141–53.
68. Kroner DG, Hanson RK. Measuring what matters: Standardized risk levels for criminal
recidivism risk. In: Liell G, Fisher M, Jones L, editors. Challenging bias in forensic
psychological assessment and testing - Theoretical and practical approaches to working
with diverse populations. London, UK: Routledge; 2023. pp. 95–110. 10.4324/9781003230977
69. Gannon TA, Olver ME, Mallion JS, James M. Does specialized psychological treatment
for offending reduce recidivism? A meta-analysis examining staff and program variables
as predictors of treatment effectiveness. Clin Psychol Rev. 2019 Nov;73:101752.
70. UNODC. Prison Research - a pilot study on the causes of recidivism in Albania, Czechia
and Thailand. Vienna: United Nations Office on Drugs and Crime; 2022.
71. Yukhnenko D, Sridhar S, Fazel S. A systematic review of criminal recidivism rates
worldwide: 3-year update. Wellcome Open Res. 2020 Nov;4:28.
72. Scurich N, John RS. The dark figure of sexual recidivism. Behav Sci Law. 2019 Mar;37(2):158–75.
73. Psick Z, Simon J, Brown R, Ahalt C. Older and incarcerated: policy implications of
aging prison populations. Int J Prison Health. 2017 Mar;13(1):57–63.
Appendix
The appendix is available in the pdf version of the article at https://doi.org/10.57187/s.3517.