Influenza transmission
dynamics quantified from RNA in wastewater in Switzerland
DOI: https://doi.org/https://doi.org/10.57187/s.3503
Sarah Nadeauab,
Alexander J. Devauxc,
Claudia Baguttid,
Monica Altd,
Evelyn Ilg Hamped,
Melanie Krause,
Eva Würfele,
Katrin N. Kochf,
Simon Fuchse,
Sarah Tschudin-Sutterg,
Aurélie Holschneiderc,
Christoph Ortc,
Chaoran Chenab,
Jana S. Huismanab,
Timothy R. Julianc,
Tanja Stadlerab
a Department of Biosystems Science and
Engineering, ETH Zurich, Basel, Switzerland
b Swiss Institute of Bioinformatics, Lausanne,
Switzerland
c Department of Environmental Microbiology,
EAWAG, Dübendorf, Switzerland
d State Laboratory of Basel-Stadt, Basel,
Switzerland
e Department of Health, Canton of
Basel-Stadt, Basel, Switzerland
f Cantonal Office of Public Health,
Department of Economics and Health, Canton of Basel-Landschaft, Liestal,
Switzerland
g Division of Infectious Diseases and
Hospital Epidemiology, University Hospital Basel and University of Basel, Basel,
Switzerland
Summary
INTRODUCTION:
Influenza infections are challenging to monitor at the population level due to many
mild and asymptomatic cases and similar symptoms to other common
circulating respiratory diseases, including COVID-19. Methods for tracking
cases outside of typical reporting infrastructure could improve monitoring of influenza
transmission dynamics. Influenza shedding into wastewater represents
a promising source of information where quantification is unbiased by testing
or treatment-seeking behaviours.
METHODS: We quantified influenza A and B virus loads from influent at Switzerland’s
three largest wastewater treatment plants, serving about 14% of the Swiss
population (1.2 million individuals). We estimated trends in infection
incidence and the effective reproductive number (Re) in these
catchments during a 2021/22 epidemic and compared our estimates to typical
influenza surveillance data.
RESULTS: Wastewater data captured the same overall trends in infection
incidence as laboratory-confirmed case data at the catchment level. However, the
wastewater data were more sensitive in capturing a transient peak in incidence
in December 2021 than the case data. The Re estimated from the wastewater
data was roughly at or below the epidemic threshold of 1 during work-from-home
measures in December 2021 but increased to at or above the epidemic threshold
in two of the three catchments after the relaxation of these measures. The
third catchment yielded qualitatively the same results but with wider
confidence intervals. The confirmed case data at the catchment level yielded comparatively
less precise R_e estimates before and during the work-from-home period, with confidence
intervals that included one before and during the work-from-home
period.
DISCUSSION: Overall, we show that influenza RNA in wastewater can help monitor
nationwide influenza transmission dynamics. Based on this research, we
developed an online dashboard for ongoing wastewater-based influenza
surveillance in Switzerland.
Introduction
Detection and monitoring of influenza
outbreaks are crucial but challenging tasks. Reporting systems for
influenza-like illness and laboratory-confirmed influenza infections are used
to monitor temporal trends in influenza transmission [1]; to estimate the
number of symptomatic cases, hospitalizations, and deaths due to influenza [2];
and to help hospitals and public health officials plan vaccination campaigns
and allocate treatment resources [3]. For example, doctors may prescribe
influenza-specific treatment based on knowledge of an ongoing influenza
outbreak in the region and a symptomatic diagnosis before waiting for
laboratory confirmation [4], underscoring the public health relevance of
accurate detection and monitoring of influenza outbreaks.
The coronavirus disease 2019 (COVID-19)
pandemic has severely impacted existing influenza surveillance systems based on
clinical/syndromic data. First, COVID-19 and influenza share many symptoms,
complicating symptom-based influenza diagnosis [5]. Test-seeking behaviour also
changed during the pandemic, reportedly increasing compared to pre-pandemic in
the U.S. [2]. Finally, pandemic-related public health measures and associated behavioural
changes have disrupted typical seasonal influenza transmission dynamics [6–7]. Therefore,
pandemic-related changes have simultaneously changed influenza transmission
dynamics and decreased the reliability of ongoing influenza surveillance efforts.
Consequently, many influenza surveillance reports include COVID-19-related
disclaimers about the representativeness and interpretability of the data [2, 8,
9]. In summary, the emergence of COVID-19 as a new endemic disease necessitates
adjustments to existing influenza surveillance programs moving forward.
Wastewater surveillance represents a
promising alternative method for pathogen surveillance that is independent of
testing behaviour, can indicate the relative incidence of pathogens responsible
for influenza-like illnesses, and can capture unreported cases [10]. Infected
individuals shed many pathogens via their stool and sputum and/or from their
skin, depending on the pathogen. Therefore, pathogen particles can enter the
wastewater when infected individuals use the toilet, brush their teeth, or
shower. Previous studies have shown that various pathogens are detectable in
wastewater samples [11–12]. In regions where household wastewater is centrally
collected, wastewater represents a pooled community sample, and wastewater
pathogen loads indicate community disease burden. The idea of wastewater-based
epidemiology is not new but has recently experienced a surge in popularity,
with many communities developing detection and monitoring strategies for severe
acute respiratory syndrome coronavirus 2 (SARS-CoV-2) in wastewater [13].
Wastewater-based surveillance offers the
opportunity to better understand influenza dynamics, similar to its role in
understanding COVID-19 dynamics. Wolfe et al. [14] established that influenza A
virus (IAV) particles in wastewater correlated well with incidence rates from
two well-characterized outbreaks on U.S. university campuses. Mercier et al.
[15] similarly quantified IAV particles in wastewater at the municipality scale
in Ottawa, Canada. They established that IAV concentrations in wastewater correlated
well with municipal surveillance data when lagged 17 days, meaning wastewater was
an early indicator of transmission dynamics in this system. They also extended wastewater
surveillance by sub-typing the detected IAV. Most recently, Boehm et al. [7]
developed a multiplexed method to quantify influenza A and B alongside several
other respiratory viruses in wastewater. They confirmed that IAV concentrations
in wastewater at the municipal level were associated with laboratory-confirmed
cases at the state level. Influenza B virus (IBV) concentrations were low and
frequently undetectable. These previous studies indicate that IAV is detectable
in wastewater and can be used to study transmission dynamics in the community.
In this study, we aimed to implement
wastewater surveillance for influenza at the national level in Switzerland and
estimate influenza A and influenza B virus transmission dynamics from
wastewater. We measured the concentrations of seasonal influenza types A and B
at Switzerland’s three largest wastewater treatment facilities, which together serve
approximately 14% of the Swiss population (1.2 million individuals), from
December 2021 to April 2022. Following a previously established method, we
deconvoluted wastewater influenza loads to estimate trends in infection
incidence and the effective reproductive number (Re). We compared
the wastewater-based results with laboratory-confirmed infection incidence in
each catchment area. We have continued to measure influenza A and influenza B
virus concentrations in these catchments since October 2022. The results
presented here, and the results of our ongoing monitoring efforts, are
available on an online dashboard at https://wise.ethz.ch/influenza/. All the
analysis and dashboard code is open-source. We anticipate that these results
and resources will help inform public health officials and hospitals about the
onset and intensity of future influenza seasons.
Methods
Quantifying influenza
RNA in wastewater
Twenty-four-hour flow-composite samples
from raw influent wastewater were collected at Swiss wastewater treatment
facilities in Zurich (ARA Werdhölzli), Geneva (STEP Aïre), and Basel (ProRheno
AG). Twice on weekends, 48-hour flow-composite samples were taken in Basel
rather than the regular 24-hour samples. The respective catchment areas for
these facilities are shown in figure 1. Mean hydraulic residence times are 1
hour in the Zurich catchment and 1.5 hours in the Basel catchment. Residence
time is unknown for the Geneva catchment but is expected to be similar to
Zurich and Basel. Travel distances to the treatment facilities are also similar
(0.2–15 km for Zurich, 0.5–11 km for Basel, and 0.1–19.1 km for Geneva) [16].

Figure 1Catchment area map. Coloured areas show the catchment
areas of the three wastewater treatment facilities where influenza A and B
virus loads were measured. The Basel facility serves several communities in
France (Neuwiller) and Germany (Weil-Otterbach and Inzlingen) that are not
shown. The community of Brüglingen in Münchenstein, served by the Basel
facility, is also not shown.
For the Zurich and Geneva facilities, total
nucleic acid was extracted from 40 ml of wastewater using a modified version of
the Wizard® Enviro Total Nucleic Acid Kit (Promega Corporation, Madison, WI, USA).
Nucleic acids were eluted in 80 µl of RNAse/DNAse-free water and further
purified using a OneStep PCR Inhibitor Removal Kit (Zymo Research, Irvine, CA,
USA). Nucleic acid extracts were stored at –80°C for up to a year before
analysis. For the Basel facility,samples were stored at 4°C for up to
72 hours before further processing. Total nucleic acids were concentrated and
extracted from 40 ml of wastewater using the Maxwell® RSC Environ Wastewater
TNA Kit (Promega Corporation). Nucleic acid extracts were stored at –20°C for
up to two weeks and at –80°C for up to a year before analysis.
All samples were collected within the scope
of ongoing wastewater-based SARS-CoV-2 surveillance projects [17–18]. We retrospectively
quantified influenza A and influenza B viruses from stored RNA extracts for this
study. For the Zurich and Geneva samples, IAV and IBV were quantified using
digital reverse transcription polymerase chain reactions (RT-dPCR) with 5.4 μl of
wastewater RNA extract. The RT-dPCR procedure is described in the Supplemental Methods.
At least two replicate aliquots from, on average, two samples per week were
analyzed. For the Basel facility,IAV and IBV were quantified using a
triplex one-step quantitative reverse transcription polymerase chain reactions
(RT-qPCR) with 5 μl of wastewater RNA extract and the GoTaq® Enviro FluA/FluB
/SARS-CoV-2 System (Promega Corporation) according to the protocol provided in
the manual. Single aliquots from, on average, two samples per week were
analyzed. After quantification, we converted the IAV and IBV concentrations in
genome copies per mL to daily pathogen loads (genome copies per day) by
multiplying the concentration measurements by the total inflow to the
respective wastewater treatment facility on the sample date.
Estimating trends in influenza incidence and Re
from wastewater
We used our previously developed approach
to estimate trends in infection incidence and the effective reproductive number
from pathogen RNA in wastewater [19]. The actual estimation was done using the
estimateR package for the R statistical software [20], which implements the Re
estimation method of Cori et al. [21]. Re is the expected number of
secondary infections caused by a single infectious individual at a specific time.
This metric is commonly used for monitoring disease transmission dynamics,
particularly because there is an easily interpretable epidemic threshold at Re
= 1 that indicates whether an outbreak is expected to grow (Re >1) or decline (Re <1). Re estimates also put
wastewater- and case-based metrics on a common scale. Re can vary over
time according to population immunity, infection control measures, and behavioural
changes.
First, we scaled the wastewater load data
by the treatment plant-specific minimum detected load (1.6 × 10¹¹
for Zurich, 1.1 × 10¹¹ for Geneva, and 3 × 10⁹
for Basel), which assumes that the minimum detected load represents one
infected individual. Such an assumption is necessary to make the range of
wastewater measurements comparable to the incidence in an outbreak since the
deconvolution method used is optimized for case data and does not perform well
when inputs are orders of magnitude higher (as with wastewater loads) [19]. As
a sensitivity analysis, we also attempted using 10× and 100× scaling
(i.e. the minimum detected viral load corresponds to 10 or 100 infected individuals
in the catchment rather than 1).
Next, we performed linear interpolation to
generate a regular daily time series of measurements. We chose linear
interpolation because cubic spline interpolation produced spurious lows due to
day-to-day oscillations in the wastewater measurements. We also used locally
estimated scatterplot smoothing (LOESS) to smooth the time series. Briefly, locally
estimated scatterplot smoothing generates a smooth curve by combining
polynomial regression models fit to localized subsets of the data. By
interpolating and smoothing, we implicitly assume that true influenza incidence
in a catchment does not change greatly day-to-day and that temporal noise in
wastewater measurements comes from other factors such as variation in
laboratory processing and detection methods, differing residence time in the
sewers depending on the source, biofilm sloughing, or stochastic noise
associated with temporally varying inputs [22–23].
We estimated Re from the
interpolated, smoothed wastewater measurements using the
“get_block_bootstrapped_estimate” function in R’s estimateR package [20]. This
function estimates Re in two steps. The first step back estimates
infection incidence from observations (in our case, wastewater RNA load
measurements) via deconvolution using a distribution that characterizes delays
from infection to observation. Following Huisman et al. [19], we used a
pathogen-shedding load distribution, which characterizes how individuals shed
virus particles into wastewater over the course of their infections. The second
step estimates Re from deconvoluted infection incidence using the
method of Cori et al. [21]. This method requires assuming a distribution for
how infectious individuals are over the course of their infections, which in
practice is approximated by a serial interval distribution. The Re
inference procedure assumes that the serial interval, the pathogen shedding
load distribution, and the ascertainment probability for an influenza RNA
molecule in wastewater do not vary through time.
For the main results, we assume a gamma
shedding load distribution with a mean of 2.5 days and a standard deviation of
1 day (empirical median: 2.4 days) based on virus load measured in respiratory
samples [24] (see the Supplemental Methods for details). As a sensitivity
analysis, we also attempted a gamma distribution based on virus load measured
in faecal samples [25–26], with a mean of 12.2 days and a standard deviation of
7.6 days (empirical median: 10.7 days). The distributions’ fit to viral load
data are shown in figure S1. Delays inside the sewer system to reach the
wastewater sample collection point were assumed to be negligible. For the Re
estimation step, we assumed influenza cases had a serial interval with a mean of
2.6 days and a standard deviation of 1.5 days based on Ferguson et al. [27].
Uncertainty in the infection incidence
deconvolution was accounted for by performing 500 block-bootstrap replicates of
the measurement error, as described in Huisman et al. [19]. Uncertainty in the
Re estimation, which is reported as the 95% credible interval for Re,
was combined with the uncertainty across the bootstrap replicates for infection
incidence, which is reported as the 95% bootstrap confidence interval (the estimateR
option “combine_bootstrap_and_estimation_uncertainties”). We accounted for both
estimate and measurement uncertainty by using the union of the highest of each
type of uncertainty.
Comparison to other
influenza surveillance data
The Federal Office of Public Health (FOPH)
collects data on influenza cases in Switzerland in two ways. First, general
practitioners participating in the sentinel system “Sentinella” report the
number of consultations for influenza-like illness, a syndromic diagnosis, each
week. Swabs from a selection of these influenza-like illness cases are tested
for influenza. Second, diagnostic laboratories must report any
laboratory-confirmed case of influenza to the Federal Office of Public Health,
regardless of patient symptoms or whether the practitioner participates in the
Sentinella system [8].
To access the Sentinella data, we
downloaded national influenza-like illness incidence from the Federal Office of
Public Health’s influenza website [8]. The weekly influenza positivity rate
among tested swabs from influenza-like illness cases was estimated by
digitizing figure 4 from the 2021/22 Sentinella report [28] using the online
tool https://automeris.io/WebPlotDigitizer/.
We corrected influenza-like illness incidence for the time-varying positivity
rate by multiplying each week’s influenza-like illness incidence by the
estimated positivity rate for that week. Next, we received the number of
laboratory-confirmed influenza cases (“confirmed cases”) reported by
diagnostics laboratories to the Federal Office of Public Health. We only
received laboratory-confirmed cases from postal codes in the catchment areas of studied
wastewater treatment plants. The Federal Office of Public Health
provided these data stratified by week, influenza type, and postal code from 24
August 2021. Some of the postal codes are only partially served by the studied
wastewater treatment plants. Therefore, we scaled the number of cases from
these postal codes by the fraction of the total postal code area included in
the wastewater treatment plant’s catchment area based on delineating the
catchment boundaries. This approach assumes cases were uniformly distributed
across the postal code’s geographic area. We directly compared the wastewater
data to the resulting number of laboratory-confirmed cases per catchment area.
We note that confirmed cases were also reported outside of our study period; in
this article, we only consider data from 1 December 2021 to 30 April 2022.
We calculated Re estimates from
the catchment-level confirmed case data using the same procedure as for the
wastewater data, except that cubic spline (rather than linear) interpolation was
used to estimate daily cases from the weekly reported data using the
“cubicspline” function from R’s pracma package [29]. We also used a delay
distribution based on a timeline of symptom severity rather than viral shedding
based on the assumption that the probability of an individual consulting a
doctor or seeking a test is associated with their symptom severity, with most
individuals getting tested on the day of their peak symptoms. We generated this
distribution by fitting a gamma distribution to data from Carrat et al. [24],
resulting in a distribution with a mean of 4.5 days from infection and a
standard deviation of 0.8 days (empirical median: 3.4 days; see the supplemental
methods and figure S1 in the appendix).
Results
During the period from 1 December 2021 to
30 April 2022, we detected influenza A virus particles in the wastewater on
more than 90% of sampled days: influenza A virus was detected on 37/38 days
from Zurich, 39/42 days from Geneva, and 45/50 days from Basel. The influenza B
virus was detected less often in wastewater: influenza B virus was detected on
7/35 days from Zurich, 9/33 days from Geneva, and 1/50 days from Basel (figure
2 and figure S2 in the appendix). The wastewater load data and confirmed case
data by catchment area suggest one or more IAV outbreak peaks in each catchment
(figure 2A). However, the wastewater and confirmed case data only robustly
supported an IAV peak occurring roughly between March and May 2022 across all
three catchments. Combining the confirmed case data across all postal codes for
which we received this data shows a smaller peak in cases around January 2022,
but the March-May 2022 peak dominates (figure S3 in the appendix). The national
influenza-like illness data had three atypical peaks across the 2021/22 season
(figure 2B). For comparison, influenza-like illness incidence during the entire
2021/22 season was much lower than in pre-COVID-19 pandemic Swiss influenza
seasons [28]. Only the peak in March-May 2022 remained when the influenza-like
illness data was adjusted for influenza positivity over time (figure 2B).
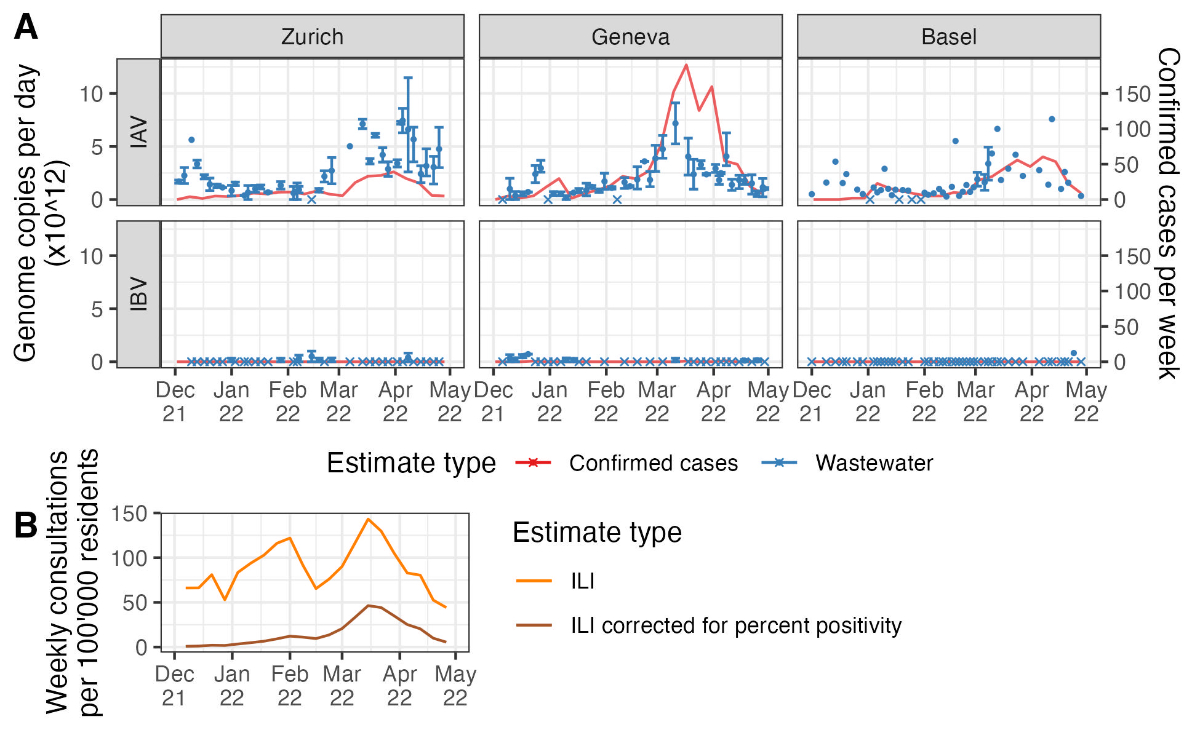
Figure 2Influenza measurements from
wastewater versus typical surveillance data. (A) The two data sources
used to estimate Re. Wastewater measurements (in blue) are shown as
the mean (points) and range (error bars) of measurements across aliquots from
each sampled day. Days on which no aliquots had detectable virus are shown with
crossed rather than round points. Note that wastewater quantification methods
differed between the Zurich and Geneva catchments and the Basel catchment.
Laboratory-confirmed cases (in red) are shown as a line connecting weekly reported
cases within the catchment. (B) The weekly national incidence of
influenza-like illness (ILI; in orange) and the same values corrected for
weekly percent influenza positivity among tested influenza-like illness swabs
(in brown).
We could compare catchment-specific
influenza outbreak dynamics based on wastewater data and laboratory-confirmed
case data by deconvolving both the wastewater loads and case data at the
catchment level to estimate trends in infection incidence. We could align
incidence estimates on a comparable time scale by applying the appropriate
delay distribution to each data type (figure 3). There were two notable points
in this analysis. First, the magnitude of wastewater-based infection incidence
estimates was sensitive to the scaling of wastewater loads. Our scaling based
on the assumption that the minimum detected load corresponds to a single
infected individual should be conservative, meaning infection incidence is likely
higher than reported here, because we assume the minimum correspondence between
wastewater loads and infections in the catchment (a single infected
individual). Second, since there were very few laboratory-confirmed cases of influenza
B virus during the study period, we only show case-based results for influenza
A virus. There were six confirmed IBV cases in the Geneva catchment and none in
the Zurich or Basel catchments. In comparison, there were 965 confirmed IAV cases
in the Geneva catchment, 359 in the Basel catchment, and 255 in the Zurich
catchment (figure S3 in the appendix). Similarly, we do not report results for
IBV in Basel wastewater since it was only detected on one day.

Figure 3Trends in infection incidence.
Infection incidence estimates are based on a deconvolution from wastewater
influenza measurements (blue) or laboratory-confirmed influenza A cases in each
catchment (red). Coloured bands show the 95% bootstrap confidence interval for
each estimate. Note that the magnitude of wastewater-based estimates is
sensitive to the scaling of wastewater loads and that true incidence is likely
higher than shown here (see the main text). Influenza B case numbers were too
low to run the estimateR pipeline on. Shaded areas show when work-from-home
measures were in place, and dashed lines show the start and end dates of
stronger measures to limit gathering sizes and require COVID-19 certificates
and masks in more situations to combat the Omicron variant of SARS-CoV-2 (see table
1).IAV: influenza A virus; IBA: influenza B virus.
The estimated trends in infection incidence
derived from the wastewater data show strong evidence of an influenza A virus
outbreak in Zurich, Geneva, and Basel in December 2021; this outbreak was not
robustly observed in the confirmed case data (figure 3). The same trend is also
evident in the raw wastewater load data (figure 2). This outbreak observed in
wastewater appears to have peaked around the same time measures were introduced
to reduce population mobility and contacts in Switzerland to combat the spread
of the Omicron variant of SARS-CoV-2 (table 1). Around the time measures were
lifted (first half of February), wastewater-based estimates indicate that influenza
A virus incidence again increased in all three catchments. Confirmed influenza
A virus infections also increased during this period.
Table 1The selected measures used to
combat the Omicron variant of SARS-CoV-2 in Switzerland. The table only shows
the major measures used to reduce population mobility and contacts; a complete
list of measures is available on the Federal Office of Public Health website
[30].
| Start date |
End date |
Measure |
Source |
| 6 Dec 2021 |
17 Feb 2022 |
Work-from-home recommendation. |
Federal Office of Public Health [30]; Swissinfo.ch https://paperpile.com/c/L6CLav/VI2V+RBD3[31] |
| 20 Dec 2021 |
3 Feb 2022 |
Work-from-home mandate. |
Federal Office of Public Health [30] |
| 20 Dec 2021 |
17 Feb 2022 |
Gathering size was limited; COVID
certificates and masks were required in more situations. |
Swissinfo.ch https://paperpile.com/c/L6CLav/RBD3[31] |
| 17 Feb 2022 |
30 Mar 2022 |
None except isolation of individuals with
a positive test and masks in public transit and health care settings. |
Swiss Federal Council [32] |
Influenza B virus incidence was estimated
to be much lower than influenza A virus incidence in the Zurich and Geneva
catchments, consistent with the many fewer confirmed IBV cases than IAV cases
observed. The wastewater data provide very weak support for a small peak in IBV
infections in Geneva around the time mobility restrictions were introduced and
in Zurich around the time they were lifted. However, these results were based
on detecting low IBV concentrations in only a few samples on a handful of days
(figure 2 and figure S2 in the appendix).
We note that infection incidences for both
IAV and IBV generally shift over time, depending on the assumed shedding load
distribution. All estimates shifted 1–2 weeks further to the past with a
shedding load distribution based on potentially longer faecal shedding rather
than respiratory shedding (figure S4 in the appendix). However, the qualitative
correspondence between the wastewater-based estimates and mobility restriction
measures remained.
Next, we used the effective reproductive
number (Re) to obtain further insight into the epidemic dynamics. Re
helps us confidently identify when influenza outbreaks are growing or declining
(when confidence bounds on Re exclude the epidemic threshold of 1).
We note that Re estimates are comparably robust to different
scalings of the wastewater load data, at least up to differences of several
orders of magnitude, since they are only based on relative changes in incidence
over time (figure S5). Regarding the incidence estimates, the timing of the Re
estimates depends on the chosen shedding load distribution (figure S4).
Figure 4 shows that for the influenza A
virus in Zurich and Geneva, the wastewater-based Re decreased to
around or below the epidemic threshold of 1 (confidence interval below 1.05) in
mid-December 2021. Mobility restriction measures in Switzerland were
strengthened considerably on 20 December 2021 to combat the Omicron variant of
SARS-CoV-2 (table 1). The same decreasing trend in Re around this
time was observed in the wastewater-based Re from Basel, although
confidence intervals were wider around the epidemic threshold. Later, Re
was around or above 1 (confidence interval above 0.97) in the Zurich and Geneva
catchments in the period after the relaxation of the measures. Assuming less
conservative scalings for wastewater loads increased the certainty of these Re
estimates, pushing the lowest values significantly below 1 and the highest
values significantly above 1 (figure S5 in the appendix).
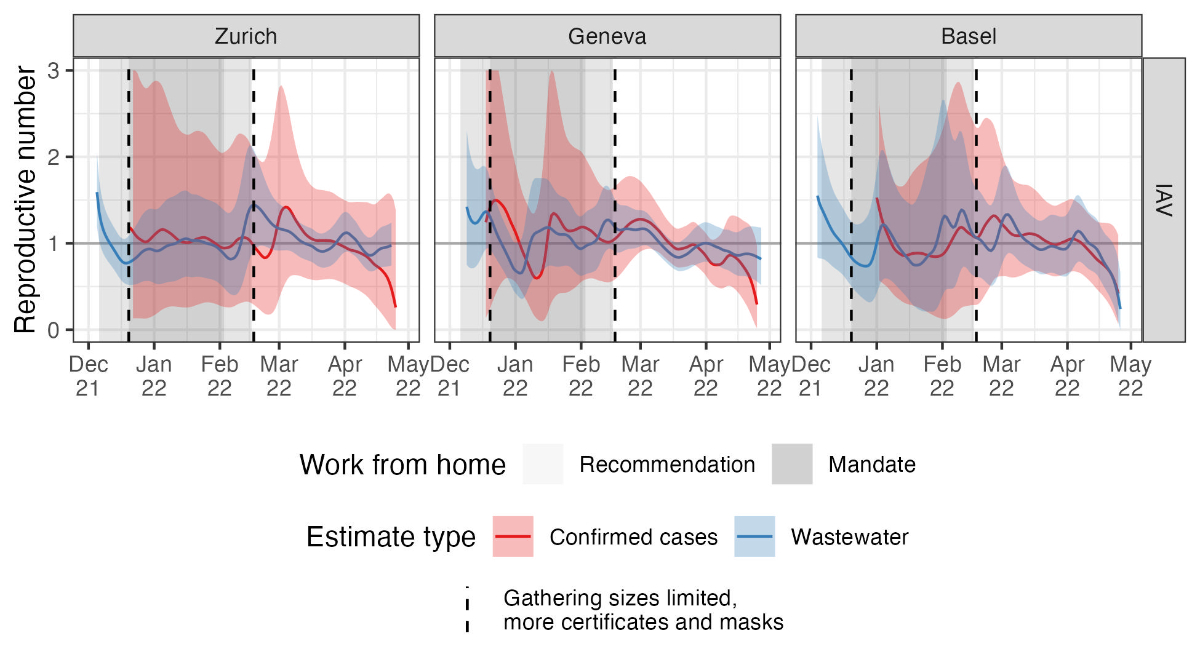
Figure 4Reproductive number estimates. The
different colours show estimates based on wastewater influenza measurements
(blue) and laboratory-confirmed influenza cases (red). Coloured bands show the
combined 95% bootstrap confidence and 95% credible intervals for each estimate
(see the Methods for details). Shaded areas show when work-from-home measures
were in place (see table 1). IAV: influenza A virus.
Confirmed influenza A virus cases in each
catchment were very low for most of the sample period, causing the delayed
start of Re estimates and large confidence intervals for case-based
estimates in figure 4. We also have confirmed case data for postal codes
corresponding to several other catchment areas where we only started wastewater
surveillance after the 2021/22 season. In most catchments, confirmed cases showed
a similar peak in March-May 2022 as in the Zurich, Geneva, and Basel catchments,
and Re estimates based on catchment-level confirmed cases generally
declined after March 2022. However, case numbers were low in these other
smaller catchment areas (figure S3), so trends are more stochastic (figure S6
in the appendix). Combining all confirmed cases from all postal codes for which
we had data yielded a Re estimate indicating Re was above
1 in Switzerland in early March 2022 (figure S6). However, even combining all
available case data, case-based Re estimates were still too
uncertain in December 2021 to draw any conclusions. Therefore, the
wastewater-based Re estimates are more precise than confirmed-case-based
estimates, at least at the catchment level.
The incidences of influenza B virus based
on wastewater and confirmed cases were too low to generate reliable Re
estimates (figure S6).
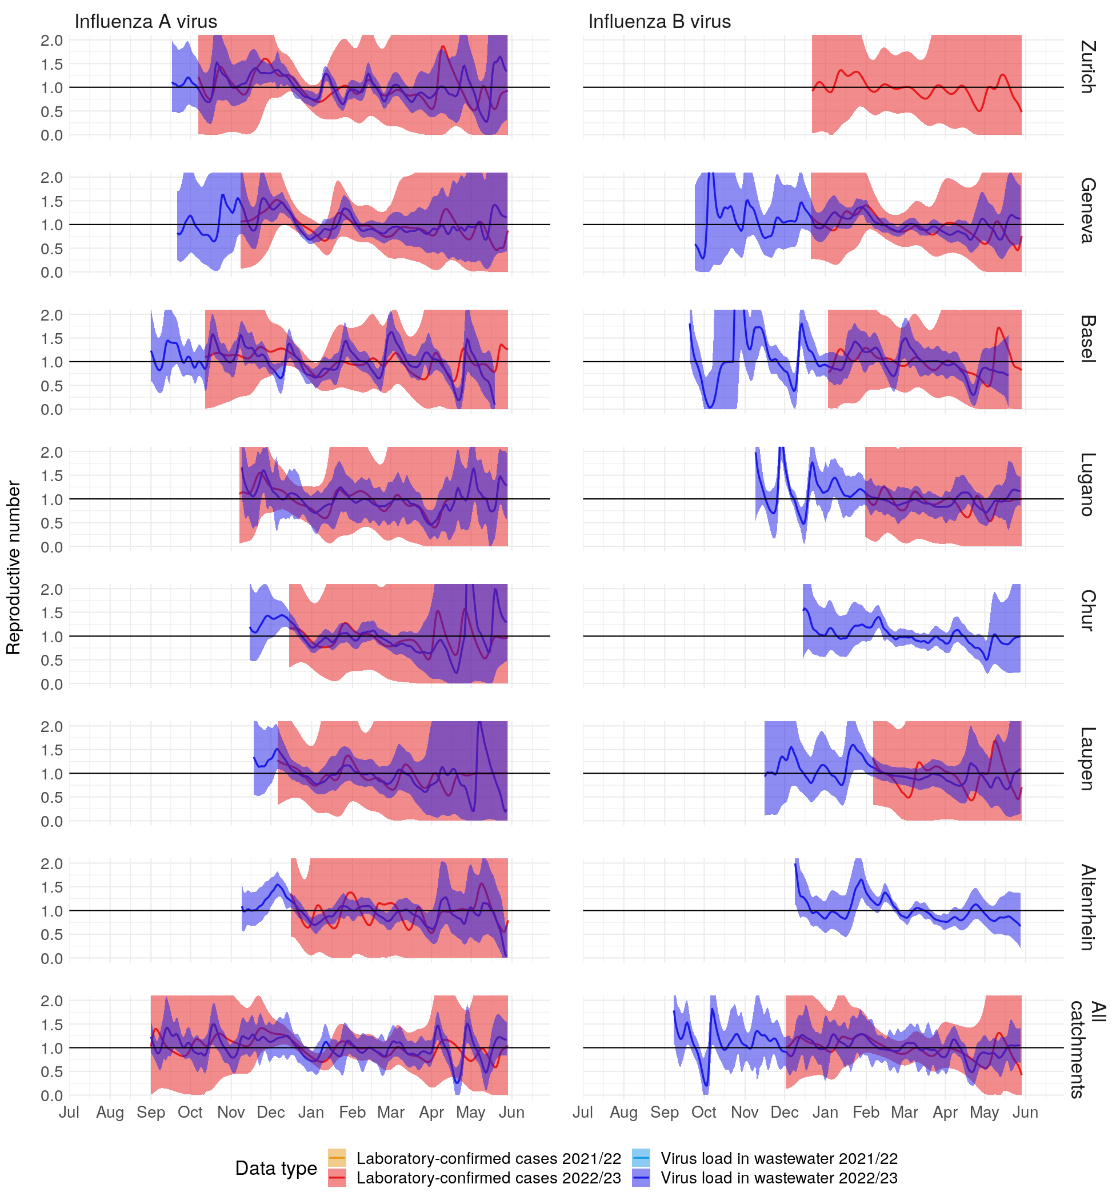
All these results are available on an
online dashboard at https://wise.ethz.ch/influenza/. At the time
of manuscript revision, ongoing monitoring results were available through June
2023. Generally speaking, higher influenza A and influenza B virus wastewater
loads and case numbers during the 2022/23 season resulted in narrower
confidence intervals for Re than in the 2021/22 season, with Re
roughly peaking around 1 December 2022 across the studied catchments (figure S7
in the appendix).
Discussion
In this study, we presented
proof-of-concept results for quantifying influenza transmission dynamics based
on wastewater viral loads. We were able to estimate trends in infection
incidence and quantify the effective reproductive number for the influenza A
virus in the three largest wastewater catchment areas in Switzerland. The influenza
B virus was occasionally detectable in these catchment areas but at low
concentrations. Altogether, these data provide a contrasting perspective on
influenza outbreak dynamics to the confirmed case data, with the
wastewater-based dynamics qualitatively aligning better to population mobility
restrictions in winter 2021/22 due to the Omicron variant of SARS-CoV-2 than
confirmed case data at the same geographic scale (catchment areas). Moving
forward, we plan to expand our wastewater-based surveillance project to include
additional catchment areas for which we have laboratory-confirmed case data (figure
S3), which will enable further validation of the trends observed in this
proof-of-concept project.
A primary limitation of this study, and
indeed of general wastewater-based pathogen surveillance, is that pathogen
shedding, transport through the sewershed, and decay dynamics in wastewater are
poorly understood. Depending on the specific pathogen and sewershed
characteristics, these dynamics likely vary between pathogen types and
wastewater catchments. We rescaled wastewater loads to incidence values using
the minimum detected wastewater viral load in each catchment for our specific Re
estimation method. This scaling depends both on the detection limit of our
quantification method and the specific sewershed. Therefore, we cannot compare
the absolute magnitudes between the wastewater- and confirmed case-based
incidence estimates shown in figure 3, nor can we compare these magnitudes for
wastewater-based incidence across catchments. Since the proportion of influenza
cases ascertained via the Sentinella system was estimated to be around 5% in
Switzerland [33], the laboratory-confirmed case-based incidence estimates in figure
3 are likely significant underestimates, as are the wastewater-based estimates
at the scaling used. However, relative incidence should be comparable across
influenza types (IAV and IBV) within the same catchment. In contrast, Re
estimates are comparable across catchments and pathogen types since they are
based on relative changes through time.
We performed several sensitivity analyses
to test the robustness of our results to unknown influenza dynamics in
wastewater. First, we showed that Re estimates are robust to several
orders of magnitude difference in the scaling of wastewater loads, except that
confidence intervals become arbitrarily small when the scaling results in
higher incidence estimates (figure S5). The scaling we used provided comparably
conservative (wide) confidence intervals. Then, we also performed a sensitivity
analysis for the shedding load distribution, accounting for faecal versus
respiratory influenza shedding. This analysis showed that the magnitude of our
incidence and Re estimates were generally robust to unknown shedding
dynamics. However, they may be shifted too far towards the present, depending
on whether potentially longer faecal shedding is really the primary driver of
wastewater influenza loads (figure S4). We justify using a respiratory shedding
load distribution here by noting that respiratory shedding appears to be orders
of magnitude greater than faecal shedding (figure S8 in the appendix) [25–26,
34–35]. We also note that trends in wastewater-based infection incidence align
better with confirmed case-based estimates when assuming a respiratory shedding
load distribution (figure 3 and figure S4 in the appendix). However, the
timeline of these case-based estimates was also subject to our assumption of a
delay distribution based on symptom severity over time. Therefore, we cannot
make concrete statements on the lead or lag times between wastewater and
case-based indicators of influenza incidence. We plan to update the shedding
load and time-to-case-confirmation distributions used in our accompanying
dashboard should more data become available.
This project highlights the potential of
wastewater-based surveillance for generating public health-relevant insights
beyond SARS-CoV-2. Namely, we showed that wastewater measurements were more
sensitive to a peak in influenza A virus incidence in Switzerland in December
2021 than confirmed case data or syndromic surveillance data on influenza-like
illnesses. Wastewater data also yielded more precise Re estimates than
confirmed case data on the same geographic scale (catchment areas). The Federal
Office of Public Health noted in its 2021/22 influenza season report that
COVID-19 measures “most likely” reduced influenza transmission in Switzerland
[28]. Our wastewater-based results provide additional evidence of a
correspondence between influenza transmission (quantified by estimated
infection incidence and Re) and mobility restriction measures in
response to COVID-19.
To our knowledge, this is the first time a
mechanistic model has been applied to quantify influenza transmission dynamics from
wastewater data. We emphasize that the development of mechanistic models for
wastewater-based epidemiology is still in its infancy. Such models could, in
principle, incorporate both clinical/syndromic surveillance and wastewater data
simultaneously and more detailed assumptions on noise-generating processes.
Methodological developments along these lines should improve the robustness and
precision of wastewater-based estimates for pathogen transmission dynamics.
A prerequisite for applying complicated mechanistic
models is a robust pathogen quantification method for wastewater. Our data are
based on flow-normalized loads from raw wastewater influent quantified using
either RT-qPCR or RT-dPCR. Despite considerable temporal variation in load
measurements (figure 2A), both methods were sufficient for estimating infection
incidence and Re over the course of a flu season. There are many alternative
approaches for sampling and quantifying human viruses in wastewater, including
using settled solids rather than raw influent (e.g. Boehm et al. [7]) or
alternative normalization approaches, such as normalization by pepper mild
mottle virus. Any improvement in quantification accuracy would be expected to
reduce uncertainty in estimated infection incidence and Re. We note
that Re is a particularly convenient metric for wastewater pathogen
surveillance because it is based on relative changes over time. Therefore, it
is robust to different quantification methods provided quantification
sensitivity is constant over time and most measurements exceed the detection limit.
For example, Huisman et al. [19] showed that Re estimation for
SARS-CoV-2 was possible from both raw influent and settled solids. We
anticipate our approach for influenza Re estimation is similarly
adaptable.
We have continued to measure influenza A and
influenza B virus loads in Swiss wastewater since October 2022 and generate
corresponding estimates for infection incidence and the effective reproductive
number by catchment area. These results are available on an online dashboard at
https://wise.ethz.ch/influenza/.
We have made all the code for the analysis and this dashboard available on our
project repository at https://github.com/wise-ch/wastewater-influenza-dashboard.
We envision these results will help improve influenza surveillance in
Switzerland by serving as an alternate source of information that is less
susceptible to some case-based surveillance challenges amplified by the
COVID-19 pandemic. More generally, we envision that our surveillance dashboard
and the open-source code supporting it can serve as a blueprint for
international surveillance efforts. Finally, as we generate more seasons of
high-quality wastewater data and develop detailed mechanistic models, we expect
to move beyond surveillance to generate new insights on the drivers of
influenza transmission based on wastewater data.
Data and code
availability
The catchment-level wastewater load and
confirmed case data used in this manuscript are available along with the code
at the project repository at https://github.com/wise-ch/wastewater-influenza-dashboard.
Specifically, the wastewater load data (before normalization by the minimum
detected load) and confirmed case data are available in the files prefixed
“clean_data_” at https://github.com/wise-ch/wastewater-influenza-dashboard/tree/master/data/data_used_in_manuscript.
A study protocol has not been prepared.
Acknowledgments
We are grateful to the many individuals who
helped with this project. Taru Singhal provided code upon which the dashboard
shiny app is based. Adrian Lison helped set up and maintain the dashboard.
Charlie Gan, Franziska Böni, Laura Brülisauer, Camila Morales Undurraga,
Johannes Rusch, and Lea Caduff processed wastewater samples. We thank the
employees of the wastewater treatment plants ProRheno AG (Basel), ARA
Werdhölzli (Zurich), and STEP d'Aïre (Geneva), for providing samples. Finally,
the Swiss Federal Office of Public Health provided confirmed case data that was
reported under the obligatory reporting system in Switzerland.
Prof. Dr Tanja Stadler
ETH Zürich, Department of Biosystems Science and Engineering (D-BSSE)
Schanzenstrasse 44
CH-4056 Basel
tanja.stadler[at]bsse.ethz.ch
References
1. WHO. (2014). “Global Influenza Programme”. https://www.who.int/teams/global-influenza-programme/surveillance-and-monitoring
2. CDC. (2022). “2021-2022 U.S. Flu Season: Preliminary In-Season Burden Estimates”.
https://www.cdc.gov/flu/about/burden/preliminary-in-season-estimates.htm
3. WHO. (2013). “Global Epidemiological Surveillance Standards for Influenza”. https://www.who.int/publications/i/item/9789241506601
4. WHO. (2022). “Guidelines for the clinical management of severe illness from influenza
virus infections”. https://apps.who.int/iris/handle/10665/352453
5. CDC. (2022). “Similarities and Differences between Flu and COVID-19 | CDC”. https://www.cdc.gov/flu/symptoms/flu-vs-covid19.htm
6. Dhanasekaran, V., Sullivan, S., Edwards, K.M., Xie, R., Khvorov, A., Valkenburg, S.A.,
Cowling, B.J., Barr, I.G. (2022). Human seasonal influenza under COVID-19 and the
potential consequences of influenza lineage elimination. Nature Communications 2022
13:1 13, 1–11. doi:10.1038/s41467-022-29402-5
7. Boehm AB, Hughes B, Duong D, Chan-Herur V, Buchman A, Wolfe MK, et al. Wastewater
concentrations of human influenza, metapneumovirus, parainfluenza, respiratory syncytial
virus, rhinovirus, and seasonal coronavirus nucleic-acids during the COVID-19 pandemic:
a surveillance study. Lancet Microbe. 2023 May;4(5):e340–8. 10.1016/S2666-5247(22)00386-X
8. FOPH. (2022). “Saisonale Grippe – Lagebericht Schweiz”. https://www.bag.admin.ch/bag/de/home/krankheiten/ausbrueche-epidemien-pandemien/aktuelle-ausbrueche-epidemien/saisonale-grippe---lagebericht-schweiz.html
9. WHO. (2022). “Influenza Update No. 427”. https://www.who.int/publications/m/item/influenza-update-n-427
10. Fernandez-Cassi X, Scheidegger A, Bänziger C, Cariti F, Tuñas Corzon A, Ganesanandamoorthy P,
et al. Wastewater monitoring outperforms case numbers as a tool to track COVID-19
incidence dynamics when test positivity rates are high. Water Res. 2021 Jul;200:117252.
10.1016/J.WATRES.2021.117252 10.1016/j.watres.2021.117252
11. Xagoraraki I, O’Brien E. Wastewater-Based Epidemiology for Early Detection of Viral
Outbreaks. In: O’Bannon DJ, editor. Women in Water Quality, Women in Engineering and
Science. Springer Nature Switzerland AG; 2020. pp. 75–97. 10.1007/978-3-030-17819-2_5
12. Kilaru P, Hill D, Anderson K, Collins MB, Green H, Kmush BL, et al. Wastewater Surveillance
for Infectious Disease: A Systematic Review. Am J Epidemiol. 2022; 10.1093/AJE/KWAC175 10.1093/aje/kwac175
13. Medema G, Been F, Heijnen L, Petterson S. Implementation of environmental surveillance
for SARS-CoV-2 virus to support public health decisions: Opportunities and challenges.
Current Opinion in Environmental Science and Health. Volume 17. Elsevier B.V.; 2020.
pp. 49–71. 10.1016/j.coesh.2020.09.006
14. Wolfe MK, Duong D, Bakker KM, Ammerman M, Mortenson L, Hughes B, et al. Wastewater-Based
Detection of Two Influenza Outbreaks. Environ Sci Technol Lett. 2022;9(8):687–92.
10.1021/acs.estlett.2c00350
15. Mercier E, Aoust PM, Thakali O, Hegazy N, Jia JJ, Zhang Z, et al. (2022). Wastewater
surveillance of influenza activity: Early detection, surveillance, and subtyping in
city and neighbourhood communities. MedRxiv, 2022.06.28.22276884. https://doi.org/10.1101/2022.06.28.22276884
16. Ort C, van Nuijs AL, Berset JD, Bijlsma L, Castiglioni S, Covaci A, et al. Spatial
differences and temporal changes in illicit drug use in Europe quantified by wastewater
analysis. Addiction. 2014 Aug;109(8):1338–52. 10.1111/add.12570
17. Julian T, Ort C, Caduff L, Gan C, Rusch J, Böni F, et al. (2020). “SARS-CoV-2 in Wastewater”
https://www.eawag.ch/en/department/sww/projects/sars-cov2-in-wastewater/
18. Bagutti, C., Alt Hug, M., Heim, P., Maurer Pekerman, L., Ilg Hampe, E., Hübner, P.,
Fuchs, S., Savic, M., Stadler, T., Topolsky, I., Icer Baykal, P., Dreifuss, D., Beerenwinkel,
N., & Tschudin Sutter, S. (2022). Wastewater monitoring of SARS-CoV-2 shows high correlation
with COVID-19 case numbers and allowed early detection of the first confirmed B.1.1.529
infection in Switzerland: results of an observational surveillance study. Swiss Medical
Weekly 2022 :25, 152(25), w30202. https://doi.org/10.4414/SMW.2022.W30202 10.4414/SMW.2022.w30202
19. Huisman JS, Scire J, Caduff L, Fernandez-Cassi X, Ganesanandamoorthy P, Kull A, et
al. Wastewater-Based Estimation of the Effective Reproductive Number of SARS-CoV-2.
Environ Health Perspect. 2022 May;130(5):57011. 10.1289/ehp10050 10.1289/EHP10050
20. Scire J, Huisman JS, Grosu A, Angst DC, Li J, Maathuis MH, et al. (2022). estimateR:
An R package to estimate and monitor the effective reproductive number. MedRxiv, 2022.06.30.22277095.
https://doi.org/10.1101/2022.06.30.22277095
21. Cori A, Ferguson NM, Fraser C, Cauchemez S. A new framework and software to estimate
time-varying reproduction numbers during epidemics. Am J Epidemiol. 2013 Nov;178(9):1505–12.
10.1093/aje/kwt133
22. Wade MJ, Lo Jacomo A, Armenise E, Brown MR, Bunce JT, Cameron GJ, et al. Understanding
and managing uncertainty and variability for wastewater monitoring beyond the pandemic:
lessons learned from the United Kingdom national COVID-19 surveillance programmes.
J Hazard Mater. 2022 Feb;424 Pt B:127456. 10.1016/j.jhazmat.2021.127456
23. Zahedi A, Monis P, Deere D, Ryan U. Wastewater-based epidemiology-surveillance and
early detection of waterborne pathogens with a focus on SARS-CoV-2, Cryptosporidium
and Giardia. Parasitol Res. 2021 Dec;120(12):4167–88. 10.1007/s00436-020-07023-5
24. Carrat F, Vergu E, Ferguson NM, Lemaitre M, Cauchemez S, Leach S, et al. Time lines
of infection and disease in human influenza: a review of volunteer challenge studies.
Am J Epidemiol. 2008 Apr;167(7):775–85. 10.1093/aje/kwm375
25. Hirose R, Daidoji T, Naito Y, Watanabe Y, Arai Y, Oda T, et al. Long-term detection
of seasonal influenza RNA in faeces and intestine. Clin Microbiol Infect. 2016 Sep;22(9):813.e1–7.
10.1016/j.cmi.2016.06.015
26. Chan MC, Lee N, Chan PK, To KF, Wong RY, Ho WS, et al. Seasonal influenza A virus
in feces of hospitalized adults. Emerg Infect Dis. 2011 Nov;17(11):2038–42. 10.3201/eid1711.110205
27. Ferguson, N. M., Cummings, D. A. T., Cauchemez, S., Fraser, C., Riley, S., Meeyai,
A., Iamsirithaworn, S., & Burke, D. S. (2005). Strategies for containing an emerging
influenza pandemic in Southeast Asia. Nature 2005 437:7056, 437(7056), 209–214. https://doi.org/10.1038/nature04017
28. FOPH. (2022). “Bericht zur Grippesaison 2021/22” https://www.bag.admin.ch/dam/bag/de/dokumente/mt/infektionskrankheiten/grippe/saisonbericht-grippe-2021-22.pdf.download.pdf/saisonbericht-grippe-2021-22_DE.pdf
29. Borchers H. (2022). pracma: Practical Numerical Math Functions. R package version
2.4.2, https://CRAN.R-project.org/package=pracma
30. FOPH. (2022). “Coronavirus: Measures and Ordinances.” https://www.bag.admin.ch/bag/en/home/krankheiten/ausbrueche-epidemien-pandemien/aktuelle-ausbrueche-epidemien/novel-cov/massnahmen-des-bundes.html
31. SWI. (2022). “Coronavirus: The Situation in Switzerland”. https://www.swissinfo.ch/eng/society/covid-19_coronavirus--the-situation-in-switzerland/45592192
32. Federal Council. (2022). “Coronavirus: Federal Council to lift measures – mask requirement
on public transport and in healthcare institutions and isolation in the event of illness
to remain until end of March”. https://www.admin.ch/gov/en/start/documentation/media-releases.msg-id-87216.html
33. Brugger J, Althaus CL. Transmission of and susceptibility to seasonal influenza in
Switzerland from 2003 to 2015. Epidemics. 2020 Mar;30:100373. 10.1016/j.epidem.2019.100373
34. Lau LL, Cowling BJ, Fang VJ, Chan KH, Lau EH, Lipsitch M, et al. Viral shedding and
clinical illness in naturally acquired influenza virus infections. J Infect Dis. 2010 May;201(10):1509–16.
10.1086/652241
35. To KK, Chan KH, Li IW, Tsang TY, Tse H, Chan JF, et al. Viral load in patients infected
with pandemic H1N1 2009 influenza A virus. J Med Virol. 2010 Jan;82(1):1–7. 10.1002/jmv.21664
36. Integrated DN. Technologies. (n.d.). 2019-nCoV Research Use Only qPCR Probe Assay
primer/probe mix. Retrieved December 5, 2022, from https://sfvideo.blob.core.windows.net/sitefinity/docs/default-source/supplementary-product-info/supplemental-information---2019-ncov-assay---ruo.pdf?sfvrsn=2bcf1507_2
37. Ward CL, Dempsey MH, Ring CJ, Kempson RE, Zhang L, Gor D, et al. Design and performance
testing of quantitative real time PCR assays for influenza A and B viral load measurement.
J Clin Virol. 2004 Mar;29(3):179–88. 10.1016/S1386-6532(03)00122-7
38. Fry AM, Chittaganpitch M, Baggett HC, Peret TC, Dare RK, Sawatwong P, et al. The burden
of hospitalized lower respiratory tract infection due to respiratory syncytial virus
in rural Thailand. PLoS One. 2010 Nov;5(11):e15098. 10.1371/journal.pone.0015098
Appendix
Supplemental methods
RT-dPCR procedure
Pathogen RNA quantification was done for samples from the Zurich and Geneva facilities
using digital reverse transcription PCR (RT-dPCR) on the Crystal Digital PCR Naica
System (Stilla Technologies, France) with qScript XLT One-Step RT-qPCR Kit (CN: 95132-02K,
Quantabio, MA, USA). Two assays were used, IABV and RESPV4. IABV is a duplex assay
with IAV and IBV, targeting the matrix proteins of each respective virus (figure S11).
RESPV4 is an updated tetraplex assay that incorporates SARS-CoV-2 Nucleoprotein locus
2 (N2) and Respiratory Syncytial Virus Matrix protein (RSV), while including the aforementioned
IAV and IBV targets (figure S11). The mastermix final volume was 27 µl, with
5.4 μl of template and 21.6 µl of pre-mix. The premix consists of the US CDC SARS-CoV-2
RUO Kit N2, with a primer and probe final concentration of 500 nM and 125 nM, respectively
[36] (Integrated DNA Technologies, USA). IAV, IBV and RSV all had primers at a final
concentration of 500 nM. The RSV probe had a final concentration of 400 nM, and the
IAV and IBV probes were at a final concentration of 200 nM. Fluorescein was added
at a final concentration of 125 nM as a background dye for droplet detection. Finally,
RNAse/DNAse-free water was added (variable, depending on stock concentrations) to
bring the pre-mix to the correct final volume, of which 25 μL was pipetted into Sapphire
Chips (Stilla Technologies). Thermocycling conditions included droplet partitioning
at 40 ºC for 12 minutes, followed by reverse transcription at 50 ºC for 1 hour, and
then followed by 40 cycles of 95 ºC for 30 s and
57.5 ºC for 60 s. Chips were subsequently read on the Stilla Prism3 chip reader for
the IABV assay or the Stilla Prism6 chip reader for the RESPV4 assay.
Analysis of IAV included results from both IABV and RESPV4, whereas with IBV only
the measurements for RESPV4 were used due to insufficient separation of positive droplets
(figure S9). Samples were run in technical duplicate, and each measurement consisted
of 23’648 droplets on average, with a standard deviation of 6’628 droplets. Each droplet
is assumed to have a volume of 519 nL. Measurements were only included if they had
at least 15’000 droplets. Droplets of incorrect volume (polydispersity) if present
were manually excluded from the analysis. Quality control included one no-template
control and one positive control with every five samples, and inhibition testing for
the SARS-CoV-2 N1 locus for every sample as previously described. Positive controls
are shown in figures S9 and S10.
Delay distributions
For the delay between infection and respiratory shedding and the delay between infection
and symptoms, we used the distributions given in Carrat et al. [24]. We
assumed that this second distribution (infection to symptoms) is a good approximation
for the delay between infection and an individual getting a diagnostic test. To generate
gamma distributions from the data presented in Carrat et al. [24], we digitized figure
2 from that paper using the online tool https://automeris.io/WebPlotDigitizer/. We then matched a gamma distribution to the digitized data by calculating the mean
and standard deviation of the empirical distributions of the two types of data. We
used these means and standard deviations for our gamma delay distributions. Figure
S1A and S1C show the correspondence between the Carrat et al. data [24] and the fitted
distributions.
For the delay between infection and fecal shedding we collated data from two previously
published studies [25-26]. These included at least one patient with IBV infection,
but were primarily from patients with IAV infection. We shifted the data by two days
to account for the fact that measurement days were relative to symptom onset, based
on an average delay from infection to symptom onset of 2 days given in Carrat et al.
[24]. We calculated the mean viral concentration by day and matched a gamma distribution
to these values using the moments of the empirical data distribution as above. Figure
S1B shows the correspondence between the data and the fitted distribution.
Supplemental figures
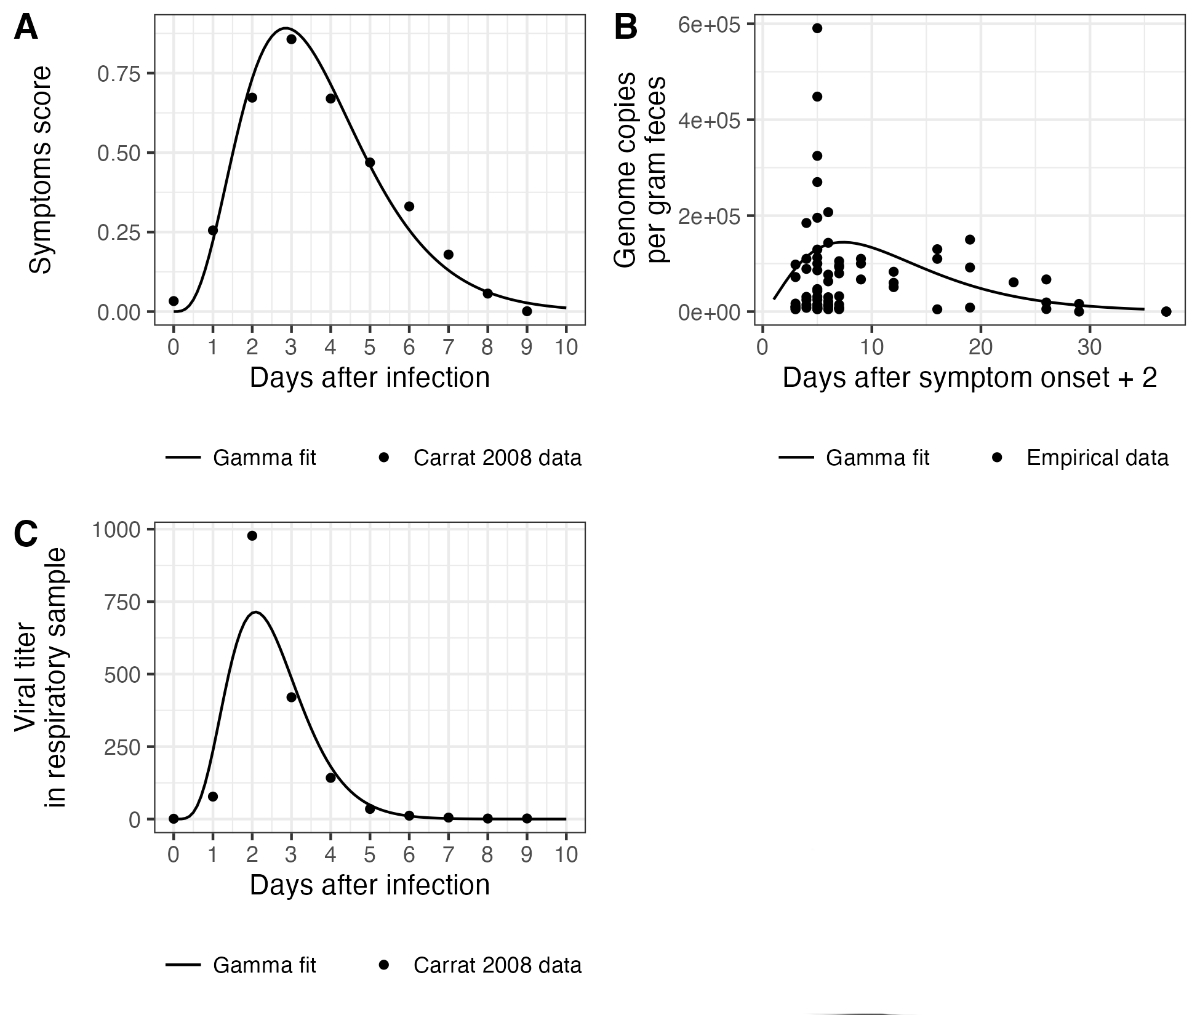
Figure S1Delay distributions used to
reconstruct infection incidence. (A) shows the delay distribution used for
infection to a diagnostic test. (B) shows the fecal shedding load distribution.
Measurements were taken with reference to the date of symptom onset, so here
they are shifted two days to account for an assumed 2-day fixed delay between
infection and symptom onset. One outlier measurement of 4639335 is not shown in
this plot but was used for fitting the gamma distribution. (C) shows the
respiratory shedding load distribution.
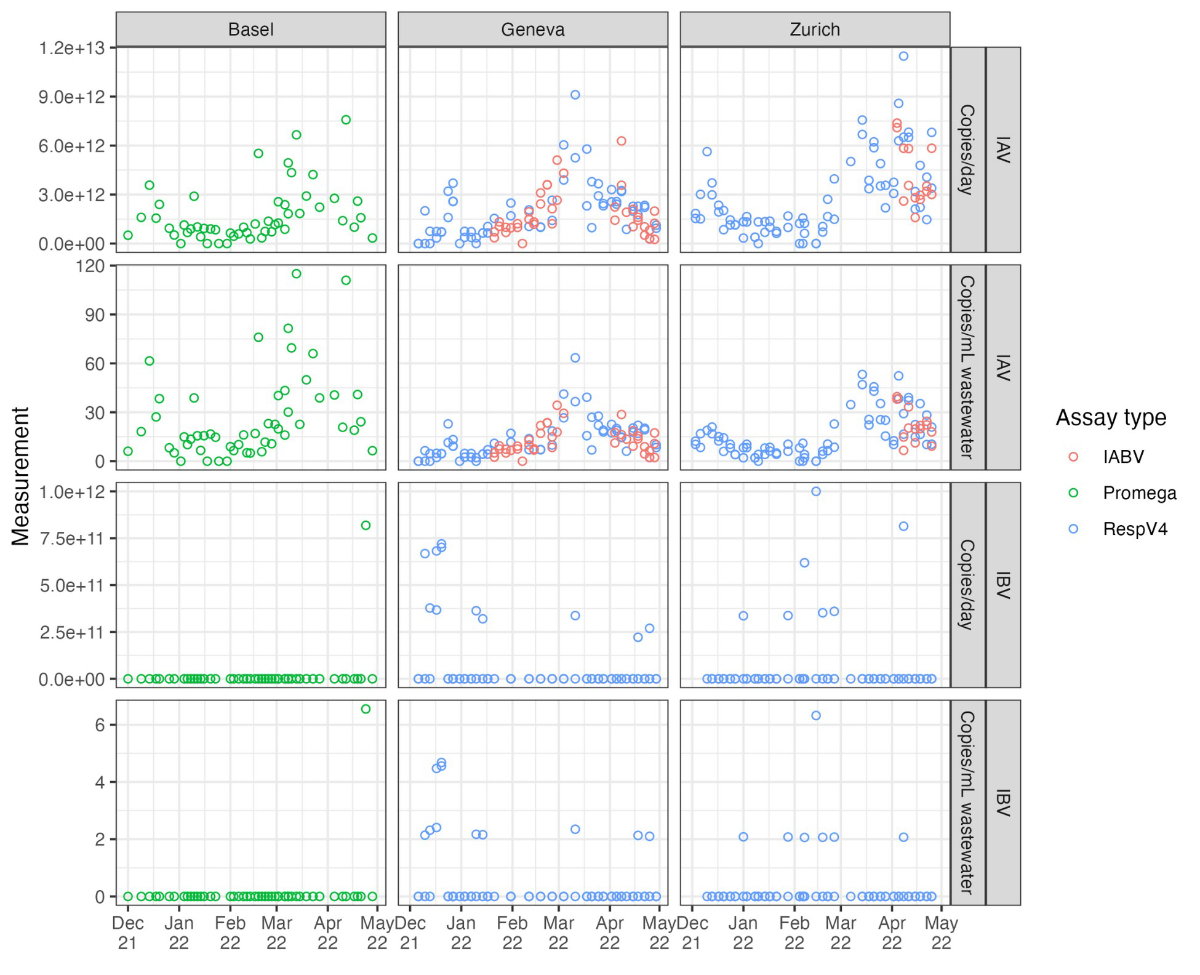
Figure S2Raw wastewater influenza
measurements. Each open point represents a unique measurement. Measurements
from the same catchment on the same day are replicate measurements based on
multiple aliquots. We use data generated using three different assays, which
are shown in different colours.

Figure S3Input data for Re
estimation. Cases are laboratory-confirmed influenza infections (by catchment
area, reported weekly). Wastewater input data are virus load (genome copies per
day) scaled by the minimum non-zero measurement for the respective wastewater
treatment plant. The points show the actual data, and the lines show the cubic
spline interpolation used to generate daily values for Re
estimation.
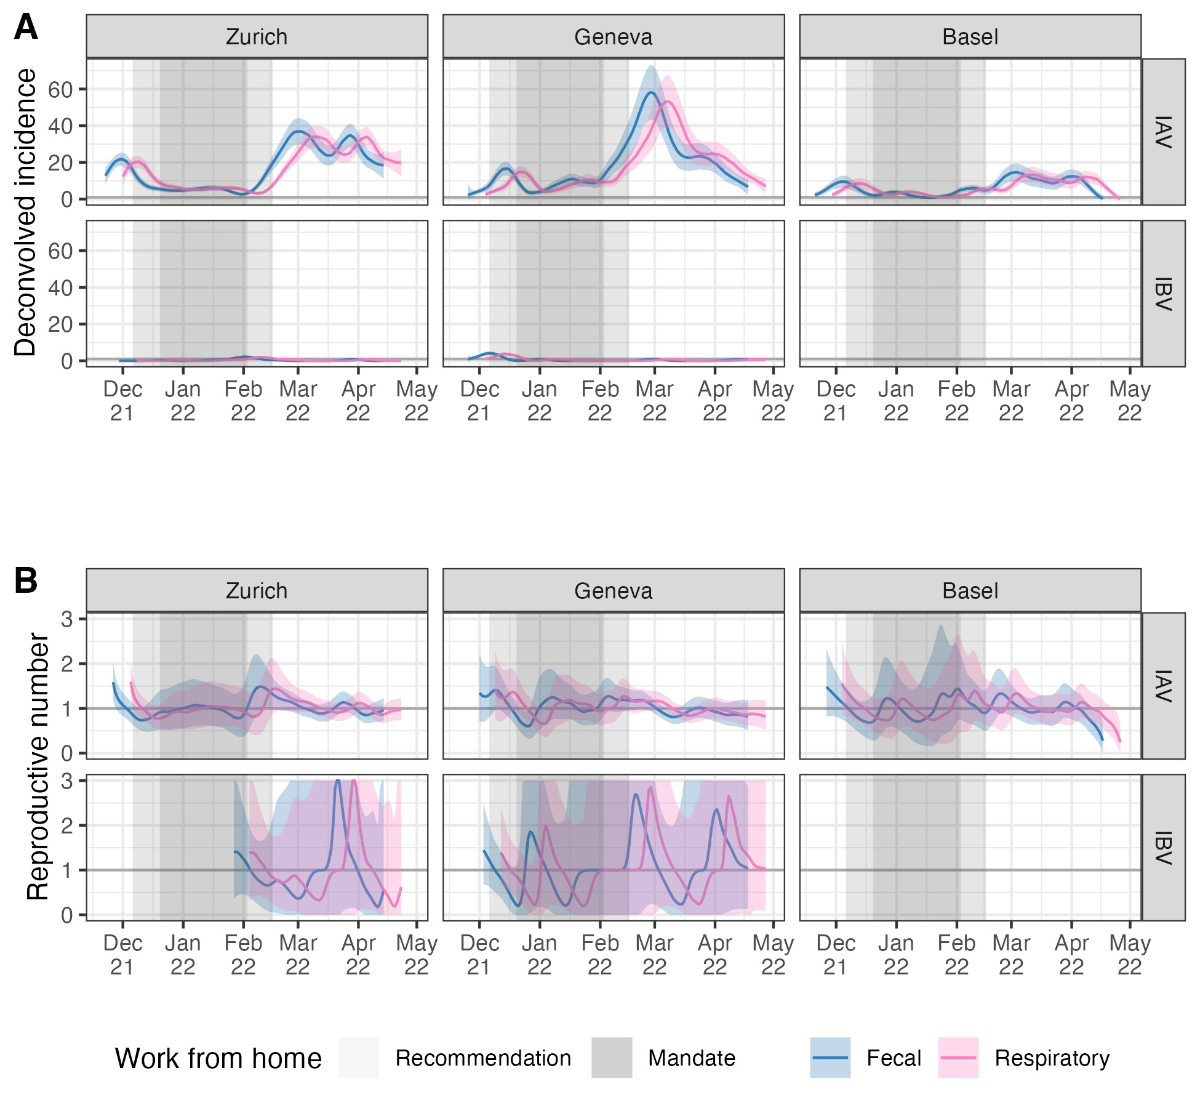
Figure S4Sensitivity analysis for the delay
distribution. We used two different shedding load distributions to deconvolve
wastewater influenza measurements to infection incidence, one based on
measurements of influenza in the stool (“Fecal”) and one based on measurements
of influenza shedding from the respiratory tract (“Respiratory”). The two
distributions are shown in figure S3. (A) The infection incidence
estimates using each distribution, and (B) the reproductive number
estimates. The thicker grey horizontal line in (B) shows the epidemic threshold
at a reproductive number of 1. The shaded grey rectangles highlight periods
when work-from-home measures were in place.
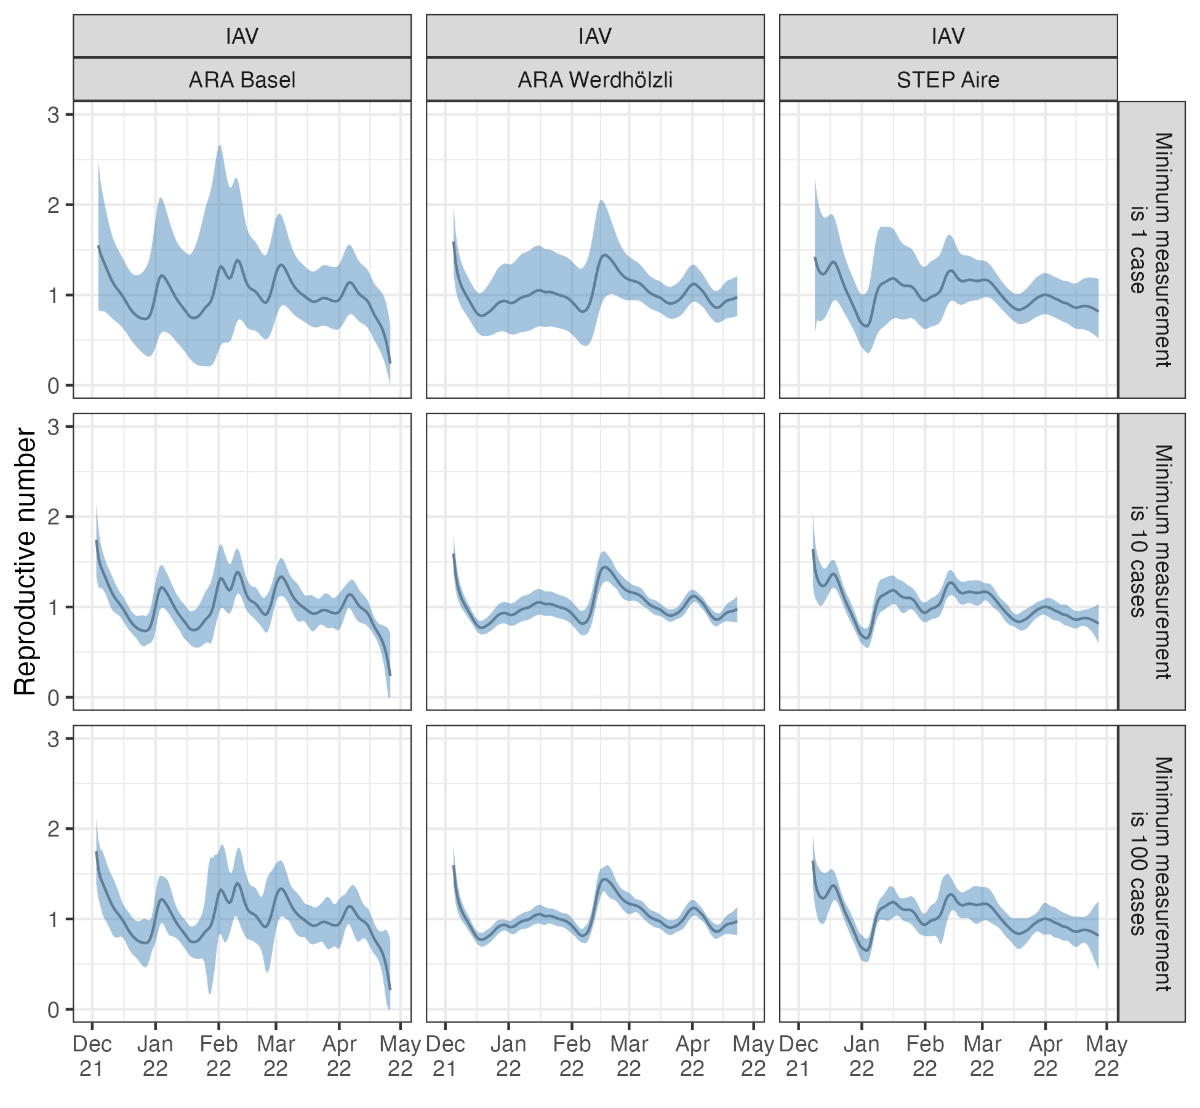
Figure S5Sensitivity analysis for wastewater
measurement scaling. Results are based on the same wastewater loads for IAV
from the Zurich catchment but scaled so that the minimum detected load
corresponds to 1, 10, 100, or 1000 assumed cases in the catchment area.
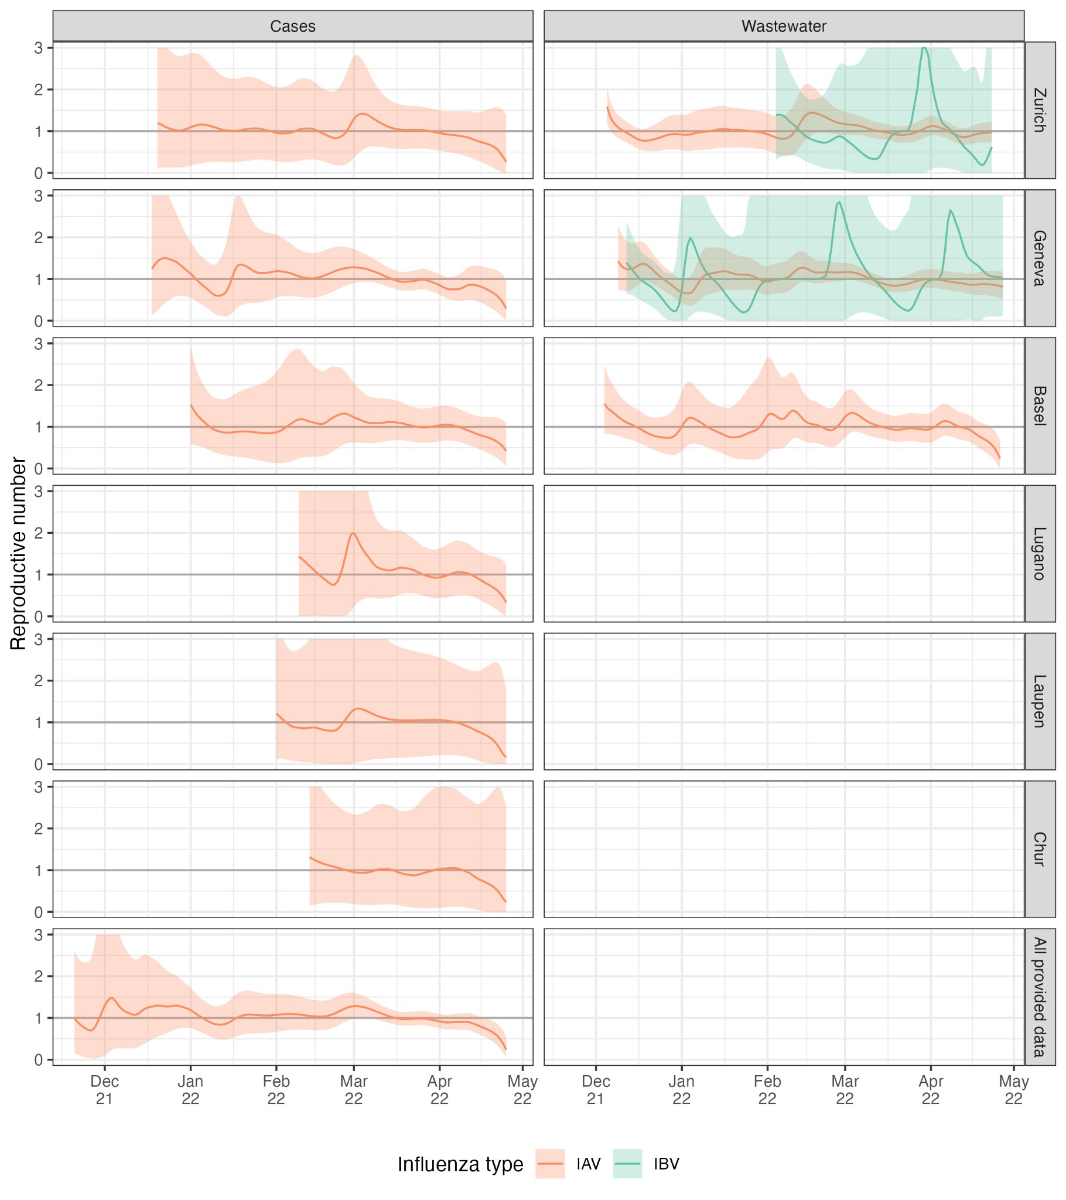
Figure S6Reproductive number estimates for six
different catchment areas and all postal codes for which we have case data.
Results are not shown when the cumulative number of deconvolved cases is below
12, which was the case for the influenza B virus for most case-based data and
for the influenza A virus in the case data from the Altenrhein catchment area.
The thicker grey horizontal line shows the epidemic threshold at a reproductive
number of 1.
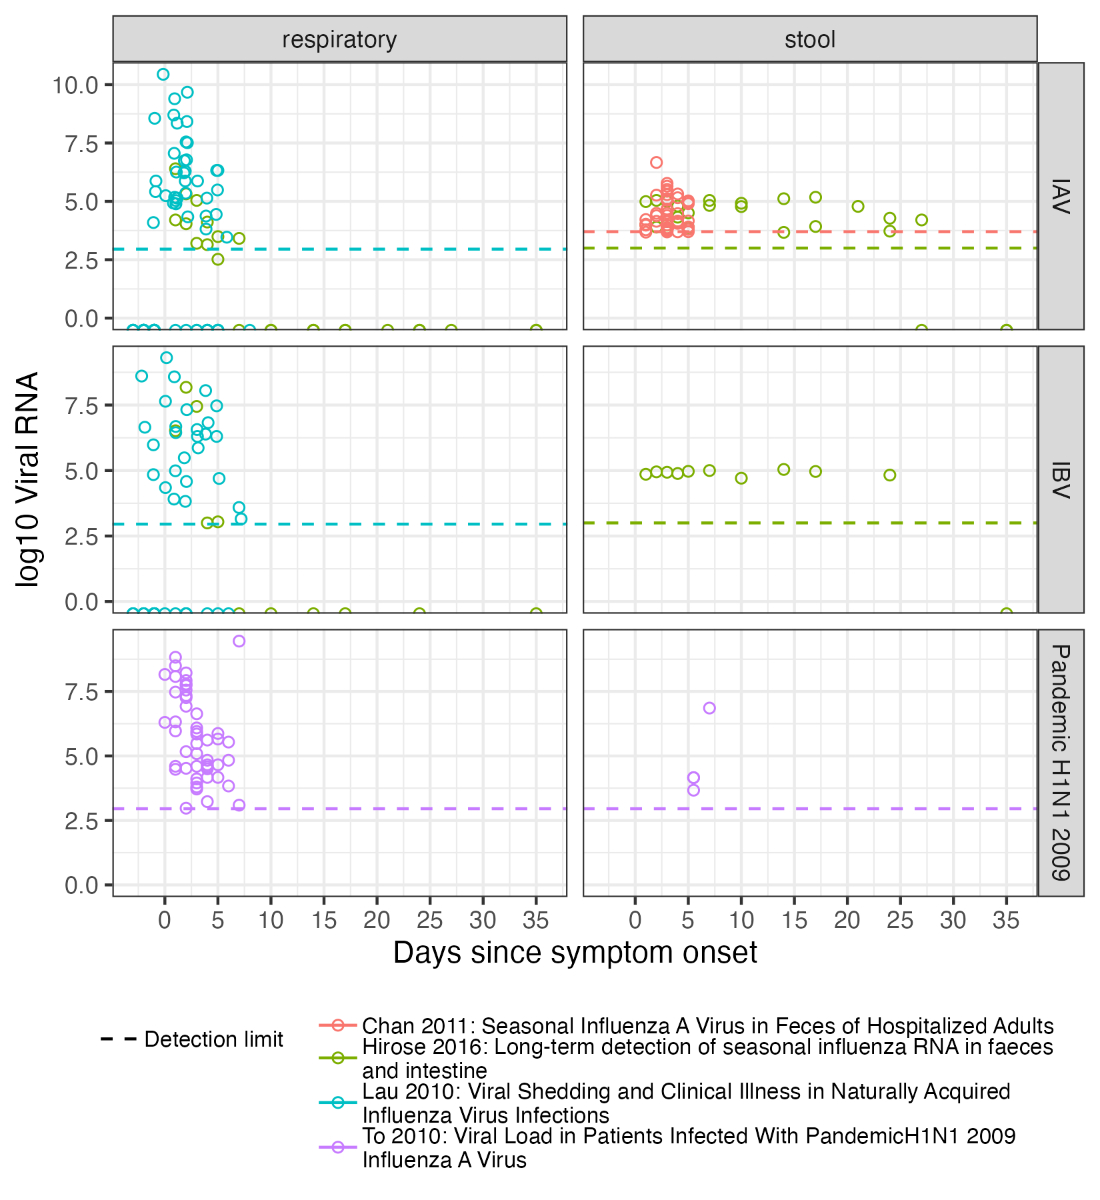
Figure S8Influenza shedding measurements
from a convenience sample of previous studies. “Respiratory” samples include
nose-throat swabs and sputum. “Stool” samples are faeces. The referenced
studies are Chan et al. [26],
Hirose et al. [25], Lau et al. [34], and To et al. [35].
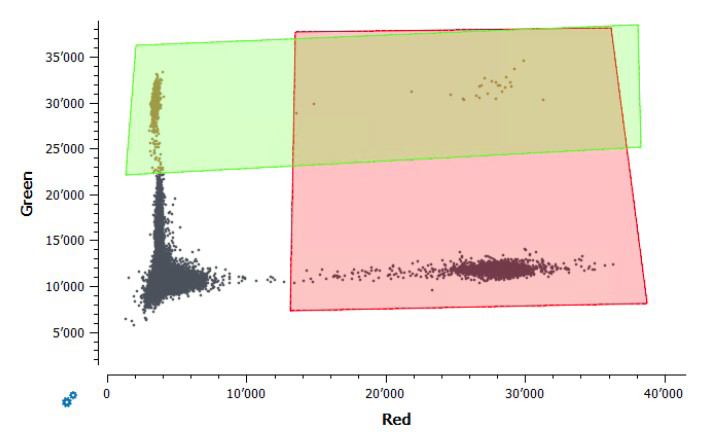
Figure S9Gating of positive control samples
for the assay “IABV”. The green fluorophore (y-axis) represents the IBV,
and the red fluorophore (x-axis) represents the IAV. The rectangles show
the fluorescence thresholds used to determine which droplets in samples were
positive for each virus. This assay was only used to quantify IAV because there
was no clear separation between positive and negative droplets for the IBV
control.

Figure S10Gating of positive control samples
for the assay “RESPV4”. The green and red fluorophores are for IBV and IAV,
respectively, as for the assay “IABV”. The yellow and blue fluorophores are for
respiratory syncytial virus (RSV) and SARS-CoV-2, respectively. The rectangles
show the fluorescence thresholds used to determine which droplets in samples
were positive for each virus.
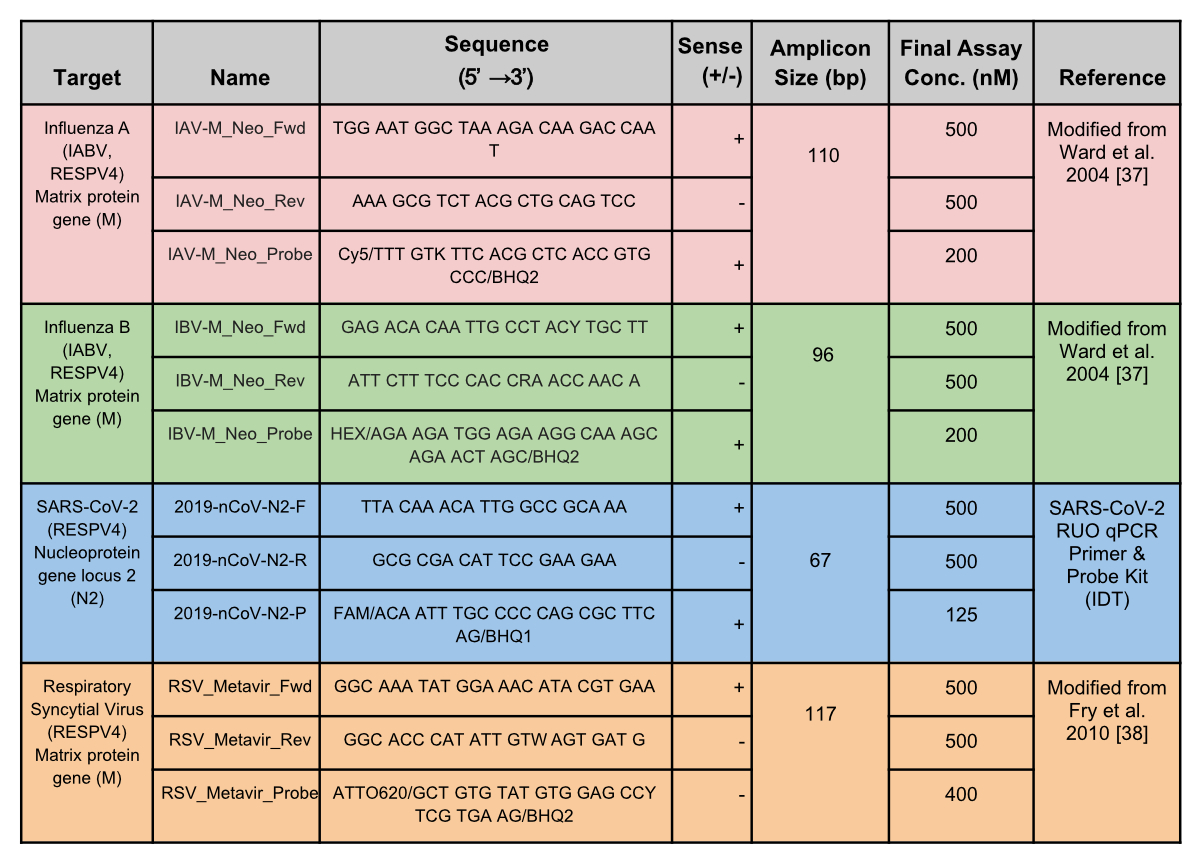
Figure S11Primer
and probe sequences. The primers and probes shown were used in the duplex
(IABV) and tetraplex (RESPV4) assays for Zurich and Geneva wastewater treatment
facilities. Sequences are in the 5’ to 3’ direction.