Glycaemic outcomes in adults with type 1 diabetes transitioning towards advanced automated
insulin delivery systems – a real-world analysis at a Swiss tertiary centre
DOI: https://doi.org/https://doi.org/10.57187/s.3501
Vera Lehmanna,
Franco Notia,
Markus Laimera,
Christoph Stettlera,
Thomas
Zügerab
a Department of Diabetes, Endocrinology, Nutritional Medicine and Metabolism, Inselspital,
Bern University Hospital, University of Bern, Bern, Switzerland
b Department of Diabetes, Endocrinology and Metabolic Diseases, Kantonsspital Olten,
Olten, Switzerland
c These
authors contributed equally as first authors to this manuscript
Summary
AIMS OF THE
STUDY: To assess glucose levels in adults with diabetes at a Swiss tertiary
hospital when transitioning from insulin delivery with a sensor-augmented pump
with (predictive) low-glucose suspend ([P]LGS) to a hybrid-closed loop (HCL) and from
a HCL to an advanced hybrid-closed loop (AHCL).
METHODS:
Continuous glucose monitoring data for 44 adults with type 1 diabetes
transitioning from (P)LGS to hybrid-closed loop and from hybrid-closed loop to advanced
hybrid-closed loop were analysed, including the percentage of time spent within, below,
and above glucose ranges. In addition, a subgroup analysis
(n = 14) of individuals undergoing both transitions was performed.
RESULTS: The
transition from a (P)LGS to a hybrid-closed loop was associated with increased time
in range
(6.6% [2.6%–12.7%], p <0.001) and decreased time above range (5.6% [2.3%–12.7%], p
<0.001).
The transition from a hybrid-closed loop to an advanced hybrid-closed loop was associated
with increased time in range (1.6% [−0.5%–4.5%], p = 0.046) and decreased time above
range (1.5% [–1.8%–5.6%], p = 0.050).
Both transitions did not change the time below range. In the subgroup analysis ([P]LGS
→ HCL → AHCL), the time in range increased
from 69.4% (50.3%–79.2%) to 76.5% (65.3%–81.3%) and 78.7% (69.7%–85.8%),
respectively (p <0.001).
CONCLUSIONS:
Glucose levels significantly improved when transitioning from a (P)LGS to a hybrid-closed
loop. Glucose levels improved further when switching from a hybrid-closed loop
to an advanced hybrid-closed loop. However, the added benefit of an advanced
hybrid-closed loop was comparably smaller. This pattern was also reflected in
the subgroup analysis.
Introduction
Hybrid
closed-loop (HCL) and the newer advanced hybrid closed-loop (AHCL) systems have
transformed insulin delivery in recent years. These systems comprise three components:
an insulin pump, a continuous glucose monitoring device, and a control
algorithm to automatically adapt insulin delivery based on glucose trends. Compared
to the hybrid-closed loop, the advanced hybrid-closed loop systems have
enhanced algorithms, including individualised glucose targets or microbolusing.
The hybrid-closed and advanced hybrid-closed loops significantly improved
glucose levels in individuals with diabetes [1–6]. However, there is limited evidence
on how glucose levels change in patients undergoing multiple transitions
towards more advanced insulin delivery systems [7].
This retrospective,
real-world study at an outpatient tertiary Swiss centre aimed to assess glucose
levels in adults with diabetes transitioning from a sensor-augmented pump with (predictive)
low-glucose suspend ([P]LGS) to an HCL and from an HCL to an AHCL. In addition,
we performed a subgroup analysis in individuals undergoing both transitions ([P]LGS
→ HCL → AHCL).
Materials and methods
Study design and
population
This retrospective
study was conducted at the University Hospital of Bern and approved by the local
ethics committee (2019-00912). Between 01/2018 and 12/2021, we included two
groups of adults with diabetes providing general consent. The first group ([P]LGS
→ HCL) changed from the MiniMed 640G (Medtronic,
Northridge, CA, USA) to the MiniMed 670G. The second group (HCL → AHCL) changed from
the MiniMed 670G to
the MiniMed 780G. Their clinical data were obtained from electronic health
records. Continuous
glucose monitoring (CGM) data and corresponding glycated haemoglobin A1c
(HbA1c) values were obtained before and after transitioning from the old
to the new insulin delivery system. Individuals and corresponding continuous
glucose monitoring periods were only included in this analysis if they fulfilled
all of the following criteria: (a) 30 consecutive days of continuous glucose
monitoring, (b) ≥50% of continuous glucose monitoring data were available, (c) ≥50%
of the time spent in automatic mode (for hybrid-closed loop and advanced
hybrid-closed loop systems), and (d) data were collected within nine months
before and after the transition (figure S3, table S3 in the appendix).
Furthermore, individuals initiating or stopping an off-label treatment with sodium/glucose
cotransporter 2 (SGLT2) inhibitors during the study period and pregnant women
were excluded. Continuous glucose monitoring records were exported with the
proprietary manufacturer software. HbA1cvalues were obtained from the laboratory
information system.
Analysis
Glucose
levels were assessed using standardised continuous glucose monitoring metrics [8],
including time in range (TIR; 3.9–10.0 mmol/l), time above range (TAR; >10.0
mmol/l), time below range (TBR; <3.9 mmol/l), mean glucose (mmol/l),
coefficient of variation (%), and glucose management indicator (GMI; %).
Statistical
analyses were performed using STATA 17.0 (StataCorp LLC, College Station, TX,
USA). The normality of the data distribution was assessed using the Shapiro–Wilk
test. Results are presented as median (interquartile range) unless otherwise specified.
The continuous
glucose monitoring metrics and HbA1cvalues from the old versus new insulin delivery
system were compared using a paired t-test or Wilcoxon signed-rank test,
as appropriate. A two-sided p-value <0.05 was considered statistically
significant.
Additionally,
we performed a subgroup analysis of individuals undergoing both transitions (i.e.
the (P)LGS → HCL → AHCL subgroup). The three periods were compared using repeated
measure analysis
of variance or the Friedman test with a post-hoc Bonferroni correction to
control for multiple comparisons. The details of the participants’ grouping are
shown in figure S2 in the appendix.
Results
This study included
44 adults with diabetes (age: 38.5 y (28.5–51.0 y), HbA1c: 6.9% (6.2%–7.8%),
28 male; table S2 in the appendix).
The transition
from the sensor-augmented pump with (P)LGS to the HCL system (n = 28) was
associated with a median increase in the time in range of 6.6% (2.6%–12.7%, p
<0.001) and decrease in time above range of 5.6% (2.3%–12.7%, p <0.001). There was
no significant change in time below range (p = 0.063). Before transition, PLGS was
active in
four patients and LGS in 24 patients. LGS only suspends insulin delivery when the
threshold for hypoglycaemia is reached. In contrast, PLGS suspends insulin delivery
when hypoglycaemia is predicted.
The transition
from the HCL to the AHCL system (n = 28) was associated with a median increase in
time in range of 1.6% (–0.5%–4.5%, p = 0.046) and decrease in time above range of
1.5% (–1.8%–5.6%,
p = 0.050). There was no significant change in time below range (p = 0.760).
The HbA1c level and total daily insulin dose (TDD) did not
significantly change after both transitions. There was a trend towards
higher continuous glucose monitoring usage time from (P)LGS to HCL and from HCL
to AHCL. Table 1 shows the detailed continuous glucose monitoring metrics,
insulin dosages,
and HbA1c levels before and after transition in the (P)LGS → HCL and HCL → AHCL groups.
Table 1Glucose metrics for
the (P)LGS → HCL and HCL → AHCL groups. Results are shown as median (interquartile
range).
| |
(P)LGS → HCL Group (n = 28) |
HCL → AHCL Group (n = 28) |
| Predictive low glucose suspend |
Hybrid closed-loop |
p-value |
Hybrid closed-loop |
Advanced hybrid closed-loop |
p-value |
| Time
in target range (3.9–10.0 mmol/l; %) |
66.6 (54.4–77.4) |
73.7 (63.7–82.9) |
<0.001 |
74.8 (65.2–83.5) |
77.3 (68.7–85.5) |
0.046 |
| |
Night (%) |
69.1 (58.3–81.5) |
78.2 (70.2–88.9) |
<0.001 |
82.8 (67.9–91.7) |
85.3 (77.2–90.9) |
0.056 |
| Day (%) |
65.7 (54.4–76.8) |
73.7 (63.0–81.3) |
0.001 |
72.9 (64.2–85.1) |
75.1 (64.0–85.4) |
0.136 |
| Time above
target range (>10 mmol/l; %) |
29.8 (20.0–43.4) |
24.8 (14.3–35.2) |
<0.001 |
23.9 (14.9–33.8) |
21.1 (11.5–27.9) |
0.050 |
| |
Night (%) |
26.8 (14.9–39.8) |
18.8 (7.7–28.9) |
<0.001 |
14.6 (7.5–28.9) |
13.5 (6.7–21.0) |
0.032 |
| Day (%) |
29.9 (18.9–43.6) |
23.3 (14.3–35.8) |
0.002 |
24.9 (12.3–35.1) |
21.6 (12.8–32.7) |
0.171 |
| Time below
target range (<3.9 mmol/l; %) |
2.85 (1.20–4.65) |
1.82 (0.91–3.31) |
0.063 |
1.54 (0.58–3.21) |
1.59 (0.71–2.88) |
0.762 |
| |
Night (%) |
2.48 (1.02–7.72) |
1.39 (0.43–2.53) |
0.086 |
1.00 (0.21–1.56) |
0.80 (0.35–2.44) |
0.771 |
| Day (%) |
2.65 (0.84–4.44) |
2.10 (1.00–3.68) |
0.049 |
1.83 (0.53–3.67) |
1.59 (0.75–2.96) |
0.662 |
| Mean glucose
(mmol/l) |
8.51 (7.75–9.88) |
8.45 (7.67–9.07) |
0.018 |
8.28 (7.62–9.08) |
7.99 (7.52–8.60) |
0.005 |
| |
Night (mmol/l) |
8.38 (7.60–9.79) |
8.02 (7.33–8.87) |
0.021 |
7.93 (7.31–8.69) |
7.50 (7.15–8.15) |
0.001 |
| Day (mmol/l) |
8.66 (7.71–10.07) |
8.19 (7.76–9.32) |
0.045 |
8.20 (7.72–9.24) |
7.99 (7.50–8.76) |
0.037 |
| Coefficient
of variation (%) |
36.4 (33.8–39.2) |
32.3 (29.3–35.8) |
<0.001 |
31.6 (26.7–36.2) |
32.8 (27.8–37.5) |
0.014 |
| |
Night (%) |
34.5 (29.8–40.5) |
29.3 (27.2–33.8) |
0.002 |
28.8 (20.9–35.0) |
30.0 (23.3–35.1) |
0.068 |
| Day (%) |
35.5 (33.9–38.7) |
32.6 (29.9–36.5) |
<0.001 |
33.1 (26.5–35.6) |
33.1 (28.3–37.6) |
0.037 |
| Glucose
management indicator (%) |
6.97 (6.49–7.83) |
6.92 (6.44–7.32) |
0.018 |
6.83 (6.41–7.33) |
6.64 (6.34–7.03) |
0.005 |
| |
Night (%) |
6.89 (6.40–7.78) |
6.66 (6.22–7.20) |
0.021 |
6.60 (6.21–7.08) |
6.33 (6.11–6.74) |
0.001 |
| Day (%) |
7.06 (6.46–7.95) |
6.77 (6.50–7.48) |
0.045 |
6.77 (6.47–7.43) |
6.64 (6.33–7.13) |
0.037 |
| HbA (%) |
7.3 (6.6–7.9) |
7.0 (6.2–7.5) |
0.447 |
6.95 (6.45–7.5) |
6.95 (6.35–7.65) |
0.870 |
| Total
daily insulin dose (IU/kg/day) |
0.61 (0.52–0.74) |
0.56 (0.48–0.67) |
0.406 |
0.58 (0.49–0.75) |
0.59 (0.51–0.73) |
0.499 |
| Time continuous
glucose monitoring active (%) |
81.3 (67.5–91.7) |
90.0 (74.5–94.0) |
0.052 |
87.0 (83.5–95) |
90.0 (85.0–95.5) |
0.194 |
| Time in auto-mode |
No auto-mode |
86.5 (75.0–96.0) |
– |
87.5 (78.0–96.5) |
96.5 (89.5–99.5) |
<0.001 |
The subgroup
analysis corroborated these results, which included only patients undergoing
both transitions ([P]LGS → HCL → AHCL; 14 of the 44 included patients). Figure S1
and table S1 in the
appendix show these patients’ detailed continuous glucose monitoring metrics.
In the subgroup, PLGS was active in two patients and LGS in 12 patients. Additional
device settings and insulin types used are provided in tables S4–S6 in the
appendix.
Discussion
Closed-loop
systems, which adjust insulin delivery based on real-time glucose measurements,
are increasingly used in diabetology and have been continuously optimised in
recent years. This retrospective, real-world study at the University Hospital
Bern evaluated glucose levels in patients with diabetes transitioning towards
more advanced insulin delivery systems. Its findings are twofold. First, glucose
levels significantly improved when switching from a sensor-augmented pump with (P)LGS
to an HCL. Second, glucose levels further improved when switching from an HCL to
an AHCL, although the added benefit of AHCL was comparably smaller.
Previous
studies comparing hybrid-closed loop therapy to sensor-augmented pumps with (P)LGS
reported an 8%–11% increase in time in range with no increased hypoglycaemia risk
[9, 10]. Our results are consistent with these findings, showing a median
increase in time in range of 6.6% (2.6%–12.7%, p <0.001) and no change in time
below range when switching from (P)LGS to HCL. The slightly smaller improvement
in time in range in our study might be explained by the real-world setting, the
already considerable glycaemic control at baseline, and/or the limited sample
size. After transitioning from an HCL to an AHCL, glucose levels improved
further (median increase in time in range of 1.6% [–0.5%–4.5%, p = 0.046]),
albeit to a smaller extent. Consistent with this, a recent study showed an
increase in time in range of around 4% when using an AHCL versus a hybrid-closed
loop system [11]. Our findings in the (P)LGS → HCL and HCL → AHCL groups were confirmed
in the
subgroup analysis of patients undergoing both transitions. In summary, the
improvement in time in range in our cohort can be regarded as clinically significant,
where 64% and 68% of the patients using the hybrid-closed loop and advanced
hybrid-closed loop systems achieved the recommended target of time in range >70%,
respectively
[12].
Consistent
with an earlier report [13], time in range notably improved at night after
transitioning to a hybrid-closed loop, mainly due to fewer external factors
influencing glucose levels, such as meals or exercise. In contrast, the switch
to an AHCL mainly resulted in improved time in range and time above range during
the day, likely due to the advanced algorithm’s ability to respond with
automated correction boluses to these external factors. In addition, AHCL systems
facilitate maintaining the automatic (closed-loop) mode, potentially
contributing to improved glucose levels among our AHCL users.
HbA1c levels remained stable after transitioning to the more
advanced insulin delivery systems. This stability is inconsistent with
our continuous glucose monitoring findings, which showed improved glucose
levels reflected by mean glucose, time in range, time above range, and GMI. This
discrepancy might be explained by continuous glucose monitoring being more holistic
in capturing glucose levels and, therefore, specific enough to detect subtle
improvements in an already well-controlled population at baseline [12]. Furthermore,
device settings with higher target glucose ranges and longer duration of insulin
action (see tables S4 and S5), resulting in a less aggressive insulin delivery
algorithm, may result in improved time in range while HbA1cis less affected.
The strength
of this study is the analysis of glucose levels in patients undergoing more
than one transition towards more advanced insulin delivery systems, unlike
previous studies that focused on single transitions or head-to-head
comparisons. In addition, the study data was collected from manually calibrated
continuous glucose monitoring sensors (i.e. before the introduction of the factory-calibrated
Guardian 4 sensor), thereby improving the accuracy of our continuous glucose
monitoring data [14]. We fully acknowledge several limitations. First, the study’s
single-centre and retrospective design does not allow for excluding selection
bias or other systematic errors. Second, its limited observation period shortly
after transition might overestimate treatment effects [15]. Third, its limited sample
size warrants validation in a larger population, which would also allow for assessing
the effect of different patient characteristics on glucose outcomes. Fourth, the
patients were mainly Caucasian males, potentially limiting generalisation to
other populations. Finally, this study evaluated changes in glucose levels with
insulin delivery systems from a single manufacturer, precluding the generalisation
of our results to other (A)HCL systems on the market.
Conclusion
While
previous studies mainly focused on head-to-head comparisons or single
transitions, our analysis provides evidence that sequential transitions towards
more advanced insulin delivery systems from one manufacturer significantly
improve time in the target glucose range in a well-controlled population with
type 1 diabetes at a Swiss tertiary hospital.
Acknowledgments
We are grateful to all patients who provided their data for this analysis. We also
thank Laura Goetschi for providing administrative support.
Author contributions: VL, FN, and TZ designed the study, analysed and interpreted the data, and wrote the
manuscript. FN collected and reviewed the data. ML, and CS critically reviewed the
manuscript. All authors approved the final draft of the manuscript for submission.
TZ is the guarantor of this work and, as such, had full access to all the data in
the study and takes responsibility for the integrity of the data and the accuracy
of the data analysis.
Vera Lehmann, MD PhD
Department
of Diabetes, Endocrinology, Nutritional Medicine and Metabolism
Inselspital,
Bern University Hospital
University
of Bern
CH-3010 Bern
vera.lehmann[at]insel.ch
References
1. Berget C, Akturk HK, Messer LH, Vigers T, Pyle L, Snell-Bergeon J, et al. Real-world
performance of hybrid closed loop in youth, young adults, adults and older adults
with type 1 diabetes: identifying a clinical target for hybrid closed-loop use. Diabetes
Obes Metab. 2021 Sep;23(9):2048–57. 10.1111/dom.14441
2. Brown SA, Kovatchev BP, Raghinaru D, Lum JW, Buckingham BA, Kudva YC, et al.; iDCL
Trial Research Group. Six-Month Randomized, Multicenter Trial of Closed-Loop Control
in Type 1 Diabetes. N Engl J Med. 2019 Oct;381(18):1707–17. 10.1056/NEJMoa1907863
3. Phillip M, et al.; Consensus Recommendations for the Use of Automated Insulin Delivery
Technologies in Clinical Practice. Endocr Rev. 2022;•••:bnac022.
4. McAuley SA, Lee MH, Paldus B, Vogrin S, de Bock MI, Abraham MB, et al.; Australian
JDRF Closed-Loop Research Group. Six Months of Hybrid Closed-Loop Versus Manual Insulin
Delivery With Fingerprick Blood Glucose Monitoring in Adults With Type 1 Diabetes:
A Randomized, Controlled Trial. Diabetes Care. 2020 Dec;43(12):3024–33. 10.2337/dc20-1447
5. Tauschmann M, Thabit H, Bally L, Allen JM, Hartnell S, Wilinska ME, et al.; APCam11
Consortium. Closed-loop insulin delivery in suboptimally controlled type 1 diabetes:
a multicentre, 12-week randomised trial. Lancet. 2018 Oct;392(10155):1321–9. 10.1016/S0140-6736(18)31947-0
6. Carlson AL, Sherr JL, Shulman DI, Garg SK, Pop-Busui R, Bode BW, et al. Safety and
Glycemic Outcomes During the MiniMed™ Advanced Hybrid Closed-Loop System Pivotal Trial
in Adolescents and Adults with Type 1 Diabetes. Diabetes Technol Ther. 2022 Mar;24(3):178–89.
10.1089/dia.2021.0319
7. Beato-Víbora PI, Gallego-Gamero F, Lázaro-Martín L, Romero-Pérez MD, Arroyo-Díez FJ.
Prospective Analysis of the Impact of Commercialized Hybrid Closed-Loop System on
Glycemic Control, Glycemic Variability, and Patient-Related Outcomes in Children and
Adults: A Focus on Superiority Over Predictive Low-Glucose Suspend Technology. Diabetes
Technol Ther. 2020 Dec;22(12):912–9. 10.1089/dia.2019.0400
8. Battelino T, Danne T, Bergenstal RM, Amiel SA, Beck R, Biester T, et al. Clinical
Targets for Continuous Glucose Monitoring Data Interpretation: Recommendations From
the International Consensus on Time in Range. Diabetes Care. 2019 Aug;42(8):1593–603.
10.2337/dci19-0028
9. Lunati ME, Morpurgo PS, Rossi A, Gandolfi A, Cogliati I, Bolla AM, et al. Hybrid Close-Loop
Systems Versus Predictive Low-Glucose Suspend and Sensor-Augmented Pump Therapy in
Patients With Type 1 Diabetes: A Single-Center Cohort Study. Front Endocrinol (Lausanne).
2022 Apr;13:816599. 10.3389/fendo.2022.816599
10. Lepore G, Scaranna C, Corsi A, Dodesini AR, Trevisan R. Switching from Suspend-Before-Low
Insulin Pump Technology to a Hybrid Closed-Loop System Improves Glucose Control and
Reduces Glucose Variability: A Retrospective Observational Case-Control Study. Diabetes
Technol Ther. 2020 Apr;22(4):321–5. 10.1089/dia.2019.0302
11. Bergenstal RM, Nimri R, Beck RW, Criego A, Laffel L, Schatz D, et al.; FLAIR Study
Group. A comparison of two hybrid closed-loop systems in adolescents and young adults
with type 1 diabetes (FLAIR): a multicentre, randomised, crossover trial. Lancet.
2021 Jan;397(10270):208–19. 10.1016/S0140-6736(20)32514-9
12. ElSayed, N.A., et al., 6. Glycemic Targets: Standards of Care in Diabetes—2023.
13. Diabetes Care. 2022;46 Supplement_1:S97–110.
14. Leelarathna L, Dellweg S, Mader JK, Allen JM, Benesch C, Doll W, et al.; AP@home Consortium.
Day and night home closed-loop insulin delivery in adults with type 1 diabetes: three-center
randomized crossover study. Diabetes Care. 2014 Jul;37(7):1931–7. 10.2337/dc13-2911
15. p. 1931-7.
16. Acciaroli G, Vettoretti M, Facchinetti A, Sparacino G. Calibration of Minimally Invasive
Continuous Glucose Monitoring Sensors: State-of-The-Art and Current Perspectives.
Biosensors (Basel). 2018 Mar;8(1):24. 10.3390/bios8010024
17. Petrovski G, Al Khalaf F, Campbell J, Umer F, Almajaly D, Hamdan M, et al. One-year
experience of hybrid closed-loop system in children and adolescents with type 1 diabetes
previously treated with multiple daily injections: drivers to successful outcomes.
Acta Diabetol. 2021 Feb;58(2):207–13. 10.1007/s00592-020-01607-4
Appendix
Glucose levels
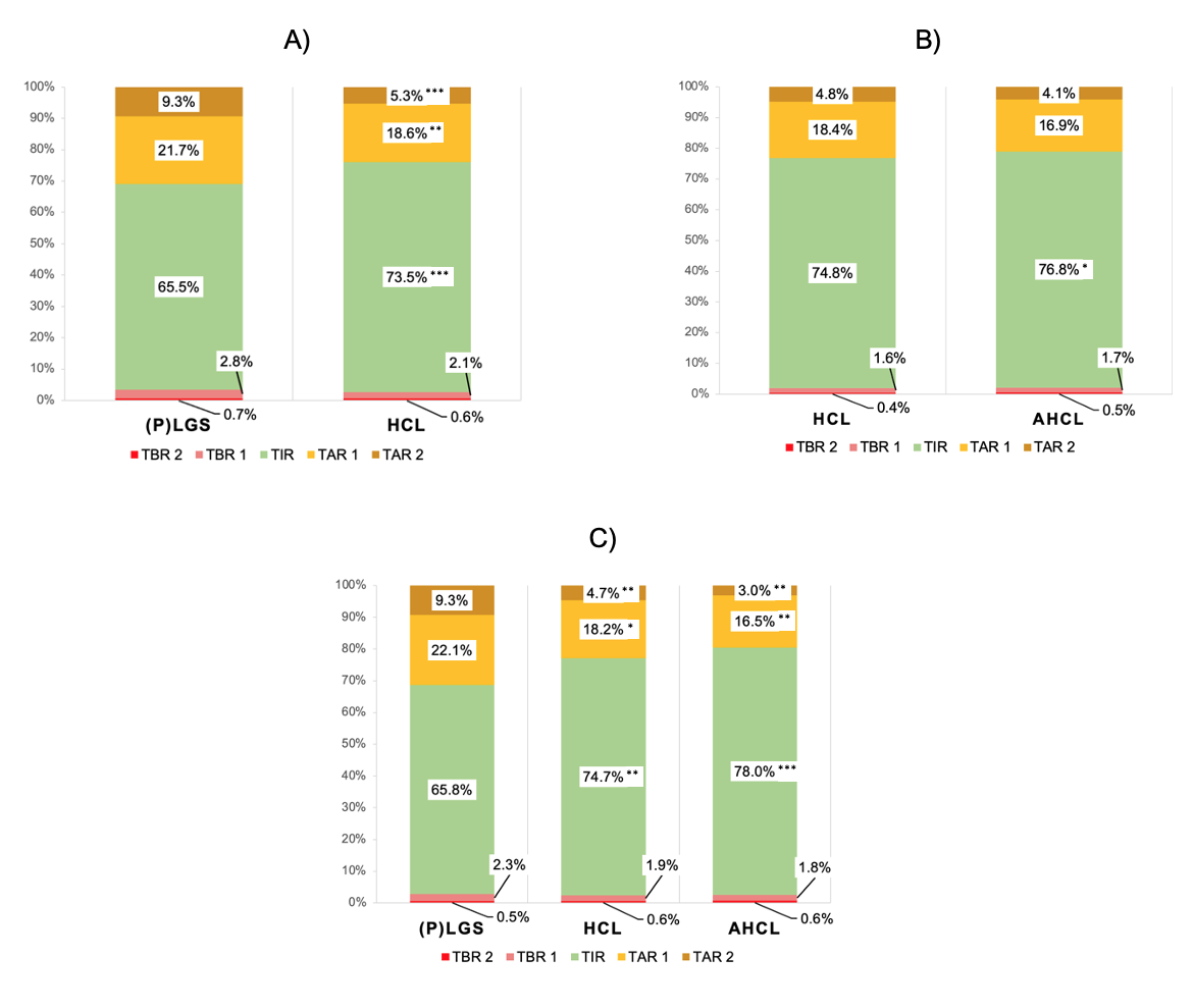
Figure S1Time
in ranges after transition. (A) Time
in range for the (P)LGS → HCL group (n = 28); (B) time in ranges for the HCL → AHCL
group (n = 28); (C) Time in ranges for the (P)LGS → HCL
→ AHCL subgroup undergoing both transitions (n =1 4). The mean times in the
respective ranges are shown.
Asterisks denote significance levels of comparing the pre vs. post period: *, p <0.05;
**, p <0.01; ***, p <0.001.
(P)LGS, predictive low-glucose suspend; HCL,
hybrid closed-loop; AHCL, advanced hybrid closed-loop; TBR 1, time below range level
1 (3.0–3.8 mmol/l); TBR 2, time below range level 2 (<3.0 mmol/l); TIR, time
in range (3.9–10.0 mmol/l); TAR 1, time above target range level 1 (10.0–13.9 mmol/l);
TAR 2, time above target range level 2 (>13.9 mmol/l).
Table S1Glucose levels in participants undergoing both
transitions (subgroup analysis, n = 14). Results are
presented as median (interquartile range). Asterisks denote significance levels
of post estimations comparing the (P)LGS period to the HCL and AHCL periods: *,
p <0.05; **, p <0.01; ***, p <0.001.
| Variable |
(P)LGS |
HCL |
AHCL |
p-value |
| TIR (3.9–10.0
mmol/l; %) |
69.4 (50.3–79.2) |
76.5 (65.3–81.3)** |
78.7 (69.7–85.8)*** |
<0.001 |
| Night (%) |
69.3 (62.4–80.4) |
84.6 (67.7–92.3)*** |
85.3 (79.5–90.0)** |
<0.001 |
| Day (%) |
69.3 (57.2–77.9) |
74.9 (64.4–82.8)** |
77.7 (68.1–85.7)*** |
<0.001 |
| TAR (>10.0
mmol/l; %) |
27.0 (20.0–45.1) |
20.7 (15.9–33.5)** |
18.1 (13.2–25.8)*** |
0.001 |
| Night (%) |
26.2 (15.0–36.6) |
12.5 (6.1–26.3)** |
13.5 (9.2–17.9)*** |
0.002 |
| Day (%) |
27.7 (18.7–40.7) |
23.1 (12.3–35.2)* |
18.8 (13.2–29.0)** |
0.001 |
| TBR (<3.9
mmol/l; %) |
2.20 (0.79–4.59) |
2.53 (1.20–3.32) |
2.58 (0.92–3.69) |
0.775 |
| Night (%) |
1.52 (0.48–4.80) |
1.15 (0.42–2.05) |
1.20 (0.39–2.45) |
0.109 |
| Day (%) |
1.98 (0.54–4.10) |
3.14 (1.06–4.01) |
2.86 (0.92–4.00) |
0.607 |
| Mean glucose
(mmol/l) |
8.35 (7.71–9.93) |
8.05 (7.60–8.91) |
7.77 (7.47–8.37)** |
0.006 |
| Night (mmol/l) |
8.17 (7.60–9.49) |
7.88 (7.15–8.47) |
7.51 (7.34–8.00)** |
0.025 |
| Day (mmol/l) |
8.54 (7.88–10.08) |
8.20 (7.49–9.27) |
7.87 (7.47–8.55)** |
0.008 |
| CV (%) |
35.5 (33.5–38.9) |
30.4 (26.8–36.9)*** |
32.6 (28.4–37.6)** |
<0.001 |
| Night (%) |
33.0 (30.0–35.1) |
26.0 (20.1–30.9)** |
28.7 (21.7–32.9)** |
0.001 |
| Day (%) |
36.1 (33.6–38.4) |
31.6 (26.9–35.5)** |
31.9 (28.6–38.8) |
0.003 |
| GMI (%) |
6.87 (6.46–7.87) |
6.67(6.40–7.22)* |
6.50 (6.31–6.88)** |
0.006 |
| Night (%) |
6.75 (6.40–7.59) |
6.57 (6.11–6.95) |
6.33 (6.23–6.65)** |
0.025 |
| Day (%) |
6.99 (6.57–7.96) |
6.77 (6.32–7.44) |
6.57 (6.31–6.99)** |
0.008 |
| HbA1c(%) |
6.85 (6.20–7.80) |
6.90 (6.50–7.60) |
6.80 (6.40–7.50) |
0.291 |
| TDD
(IU/kg/day) |
0.62 (0.52–0.74) |
0.61 (0.50–0.85) |
0.62 (0.54–0.74) |
0.339 |
| Time CGM active
(%) |
77.7 (63.7–91.3) |
88.5 (84.0–95.0)** |
90.5 (88.0–94.0)*** |
0.001 |
| Time in auto-mode
(%) |
no auto-mode |
86.5 (81.0–96.0) |
96.5 (91.0–98.0) |
- |
Population
Table S2Baseline characteristics of the study participants
before transition. Results are presented as median (interquartile range).
| |
Overall
(n = 44) |
(P)LGS → HCL group (n = 28) |
HCL → AHCL group (n = 28) |
(P)LGS → HCL → AHCL subgroup (n = 14) |
| Sex (m;
f) |
28; 16 |
20; 8 |
18; 10 |
12; 2 |
| Age
(years) |
38.5 (28.8–51.0) |
38.5 (28.5–51.0) |
38.5 (28.5–50.5) |
36.5 (26.0–48.0) |
| Weight
(kg) |
79.1 (69.8–89.3) |
80.0 (70.0–89.5) |
78.0 (70.9–90.3) |
84.6 (75.3–90.9) |
| BMI (kg/m2) |
25.8 (23.7–28.5) |
25.7 (23.7–28.5) |
25.7 (23.7–28.6) |
25.5 (23.7–28.9) |
| Diabetes type |
43 had type
1 diabetes; 1 had pancreatogenic diabetes |
27 had type
1 diabetes; 1 had pancreatogenic diabetes |
27 had type
1 diabetes; 1 had pancreatogenic diabetes |
13 had type
1 diabetes; 1 had pancreatogenic diabetes |
| Diabetes duration
(years) |
22.2 (16.0–33.6) |
22.7 (16.6–35.3) |
22.5 (16.0–28.0) |
22.0 (16.1–33.0) |
| TDD
(IU/kg/day) |
0.58 (0.48–0.69) |
0.60 (0.49–0.69) |
0.58 (0.49–0.75) |
0.62 (0.52–0.74) |
| HbA1c (%) |
6.90 (6.20–7.73); |
6.85 (6.15–7.80) |
6.95 (6.45–7.50) |
6.85 (6.20–7.80) |
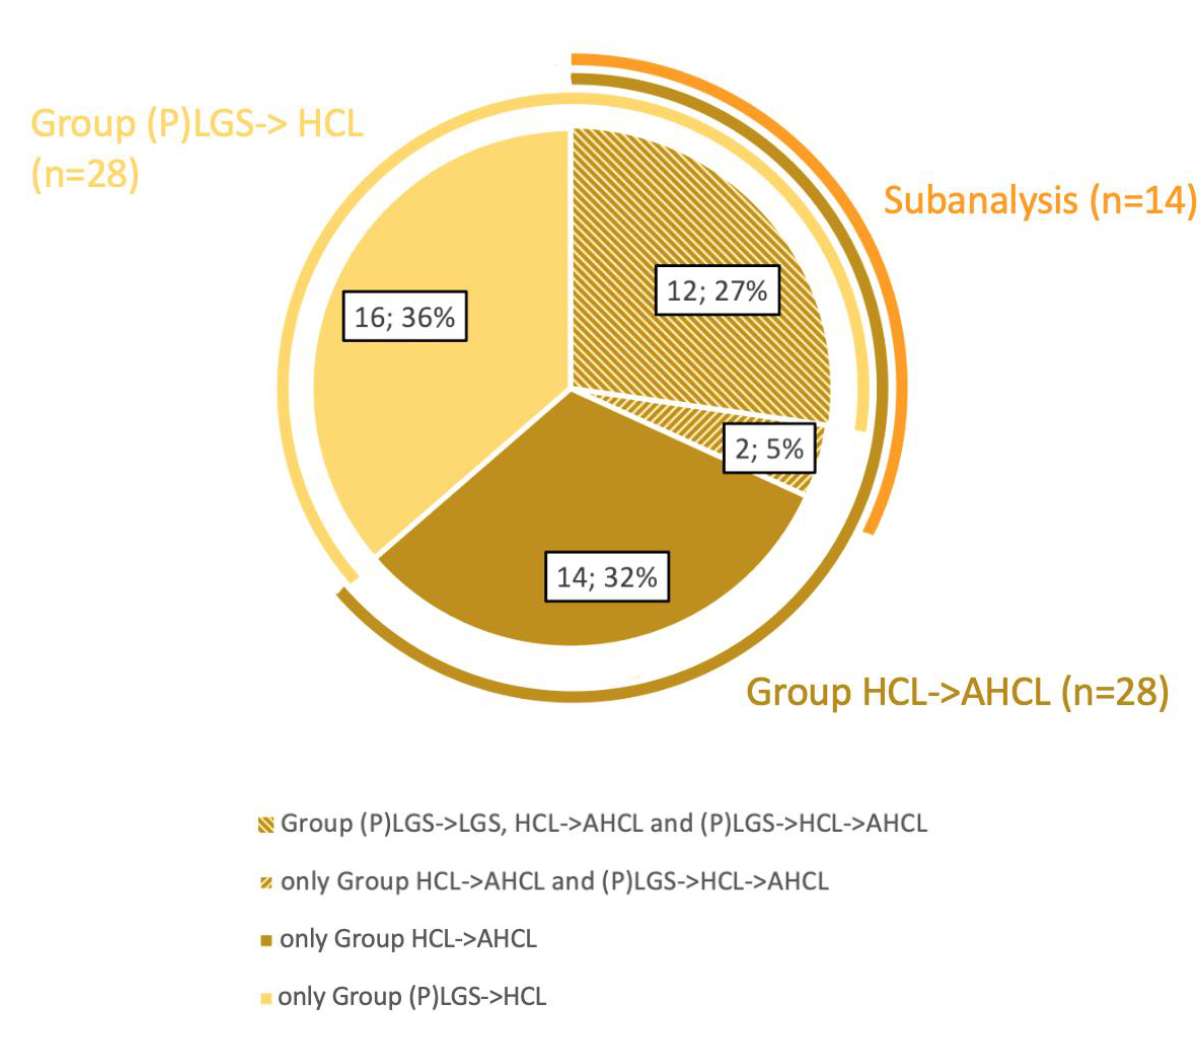
Figure S2Distribution
of study participants within the (P)LGS → HCL and HCL → AHCL groups and the (P)LGS
→ HCL → AHCL subgroup. (P)LGS, (predictive)
low-glucose suspend; HCL, hybrid closed-loop; AHCL, advanced hybrid
closed-loop.
Periods of data collection

Figure
S3Periods for inclusion of CGM data. (A) Periods
for inclusion of CGM data for the (P)LGS → HCL and HCL → AHCL groups; (B) Subanalysis
of the participants
undergoing both transitions. CGM, continuous glucose monitoring; m,
months; (P)LGS, (predictive) low-glucose suspend; HCL, hybrid closed-loop;
AHCL, advanced hybrid closed-loop; MM670G, Medtronic MiniMed 670G; MM780G,
Medtronic MiniMed 780G.
Table S3Duration between the switch and the pre/post
data collection period for CGM and HbA1c data. Results
are presented as median (interquartile range).
| (P)LGS → HCL group (n = 28) |
| |
Pre-switch |
Post-switch |
| Days
between the CGM period and the switch |
79.5 (41–137) |
132 (91.5–179) |
| Days between HbA1cand the switch |
58.5 (31–85) |
132 (91.5–179) |
| HCL → AHCL group (n = 28) |
| |
Pre-switch |
Post-switch |
| Days
between the CGM period and the switch |
38 (5–71) |
152.5 (98.0–190.5) |
| Days between HbA1cand the switch |
61.5 (33.5–77.5) |
156 (112.5–190.5) |
| (P)LGS → HCL → AHCL subgroup (n = 14) |
| |
Pre-switch
1 |
Post-switch
1 |
Pre-switch
2 |
Post-switch
2 |
| Days
between the CGM period and the switch |
70.5 (45–94) |
655 (492–724) |
33.5 (2–70) |
136 (79–167) |
| Days between the HbA1cand the switch |
53.5 (37–71) |
636 (492–722) |
65.5 (33–79) |
152.5 (82–180) |
Device settings and insulin type
Table S4Target glucose values during the advanced
hybrid closed-loop (AHCL) periods in the HCL → AHCL group and the (P)LGS → HCL → AHCL
subgroup.
| Target value during AHCL |
HCL → AHCL group
(n = 28) |
(P)LGS → HCL → AHCL subgroup
(n = 14) |
| 5.5 mmol/l |
16 |
6 |
| 6.1 mmol/l |
7 |
6 |
| 6.7 mmol/l |
5 |
2 |
Table S5Active insulin time.
| |
(P)LGS → HCL group (n = 26) |
HCL → AHCL group
(n = 28) |
(P)LGS → HCL → AHCL subgroup (n = 14) |
| Active insulin time |
(P)LGS |
HCL |
HCL |
AHCL |
(P)LGS |
HCL |
AHCL |
| 120 min |
5 |
7 |
11 |
10 |
5 |
5 |
6 |
| 135 min |
- |
- |
1 |
- |
- |
- |
- |
| 150 min |
2 |
4 |
5 |
9 |
1 |
3 |
3 |
| 180 min |
11 |
12 |
9 |
7 |
4 |
5 |
3 |
| 210 min |
1 |
2 |
1 |
1 |
1 |
1 |
1 |
| 240 min |
3 |
1 |
1 |
1 |
3 |
- |
1 |
| 300 min |
1 |
- |
- |
- |
- |
- |
- |
| 330 min |
- |
- |
- |
- |
- |
- |
- |
| 360 min |
3 |
- |
- |
- |
- |
- |
- |
Table S6Insulin type used.
| Insulin |
(P)LGS → HCL group
(n = 28) |
HCL → AHCL group
(n = 28) |
| Ultra-rapid insulin aspart (for
all periods) |
14 |
21 |
| Insulin lispro (for all
periods) |
5 |
1 |
| Insulin aspart (for all
periods) |
3 |
1 |
| Insulin lispro → ultra-rapid insulin aspart |
1 |
1 |
| Insulin aspart → ultra-rapid insulin aspart |
5 |
1 |
| Ultra-rapid insulin aspart → insulin aspart |
0 |
2 |
| Unknown → ultra-rapid insulin aspart |
0 |
1 |
| Insulin |
(P)LGS → HCL → ACHL subgroup (n = 14) |
| Ultra-rapid
insulin aspart (for all periods) |
10 |
| Insulin aspart
(for all periods) |
1 |
| Insulin lispro
→ Insulin lispro → ultra-rapid insulin aspart |
1 |
| Insulin lispro
→ ultra-rapid insulin aspart → ultra-rapid insulin aspart |
1 |
| Insulin aspart
→ insulin lispro → insulin aspart |
1 |