
Figure 1Distribution of the roles of participants responding to the survey.
DOI: https://doi.org/https://doi.org/10.57187/s.3487
Telemedicine has a strong focus on communication. Therefore, it is not surprising that telemedicine has been applied and well described in palliative care settings [1, 2]. Telemedicine, the use of digital communication tools in medicine, belongs to the broad field of digital health interventions, as defined by the World Health Organization [3]. Four applications exist: consultations between healthcare providers and clients (i.e., virtual visits), remote monitoring, the transmission of medical data (i.e., sending vitals via a smartphone) and case management by healthcare providers (i.e., via a digital care conference) [3].
The three main goals of palliative care are (a) to optimise symptom relief, (b) to optimise functioning and (c) to prolong survival with an optimal balance of disease-modifying treatment and quality of life [4]. The successful implementation of these goals requires good knowledge of the needs and objectives of patients and their caregivers and excellent interprofessional coordination. The basis of these two important elements is communication.
In palliative care, the proven benefits of telemedicine, mainly in countries with large geographical distances, are closely related to good communication and coordination between patients, caregivers and healthcare professionals (HCPs) [5]. The reduction of symptom severity, especially for psychological symptoms, has been described as a benefit of telemedicine. However, this is less well proven [2]. Although the effect on functioning has been described as non-inferior to physical rehabilitation in other fields, such as post-stroke rehabilitation, this effect has not been proven in palliative care [6]. Additionally, cost reductions can occur, mainly due to reduced travel expenses [7].
Few studies have addressed the needs of patients, caregivers and healthcare professionals regarding telemedicine tools. In our scoping review, we concluded that needs are, in general, poorly investigated before the implementation of such tools [5]. An analysis of the literature showed that most patients value the following three features highly: (a) good communication, (b) good coordination, and (c) technical reliability [5]. Therefore, this can be a starting point for a structured needs assessment with a well-conceptualised tool, such as the framework of AlDossary et al. [8]. This publicly available framework describes a structured two-phase approach to developing telemedicine tools based on the needs of patients/clients. First, mixed methods evaluate availability, needs, accessibility and perceptions. Second, potential telemedicine solutions are defined by balancing the needs and priorities of the community with resources [9].
On a local level, the preliminary work of our group for the epall.ch quality improvement project [5, 10] concluded that, for our local setting, the most useful applications seem to be virtual visits and digital care conferences [11]. The lifting of COVID-19 restrictions further highlighted digital care conferences as the most promising tool for increasing the quality of care. Digital care conferences allow professional coordination and case management via a video conference in the presence of the patient and her/his family [12].
The perceptions and needs of patients, caregivers and health professionals in a local palliative care network concerning these digital care conferences are unknown. Additionally, the internationally available literature can only be partially applied to the local setting of a palliative care network in a canton in Switzerland. The uncertainty of whether these tools are accepted and needed in the local palliative care setting makes a study of perceptions and needs logical. Therefore, we designed a survey for palliative outpatient care that focused on healthcare professionals (nurses and physicians) while they initiated and led these care conferences.
The objective of this survey was to identify the perceptions and needs of healthcare professionals (nurses and physicians) regarding telemedicine (digital care conferences) in our local palliative care outpatient network.
This survey is part of the planning phase of a larger quality improvement project informed by the Plan–Do–Check–Act cycle, which targets effectiveness, patient-centredness and efficiency [13].
A cross-sectional online survey was conducted using purposive typical-case sampling and a purpose-built questionnaire on the secure online platform LamaPoll.de™. The analysis comprised mixed methods: a quantitative analysis of multiple-choice questions and an analysis of free-text answers with content analysis.
No validated questionnaire exists to assess telemedicine tools in palliative care [14, 15]. Therefore, a purposeful questionnaire was developed according to the framework of Boynton et al. [16–18]. The survey’s content was partially informed by phase one of the framework proposed by AlDossary [9] and used modified elements of the telecare perception questionnaire from Demiris et al. [19]. The questions about needs were deduced from the results of our scoping review [5].
The survey comprised three sections: three introductory questions (profession, gender and age); six general questions about digital conferences (including usefulness and risk); and eight questions about digital care conferences (including acceptance, feasibility and needs). The questionnaire was developed following a pilot test conducted with 12 healthcare professionals. The details of the participants and the main changes to the questionnaire during the pilot phase are explained in the appendix. The supplementary file available for download at https://doi.org/10.57187/smw.2023.40123 contains the draft and the post-pilot, final version of the survey.
The questions about digital care conferences focused on perceptions and included questions about perceived acceptance and feasibility (including free-text answers) and advantages. Furthermore, the participants’ opinions about who should attend and who should lead the discussions were recorded. Finally, the subjects were asked about their feelings and needs regarding digital care conferences, with the themes of communication, coordination and technical aspects, including free-text answers.
A descending-order 5-point Likert scale was used, with 1 being very favourable (“fully agree” or “very useful”) and 5 being most unfavourable (“do not agree at all” or “not useful at all”) towards the statement in the question.
The population was a purposeful sample of physicians (primary care, specialist, palliative care) and nurses (home care, home care with training in palliative care, specialised palliative care) associated with the local palliative care service/network Mobile Palliative Care Service Bern Area (rural and urban). This specialised mobile palliative care (PC) care team serves a population of 390,000, 15 acute-care hospitals (one university hospital) [20] and all the nursing homes of the region. It is the specialist palliative care nursing reference service for 11 home care nurse teams (Spitex), providing the second-line service to about 300 new patients per year (the primary home care teams, some with palliative care training, provide the first-line service). With a full-time equivalent of 7 nurses and 1.3 physicians, specialised palliative care support is offered, with a 24/7 on-call service.
Purposeful sampling is well suited for the purpose of this quality improvement study because it addresses a specific group of healthcare professionals within a network in a non-random and non-probabilistic manner.
The main inclusion criteria were (a) being a palliative care specialist actively working in the local care network (specialised palliative care healthcare professionals [specialised PC HCPs]) or (b) being a healthcare professional (primary care physician, specialist physician [oncologist] or home care nurse) with recent (less than 12 months) active clinical cooperation with the service (general palliative care healthcare professionals [general PC HCPs]). No exclusion criteria were applied. No preliminary sample size was calculated due to the exploratory nature of the survey.
Following a pre-information email to the participants, the survey was administered on 6 July 2022, via email using the serial letter function of Microsoft Word™ and Microsoft Outlook™. The tools used for the survey (LamaPoll.de) comply with European data protection laws and provide anonymisation by default. The one-time cryptolink concealed in the individual raw data also protected against multiple participation. The survey’s duration was 40 days, from 6 July 2022 to 15 August 2022; a single reminder was issued on 22 July 2022.
The design complied with Swiss ethics for quality improvement projects [21]. The survey was entirely anonymous and did not include health-related data from the participants or patients. The local ethics committee waived full ethical approval (Req-2022-0745). Nonetheless, general GCP rules were followed, the modified project plan and major steps were documented in an audit trail and the data were stored on a secure server.
The study followed an internal review study protocol that was not published due to its local character. The key achievements and deviations from the protocol (none) were traced in an audit trail. Due to the local character of the study, the raw data, especially the qualitative data, are not publicly available. Nonetheless, the appendix includes all aggregated quantitative data.
All data were analysed descriptively, providing the median, interquartile range (IQR) and range for skewed distributed data. For between-group comparisons, a non-parametric test (Mann–Whitney U) was conducted using SPSS™ Version 29.0. Normally distributed data are presented with the mean/standard deviation (SD) and the t-test for comparing groups. There was a chi-square goodness-of-fit test for binomial variables. Significance was defined by a p-value <0.05; detailed p-values were provided when the results were significant. The following groups were compared: nurses vs physicians and general PC HCP vs specialised PC HCP. The number of missing values per item was variable and very low (n = 0–3, less than 5%). The number of participants is mentioned in figure captions, and details can be consulted in the tables S1–S7 in the appendix.
The free-text answers were analysed with MAXQDA2022 using a directed content analysis technique with mixed manifest/latent coding of the data. In this method of qualitative research, the data are analysed in their original wording when clear and unequivocal statements are given. The content (latent interpretation) is interpreted when the statements clearly allow interpretation, that is, analogies or description of examples. Codes were generated with a directed/deductive approach based on preliminary categories and codes informed by the authors’ previous work [5, 11, 12]. In general, content analysis suits the analysis of free-text responses well, because the data (answering text)are usually short and summative, leaving only a moderate margin for interpretation, and content analysis allows quantification of the codes. The analysis followed the standard procedure of content analysis by (a) immersion in the data, (b) the identification and labeling of codes and (c) the grouping of the codes into categories. For a detailed explanation of the content analysis methods, we refer readers to Kleinheksel et al. [22] and Hisieh and Shannon [23]. One coder (ASE), who has experience in qualitative research, performed the initial qualitative data analysis. MM, who is highly experienced in qualitative research, checked the codebook for consistency, and diverging opinions were solved by discussion. SE served as a second code reviewer in unclear situations. The frequency of the codes was analysed to rank their importance. The entire sample was analysed without applying sufficiency or saturation criteria.
A total of 251 eligible healthcare professionals were invited to participate in the survey, including 26 (HCPs) in the Mobile Palliative Care Service (specialised PC HCPs, including 10 nurses and 16 physicians) and 225 HCPs as associated professionals (169 general practitioners [GPs], 19 oncologists and 37 home care nurses [with and without palliative care training]). Of the 251 healthcare professionals invited, 183 did not respond and 2 declined to participate. This resulted in 66 analysable responses and an overall response rate of 26.5% (n = 249).
Eighteen of the specialised PC HCPs (n = 26) replied, resulting in a return rate of 69.2%. Of the general PC HCPs (n = 225), 48 replied, resulting in a return rate of 21.3%. Figure 1 shows the proportions of the participants’ roles. The response rate was lower in the physician group than in the nurse group (78.2 vs 14.2%).
Figure 1Distribution of the roles of participants responding to the survey.
Nurses (n = 27) and physicians (n = 21) were equally represented in the general palliative care group (n = 48; 56.3% vs 43.7%) and the specialised palliative care group (n = 18; 55.6% vs 44.4%). Female HCPs outnumbered their male colleagues in both groups. The mean age was similar in both the general and specialised palliative care HCP groups (46.7 vs 47.1 years; p = 0.289). The youngest participant in the general group was about 10 years younger than in the specialised palliative care group (with an age range of 22–68 vs 34–63 years).
More HCPs in the specialised group were already using telemedicine tools (27.9% vs 6.3%, p = 0.017 [Χ2]). The tools used (n = 15) were Zoom® (n = 6), Webex® (n = 4), Microsoft Teams® (n = 1), other (n = 2, phone) and HIN® videoconferences (n = 1). Table 1 summarises the characteristics of the groups.
Table 1 Demographics of respondents and preliminary use of telemedicine.
| General palliative care healthcare professionals (n = 48) | Specialised palliative care healthcare professionals (n = 18) | ||
| Profession | Nurse | 27 (56.3%) | 10 (55.6%) |
| Physician | 21 (43.7%) | 8 (44.4%) | |
| Sex | Female | 34 (70.8%) | 13 (72.2%) |
| Male | 14 (29.2%) | 4 (22.2%) | |
| Other | 1 (5.6%) | ||
| Age (y) | 46.71 Range 22–68 SD (10.6) | 47.06 Range 34–63 SD (9.6) | |
| Has ever used telemedicine | 3 (6.3%) | 5 (27.9%) | |
| Tools used (n = 15) | HIN.ch® | 1 (6.7%) | |
| MS Teams® | 2 (13.3%) | ||
| Webex® | 4 (26.7%) | ||
| Zoom® | 6 (40.0%) | ||
| Others | 2 (13.3%) | ||
All telemedicine applications were rated “useful” (median = 2). Digital care conferences, digital data transmission and digital education/training received the highest “very useful” rating (>40%). See figure 2.
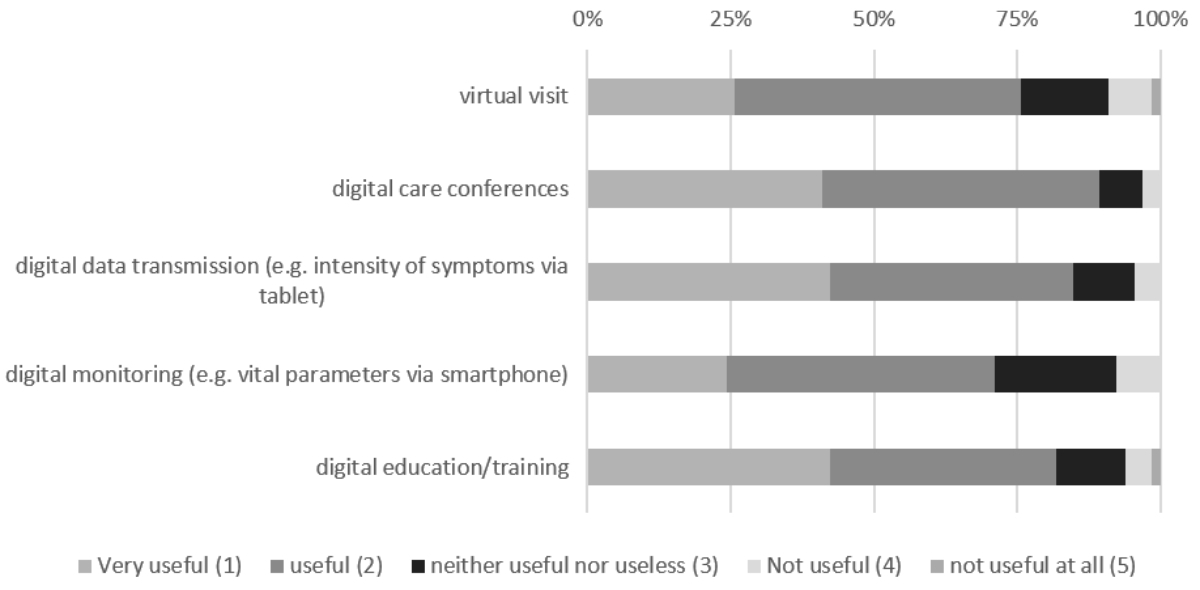
Figure 2Perceived usefulness of telemedicine in general.
Comparing the specialised PC HCP to the general PC HCP group, the palliative care specialists perceived digital care conferences (1 [1; 1–3] vs 2 [1;1–4], p = 0.045) and digital education/training (1 [1; 1–4) vs 2 (1; 1–5, p = 0.029) as more useful than their non-specialised peers (see figures S1 and S2 in the appendix).
These differences were less marked between physicians and nurses. The physicians ranked the usefulness of digital education higher than the nurses did (1 [1; 1–3] vs 2 [1; 1–5]). Table S1 in the appendix provides the detailed results.
All the participants agreed (median = 2) that the following risks are relevant: (a) technical problems, (b) a lack of billing, (c) a risk of a data leak, (d) a lack of physical contact and (e) a lack of acceptance (figure 3).

Figure 3Perceived risks of telemedicine (all types included) of 66 healthcare professionals.
Comparing the general palliative care HCPs with the specialised palliative care HCPs, the specialists tended to be slightly less concerned about the lack of billing (3 [1; 1–4] vs 2 [2; 1–4]), data leaks (2.5 [1; 1–4] vs 2 [1; 1–5]) and the lack of acceptance by patients and caregivers (3 [1; 1–5] vs 2 [1; 1–5]). See figures S3–S5 in the appendix.
More nurses fully agreed that technical problems could be an issue (40.5% vs 17.2%), (2 [1;1–4) vs 2 [1;1–4], p = 0.024). See figure 4.
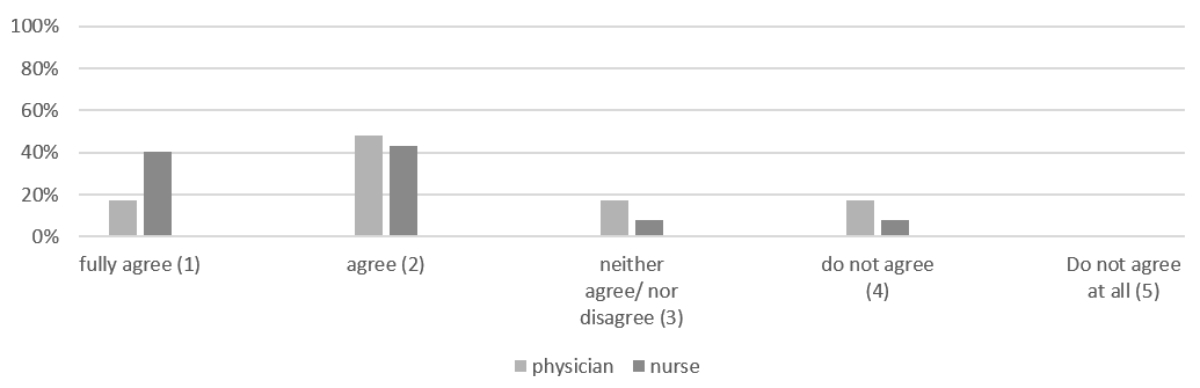
Figure 4Technical problems as an obstacle to telemedicine, perceptions of physicians (n = 29) and nurses (37).
The detailed results can be viewed in table S2 in the appendix.
Concerning “Risk, barriers and opportunities of telemedicine in general”, 25 comments (37%) were received. More nurses commented than physicians (16 [43.34%] vs 9 [31%]) and, proportionally, the specialised PC HCPs provided slightly more comments than the general PC HCPs (10 [55.6%] vs 15 [37.5%]).
Two categories were predefined: “Opportunity” and “Risk”. In the “Opportunity” category (figure 5), statements coded for “improved communication” (n = 6) predominated. “Improved coordination”, “improved access” and “tools for exceptional situations” ranked the same (n = 3). “Travel savings” and interestingly “time saving” ranked last.
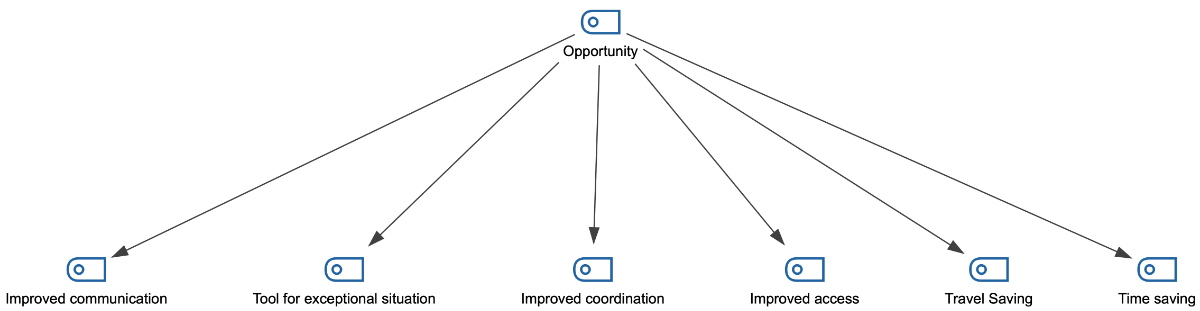
Figure 5Code-Map of the “Opportunities” category (hierarchical code-subcode Model).
Typical comments about “improved communication” were as follows:
Concerning the other codes:
In the “Risk” category (figure 6), statements about “lack of physical contact” were frequent (n = 11). “Technical barriers” were the next concern (n = 6), followed by “lack of financial compensation” (n = 3), lack of acceptance by patients (n = 2) and risk of technology (n = 2). “Lack of ethical standards”, “Relationship with patient” and “IT security” ranked last (n = 1).
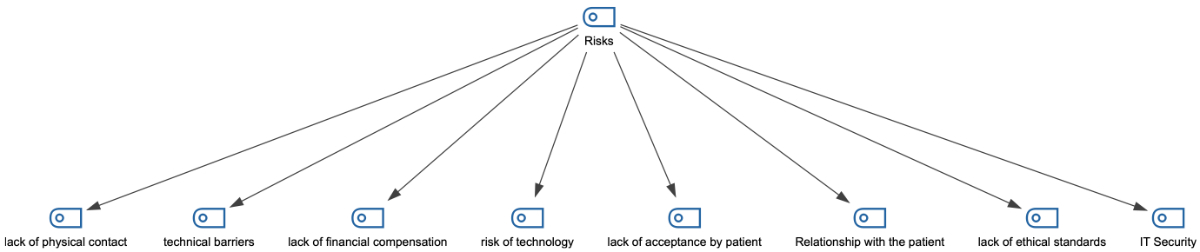
Figure 6Code-Map of the “Risk” category (hierarchical code-subcode Model).
Comments on the “lack of physical contact” were typical:
Typical comments for the other codes concerning the “Risk”category were as follows:
Acceptance by the HCPs was good overall (2 [1; 1–3]). The HCPs judged acceptance by their patients and caregivers to be good (2 [1; 1–4]). Interestingly, the HCPs judged acceptance more often to be neutral (“neither good/nor bad” or “bad”) in their patients (32.8%, 14.1%, respectively) and their caregivers (26.6%, 7.81%, respectively) than for themselves (“neither good/nor bad”; 21.8%). See figure 7.

Figure 7Perceived acceptance of digital care conferences by 64 healthcare professionals (missing = 2).
There were differences between the general and specialised PC HCP groups concerning patients’ perceived acceptance. Patients’ acceptance was rated higher by the specialised HCP (“good” 2 [2; 1–4]) than by their general peers (“neither good/nor bad” 3 [1; 1–4], p = 0.012) (figure 8). The nurses judged acceptance by their patients higher than the physicians did (2 [1; 1–4] vs 3 [1; 1–4]). See figure 8. Table S3.1 in the appendix details the results.

Figure 8Different perceptions of the acceptance of telemedicine from patients (specialist palliative care healthcare professionals [PC HCPs] [n = 17], general PC HCPs [n = 47], physicians [n = 29] and nurses [n = 35]; missing [n = 2]).
The participants generally judged the feasibility of digital care conferences in their profession to be good (2 [1; 1–5]). Interestingly, 35% of the HCPs were neutral or critical about feasibility. The physicians perceived the feasibility of digital care conferences as more persistently “good” (2 [0; 1–4]) than did the nurses, whose answer range was larger (2 [1; 1–5]). See figure 9. Table S3.2 in the appendix shows the detailed results.
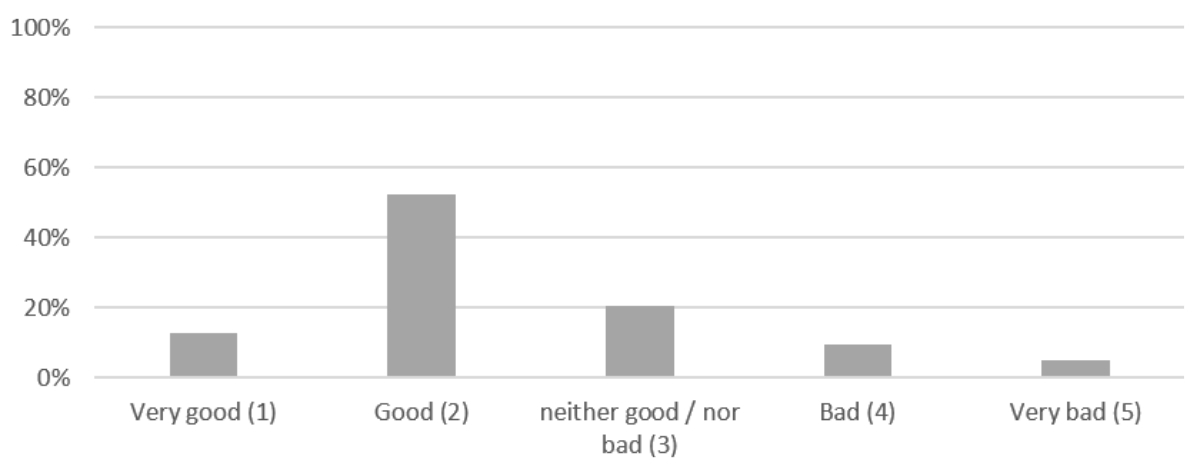
Figure 9Perceived feasibility of digital care conferences by 63 healthcare professionals (missing n = 3).
Free-text comments described the reasons for these views on feasibility. Short comments were given by 50 participants (75.8%). Again, slightly more nurses commented than physicians (29 [58%] vs 21 [42%]), and the HCPs in the general palliative care group left more comments than those of the specialised group (38 [76%] vs 11 [22%]).
Two categories were predefined: “Factors increasing feasibility” and “Threats to feasibility”.
The highest-rated “Factors increasing feasibility” were access to digital tools (n = 14) and good planning (n = 11), followed by ease of use (n = 3), good user experience, clear distribution of responsibility and experience during the COVID-19 pandemic (n = 2). See figure 10.
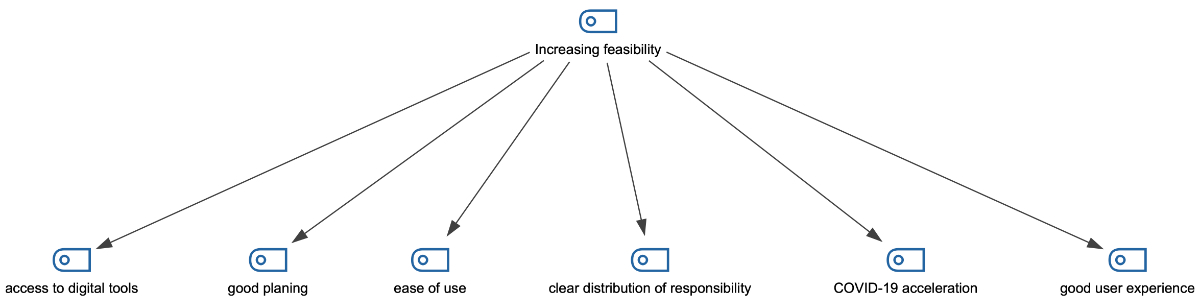
Figure 10Code-Map of the “Factors increasing feasibility” category (hierarchical code-subcode Model).
Typical quotes about “access to digital tools” were as follows:
Comments about “good planning” critically highlight the importance of good planning to facilitate the conference.
“Threats to feasibility” mentioned were a lack of experience with digital tools (n = 11), technical problems/limitations (n = 7) and a lack of physical contact (n = 7). A few participants mentioned a lack of resources (n = 2), the risk of a security breach (n = 1) and frail patients (n = 1). See figure 11.

Figure 11Code-Map of the “Threats to feasibility” category (hierarchical code-subcode Model).
Typical quotes highlighting the “lack of experience with digital tools” were as follows:
Quotes depicting concerns about technical limitations usually addressed a lack of devices or connection:
The lack of physical contact is also presented as a threat to feasibility. The following two quotes describe this concern:
The HCPs agreed that digital care conferences could increase understanding, save time and money and improve coordination and communication between professionals (median = 2). See figure S6 in the appendix. The “saving money” item was viewed as the least critical. Table S4 in the appendix demonstrates the detailed results.
The patient (1 [1; 1–3]), the specialised palliative care nurse (1 [1;1–3]), the home care nurse with training in palliative care (1 [1;1–4]), the primary care physician (1 [1;1–4]) and the palliative care physician (1 [1:1–4]) were among the first choices as participants in the conference. Home care nurses (without palliative care training) (2 [1; 1–3]), specialist physicians (2 [1; 1–5]) and caregivers (2 [1;1–3]) ranked second, but were still considered important participants (figure 12).
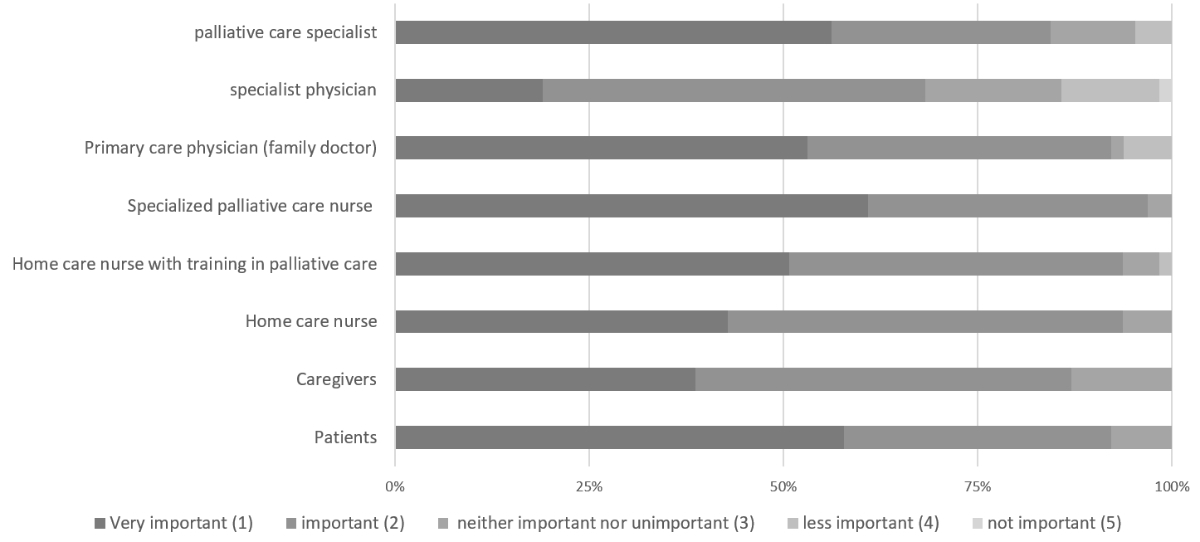
Figure 12Preferences for participants in the digital care conferences by 64 healthcare professionals (missing per item = 2–4, no exclusions).
Minor, nonrelevant disparities were present between the groups (specialised vs general palliative care providers, physicians vs nurses). See table S5 in the appendix.
The specialised palliative care nurse was the main choice of the survey participants to lead the care conference (median 3 [1; 1–6]). See figure 13.
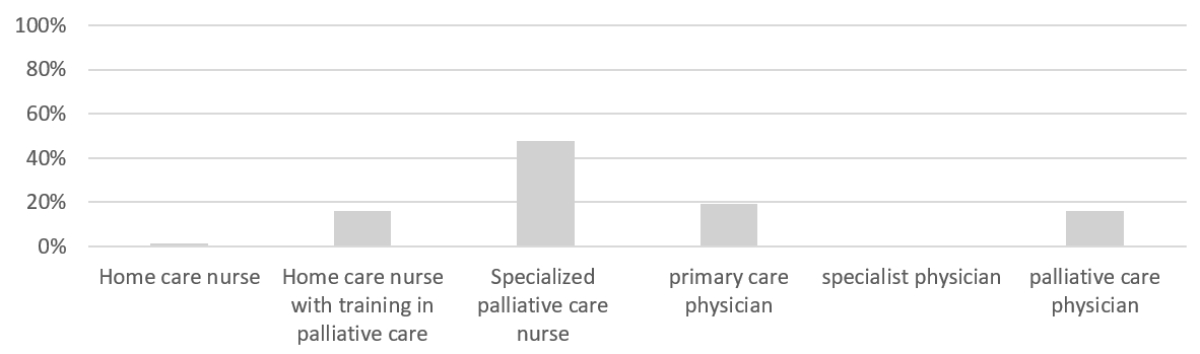
Figure 13Preferences for leader of the digital care conference by 63 healthcare professionals (missing per item = 3, no exclusions).
Interestingly, the general palliative care HCPs wanted the specialised nurse to be the leader, while the HCPs working in a specialised palliative care role preferred the primary care physician to lead (3 [0; 1–6 vs 4 [3; 3–6]). See figure S6 in the appendix.
The nurses preferred to have a nurse lead the conference (71.4%). The physicians also revealed a preference for a nurse leader (57.2%), and the main preference (specialised nurse in palliative care) remained the same among all participants (see figure S7 in the appendix). Specialist physicians were not considered for leading the conference (0% of all groups). Table S6 in the appendix depicts the detailed results.
The HCPs rated being able to see the patient (1 [1; 1–4]), goal setting (1 [1; 1–3 ]), coordination of care (1 [1; 1–2]), easy access/operation (1 [1; 1–3]) and privacy (1 (1; 1–4]) as very important. A clear timeframe (2 [1; 1–4]) and the possibility of seeing the other professional (2 [2; 1–5 ]) were ranked second but still considered important (figure 14).
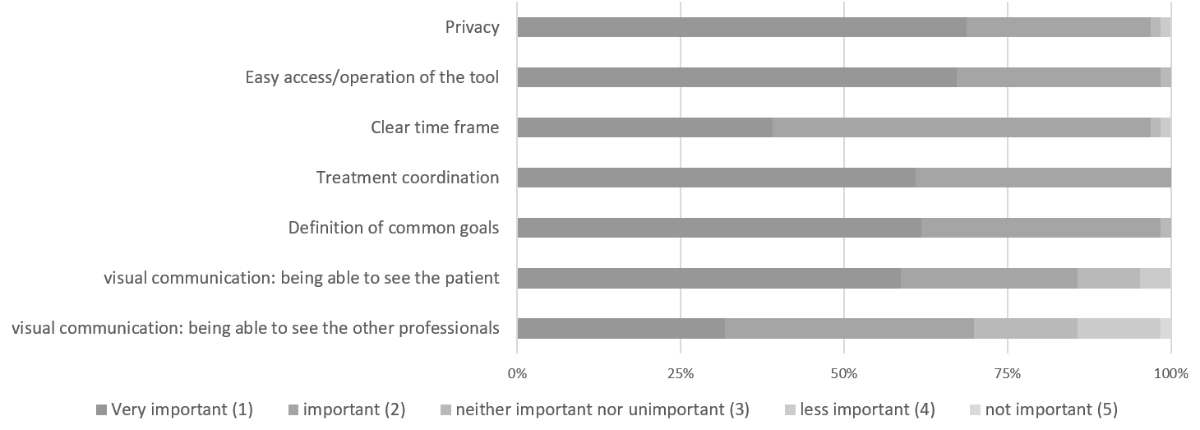
Figure 14Priority of needs concerning the digital care conference by 64 healthcare professionals (missing = 2).
Although the median response was similar between the specialised and general HCPs, the specialised professionals ranked visual communication (76.5% vs 52.2%), a common goal (82.4% vs 54.3%, p = 0.042), coordination (76.5% vs 55.3%) and a clear timeframe (47.1% vs 36.2%) as very important more often than important. No obvious differences were found between nurses and physicians. Table S7 in the appendix displays the detailed results.
Within the three predefined categories (Communication, Coordination and Technical usability), most codes (n = 10) concerned the “Coordination” category. Figures 15–17 demonstrate the Code-Maps.
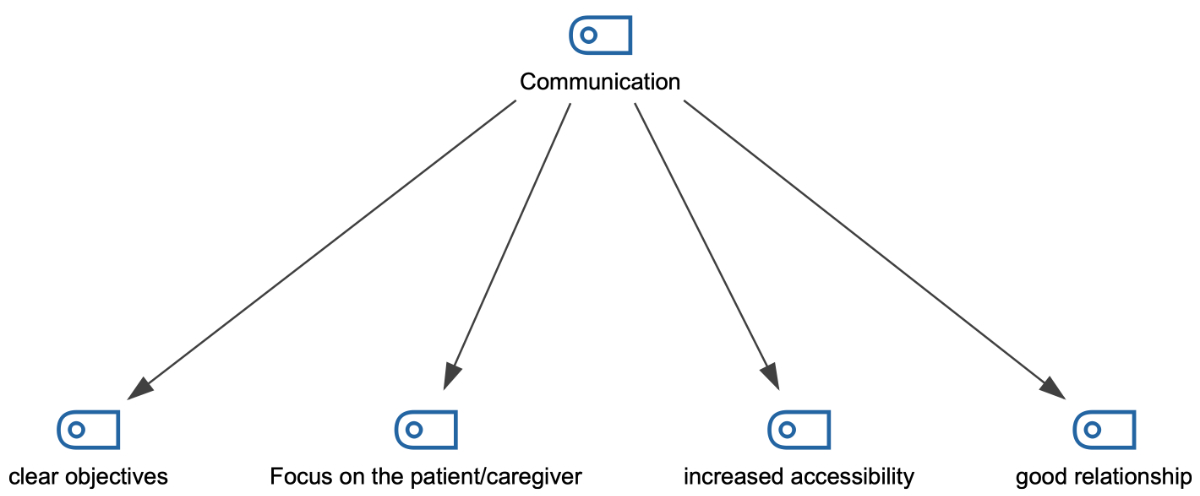
Figure 15Code-Map of the “Communication” category of the free-text question addressing the needs (hierarchical code-subcode Model).

Figure 16Code-Map of the “Coordination” category of the free-text question addressing the needs (hierarchical code-subcode Model).
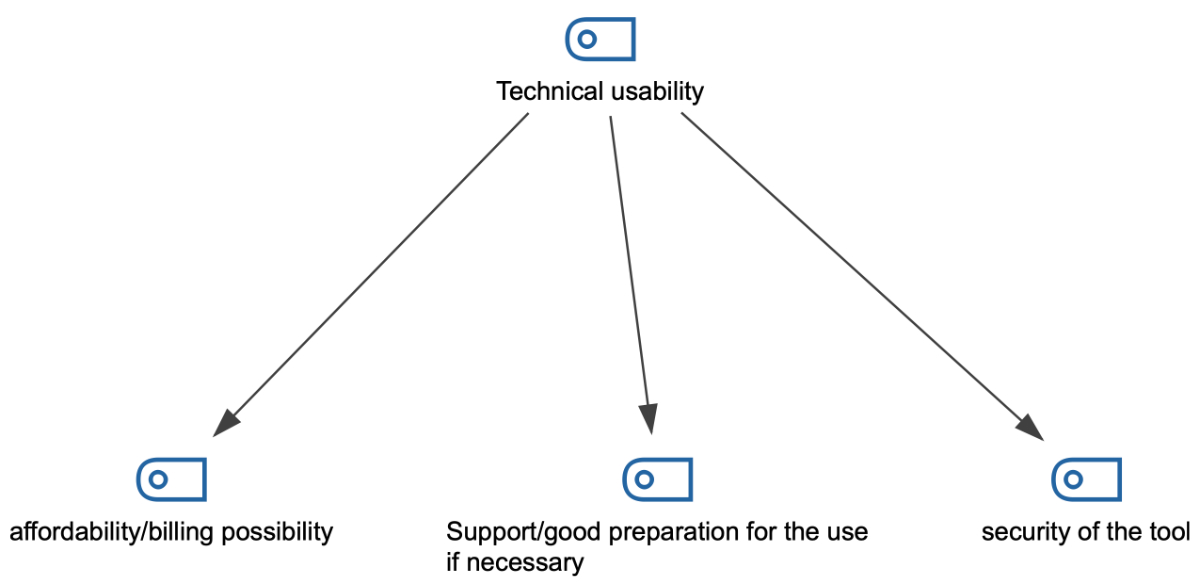
Figure 17Code-Map of the “Technical usability” category of the free-text question addressing the needs (hierarchical code-subcode Model).
In the “Coordination” category (figure 16, statements mostly related to resource planning (n = 6), adaptation to the setting (n = 3) and interprofessional collaboration (n = 1).
Quotes especially highlighted the importance of a selection of participants in accordance with the problem/situation, as the two following examples show:
In the “Communication” category (figure 15), the comments highlighted clear objectives (n = 1), a focus on the patient (n = 1), accessibility (n = 1) and a good relationship with the patient (n = 1), as the following exemplary quote shows:
In the “Technical usability” category (n = 4) (figure 17), statements about the affordability/billing possibility (n = 2) and the security of the tool (n = 1) were highlighted, as well as the necessity of good preparation (n = 1).
The results demonstrated that telemedicine was perceived as useful in a Swiss local palliative care network, although prior exposure to digital communication tools in clinical practice was low (6.3% for the general PC HCPs and 26.9% for the specialist PC HCPs). The participants judged digital care conferences, digital education and data transmission to be very useful and agreed on the common risks (lack of acceptance, lack of physical contact, data breaches and technical obstacles). Improved coordination and communication were the most frequently mentioned opportunities.
Concerning digital care conferences, acceptance and feasibility were good. Priority was given to the presence of the specialised PC HCP (nurse and physician), the primary physician and the home care nurse with training in PC. The survey’s participants thought that the conference should be led by the specialist palliative care nurse or the primary care physician. Important needs for healthcare professionals were a visual connection with the patient, the coordination of care and the correct functioning of the tool.
The low use of telemedicine tools in general can be explained by Swiss healthcare professionals’ critical views on digitalisation [24]. Significantly more specialised HCPs had ever used telemedicine tools in their daily work than the general HCPs. The reason could be ever-changing situations and the desire of patients to stay at home, leading to the ad hoc use of telemedicine tools. The tools employed were secure, but most were not specifically designed for healthcare use.
Regarding perceived usefulness, all types of telemedicine and digital education received a useful rating, which is surprising, as physicians are usually critical of these tools. Interestingly, the ratings for virtual visits were lower than for digital interprofessional meetings or digital education. One reason could be that peer-to-peer telemedicine and digital education do not entail concerns about the lack of physical contact or the possibility of examining the patient [25].
The risks of and barriers to telemedicine are numerous and well described [26–29] and typically include concerns about acceptance, the lack of physical contact, data security and technical issues, and the lack of billing possibilities. Therefore, it is not unusual that these were also found in this survey. The lack of billing remains a concern because there is no specific billing possibility in the Swiss medical tariff system (TARMED).
The highlighted opportunities (coordination and communication) corroborate the literature [5, 25]. Interestingly, some participants highlighted the potential for telemedicine and virtual visits as a backup solution for regular care in exceptional care situations, which could be interpreted as telemedicine tools serving only as backups when regular care is not possible. This contradicts a recent NEJM Catalyst survey describing the potential of telemedicine for many standard situations [30].
HCP acceptance (80%) was good, which is consistent with the results of the actual use of these tools. Interestingly, the participants, especially the physicians and the general PC HCPs, perceived acceptance by their patients and respective caregivers to be lower than their own. With the limitation that a direct survey with patients/caregivers was not administered, our interpretation is that this reflects a certain prudence and uncertainty concerning acceptance by patients/caregivers.
Judgements about feasibility and advantages were good, and the facilitators and barriers were congruent with examples in the literature [29, 31]. Interestingly, one statement, the lack of experience with digital tools, emerged as a sign that HCPs recognised the necessity of good planning and education before use.
No clear preference for the necessary participants in a digital care conference emerged from this survey. Only the presence of the specialist physician (i.e., the oncologist) was rated as less important. We believe that this reflects the usual composition of the home care team, i.e., the patient, caregiver, home care nurse, nurse specialist (palliative care), primary care physician and, if needed, palliative care physician. A notable result from the survey is the many nurses in basic home care with training in palliative care. We included them in the general PC HCP group; however, the role of these HCPs should certainly be explored in more detail.
As an important element of real-world implementation, the choice of the leader of the conference fell clearly on the specialist nurse (palliative care), which well reflects the usual coordination role of the specialist nurse (including 24-hour availability). The specialist PC HCP subgroup often considered the primary care physician the chair of the conference, which indicates the GP’s high importance in this setting.
The survey’s participants confirmed the normative needs usually present in the literature [5, 32]. The need to see other peers was the most controversial. From a practical perspective, statements about the need for clear planning and a clear timeframe are very understandable and important: time is a major resource, especially in the outpatient setting. This is especially true because digital care conferences run the risk of taking considerable time to plan, thereby reducing the resource efficacy (time and money) of telemedicine [7, 33].
Our survey has several strengths. First, it explores clinically relevant topics in a well-defined local setting. Second, it is based on existing theories about telemedicine. Third, the mixed-methods strategy helps capture the individual needs of healthcare professionals. Online surveys are inherently challenging to generalise [34]. Generalisability was not a goal of this survey, as it was clearly intended as the planning phase of a local QI project. Correspondingly, we do not believe that this is a significant limitation. Nonetheless, care was taken to define the purposive sample as close to reality (palliative care network) as possible.
The overall return rate was small for the general HCP population but adequate for the specialised team. The return rate of the general practitioners was low, potentially reducing the validity of the results for this specific healthcare professional group. Possible reasons for this could be (a) the differing patient population of individual general practitioners (high vs low rate of palliative care patients), (b) lack of time and (c) the general practitioner’s lack of interest in research or telemedicine, representing a possible confounder. Another limitation of this study is that only a few participants had ever used telemedicine tools. Hence, we surveyed the perceptions of digital conferences but did not proceed to a subgroup analysis (previous users of telemedicine) due to the small sample size.
The results of this survey reveal a good perception of the feasibility and acceptance of telemedicine and digital care conferences of HCPs in our local palliative care outpatient network. The participants also had positive perceptions of facilitators and needs. The constructive views of barriers and risk show that the pilot phase of a digital care conference can be addressed with confidence.
In addition, we suggest that a nurse lead the pilot phase of a digital care conference. According to this survey, the following main aspects will be considered: (a) a clear and simple framework/template for the conference, (b) simple-to-use and data protection-compliant videoconference tools accessible to all participants and (c) clear and transparent documentation of the decisions.
The authors would like to thank Dr. AlDossary for sharing her insight into the development process of the needs-based implementation of telemedicine.
This research received no specific grant from any funding agency.
All authors have completed and submitted the International Committee of Medical Journal Editors form for disclosure of potential conflicts of interest. No potential conflict of interest related to the content of this manuscript was disclosed.
1. Allen Watts K, Malone E, Dionne-Odom JN, McCammon S, Currie E, Hicks J, et al. Can you hear me now?: improving palliative care access through telehealth. Res Nurs Health. 2021 Feb;44(1):226–37. 10.1002/nur.22105
2. Finucane AM, O’Donnell H, Lugton J, Gibson-Watt T, Swenson C, Pagliari C. Digital health interventions in palliative care: a systematic meta-review. NPJ Digit Med. 2021 Apr;4(1):64. 10.1038/s41746-021-00430-7
3. WHO. WHO | Classification of digital health interventions v1.0. WHO.
4. Cherny N, Portenoy RK. Core concepts in palliative care. In: Cherny N, Fallon M, Kaasa S, editors. Oxford Textbook of Palliative Medicine. Oxford university press; 2021. 10.1093/med/9780198821328.003.0006
5. Ebneter AS, Sauter TC, Christen A, Eychmueller S. Feasibility, acceptability and needs in telemedicine for palliative care. Swiss Med Wkly. 2022 Mar;152(9-10):Swiss Med Wkly. 2022;152:w30148. 10.4414/SMW.2022.w30148
6. Laver KE, Adey-Wakeling Z, Crotty M, Lannin NA, George S, Sherrington C. Telerehabilitation services for stroke. Cochrane Database Syst Rev. 2020 Jan;1(1):CD010255.
7. Lomenick AF, Kuhlman SJ, Barnes JL, Gurley-Calvez T, Spaulding AO, Krebill HM, et al. Economics of Using Telemedicine to Supplement Hospice Care in Rural Areas. J Palliat Med. 2021 Sep;24(10):1461–6. 10.1089/jpm.2020.0117
8. AlDossary S, Martin-Khan MG, Bradford NK, Armfield NR, Smith AC. The Development of a Telemedicine Planning Framework Based on Needs Assessment. J Med Syst. 2017 May;41(5):74. 10.1007/s10916-017-0709-4
9. AlDossary S, Armfield NR, Smith AC, Martin-Khan MG. A Needs-based Planning Framework for Telemedicine Services: A Practical Guide. Faculty of Medicine The University of Queensland, Australia.: National Health and Medical Research Council (NHMRC) Centre of Research Excellence in Telehealth; 2019.
10. Ebneter AS, Fliedner M, Trapp D, Ramseier F, Sauter TC, Eychmuller S. [Telemedicine in Palliative Care: Digital Communication in a Relationship-Based Speciality - Does It Make Sense?]. Prax Bern 1994. 2021 Nov;110(15):845–50.
11. Ebneter AS, Sauter T, Achter A, Eychmller S. Einsatz von Telemedizin in der Palliative Care. Schweiz Arzteztg. 2022. 10.4414/saez.2022.20419
12. Ebneter AS, Eychmueller S. Digital Hilfsmittel in der Palliative Care: Quo vadis? Infoonco-Suisse. 2022 Aug;12(5).
13. Institute of Medicine Committee on Quality of Health Care in A. In. Crossing the Quality Chasm: A New Health System for the 21st Century. Washington (DC): National Academies Press (US) Copyright 2001 by the National Academy of Sciences. All rights reserved.; 2001.
14. Langbecker D, Caffery LJ, Gillespie N, Smith AC. Using survey methods in telehealth research: A practical guide. J Telemed Telecare. 2017 Oct;23(9):770–9. 10.1177/1357633X17721814
15. Weaver MS, Neumann ML, Navaneethan H, Robinson JE, Hinds PS. Human Touch via Touchscreen: Rural Nurses’ Experiential Perspectives on Telehealth Use in Pediatric Hospice Care. J Pain Symptom Manage. 2020 Nov;60(5):1027–33. 10.1016/j.jpainsymman.2020.06.003
16. Boynton PM. Administering, analysing, and reporting your questionnaire. BMJ. 2004 Jun;328(7452):1372–5. 10.1136/bmj.328.7452.1372
17. Boynton PM, Wood GW, Greenhalgh T, Clinic Q. Reaching beyond the white middle classes. BMJ. 2004 Jun;328(7453):1433–6. 10.1136/bmj.328.7453.1433
18. Boynton PM, Greenhalgh T. Selecting, designing, and developing your questionnaire. BMJ. 2004 May;328(7451):1312–5. 10.1136/bmj.328.7451.1312
19. Demiris G, Speedie S, Finkelstein S. A questionnaire for the assessment of patients’ impressions of the risks and benefits of home telecare. J Telemed Telecare. 2000;6(5):278–84. 10.1258/1357633001935914
20. Spitallisten [Internet]. Kanton Bern. [cited 2023 Apr 2]. Available from: https://www.gsi.be.ch/de/start/themen/gesundheit/gesundheitsversorger/spitaeler-psychiatrie-rehabilitation/spitallisten.html
21. Basec. Qualitätssicherung oder bewilligungspflichtige. Forschung. 2020.
22. Kleinheksel AJ, Rockich-Winston N, Tawfik H, Wyatt TR. Demystifying Content Analysis. Am J Pharm Educ. 2020 Jan;84(1):7113. 10.5688/ajpe7113
23. Hsieh HF, Shannon SE. Three approaches to qualitative content analysis. Qual Health Res. 2005 Nov;15(9):1277–88. 10.1177/1049732305276687
24. InfoSocietyDays. STUDIENERGEBNISSE 2021 – Swiss eHealth Forum. Gfs.bern; 2021.
25. Disalvo D, Agar M, Caplan G, Murtagh FE, Luckett T, Heneka N, et al. Virtual models of care for people with palliative care needs living in their own home: A systematic meta-review and narrative synthesis. Palliat Med. 2021 Sep;35(8):1385–406. 10.1177/02692163211024451
26. Hammerton M, Benson T, Sibley A. Readiness for five digital technologies in general practice: perceptions of staff in one part of southern England. BMJ Open Qual. 2022 Jun;11(2):e001865. 10.1136/bmjoq-2022-001865
27. Silva MD, Schack EE. Outpatient Palliative Care Practice for Cancer Patients During COVID-19 Pandemic: Benefits and Barriers of Using Telemedicine. Am J Hosp Palliat Care. 2021 Jul;38(7):842–4. 10.1177/1049909121997358
28. Kalicki AV, Moody KA, Franzosa E, Gliatto PM, Ornstein KA. Barriers to telehealth access among homebound older adults. J Am Geriatr Soc. 2021 Sep;69(9):2404–11. 10.1111/jgs.17163
29. Tang M, Reddy A. Telemedicine and Its Past, Present, and Future Roles in Providing Palliative Care to Advanced Cancer Patients. Cancers (Basel). 2022 Apr;14(8):1884. 10.3390/cancers14081884
30. Hollander J, Sharma R. Telemedicine Is Mainstream Care Delivery. NEJM Catal. 2022;3(7):CAT.22.0176. 10.1056/CAT.22.0176
31. Tieman JJ, Swetenham K, Morgan DD, To TH, Currow DC. Using telehealth to support end of life care in the community: a feasibility study. BMC Palliat Care. 2016 Nov;15(1):94. 10.1186/s12904-016-0167-7
32. Salvador Vergès À, Cusí Sánchez MV, Bossio Grigera P, Fàbrega Agulló C, Gomes da Costa F, Serra Trullas A, et al. Determinants in Stakeholder Opinions About Telemedicine in Palliative Care: A Scoping Review. Telemed J E Health. 2022 Jul;28(7):932–41. 10.1089/tmj.2021.0441
33. Snoswell CL, Smith AC, Page M, Scuffham P, Caffery LJ. Quantifying the Societal Benefits From Telehealth: Productivity and Reduced Travel. Value Health Reg Issues. 2022 Mar;28:61–6. 10.1016/j.vhri.2021.07.007
34. Andrade C. The Limitations of Online Surveys. Indian J Psychol Med. 2020 Oct;42(6):575–6. 10.1177/0253717620957496
Details of the survey pilot phase
Initial survey
Demographics of the pilot phase participants
Major changes, based on the comments of the pilot phase participants (n = 11)
Supplementary tables
Table S1Perceived usefulness of telemedicine in general.
| All participants | Very useful | Useful | Neither useful nor useless | Not useful | Not useful at all | n | Median (IQR; range) | ||||||
| Virtual visit/consultation | 25.76% | 50% | 15.15% | 7.58% | 1.52% | 66 | 2 (1; 1–5 ) | ||||||
| Digital interprofessional meetings (round table discussions) | 40.91% | 48.48% | 7.58% | 3.03% | 0% | 66 | 2 (1; 1–4) | ||||||
| Digital data transmission (e.g., intensity of symptoms via tablet) | 42.42% | 42.42% | 10.61% | 4.55% | 0% | 66 | 2 (1; 1–4) | ||||||
| Digital monitoring (e.g., vital parameters via smartphone) | 24.24% | 46.97% | 21.21% | 7.58% | 0% | 66 | 2 (1; 1–4) | ||||||
| Digitally supported continuing education/training | 42.42% | 39.39% | 12.12% | 4.55% | 1.52% | 66 | 2 (1; 1–5) | ||||||
| Specialised HCP (n = 18) vs general HCP (n = 48) | Very useful | Useful | Neither useful nor useless | Not useful | Not useful at all | Mann-Whitney | Median (IQR; range) | ||||||
| Spec. | Gen. | Spec. | Gen. | Spec. | Gen. | Spec. | Gen. | Spec. | Gen. | Spec. | Gen. | ||
| Virtual visit | 33.3% | 22.9% | 50.0% | 50.0% | 16.7% | 14.6% | 0.0% | 10.4% | 0.0% | 2.1% | n.s | 2 (1; 1–3) | 2 (1; 1–5) |
| Digital care conferences | 61.1% | 33.3% | 33.3% | 54.2% | 5.6% | 8.3% | 0.0% | 4.2% | 0.0% | 0.0% | 0.045 | 1 (1; 1–3) | 2 (1; 1–4) |
| Digital data transmission (e.g., intensity of symptoms via tablet) | 27.8% | 47.9% | 33.3% | 45.8% | 27.8% | 4.2% | 11.1% | 2.1% | 0.0% | 0.0% | 0.016 | 2 (2; 1–4) | 2 (1; 1–4) |
| Digital monitoring (e.g., vital parameters via smartphone) | 16.7% | 27.1% | 38.9% | 50.0% | 33.3% | 16.7% | 11.1% | 6.3% | 0.0% | 0.0% | n.s. | 2 (1; 1–4) | 2 (1; 1–4) |
| Digitally supported continuing education/training | 66.7% | 33.3% | 22.2% | 45.8% | 5.6% | 14.6% | 5.6% | 4.2% | 0.0% | 2.1% | 0.029 | 1 (13; 1–4) | 2 (1; 1–5) |
| Physicians (n = 29) vs. nurses (n = 37) | Very useful | Useful | Neither useful nor useless | Not useful | Not useful at all | Mann-Whitney | Median (IQR; range) | ||||||
| Phys. | Nurs. | Phys. | Nurs. | Phys. | Nurs. | Phys. | Nurs. | Phys. | Nurs. | Phys. | Nurs. | ||
| Virtual visit | 17.2% | 32.4% | 51.7% | 48.6% | 17.2% | 13.5% | 13.8% | 2.7% | 0.0% | 2.7% | n.s | 2 (1; 1–4) | 2 (1; 1–5) |
| Digital care conferences | 41.4% | 40.5% | 48.3% | 48.6% | 10.3% | 5.4% | 0.0% | 5.4% | 0.0% | n.s | 2 (1; 1–3) | 2 (1; 1–4) | |
| Digital data transmission (e.g., intensity of symptoms via tablet) | 45.9% | 37.9% | 37.9% | 45.9% | 20.7% | 2.7% | 3.4% | 5.4% | 0.0% | 0.0% | n.s | 2 (2; 1–4) | 2 (1; 1–4) |
| Digital monitoring (e.g., vital parameters via smartphone) | 27.6% | 21.6% | 37.9% | 54.1% | 27.6% | 16.2% | 6.9% | 8.1% | 0.0% | 0.0% | n.s | 2 (2; 1–4) | 2 (1; 1–4) |
| Digitally supported continuing education/training | 55.2% | 32.4% | 31.0% | 45.9% | 13.8% | 10.8% | 0.0% | 8.1% | 0.0% | 2.7% | n.s (0.066) | 1 (1; 1–3) | 2 (1; 1–5) |
Table S2Perceived risks of telemedicine in general.
| All participants | Fully agree | Agree | Neither agree nor disagree | Do not agree | Do not agree at all | n | Median (95% CI; range) | ||||||
| Technical problems (program/connection) are an obstacle | 30.30% | 45.45% | 12.12% | 12.12% | 0% | 66 | 2 2; 1–4) | ||||||
| Lack of a billing option is an obstacle | 24.24% | 28.79% | 25.76% | 21.21% | 0% | 66 | 2 (2; 1–4) | ||||||
| Risk of a data leak is relevant | 15.15% | 34.85% | 36.36% | 12.12% | 1.52% | 66 | 2 (1; 1–5) | ||||||
| Lack of physical contact can be a risk | 37.88% | 50% | 12.12% | 0% | 0% | 66 | 2 (1; 1–3) | ||||||
| Lack of acceptance by patients and caregivers | 10.77% | 44.62% | 27.69% | 13.85% | 3.08% | 65 | 2 (1; 1–5) | ||||||
| Specialised HCP (n = 18), general HCP (n = 48) | Fully agree | Agree | Neither agree nor disagree | Do not agree | Do not agree at all | Mann-Whitney | Median (IQR; range) | ||||||
| Spec. | Gen. | Spec. | Gen. | Spec. | Gen. | Spec. | Gen. | Spec. | Gen. | Spec. | Gen. | ||
| Technical problems (program/connection) are an obstacle | 38.9% | 27.1% | 44.4% | 45.8% | 16.7% | 10.4% | 0.0% | 16.7% | 0.0% | 0.0% | n.s | 2 (1; 1–3) | 2 (2; 1–4) |
| Lack of a billing option is an obstacle | 16.7% | 27.1% | 22.2% | 31.3% | 38.9% | 20.8% | 22.2% | 20.8% | 0.0% | 0.0% | n.s | 3(1; 1–4) | 2 (2; 1–4) |
| Risk of a data leak is relevant | 11.1% | 16.7% | 38.9% | 33.3% | 44.4% | 33.3% | 5.6% | 14.6% | 0.0% | 2.1% | n.s | 2.5 (1; 1–4) | 2 (1; 1–5) |
| Lack of physical contact can be a risk | 22.2% | 43.8% | 61.1% | 45.8% | 16.7% | 10.4% | 0.0% | 0.0% | 0.0% | 0.0% | n.s | 2 (0; 1–3) | 2 (1; 1–3) |
| Lack of acceptance by patients and caregivers | 11.1% | 10.6% | 33.3% | 48.9% | 33.3% | 25.5% | 16.7% | 12.8% | 5.6% | 2.1% | n.s | 3 (1; 1–5) | 2 (1; 1–5) |
| Physicians (n = 29) vs. nurses (n = 37) | Fully agree | Agree | Neither agree nor disagree | Do not agree | Do not agree at all | Mann-Whitney | Median (95% CI; range) | ||||||
| Phys. | Nurs. | Phys. | Nurs. | Phys. | Nurs. | Phys. | Nurs. | Phys. | Nurs. | Phys. | Nurs. | ||
| Technical problems (program/connection) are an obstacle | 17.2% | 40.5% | 48.3% | 43.2% | 17.2% | 8.1% | 17.2% | 8.1% | 0.0% | 0.0% | 0.024 | 2 (1; 1–4) | 2 (1; 1–4) |
| Lack of a billing option is an obstacle | 27.8% | 21.6% | 24.1% | 32.4% | 24.1% | 27.0% | 24.1% | 18.9% | 0.0% | 0.0% | n.s. | 2 (3; 1–4) | 2 (1; 1–4) |
| Risk of a data leak is relevant | 10.3% | 18.9% | 34.5% | 35.1% | 34.5% | 37.8% | 17.2% | 8.1% | 3.4% | 0.0% | n.s. | 3 (1; 1–5) | 2 (1; 1–4) |
| Lack of physical contact can be a risk | 43.2% | 31.0% | 55.2% | 45.9% | 13.8% | 10.8% | 0.0% | 0.0% | 0.0% | 0.0% | n.s | 2 (1; 1–3) | 2 (1; 1–3) |
| Lack of acceptance by patients and caregivers | 3.4% | 16.7% | 48.3% | 41.7% | 31.0% | 25.0% | 10.3% | 16.7% | 6.9% | 0.0% | n.s | 2 (1; 1–4) | 2 (1; 1–5) |
Table S3.1Acceptance of digital care conferences.
| All participants | Very good | Good | Neither good nor bad | Bad | Very bad | n | Median (IQR; range) | ||||||||||
| Patient (perceived by HCP) | 14.06% | 39.06% | 32.81% | 14.06% | 0% | 64* | 2 (1; 1–4) | ||||||||||
| Caregivers | 15.62% | 50% | 26.56% | 7.81% | 0% | 64* | 2 (1; 1–4) | ||||||||||
| Professionals | 35.94% | 42.19% | 21.88% | 0% | 0% | 64* | 2 (1; 1–3) | ||||||||||
| Specialised HCP (n = 17) vs Gen. HCP (n = 47) | Very good | Good | Neither good nor bad | Bad | Very bad | Mann-Whitney | Median (95% CI; range) | ||||||||||
| Spec. | Gen. | Spec. | Gen. | Spec. | Gen. | Spec. | Gen. | Spec. | Gen. | Spec. | Gen. | ||||||
| Patient (perceived by HCP) | 29.4% | 8.5% | 47.1% | 36.2% | 17.6% | 38.3% | 5.9% | 17.0% | 0.0% | 0.0% | 0.012 | 2 (2; 1–4) | 3 (1; 1–4) | ||||
| Caregivers | 23.5% | 12.8% | 64.7% | 44.7% | 11.8% | 31.9% | 0.0% | 10.6% | 0.0% | 0.0% | 0.024 | 2 (1; 1–3) | 2 (1; 1–4) | ||||
| Professionals | 47.1% | 31.9% | 23.5% | 48.9% | 29.4% | 19.1% | 0.0% | 0.0% | 0.0% | 0.0% | n.s | 2 (2; 1–3) | 2 (1; 1–3) | ||||
| Physicians (n = 29) vs. nurses (n = 35) | Very good | Good | Neither good nor bad | Bad | Very bad | Mann-Whitney | Median (IQR; range) | ||||||||||
| Phys. | Nurs. | Phys. | Nurs. | Phys. | Nurs. | Phys. | Nurs. | Phys. | Nurs. | Nurs.. | Nurs. | ||||||
| Patient (perceived by HCP) | 20.7% | 8.6% | 27.6% | 48.6% | 41.4% | 25.7% | 10.3% | 17.1% | 0.0% | 0.0% | n.s | 3 (1; 1–4) | 2 (1; 1–4) | ||||
| Caregivers | 20.7% | 11.4% | 41.4% | 57.1% | 31.0% | 22.9% | 6.9% | 8.6% | 0.0% | 0.0% | n.s | 2 (1; 1–4) | 2 (1; 1–4) | ||||
| Professionals | 31.0% | 40.0% | 37.9% | 45.7% | 31.0% | 14.3% | 0.0% | 0.0% | 0.0% | 0.0% | n.s | 2 (2; 1–3) | 2 (1; 1–3) | ||||
Table S3.2Feasibility of digital care conferences.
| Very good | Good | neither good / nor bad | Bad | Very bad | Mann Whitney | Median (95%CI; range) | |||||||
| Spec. | Gen. | Spec. | Gen. | Spec. | Gen. | Spec. | Gen. | Spec. | Gen. | Spec. | Gen. | ||
| All participants (n = 63) | 12.70% | 52.38% | 20.63% | 9.52% | 5% | 2 (1; 1–5) | |||||||
| Specialised HCP (n = 16) vs. general. HCP (n = 47) | 12.5% | 12.8% | 56.3% | 51.1% | 31.3% | 17.0% | 0.0% | 12.8% | 0.0% | 6.4% | 0.514 | 2 (1; 1–3) | 2 (1; 1–5) |
| Physicians (n = 29) vs. nurses (n = 34) | 17.2% | 8.8% | 62.1% | 44.1% | 17.2% | 23.5% | 3.4% | 14.7% | 0.0% | 8.8% | 0.018 | 2 (0; 1–4) | 2 (1; 1–5) |
Table S4Advantage of digital care conferences.
| All participants | Fully agree | Agree | Neither agree nor disagree | Do not agree | Do not agree at all | n | Median (IQR; range) | ||||||
| ...gives me a good understanding of the medical problem | 15.62% | 56.25% | 20.31% | 7.81% | 0% | 64 | 2 (1; 1–4) | ||||||
| ...can save time | 42.19% | 50% | 4.69% | 3.12% | 0% | 64 | 2 (1; 1–4) | ||||||
| ...can save money | 31.25% | 35.94% | 25% | 7.81% | 0% | 64 | 2 (2; 1–4) | ||||||
| ...improve coordination within the team | 29.69% | 48.44% | 12.50% | 7.81% | 1.56% | 64 | 2 (1; 1–5) | ||||||
| ...improve communication between the treating professionals | 30.16% | 39.68% | 22.22% | 6.35% | 1.59% | 63 | 2 (2; 1–5) | ||||||
| Physicians (n = 29) vs. nurses (n = 35) | Fully agree | Agree | Neither agree nor disagree | Do not agree | Do not agree at all | Mann-Whitney | Median (IQR; range) | ||||||
| Spec. | Gen. | Spec. | Gen. | Spec. | Gen. | Spec. | Gen. | Spec. | Gen. | Spec. | Gen. | ||
| ...give me a good understanding of the medical problem | 17.60% | 14.90% | 58.80% | 55.30% | 17.60% | 21.30% | 5.90% | 8.50% | 0.00% | 0.00% | n.s | 2 (1; 1–4) | 2 (1; 1–4) |
| ...can save time | 47.10% | 40.40% | 35.30% | 55.30% | 17.60% | 0.00% | 0.00% | 4.30% | 0.00% | 0.00% | n.s | 2 (1; 1–3) | 2 (1; 1.4) |
| ...can save money | 35.30% | 29.80% | 29.40% | 38.30% | 35.30% | 21.30% | 0.00% | 10.60% | 0.00% | 0.00% | n.s | 2 (2; 1–3) | 2 (2; 1–4) |
| ...improve coordination within the team | 41.20% | 25.50% | 47.10% | 48.90% | 11.80% | 12.80% | 0.00% | 10.60% | 0.00% | 2.10% | n.s | 2 (1; 1–3) | 2 (2; 1–5) |
| ...improve communication between the treating professionals | 31.30% | 29.80% | 43.80% | 38.30% | 25.00% | 21.30% | 0.00% | 8.50% | 0.00% | 2.10% | n.s | 2 (2; 1–3) | 2 (2; 1–5) |
| Specialised HCP (n = 17) vs. general HCP (n = 47) | Fully agree | Agree | Neither agree nor disagree | Do not agree | Do not agree at all | Mann-Whitney | Median (95% CI; range) | ||||||
| Physicians | Nurse | Physicians | Nurse | Physicians | Nurse | Physicians | Nurse | Physicians | Nurse | Physicians | Nurses | ||
| ...give me a good understanding of the medical problem | 10.30% | 20.00% | 48.30% | 62.90% | 34.50% | 8.60% | 6.90% | 8.60% | 0.00% | 0.00% | n.s | 2 (1; 1–4) | 2 (0; 1–4) |
| ...can save time | 48.30% | 37.10% | 37.90% | 60.00% | 10.30% | 0.00% | 3.40% | 2.90% | 0.00% | 0.00% | n.s | 2 (1; 1–4) | 2 (1; 1–4) |
| ...can save money | 34.50% | 28.60% | 24.10% | 45.70% | 31.00% | 20.00% | 10.30% | 5.70% | 0.00% | 0.00% | n.s | 2 (2; 1–4) | 2 (2; 1–4) |
| ...improve coordination within the team | 34.50% | 25.70% | 51.70% | 45.70% | 10.30% | 14.30% | 3.40% | 11.40% | 0.00% | 2.90% | n.s | 2 (1; 1–4) | 2 (2; 1–5) |
| ...improve communication between the treating professionals | 31.00% | 29.40% | 37.90% | 41.20% | 27.60% | 17.60% | 3.40% | 8.80% | 0.00% | 2.90% | n.s | 2 (2; 1–4) | 2 (2; 1–5) |
Table S5 Participants in the digital care conference.
| All participants | Very important | Important | Neither important nor unimportant | Less important | Not important | n | Median (CI; range) | ||||||
| Patients | 57.81% | 34.38% | 7.81% | 0% | 0% | 64 | 1 (1; 1–3) | ||||||
| Caregivers | 38.71% | 48.39% | 12.90% | 0% | 0% | 62 | 2 (1; 1–3) | ||||||
| Home care nurse | 42.86% | 50.79% | 6.35% | 0% | 0% | 63 | 2 (1; 1–3) | ||||||
| Home care nurse with training in palliative care | 50.79% | 42.86% | 4.76% | 1.59% | 0% | 63 | 1 (1; 1–4) | ||||||
| Specialised palliative care nurse | 60.94% | 35.94% | 3.12% | 0% | 0% | 64 | 1 (1; 1–3) | ||||||
| Primary care physician | 53.12% | 39.06% | 1.56% | 6.25% | 0% | 64 | 1 (1; 1–4) | ||||||
| Specialist physician | 19.05% | 49.21% | 17.46% | 12.70% | 1.59% | 63 | 2 (1; 1–5) | ||||||
| Palliative care physician | 56.25% | 28.12% | 10.94% | 4.69% | 0% | 64 | 1 (1:1–4) | ||||||
| Specialised HCP (n = 17), Gen. HCP (n = 47) | Very important | Important | Neither important nor unimportant | Not important | Not important at all | Mann-Whitney | Median (IQR; range) | ||||||
| Spec. | Gen. | Spec. | Gen. | Spec. | Gen. | Spec. | Gen. | Spec. | Gen. | Spec. | Gen. | ||
| Patients | 76.50% | 51.10% | 17.60% | 40.40% | 5.90% | 8.50% | 0.00% | 0.00% | 0.00% | 0.00% | n.s. | 1 (0; 1–3) | 1 (1; 1–3) |
| Caregivers | 56.30% | 32.60% | 31.30% | 54.30% | 12.50% | 13.00% | 0.00% | 0.00% | 0.00% | 0.00% | n.s. | 1 (1; 1–3) | 2 (1; 1.3) |
| Home care nurse | 47.10% | 41.30% | 35.30% | 56.50% | 17.60% | 2.20% | 0.00% | 0.00% | 0.00% | 0.00% | n.s. | 1.5 (1; 1–3) | 2 (1; 1–3) |
| Home care nurse with training in palliative care | 47.10% | 52.20% | 47.10% | 41.30% | 5.90% | 4.30% | 0.00% | 2.20% | 0.00% | 0.00% | n.s. | 1.5 (1; 1–3) | 1 (1; 1–4) |
| Specialised palliative care nurse | 82.40% | 53.20% | 17.60% | 42.60% | 0.00% | 4.30% | 0.00% | 0.00% | 0.00% | 0.00% | 0.033 | 1 (0; 1–2) | 1 (1; 1–3) |
| Primary care physician (family physicians) | 76.50% | 44.70% | 17.60% | 46.80% | 5.90% | 0.00% | 0.00% | 8.50% | 0.00% | 0.00% | 0.034 | 1 (1; 1–3) | 2 (1; 1–4) |
| Specialist physician | 23.50% | 17.40% | 58.80% | 45.70% | 17.60% | 17.40% | 0.00% | 17.40% | 0.00% | 2.20% | n.s. | 2 (1; 1–3) | 2 (1; 1–5) |
| Palliative care specialist | 82.40% | 46.80% | 11.80% | 34.00% | 5.90% | 12.80% | 0.00% | 6.40% | 0.00% | 0.00% | 0.14 | 1 (1; 1–3) | 2 (1; 1–4) |
| Physicians (n = 29) vs. nurses (n = 35) | Very important | Important | Neither important nor unimportant | Not important | Not important at all | Mann-Whitney | Median (IQR; range) | ||||||
| Phys. | Nurs. | Phys. | Nurs. | Phys. | Nurs. | Phys. | Nurs. | Phys. | Nurs. | Phys. | Nurs. | ||
| Patients | 58.60% | 57.10% | 34.50% | 34.30% | 6.90% | 8.60% | 0.00% | 0.00% | 0.00% | 0.00% | n.s. | 1 (1; 1–3) | 1 (1; 1–3) |
| Caregivers | 31.00% | 45.40% | 55.20% | 42.40% | 13.80% | 12.10% | 0.00% | 0.00% | 0.00% | 0.00% | n.s. | 2 (1; 1–3) | 2 (1; 1–3) |
| Home care nurse | 27.60% | 55.90% | 62.10% | 41.20% | 10.30% | 2.90% | 0.00% | 0.00% | 0.00% | 0.00% | 0.019 | 2 (1; 1–3) | 1 (1; 1–3) |
| Home care nurse with training in palliative care | 37.90% | 61.80% | 55.20% | 32.40% | 6.90% | 2.90% | 0.00% | 2.90% | 0.00% | 0.00% | n.s. | 2 (1; 1–3) | 1 (1; 1–4) |
| Specialised palliative care nurse | 55.20% | 65.70% | 44.80% | 28.60% | 0.00% | 5.70% | 0.00% | 0.00% | 0.00% | 0.00% | n.s. | 1 (1; 1–2) | 1 (1; 1–3) |
| Primary care physician (family physicians) | 44.80% | 60.00% | 44.80% | 34.40% | 3.40% | 0.00% | 6.90% | 5.70% | 0.00% | 0.00% | n.s. | 2 (1; 1–4) | 1 (2; 1–4) |
| Specialist physician | 10.30% | 26.50% | 51.70% | 47.10% | 24.10% | 11.80% | 10.30% | 14.70% | 3.40% | 0.00% | n,s, | 2 (1; 1–5) | 2 (2; 1–4) |
| Physician specialised in palliative care | 51.70% | 60.00% | 27.60% | 28.60% | 13.80% | 8.60% | 6.90% | 2.90% | 0.00% | 0.00% | n.s. | 1 (1; 1–4) | 1 (1; 1–4) |
Table S6Proposed leader of the conference.
| All participants (n = 63) | ||
| Home care nurse | 1 (1.59% | |
| Home care nurse with training in palliative care | 10 (15.87% | |
| Specialised palliative care nurse | 30 (47.62% | |
| Primary care physician | 12 (19.05% | |
| Specialist physician | 0 | |
| Palliative care physician | 1 (015.87% | |
| Specialised HCP (n = 16), Gen. HCP (n = 47) | Spec. | Gen. |
| Home care nurse | 0.00% | 1.60% |
| Home care nurse with training in palliative care | 0.00% | 21.30% |
| Specialised palliative care nurse | 25.00% | 55.30% |
| Primary care physician | 37.50% | 12.80% |
| Specialist physician | 0.00% | 0.00% |
| palliative care physician | 37.50% | 8.50% |
| Physicians (n = 29) vs. nurses (n = 34) | Physician | Nurse |
| Home care nurse | 3.60% | 0.00% |
| Home care nurse with training in palliative care | 17.90% | 14.30% |
| Specialised palliative care nurse | 35.70% | 57.10% |
| Primary care physician | 17.90% | 20.00% |
| Specialist physician | 0.00% | 0.00% |
| palliative care physician | 25.00% | 8.60% |
Table S7 Needs.
| All participants | Very important | Important | Neither important nor unimportant | Less important | Not important | n | Median (IQR; range) | |||||||
| Visual communication: being able to see the other professionals | 31.75% | 38.10% | 15.87% | 12.70% | 1.59% | 63 | 2 (2; 1–5) | |||||||
| Visual communication: being able to see the patient | 58.73% | 26.98% | 9.52% | 4.76% | 0% | 63 | 1 (1; 1–4) | |||||||
| Definition of common goals | 61.90% | 36.51% | 1.59% | 0% | 0% | 63 | 1 (1; 1–3) | |||||||
| Treatment coordination | 60.94% | 39.06% | 0% | 0% | 0% | 64 | 1 (1; 1–2) | |||||||
| Clear time frame | 39.06% | 57.81% | 1.56% | 1.56% | 0% | 64 | 2 (1; 1–4) | |||||||
| Easy access/operation of the tool | 67.19% | 31.25% | 1.56% | 0% | 0% | 64 | 1 (1; 1–3) | |||||||
| Privacy | 68.75% | 28.12% | 1.56% | 1.56% | 0% | 64 | 1 (1; 1–4) | |||||||
| Specialised HCP (n = 17) vs general HCP (n = 47) | Very important | Important | Neither important nor unimportant | Not important | Not important at all | Mann-Whitney | Median (IQR; range) | |||||||
| Spec. | Gen. | Spec. | Gen. | Spec. | Gen. | Spec. | Gen. | Spec. | Gen. | Spec. | Gen. | |||
| Visual communication: being able to see the other professionals | 35.30% | 30.40% | 41.20% | 37.00% | 11.80% | 17.40% | 5.90% | 15.20% | 5.90% | 0.00% | n.s | 2 (2; 1–5) | 2 (2; 1–4) | |
| Visual communication: being able to see the patient | 76.50% | 52.20% | 11.80% | 32.60% | 11.80% | 8.70% | 6.50% | 0.00% | 0.00% | 0.00% | n.s | 1 (1; 1–3) | 1 (1; 1–4) | |
| Definition of common goals | 82.40% | 54.30% | 17.60% | 43.50% | 0.00% | 2.20% | 0.00% | 0.00% | 0.00% | 0.00% | 0.042 | 1 (0; 1–2) | 1 (1; 1–3) | |
| Treatment coordination | 76.50% | 55.30% | 23.50% | 44.70% | 0.00% | 0.00% | 0.00% | 0.00% | 0.00% | 0.00% | n.s | 1 (1; 1–2) | 1 (1; 1–2) | |
| Clear time frame | 47.10% | 36.20% | 52.90% | 59.60% | 0.00% | 2.10% | 0.00% | 2.10% | 0.00% | 0.00% | n,s | 2 (1; 1–2) | 2 (1; 1–4) | |
| Easy access/operation of the tool | 64.70% | 68.10% | 35.30% | 29.80% | 0.00% | 2.10% | 0.00% | 0.00% | 0.00% | 0.00% | n.s | 1 (1; 1–2) | 1 (1; 1–3) | |
| Privacy | 64.70% | 70.20% | 35.30% | 25.50% | 0.00% | 2.10% | 0.00% | 2.10% | 0.00% | 0.00% | n.s | 1 (1; 1–2) | 1 (1; 1–4) | |
| Physicians (n = 29) vs. nurses (n = 35) | Very important | Important | Neither important nor unimportant | Not important | Not important at all | Mann-Whitney | Median (IQR; range) | |||||||
| Phys. | Nurs. | Phys. | Nurs. | Phys. | Nurs. | Phys. | Nurs. | Phys. | Nurs. | Phys. | Nurs. | |||
| Visual communication: being able to see the other professionals | 31.00% | 32.40% | 44.80% | 32.40% | 10.30% | 20.60% | 10.30% | 14.70% | 3.40% | 0.00% | n.s | 2 (2; 1–5) | 2 (2; 1–4) | |
| Visual communication: being able to see the patient | 58.60% | 58.80% | 24.10% | 29.40% | 13.80% | 5.90% | 3.40% | 5.90% | 0.00% | 0.00% | n.s | 1 (1; 1–4) | 1 (1; 1–4) | |
| Definition of common goals | 69.00% | 55.90% | 31.00% | 41.20% | 0.00% | 2.90% | 0.00% | 0.00% | 0.00% | 0.00% | n.s | 1 (1; 1–2) | 1 (1; 1–3) | |
| Treatment coordination | 62.10% | 60.00% | 37.90% | 40.00% | 0.00% | 0.00% | 0.00% | 0.00% | 0.00% | 0.00% | n.s | 1(1; 1–2) | 1 (1; 1–2) | |
| Clear time frame | 41.40% | 37.10% | 55.20% | 60.00% | 3.40% | 0.00% | 0.00% | 2.90% | 0.00% | 0.00% | n.s | 2 (1; 1–3) | 2 (1; 1–4) | |
| Easy access/operation of the tool | 51.70% | 80.00% | 44.80% | 20.00% | 3.40% | 0.00% | 0.00% | 0.00% | 0.00% | 0.00% | 0.015 | 1 (1; 1–3) | 1 (0; 1–2) | |
| Privacy | 55.20% | 80.00% | 37.90% | 20.00% | 3.40% | 0.00% | 3.40% | 0.00% | 0.00% | 0.00% | 0.026 | 1(1; 1–4) | 1 (0; 1–2) | |
Supplementary figures
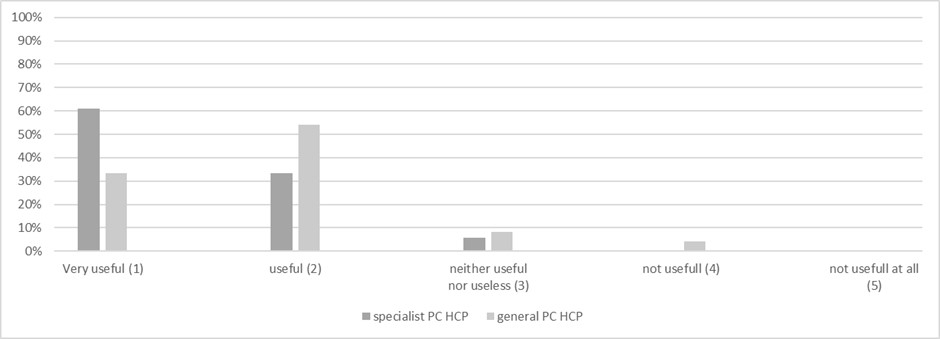
Figure S1Rated usefulness of digital care conferences by specialist PC HCP (n = 18) and general PC HCP (n = 48).
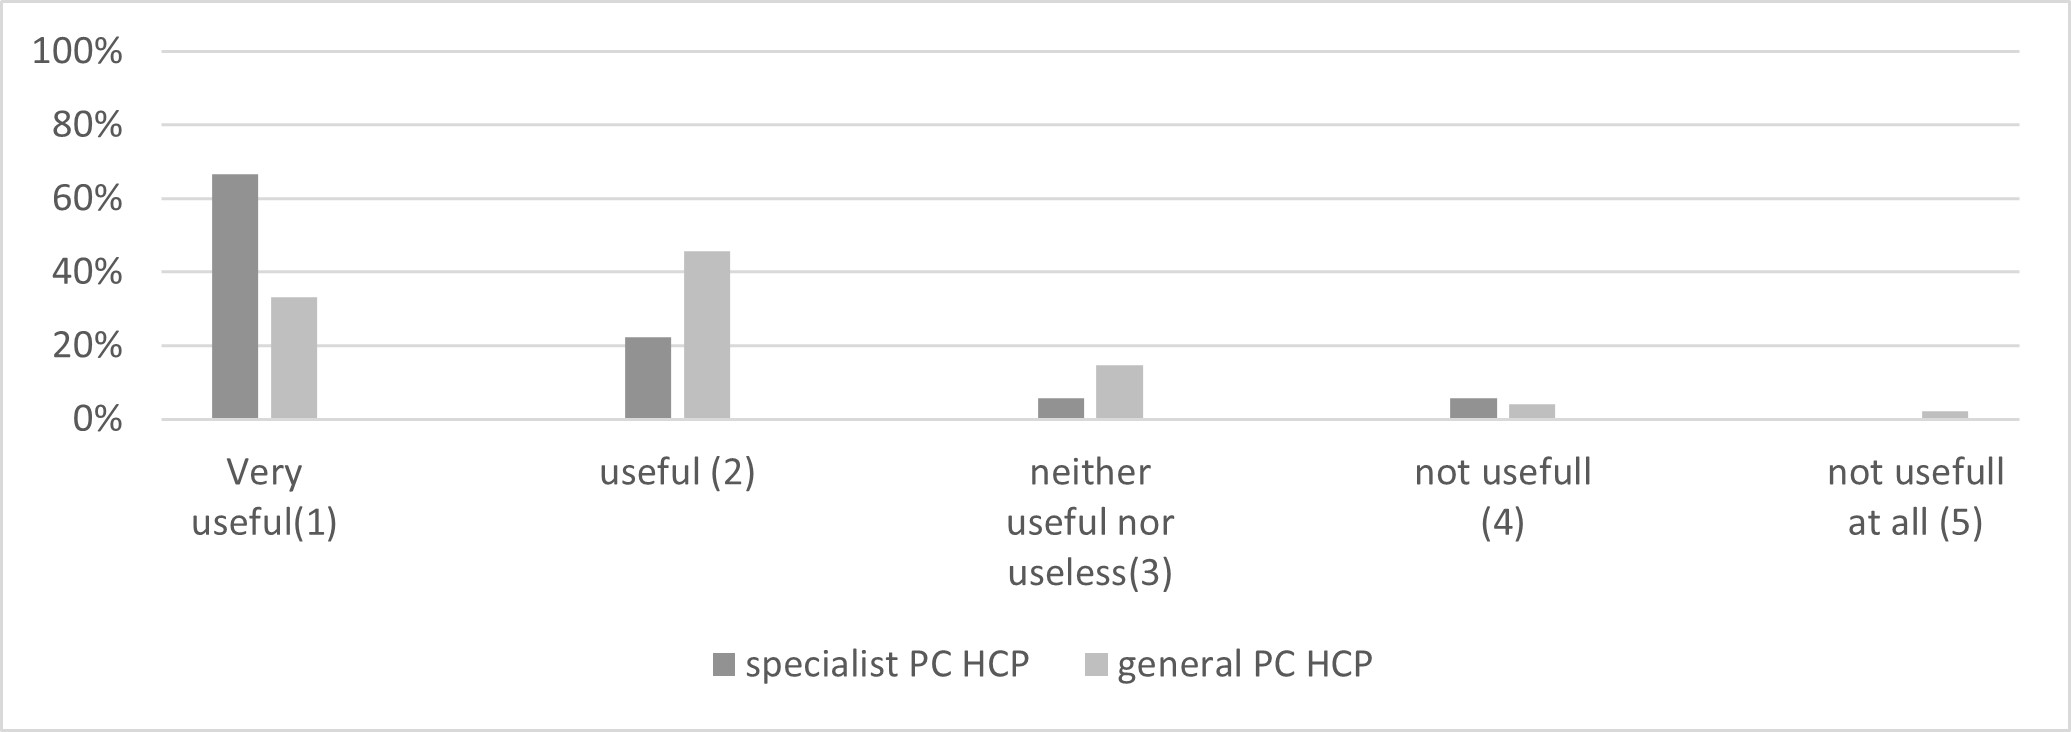
Figure S2Rated usefulness of digitally supported continuing education/training by specialist PC HCP (n = 18) and general PC HCP (n = 48).
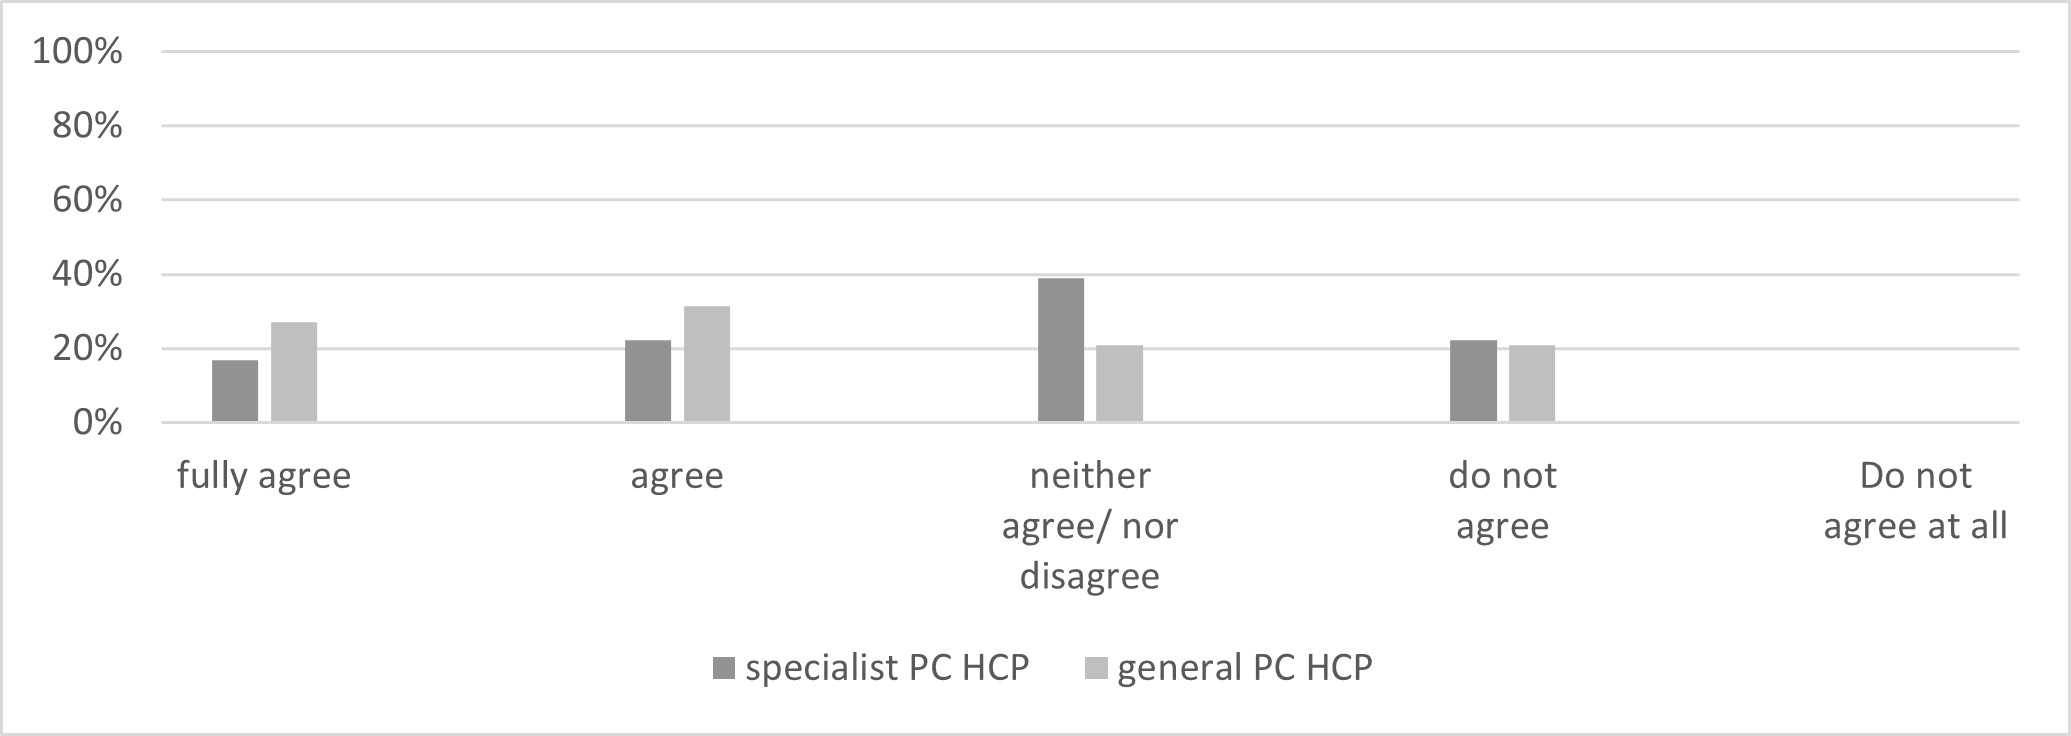
Figure S3Lack of billing as an obstacle for telemedicine, by specialist PC HCP (n = 18) and general PC HCP (n = 48).

Figure S4Risk of a data leak as an obstacle for telemedicine by specialist PC HCP (n = 18) and general PC HCP (n = 48).
Figure S5Risk of non-acceptance of patient and caregiver as an obstacle to telemedicine by specialist PC HCP (n = 18) and general PC HCP (n = 48).
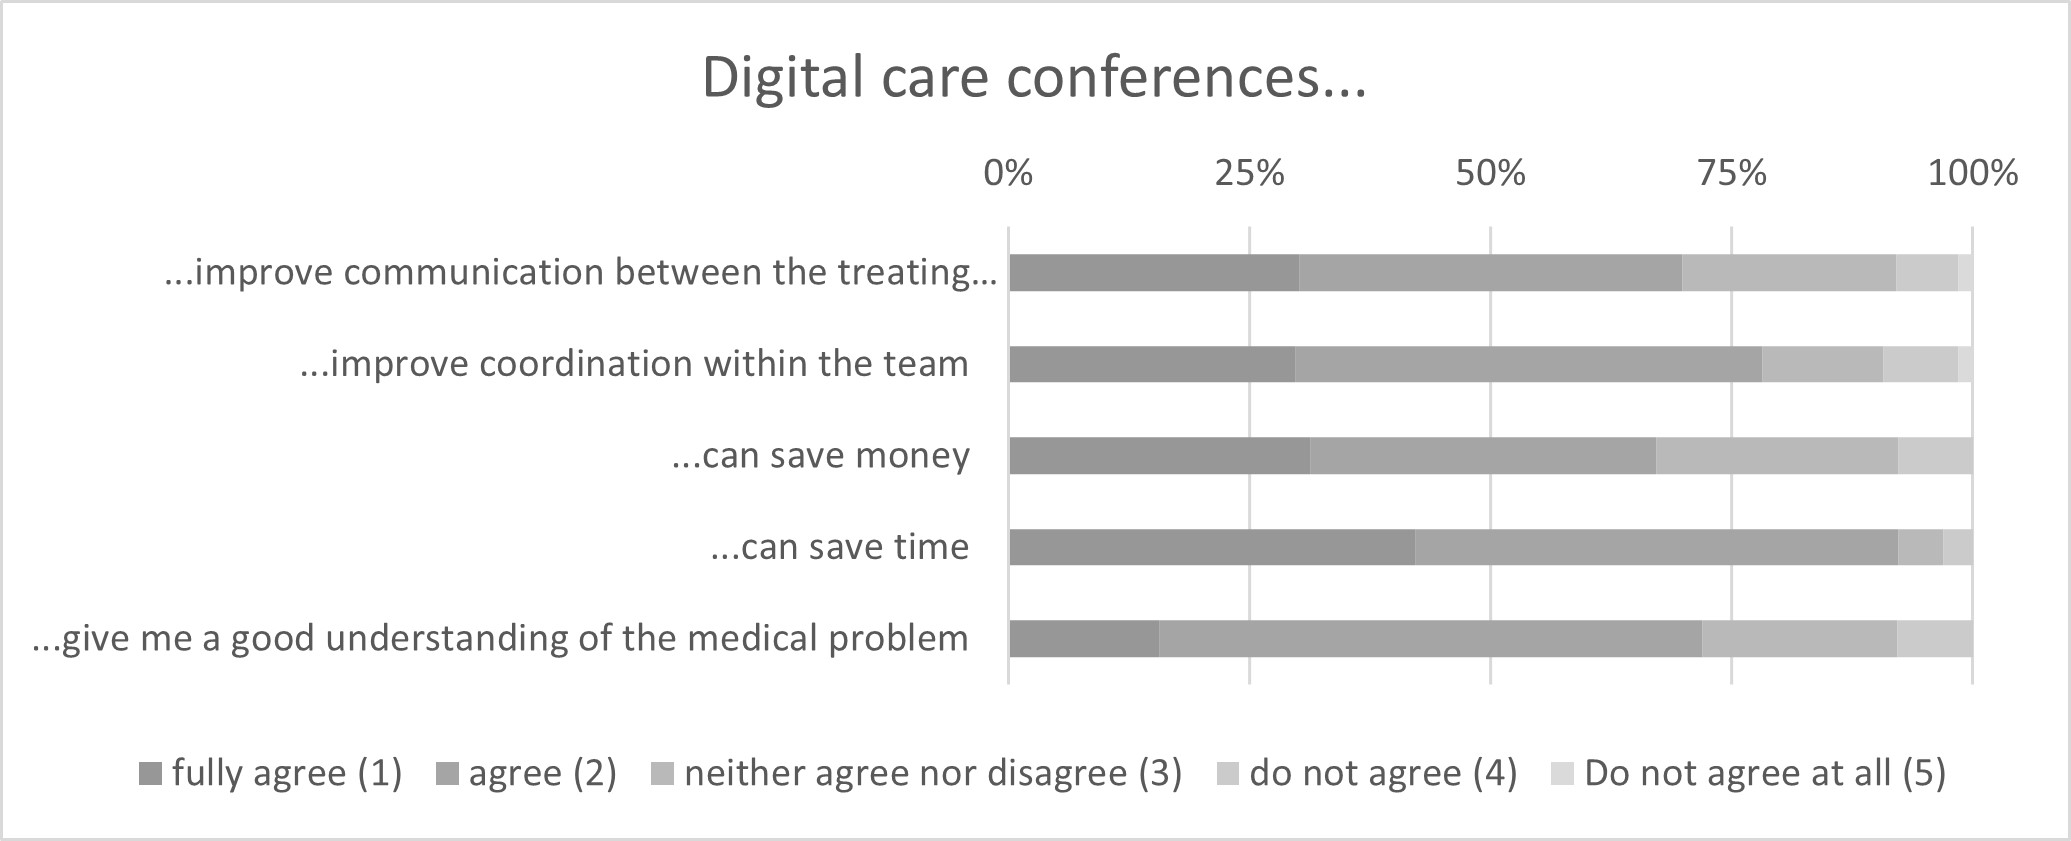
Figure S6Perceptions of the advantages of digital care conferences from 64 healthcare professionals, two missing.
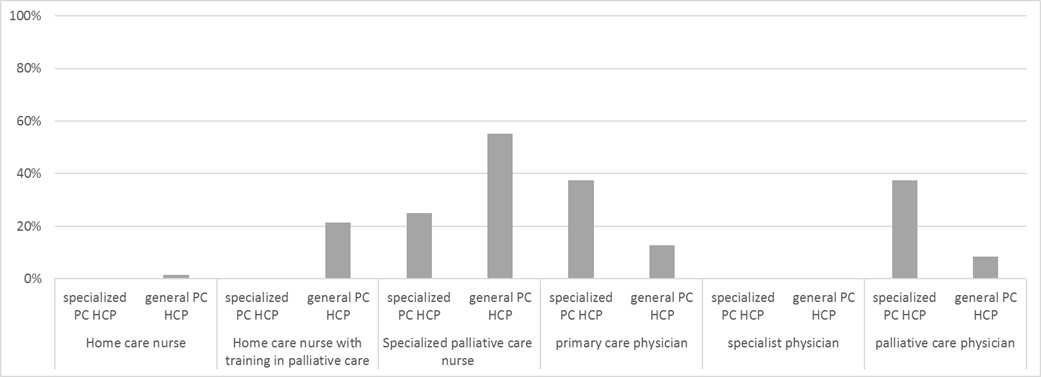
Figure S7Preference for leadership of the digital care conference by specialist PC HCP (n = 47, one missing) vs. general PC HCP (n = 16, two missing).
Figure S8Preference for leadership of the digital care conference by nurses vs physicians.