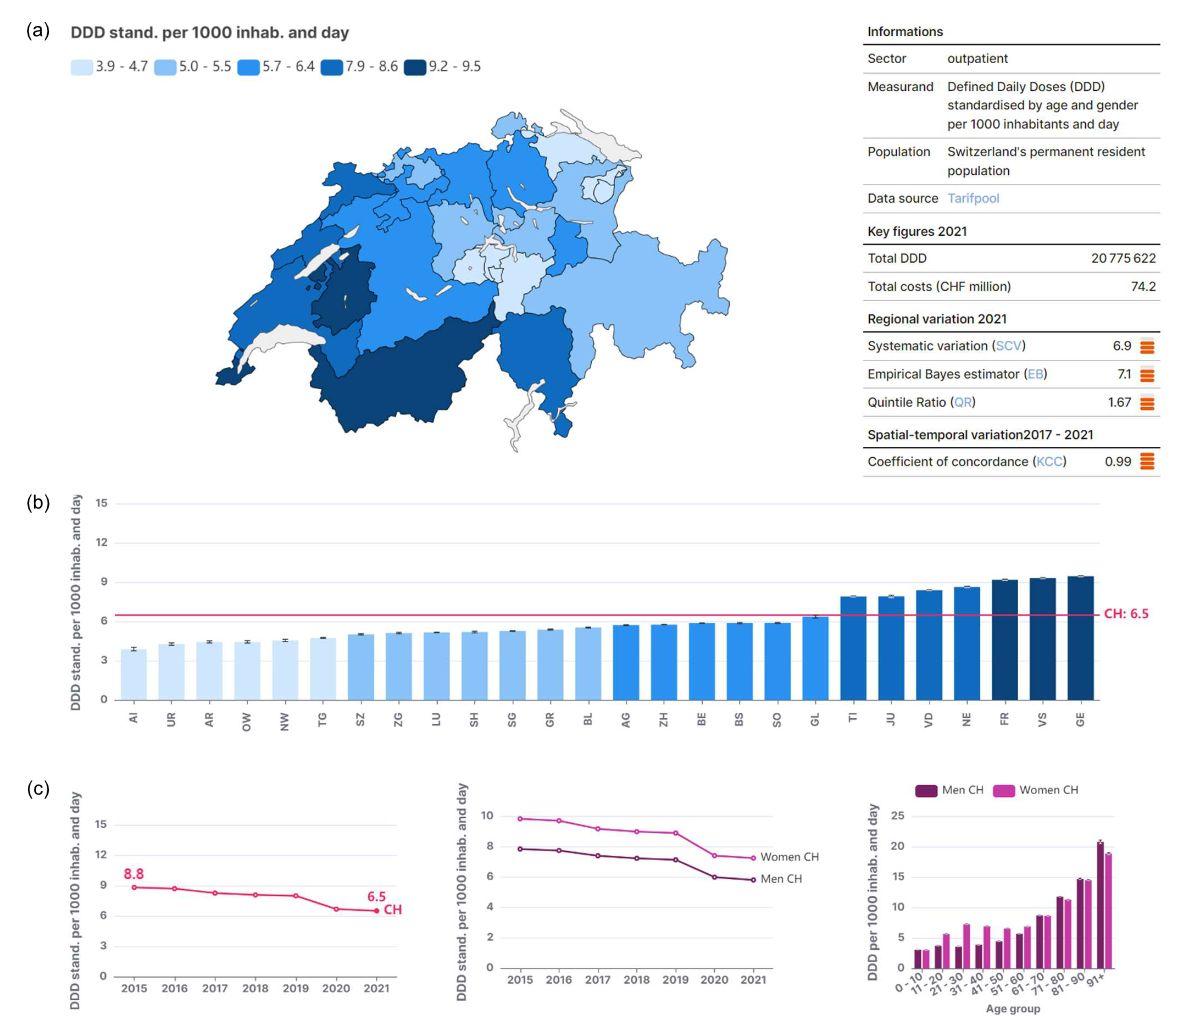
Figure 1Outpatient antibiotics use by canton, age, and sex between 2015 and 2021. Source: www.versorgungsatlas.ch, © Obsan 2023
DOI: https://doi.org/https://doi.org/10.57187/s.3440
a Schweizerisches Gesundheitsobservatorium (Obsan), Neuchâtel, Switzerland
b Klinik und Poliklinik für Innere Medizin, Universitätsspital Zürich, Zürich, Switzerland
c Faculty of Medicine, University of Geneva, Geneva, Switzerland
Which medical services are used in Switzerland, and to what extent? Are there significant regional differences in the provision of health care? How do the utilisation rates and regional variations develop over time? These are some of the questions addressed in the Swiss Atlas of Health Care (hereafter also referred to as the “Atlas”) [1]. The Atlas documents the use of healthcare services for more than 100 indicators at the national and regional levels. It provides simple, intuitively interpretable visualisations and is a foundation for evidence-based health policy and a starting point for more in-depth health service research.
The Swiss Atlas of Health Care went online for the first time in June 2017. This pilot version resulted from a collaboration between the Institute of Social and Preventive Medicine (ISPM) at the University of Bern and the Swiss Health Observatory (Obsan); it was supported by the Gottfried and Julia Bangerter-Rhyner Foundation as part of the “Health Services Research” funding program of the Swiss Academy of Medical Sciences (SAMS). Inspired by the Dartmouth Atlas of Health Care from the USA [2], the Atlas mapped regional differences in the utilisation of medical services in Switzerland. More specifically, about 30 indicators depicting regional differences in inpatient care were presented, focusing on surgical interventions.
The Atlas was met with great interest. However, there was no sustainable funding to update the indicators, let alone for further development. This situation changed in 2021 when the Obsan and the Federal Office of Public Health (FOPH) launched a project to create version 2.0 of the Atlas. The new Swiss Atlas of Health Care was finally published on 4 April 2023; it contains 113 indicators and 253 aspects and is available in three languages (German, French and English; www.versorgungsatlas.ch).
With its relaunch, the scope of the Atlas has been significantly expanded. Now, not only inpatient but also outpatient care is represented. The indicators for outpatient care are based on billing data from SASIS AG. To select and define the indicators in the Atlas, an online forum was set up specifically for this project [3], allowing a wide range of physicians to be involved, from the grassroots level to the executive boards of medical societies. As part of the relaunch, the entire methodology of the Atlas was reviewed and updated according to the current state of the art [4]. All functions used in the Atlas are published and freely accessible [5]. Technically, the Atlas is now programmed as a standalone web application based on React.js and Next.js frameworks. Maps and diagrams are generated using Apache Echarts. Based largely on automated analysis processes, the indicators can now be updated with minimal effort, an essential feature to ensure the sustainable maintenance of the Atlas for the next decade.
The original Atlas also provided an important reference point for health services research in Switzerland. Several projects within the National Research Program “Smarter Health Care” (NRP74) [6] were methodologically or conceptually based on the Atlas. Conversely, the results of NRP74 have been incorporated into the new Atlas.
The use of antibiotics in the outpatient setting is an interesting and important example. The indicator shows marked differences between the cantons, partly following the geographical and linguistic regions (figures 1a and 1b). Overall, there is an almost 2.5-fold difference in antibiotic prescriptions between the cantons of Appenzell Innerrhoden and Geneva.
Figure 1Outpatient antibiotics use by canton, age, and sex between 2015 and 2021. Source: www.versorgungsatlas.ch, © Obsan 2023
In general, low variation in care within a homogeneous population where evidence-based medicine is practised could indicate the quality of the care provided. However, significant differences in treatment rates raise some questions. To phrase it like Elliott S. Fisher, “Which rate is right?” [7]; either one region does too much or the other too little, both cannot be right.
Variations in care can originate from different sources (figure 2). In addition to random variation, demand-side and supply-side factors may contribute to regional differences in care provision. Which of these explanations apply to a given observation, such as the variations in antibiotic prescriptions, should and must be the topic of further scientific analyses to identify and possibly rectify the causes for inappropriate variations in care, which are often associated with low-quality and -cost care.

Figure 2Potential explanations for regional variations in health-care services. Source: own representation based on Birkmeyer et al. (2013) and Appleby et al. (2011), © Obsan 2023
In addition, the Atlas now allows for the visualisation of trends over time, such as the prescription of antibiotics since 2015 (figure 1c). Interestingly and encouragingly, the indicator regarding antibiotic prescriptions has decreased by about one quarter, suggesting that the efforts for improved antibiotic stewardship were impactful.
The current version of the Atlas is a significant improvement over its first edition. Nevertheless, rehabilitation, psychiatry and chronic care indicators are underrepresented and should be progressively integrated into future versions of the Atlas. The continued expansion of the Atlas is undoubtedly an important objective. However, the most crucial next step is that the currently available data are analysed for patterns of not readily explicable variations in care, which should prompt further research to understand their causes. In particular, all players in the Swiss healthcare system, be they providers, payers, regulators, or medical societies, should seize the opportunity to use this trove of data and engage in a collaborative interdisciplinary discourse to further improve the care of patients in Switzerland.
All authors have completed and submitted the International Committee of Medical Journal Editors form for disclosure of potential conflicts of interest. No potential conflict of interest related to the content of this manuscript was disclosed.
1. Swiss Health Care Atlas. https://www.versorgungsatlas.ch/en (accessed on July 12th, 2023).
2. The Dartmouth Atlas of Health Care, https://www.dartmouthatlas.org accessed on July 12th, 2023).
3. Kaiser B, Essig S, Zwahlen M. (2022). Indikatorenset für den Relaunch des Schweizerischen Versorgungsatlas. Bericht im Auftrag des Schweizerischen Gesundheitsobservatoriums Obsan und des Bundesamts für Gesundheit BAG. https://www.versorgungsatlas.ch/assets/reports/Versorgungsatlas_Bericht_BSS_ISPM_Interface.pdf
4. Schoch T, Thees O. (2023). Überprüfung der Methodik im Schweizer Atlas der Gesundheitsversorgung, Olten. Bericht zuhanden des Schweizerischen Gesundheitsobservatoriums (Obsan). https://www.versorgungsatlas.ch/assets/reports/Methodenbericht_Relaunch_Atlas.pdf
5. R-Package. «sava», https://github.com/tobiasschoch/sava (accessed on July 12th, 2023).
6. See especially projects 03 and 26 of National Research Program 74 "Smarter Health Care", https://www.nfp74.ch/en (accessed on August 8th, 2023).
7. Fisher E. (2013): Bringing Transparency to U.S. Health Care. Geisel School of Medicine at Dartmouth, online video: https://www.youtube.com/watch?v=uKLLU3guzNM (accessed on August 8th, 2023).