Anti-SARS-CoV-2 total immunoglobulin and neutralising antibody responses in healthy blood donors throughout the COVID-19 pandemic: a longitudinal observational study
DOI: https://doi.org/https://doi.org/10.57187/s.3408
Yukino Gütlinab,
Diana Albertos
Torresab,
Alexander Genschb,
Ann-Kathrin Schlotterbeckb,
Laurent Stögerb,
Stefanie Hellerb,
Laura Infantic,
Güliz Tuba Barutde,
Volker Thieldefg,
Karoline Leuzingerh,
Hans H. Hirschh,
Andreas Buserd,
Adrian Egliabi
a Institute of Medical Microbiology,
University of Zurich, Zurich, Switzerland
b Department of Biomedicine, University of
Basel, Basel, Switzerland
c Regional Blood Transfusion Service Swiss
Red Cross, Basel, Switzerland
d Institute of Virology and Immunology, Bern
and Mittelhäusern, Switzerland
e Department of Infectious Diseases and
Pathobiology, Vetsuisse Faculty, University of Bern, Bern, Switzerland
f Multidisciplinary Center for Infectious
Diseases, University of Bern, Bern, Switzerland
g European Virus Bioinformatics Center,
Jena, Germany
h Clinical Virology, University Hospital
Basel, Basel, Switzerland
i Clinical Bacteriology and Mycology,
University Hospital Basel, Basel, Switzerland
Summary
INTRODUCTION: Quantifying antibodies
against severe acute respiratory syndrome coronavirus 2 (SARS-CoV-2) and neutralising
antibodies may help to understand protection at the individual and population
levels. Determination of neutralising antibodies using classical virus neutralisation
tests (VNT) is considered the gold standard, but they are costly and time-intensive.
Enzyme-linked immunosorbent assay (ELISA)-based surrogate VNTs (sVNT) or
anti-SARS-CoV-2 spike protein receptor binding domain immunoglobulins
(anti-S-RBD Ig) may be suitable alternatives to VNTs. We aimed to (a) explore
the correlations between anti-S-RBD Ig, VNT, and sVNT measurements and (b)
describe humoral immunity against SARS-CoV-2 after vaccination, natural
infection, and vaccine breakthrough infection in healthy blood donors.
METHODS: We measured total anti-SARS-CoV-2
Ig in 5714 serum samples from 2748 healthy individuals visiting the Swiss Red
Cross Blood Donation Centre in Basel from 03/2020 to 04/2022. We used the
Elecsys® Anti-SARS-CoV-2 immunoassay (Roche) against the N- and S-receptor binding
domain (RBD) proteins. In a subset of 548 samples from 123 donors, we conducted
sVNTs against the Wuhan wild-type SARS-CoV-2 (SARS-CoV-2 Neutralizing
Antibodies Detection Kit; Adipogen™). In 100 samples from 40 donors, we
correlated sVNT and VNTs against the wild-type (D614G WU1) virus. Surveys were
sent to the blood donors to collect data on their SARS-CoV-2 infection and
vaccination status. Using this data, donors were categorised as “vaccination
only”, “infection before vaccination”, “post-vaccine breakthrough infection”,
and “natural infection only”.
RESULTS: Our longitudinal observation study
cohort consisted of 50.7% males with a median age of 31 years (range 18–75 y). Anti-SARS-CoV-2
N protein positivity rates per month indicate 57.1% (88/154) of the cohort was infected
up to 04/2022. No differences in seropositivity were found between sexes, age
groups, blood types (AB0 or RhD), and cytomegalovirus serostatus. We observed a
high correlation between anti-S-RBD Ig and inhibition percentage (Spearman’s ρ = 0.92, Kendall’s τ = 0.77, p
<0.0001). We determined the sensitivity and specificity for the
manufacturers’ thresholds for detecting virus-neutralising effects and computed
the “best” cut-off based on our real-world data. We categorised 722/1138
(63.5%) donors as vaccination only (82.3%), post-vaccine breakthrough infection
(7.8%), infection before vaccination (5.8%), and natural infection only (4.2%).
We observed a lower inhibition percentage in the natural infection-only group than
in all other vaccinated groups. The infection before vaccination group had
higher anti-S-RBD Ig titres after the first vaccine dose than the other vaccinated
groups.
CONCLUSION: In total, 57.1% of healthy
blood donors were infected with SARS-CoV-2, but natural infection without
evidence of vaccination seems to result in substantially lower neutralising
antibody levels. An estimate of antibody neutralisation may be helpful to
assess reinfection risk. Total anti-S-RBD Ig correlates with surrogate virus
neutralisation test results, a surrogate for neutralisation; therefore, we
suggest that total anti-S-RBD Ig may estimate the level of neutralising
antibodies. The threshold for protection from an unfavourable clinical outcome must
be evaluated in prospective clinical cohorts.
Introduction
More than four years have passed since the
severe acute respiratory syndrome coronavirus 2 (SARS-CoV-2) emerged in
December 2019. Enormous efforts have been made to mitigate this new pandemic
virus, including the rapid development of vaccines, global vaccination
campaigns, public health countermeasures, and vigilance programs. In
Switzerland, the first SARS-CoV-2 case was reported in February 2020, and
various variants of concern have subsequently appeared. The severity of
coronavirus disease 2019 (COVID-19) has decreased mainly due to vaccine-induced
protection [1]. However, the Alpha (December 2020), Delta (May 2021), and
Omicron (November 2021) variants of concern have nonetheless rapidly spread
within the population. Understanding the specific immune response to SARS-CoV-2
at individual and population levels is crucial for understanding transmission
between individuals, protecting individuals at high risk of severe disease, and
helping to further improve epidemiological models.
One approach is monitoring humoral immunity
using antibodies against SARS-CoV-2 and neutralising antibodies (nAb). Among
the four structural proteins of SARS-CoV-2, the most immunogenic sites are the
Nucleocapsid (N) protein and surface Spike glycoprotein (S) [2]. Previous work has
shown that humoral immunity after infection mainly consists of anti-N and
anti-S immunoglobulins (Ig). However, vaccines have mainly been designed against
the S protein [3]. Therefore, anti-S and anti-S receptor binding domain (RBD)
Ig seropositivity alone serves as a vaccination indicator. In contrast, anti-N
Ig seropositivity can be used as a proxy for infection. Among the range of
antibodies against the S protein, nAbs neutralise the virus’ ability to enter
and infect new host cells by blocking the viral RBD [4]. Therefore, neutralising
antibodies are considered to correlate with protection from SARS-CoV-2
infections [5, 6].
The gold standard method to determine neutralising
antibody levels is the classical live virus neutralisation test (VNT) [7].
However, VNTs require a biosafety level 3 (BSL3) laboratory and are costly and
time-intensive. So-called surrogate virus neutralisation tests (sVNT) based on
an enzyme-linked immunosorbent assay (ELISA) were developed to overcome the
limitations of VNTs. In these assays, neutralising antibodies present in the
sera and angiotensin-converting enzyme 2 (ACE2) compete for binding to the SARS-CoV-2
S-RBD.
In this study, we prospectively collected
more than 5000 longitudinal serum samples from healthy blood donors at the
Regional Swiss Red Cross Blood Transfusion Center in Basel, Switzerland. We
monitored the humoral immunity against SARS-CoV-2 from March 2020 to April
2022. Using our real-world dataset, we aimed to (a) explore the correlations
between anti-S-RBD Ig, virus neutralisation tests, and surrogate virus
neutralisation tests and (b) describe humoral immunity against SARS-CoV-2 after
vaccination, natural infection, and post-vaccine breakthrough infections.
Materials and methods
Collection of serum samples, metadata, and data curation
We collected serum samples from healthy
blood donors residing in the canton of Basel Stadt (BS), Switzerland, at the
blood donation centre from March 2020 to the end of April 2022. The serum samples
were stored at –80 °C until batchwise determination of humoral immunity. The
numbers of samples or individuals included in the various analyses described
below are summarised in figure 1.
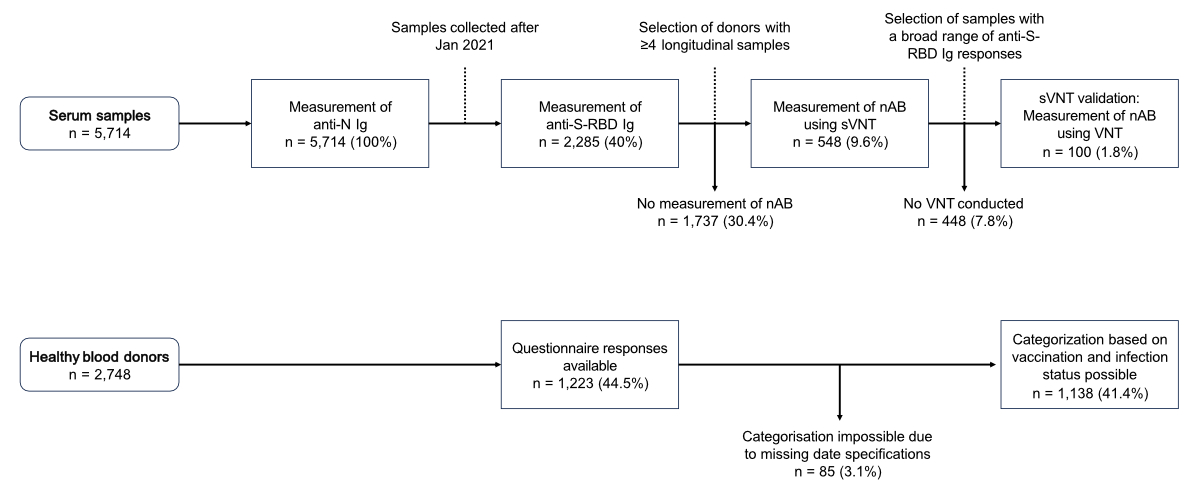
Figure 1Overview of the subsampling criteria and the numbers
of samples or healthy blood donors included in the different analyses. The
upper part shows the subsampling criteria and the number of samples in the
different subsets for the various analyses. The lower part summarises the
questionnaire responses and the vaccination and infection status categorisation
results. anti-N: anti-SARS-CoV-2 nucleocapsid protein; anti-S-RBD:
anti-SARS-CoV-2 spike glycoprotein receptor binding domain; Ig: immunoglobulin;
sVNT: surrogate virus neutralisation test; nAb: neutralising antibodies; VNT:
classical virus neutralisation test.
Data collected on donors included sex,
birth year, blood type (AB0 and RhD), and cytomegalovirus (CMV) serostatus.
Specific data on past SARS-CoV-2 infections and vaccinations and the respective
dates were collected retrospectively through a questionnaire sent to the donors
in October 2022. We received 1223 responses from 2748 requests (44.5%). In case
of ambiguous vaccination or infection date entries, the dates were manually
determined (figure S1 in the appendix) while minimising
date errors; this manual date determination was applied for 121/1223 (9.9%)
donors. Lastly, if donors were vaccinated with the Janssen vaccine
(Ad26.COV2-S) for their first dose, we defined them as fully vaccinated after only
one dose (n = 7, 0.6%). Standard time intervals between the vaccine doses and
vaccination schemes were considered for each vaccine for our analyses, as
readily summarised by Ghasemiyeh et al. [8]. The study was conducted according
to the Declaration of Helsinki and approved by the Ethikkommission Nordwest-
und Zentralschweiz (EKNZ 2020-00769), Switzerland. Informed consent was
obtained from all subjects involved in this study.
Detection of anti-SARS-CoV-2 N and S protein
antibodies
We tested for SARS-CoV-2 anti-N and
anti-S-RBD antibodies using the Elecsys® Anti-SARS-CoV-2 and Elecsys® Anti-SARS-CoV-2 S immunoassays
(Roche Diagnostics, Switzerland) following the manufacturer’s instructions. Their
results are reported as semi-quantitatively determined Ig levels. The limit of
quantification for the anti-S-RBD measurements was 0.4–2500 U/ml. We classified
samples with an output value of ≥1.0 cut-off index (COI) and ≥0.8 U/ml as
reactive (i.e. positive) for anti-N and anti-S-RBD Ig, respectively. Furthermore,
Roche determined a cut-off for the presence of neutralising antibodies as ≥15
U/ml. Those samples showed 50% neutralisation at a sample dilution of over 1:20
in a plaque-reducing neutralisation (PRNT) assay and, therefore, could
functionally neutralise the live virus in vitro [9]. We tested all samples for
anti-N Ig; however, serial testing of anti-S-RBD Ig started in January 2021
with vaccine availability in Switzerland.
Detection of neutralising antibodies by surrogate
virus neutralisation tests
We used an ELISA-based surrogate virus
neutralisation test to measure the neutralising activity. We used the
SARS-CoV-2 Neutralising Antibodies Detection Kit (AG-48B-0002-KI01, Adipogen™, Switzerland)
according
to the manufacturer’s instructions. Briefly, neutralising antibodies in the
serum compete against the human recombinant angiotensin-converting enzyme 2 conjugated
to horseradish peroxidase for binding to the SARS-CoV-2 S-RBD (Wuhan wild-type).
After peroxidase activity was quantified using 3,3’,5,5’-tetramethylbenzidine,
the percentage inhibition (inh%) was calculated as follows:
The measured reduction in the optical
density (OD) indicates the inhibition of the interaction between the RBD and angiotensin-converting
enzyme 2, indicating the presence of neutralising antibodies. The cut-off value
for positivity was set at 20% inhibition, according to the manufacturer. We conduct
the ELISA assay on samples from donors with at least four longitudinal samples.
We also included some donors with fewer than four longitudinal samples,
especially those in the “natural infection only” category (see the
classification of donors section below).
Validation of surrogate virus neutralisation tests
by live virus serum neutralisation test
We validated the surrogate virus
neutralisation tests by comparing a subset of 100 serum samples from 40 donors to
neutralisation titres observed in a classical VNT using live SARS-CoV-2 viruses
(D614G WU1, BetaCoV/Germany/BavPat1/2020, Acc. No. EPI_ISL_406862) and transmembrane
serine protease 2 (TMPRSS2)-expressing Vero E6 cells (VeroE6/TMPRSS2;
NIBSC Research Reagent Depository, UK). The samples were selected to include a wide
range of anti-S-RBD Ig levels, including negative samples (≤0.4 U/ml). First, the
serum was serially diluted twofold from 1:10 to 1:1280 and mixed with 100 plaque-forming
units of virus per well. After 1 h of incubation, the mixture was added to
confluent VeroE6/TMPRSS2 cells. Two positive controls, a vaccinee serum from an
individual immunised with monovalent mRNA vaccine (from an ongoing study at the
Institute of Virology and Immunology [IVI], Bern and Mittelhäusern,
Switzerland) and guinea pig serum immunised with pseudotype VSV-SARS-CoV-2 (IVI,
in house), as well as a negative control, unimmunised guinea pig serum (IVI, in
house), were also tested. The neutralisation titre was defined as the highest
dilution at which the serum was still protective against the virus, determined
by the cytopathic effect (i.e.
the titre at which the serum was still protective against the virus). Samples
that did not neutralise the virus at the lowest dilution of 1:10 are reported
as “<1:10”. Therefore, all samples with a dilution of ≥1:10 were classified
as positive and <1:10 as negative for neutralising activity (see appendix).
A total of 82 and 18 samples were
classified as positive (inhibition percentage ≥20%) and negative (inhibition
percentage <20%), respectively, for neutralising antibodies in the surrogate
virus neutralisation tests. In the classical VNT, 75 samples had a serum
dilution ≥1:10 and 25 samples had a dilution below 1:10 and, therefore, were
classified as positive and negative, respectively. Next, the sVNT results were
plotted against the classical VNT results, and the Kendall correlation
coefficient (τ) was computed
(figure S2 in the appendix). The sVNT results
were significantly correlated with the classical VNT results (Kendall’s τ = 0.73, p <1e–4 ).
Assuming the classical VNT results are the ground truth, the wild-type sVNT had
a sensitivity of 96%, specificity of 60%, positive predictive value of 87.8%,
and negative predictive value of 83.3%.
Classification of donors into infection and
vaccination status categories based on questionnaire data
To compare serological responses and
describe humoral immunity against SARS-CoV-2 after vaccination, natural
infection, and breakthrough infections, and based on the information collected
with the questionnaire, we classified the donors into four categories: (a)
“vaccination only” (vac), if donors specified to have been vaccinated but not
infected; (b) “natural infection only” (inf), if donors specified to have been
infected but not vaccinated; (c) “infection before vaccination” (infvac), if
donors specified to have been vaccinated and infected, and the date of the
first infection was before the date of the first vaccine dose; (d)
“post-vaccine breakthrough infection” (bt), if donors specified to have been
vaccinated and infected, and if the date of the first infection was after
complete vaccination. We only considered infections confirmed by a PCR or rapid
antigen test. Further, we considered donors completely vaccinated after
receiving a second dose of the mRNA or AstraZeneca vaccines or the first dose
of the Janssen vaccine [8]. Please note that only infection and vaccination
dates before a donor’s last collected serum sample date were considered for
classification, allowing the correct classification of their infection and
vaccination status within the study’s timeframe and set of samples.
Statistical data analysis
The statistical data analyses were
conducted using R Studio (version 2022.07.2) with the R (version 4.2.1;
2022-06-23) [10] packages Tidyverse (1.3.2) [11] and plotROC (2.3.0) [12].
Correlations were evaluated by computing Spearman’s rank correlation
coefficient (ρ) and Kendall’s rank
correlation coefficient (τ). Seroprevalence was compared between different cohort
characteristics (sex, age, blood types, and cytomegalovirus seropositivity) by
computing a Fisher’s exact test between each month, and the p-values were
adjusted using the Benjamini and Hochberg [13] correction method. The timings
of various variants of concern appearing in Switzerland were determined as the
first month where the proportion of the specific variant of concern exceeded 2%
of all sequenced samples in the Global Initiative on Sharing All Influenza Data
[14] from the Swiss Pathogen Surveillance Platform (www.spsp.ch) provided on
the CoV-Spectrum website (https://cov-spectrum.org). The area under the
receiver operating characteristic curve (AUROC) was computed to define an
optimal anti-S-RBD Ig cut-off for neutralising antibody prediction. Confusion
matrices were constructed for each cut-off to calculate the specificity,
sensitivity, positive predictive value (PPV), and negative predictive value
(NPV).
Results
Cohort of healthy blood donors
In total, we analysed 5714 serum samples
from 2748 healthy blood donors. The median number of samples collected per
donor was 1 (interquartile range [IQR] = 1–3; range = 1–19). The cohort comprised
50.7% males (n = 1392) and 49.3% females (n = 1356) with a median age of 31
years (IQR = 26–44; range = 18–75). The most common blood types were 0 (45.1%, n
= 1169) and A (40.4%, n = 1048), with much fewer donors having blood types B (10.1%,
n = 261) and AB (4.4%, n = 113). Most donors were RhD positive (80.1%, n =
2075) and seronegative for cytomegalovirus (60.3%, n = 289). Table 1 summarises the
cohort characteristics overall and separately for
each year (2020–2022).
Table 1Descriptive characteristics of the study cohort
overall and by year of sample collection. The characteristics were determined
at the time of study inclusion, and donors with unknown characteristics were
not included in the percentage calculations.
| Characteristic |
Overall |
2020 |
2021 |
2022 |
| n = 2748* |
n = 1705* |
n = 862* |
n = 181* |
| Sex |
Female |
1356 (49.3%) |
830 (48.7%) |
432 (50.1%) |
94 (51.9%) |
| Male |
1392 (50.7%) |
875 (51.3%) |
430 (49.9%) |
87 (48.1%) |
| Age |
Mean (SD) |
36 (13) |
37 (14) |
33 (12) |
34 (12) |
| Median (IQR) |
31 (26, 44) |
32 (26, 48) |
29 (25, 38) |
30 (25,
40) |
| Range |
18, 75 |
18, 74 |
18, 75 |
18, 75 |
| Age group |
18–29 years |
1195 (43.5%) |
678 (39.8%) |
435 (50.5%) |
82 (45.3%) |
| 30–39 years |
720 (26.2%) |
434 (25.5%) |
233 (27.0%) |
53 (29.3%) |
| 40–49 years |
290 (10.6%) |
196 (11.5%) |
74 (8.6%) |
20 (11.0%) |
| 50–59 years |
306 (11.1%) |
220 (12.9%) |
67 (7.8%) |
19 (10.5%) |
| ≥60 years |
237 (8.6%) |
177 (10.4%) |
53 (6.1%) |
7 (3.9%) |
| Blood type |
A |
1048 (40.4%) |
639 (38.9%) |
344 (44.2%) |
65 (38.2%) |
| B |
261 (10.1%) |
168 (10.2%) |
72 (9.2%) |
21 (12.4%) |
| AB |
113 (4.4%) |
70 (4.3%) |
37 (4.7%) |
6 (3.5%) |
| 0 |
1169 (45.1%) |
765 (46.6%) |
326 (41.8%) |
78 (45.9%) |
| Unknown |
157 |
63 |
83 |
11 |
| Rh factor |
Positive |
2075 (80.1%) |
1300 (79.2%) |
633 (81.3%) |
142 (83.5%) |
| Negative |
516 (19.9%) |
342 (20.8%) |
146 (18.7%) |
28 (16.5%) |
| Unknown |
157 |
63 |
83 |
11 |
| Cytomegalovirus
serology |
Positive |
190 (39.7%) |
144 (39.7%) |
39 (41.9%) |
7 (30.4%) |
| Negative |
289 (60.3%) |
219 (60.3%) |
54 (58.1%) |
16 (69.6%) |
| Unknown |
2269 |
1342 |
769 |
158 |
Serological responses against SARS-CoV-2 N- and
S-proteins
Overall serology results
We tested 5714 and
3319 serum samples for anti-N and anti-S-RBD Ig, respectively. The anti-S-RBD
Ig measurements are shown from January 2021 onwards once vaccines became
available in Switzerland. Figure 2
shows the percentage of positive tests for each month (anti-N Ig levels ≥1.0
COI, anti-S-RBD Ig levels ≥0.8 U/ml). We noted a slight increase in anti-N Ig
responses after the Alpha (December 2020) and Delta (May 2021) variants appeared
in Switzerland. However, the positivity rate plateaued around 10% from December
2020 to November 2021. With the start of the Omicron wave in November/December
2021, we noted an increase in positive tests to 57.1% in April 2022. We
observed an increase in the anti-S-RBD Ig seroreactivity during six months,
from 8.5% in January to 87.1% in July 2021. In the following months, the
positivity rate plateaued and finally reached 98.7% in April 2022.
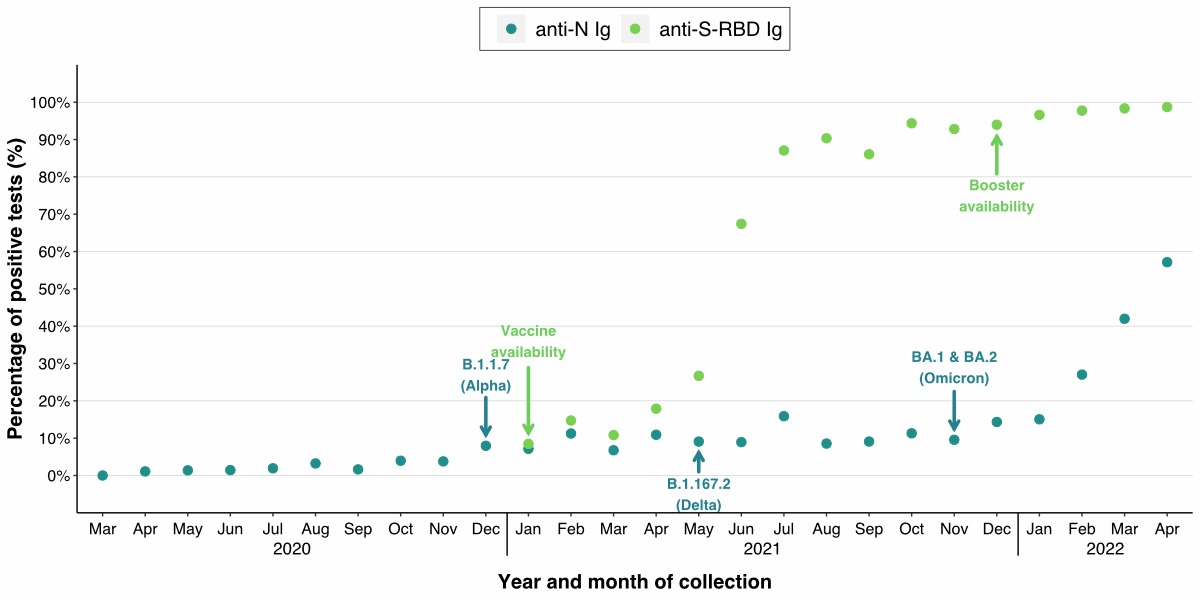
Figure 2Cumulative monthly seropositivity rates for
anti-N and anti-S-RBD Ig in sera from healthy blood donors. The percentage of
positive tests for anti-N (blue) and anti-S-RBD Ig (green) was calculated for
each month. Samples were classified as positive if the anti-N Ig level was ≥1.0
COI and the anti-S-RBD Ig was ≥0.8 U/ml. The blue arrows show the appearance of
a new SARS-CoV-2 variant of concern in Switzerland. The green arrows show time
points when the vaccine and booster doses were made available in Switzerland.
COI: cut-off index; anti-S-RBD: anti-SARS-CoV-2 spike glycoprotein receptor
binding domain.
Serology results
by donor characteristics
The percentages of
positive tests (anti-N Ig levels ≥1.0 COI, anti-S-RBD Ig levels ≥0.8 U/ml) per
sample collection month were calculated for each group within the donor
characteristics. We found no statistically significant differences in
seroreactivity between sexes, blood types (AB0 and RhD), and cytomegalovirus
positivity. However, we observed statistically significant differences in
positivity rates among age groups for the anti-S-RBD Ig measurements in May 2021
(padjusted <0.05) (figure
3).
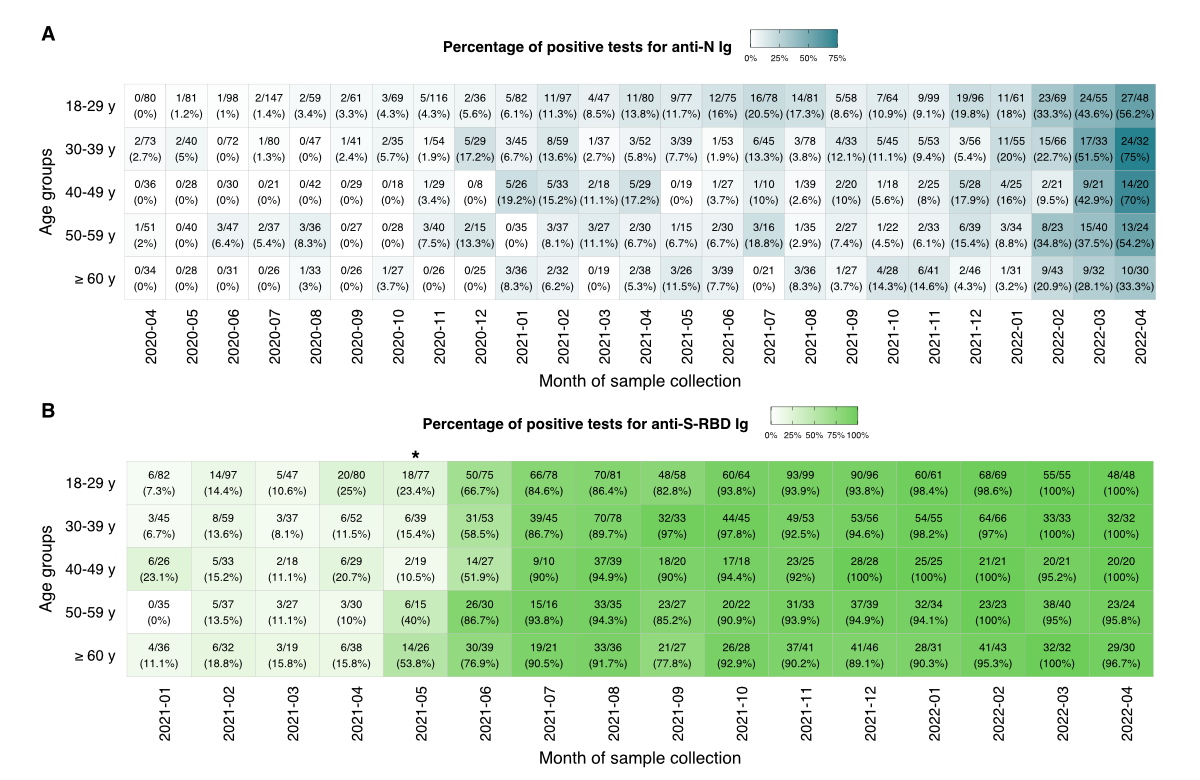
Figure 3Serological responses by age group over time.
The proportions (positive tests / total tests) and percentages of positive
tests for anti-N Ig (A) and
anti-S-RBD Ig (B) were calculated
for each month and age group and are shown on a colour scale where light or
dark hues correspond to lower or higher percentages, respectively. Samples were
classified as positive if the anti-N Ig level was ≥1.0 COI and the anti-S-RBD
Ig was ≥0.8 U/ml. The asterisk denotes the month where a significant difference
was found between age groups (Fisher’s exact test with a Benjamini and Hochberg
correction for multiple comparisons; padjusted <0.0451). COI: cut-off
index; anti-S-RBD: anti-SARS-CoV-2 spike glycoprotein receptor binding domain.
Measurement of neutralising antibodies using the surrogate
virus neutralisation tests
We conducted a correlation analysis to
evaluate whether the anti-S-RBD Ig measurements could predict the presence of neutralising
antibodies (surrogate virus neutralisation tests) in serum. We excluded 10
samples from the 548 samples due to a lack of sample material to measure
anti-S-RBD Ig, resulting in 538 samples for this analysis. The strength of the
correlation was assessed using Spearman’s ρ (0.92, p <0.0001) and Kendall’s τ (0.77, p <0.0001) figure
4A).
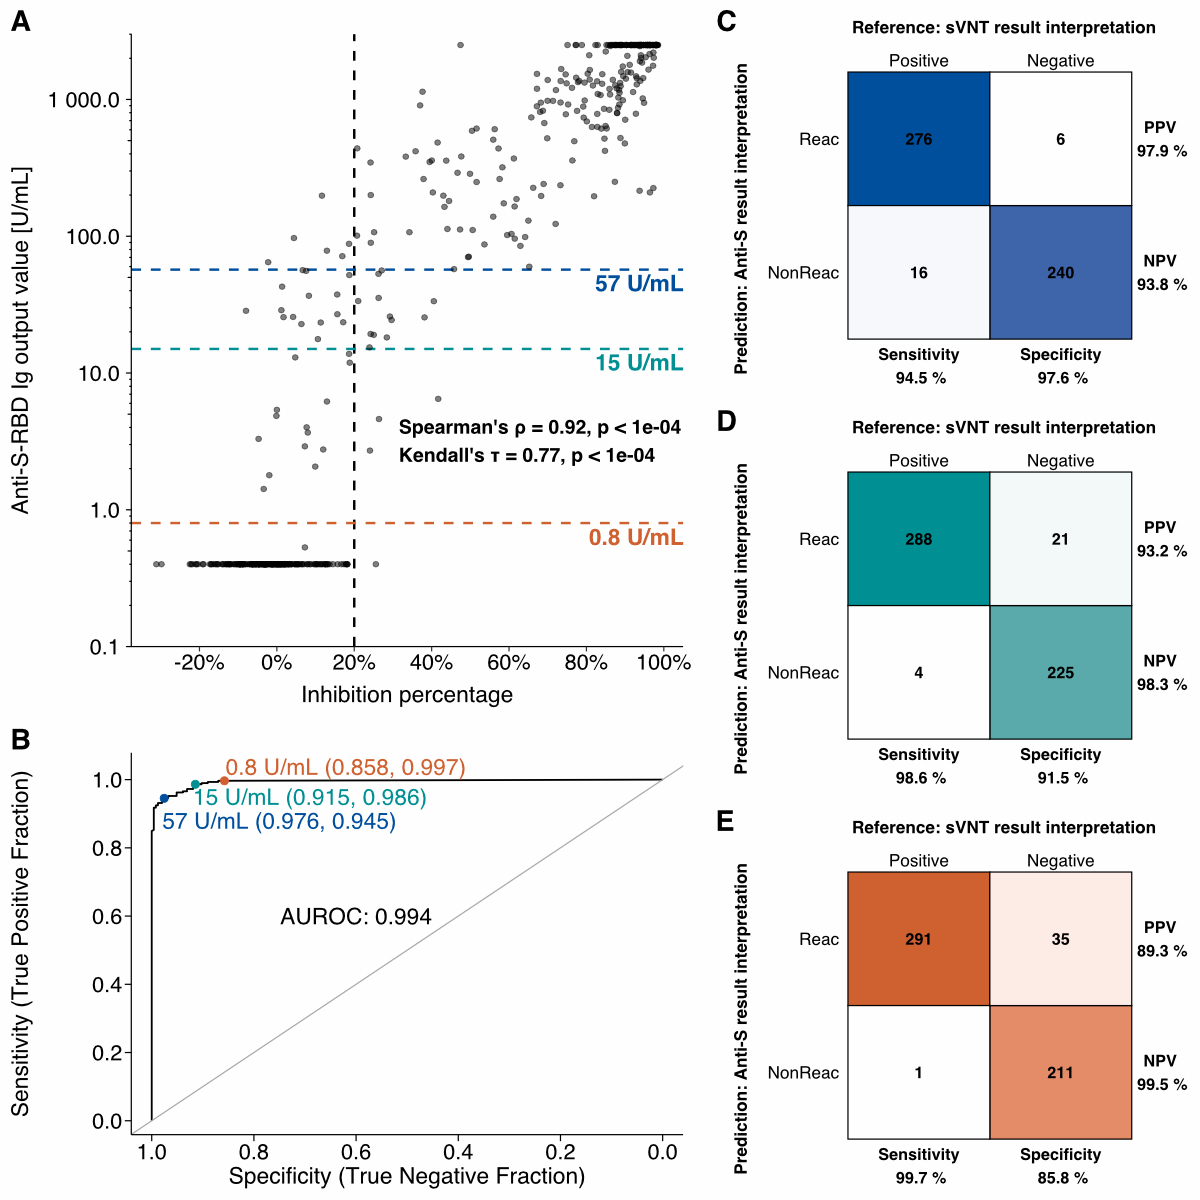
Figure 4Correlation analysis of Elecsys®
Anti-SARS-CoV-2 S results vs
wild-type SARS-CoV-2 surrogate virus neutralisation test (sVNT) results. A The anti-S-RBD Ig output values plotted against the inhibition
percentages (i.e. the sVNT
results), where each dot represents a serum sample. The black vertical dashed
line denotes the cut-off for the presence of neutralising antibodies (nAb) at
20% inhibition, as measured in the sVNT. The orange (0.8 U/ml) and teal (15 U/ml)
dashed lines denote the cut-off for anti-S-RBD Ig reactivity and nAb presence,
respectively. The blue (57 U/ml) dashed line denotes the anti-S-RBD Ig output
value at the highest Youden’s index. Spearman’s ρ and Kendall’s τ were calculated. B The receiver operating characteristic
curve and calculated AUROC. The orange, teal, and blue points represent the
abovementioned cut-offs and their respective specificity and sensitivity values
are shown in brackets. Confusion matrices were plotted for the cut-offs (C) 57 U/ml, (D) 15 U/ml, and (E) 0.8 U/ml.
anti-S-RBD Ig: anti SARS-CoV-2 spike receptor binding domain immunoglobulins;
AUROC: area under the receiver operating characteristic curve; ROC: receiver
operating characteristic; Reac: reactive for anti-S-RBD Ig; NonReac:
non-reactive for anti-S-RBD Ig; PPV: positive predictive value; NPV: negative
predictive value; anti-S-RBD: anti-SARS-CoV-2 spike glycoprotein receptor
binding domain.
The AUROC curve revealed good predictive
performance of anti-S-RBD Ig levels for neutralising antibody presence (figure
4B, AUROC = 0.994). Based on our dataset, the appropriate cut-off for
anti-S-RBD Ig levels predicting nAb presence was 57 U/ml, representing the
anti-S-RBD Ig titre at the maximum Youden’s index (sensitivity + specificity
– 1). Based on this cut-off, the presence of nAb in the sera could be predicted
with a sensitivity of 94.5% and a specificity of 97.6% (positive predictive
value = 97.9%, negative predictive value = 93.8%).
Figures 4C-E show confusion matrices for three different anti-S-RBD Ig titre
cut-offs to predict nAb presence: 57 (figure 4C), 15 (figure 4D), and 0.8 (figure
4E) U/ml. The latter two cut-offs (15 and 0.8 U/ml) are those specified in the
Elecsys® package
insert for detecting the presence of nAb and anti-S-RBD Ig seropositivity,
respectively.
Humoral immunity after vaccination, natural infection,
and breakthrough infection
In total, 1223/2748 questionnaires (44.5%)
were answered. The responding donors were classified into their respective
infection and vaccination status groups. Due to missing data entries in the
questionnaire, 85 donors (7%) could not be classified. To summarise, 594/1138
donors (52.2%) were classified as vac (“vaccination only”), 56/1138 donors
(4.9%) as bt (“post-vaccine breakthrough infection”), 42/1138 donors (3.7%) as
infvac (“infection before vaccination”), and 30/1138 donors (2.6%) as inf
(“natural infection only”). There were 416/1338 donors (36.6%) who were not
vaccinated or infected between the collection of their first and last serum
samples.
The times of the collected samples were
aligned to the first vaccination date to assess whether humoral immunity levels
varied between the donors’ infection and vaccination backgrounds. For each
donor, the time difference (in days) between the collection date of each sample
and the first vaccination date was calculated. To assess whether vaccination
would always result in an increase in the anti-S-RBD Ig titre, we selected one
sample collected immediately before and after the first vaccination date for
each donor (figure 5A). With
only a few exceptions, the anti-S-RBD Ig titre increased after the first
vaccination dose in all vaccination categories (vaccination only, infection before
vaccination, and post-vaccine breakthrough infection). In the vaccination-only and
post-vaccine breakthrough infection groups, almost all samples collected before
vaccination were negative for anti-S-RBD Ig. However, afterwards, the output
values were widely distributed. In contrast, most samples in the infection before
vaccination group were reactive to anti-S-RBD Ig before vaccination, with the maximum
output values reached after the first vaccine dose.
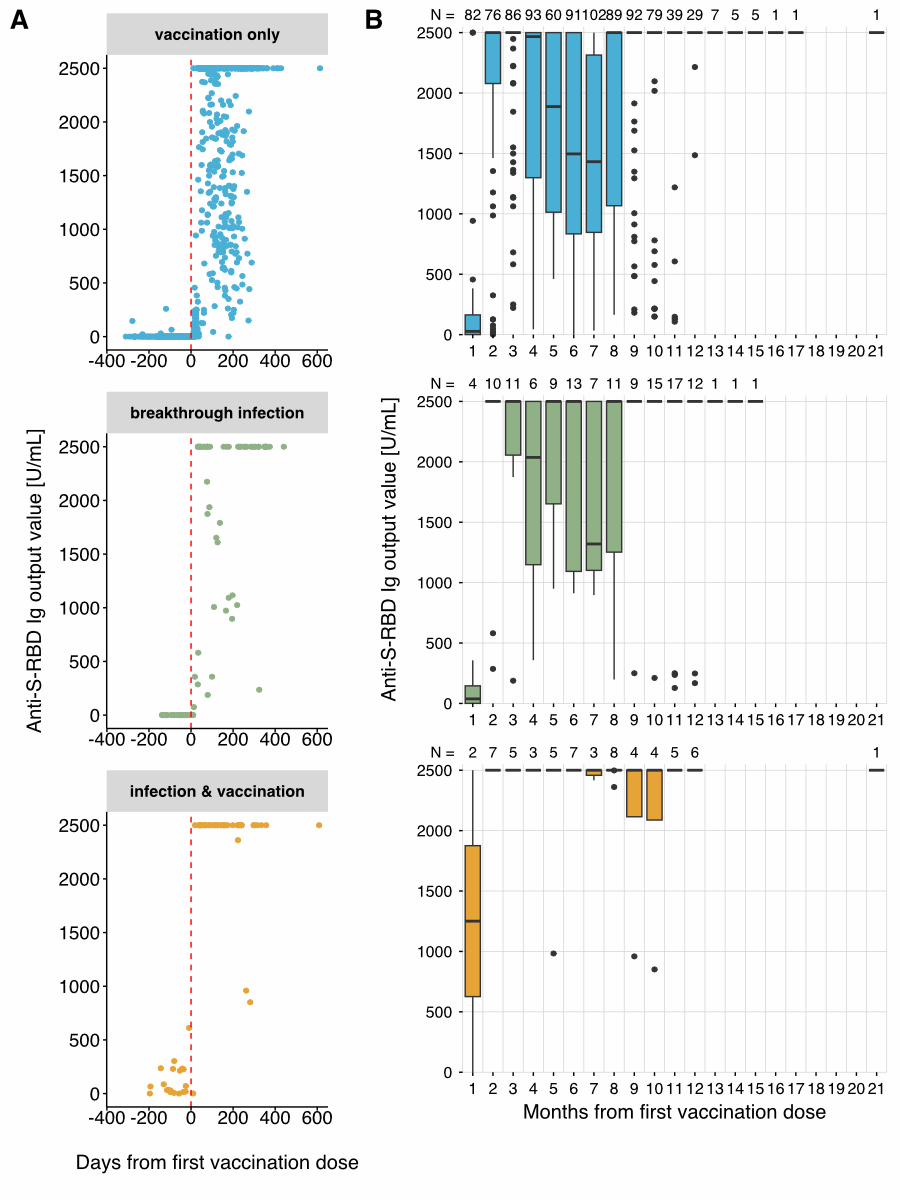
Figure 5Anti-S-RBD Ig titres
by infection and vaccination status. A
Samples collected right before and after the specified first vaccination date
were selected for each donor and normalised to the first vaccination date. The
anti-S-RBG Ig titres of the abovementioned samples were grouped by infection
and vaccination status. The red dashed line denotes the first vaccination date (day
0). B The median anti-S-RBD output values summarised by month from the
donors’ respective first vaccination dose. Colours represent the donors who
were only vaccinated (vac, blue), who have experienced a post-vaccine
breakthrough infection (bt, green), and who have been naturally infected before
being vaccinated (infvac, orange). In B,
the respective number of samples included in the calculations per month is shown above
each bar. Anti-S-RBG Ig: anti-SARS-CoV-2 spike receptor binding domain
Immunoglobulins.
Next, we binned all measurements by donor
and month after their respective first vaccination date (figure 5B). As noted above,
the vaccination-only
and post-vaccine breakthrough infection groups showed similar anti-S-RBD Ig
courses over time. The median anti-S-RBD Ig output values were very low within
a month of the first vaccination dose (≈ 30 U/ml) and then steeply increased
within two to three months. After a decrease in output values by four months,
especially in the vaccination-only group, a second steep increase was observed
from eight months onwards. In contrast, in the infection before vaccination
group, the anti-S-RBD Ig output values were already elevated within one month
of the first vaccination dose, and the median did not decrease over time.
However, this group had a small sample size (nmax = 8).
Finally, we compared the inhibition
percentage determined in the surrogate virus neutralisation test between the
infection and vaccination categories (figure
S3). The post-vaccine breakthrough infection group had the highest
median inhibition percentage (91.5%), followed by the vaccination-only (87.4%) and
infection before vaccination (83.9%) groups. The lowest median inhibition
percentage was observed in the natural infection-only group (32.5%). However,
the natural infection group had a small sample size (n = 6); therefore, its
results should be interpreted cautiously.
Discussion
Three key findings emerge from our data.
First, in April 2022, four months after the appearance of the Omicron variants
in Switzerland, almost 60% of the healthy blood donors in Basel were reactive
to anti-N Ig and 99% to anti-S-RBD Ig, which can be cautiously interpreted as
the infection and vaccination rates, respectively. Second, we also observed a
high correlation between anti-S-RBD Ig and surrogate virus neutralisation tests
(p <0.0001). Third, infection followed by vaccination resulted in a higher
and more prolonged anti-S-RBD Ig level than vaccination alone.
Data available on the percentage of
SARS-CoV-2 positive tests (PCR and rapid antigen) and the number of
administered vaccinations for the canton of Basel Stadt match our findings [15,
16] (figure S4). However, the
infection and vaccine rates over time are slightly lower than in our data (figure
2), potentially because many
individuals in the cohort donated blood repeatedly, resulting in an essentially
cumulative positivity rate. Furthermore, our data might have a sampling bias since
blood donors potentially follow vaccine recommendations and public health
precautions more strictly.
Surprisingly, we did not observe a sex
difference in humoral immunity in our cohort, and the percentage of positive
tests (anti-N Ig levels ≥1.0 COI, anti-S-RBD Ig levels ≥0.8 U/ml) only differed
significantly between age groups for only one month. A systematic review by Notarte
et al.[17] showed that older males had lower humoral responses amongst
various criteria. They suggested this could be due to a functional decline in
the immune system with age and the immunomodulating properties of hormones,
leading to higher antibody production in females [18, 19]. We performed a
similar analysis of the anti-S-RBD Ig titres by calculating their median per
month after the first vaccination dose using data obtained through the
questionnaire. However, we did not observe any differences in the antibody
levels, even in the various subgroups.
We evaluated the functional anti-S
antibodies, specifically the neutralising antibody levels, which have been
proposed to correlate with protective immunity [5, 6]. We showed that
anti-S-RBD Ig measurements correlated well with the presence of nAb. Many
studies have thoroughly investigated this relationship previously. For example,
Kitagawa et al. [20] observed strong correlations between the inhibition
percentages measured in the surrogate virus neutralisation tests and the anti-S
IgM and IgG measurements (Spearman’s ρ = 0.95 and 0.96, respectively; p <0.001). Furthermore, Roche
states on their website and in the package insert for the Elecsys® Anti-SARS-CoV-2 S
immunoassay [9] that an anti-S-RBD Ig titre of over 15 U/ml indicates the
presence of nAb. In contrast, we determined a cut-off of 57 U/ml in our dataset.
The difference in cut-off may be due to the different methods used to determine
nAb presence. We conducted a surrogate virus neutralisation test, whereas Roche
compared their measurements with the results of an in-vitro plaque-reducing
neutralisation assay, considering samples achieving 50% neutralisation at a
sample dilution of >1:20 as positive for neutralising activity. Different
cut-offs have been described as associated with neutralisation, possibly due to
differences in sample sets/cohorts and statistical approaches. We computed the
Youden’s index to determine a suitable cut-off. Choosing a cut-off may be optimised
for better sensitivity or specificity.
We also observed that, in almost all cases, a single vaccine dose
led to an increase in anti-S-RBD Ig titres within one month. Similarly, we showed
that the first vaccine dose given to previously naturally infected donors acted
as a “booster dose”. The median anti-S-RBD Ig titres were substantially higher
immediately after the first vaccination and persisted longer in the infection before
vaccination group compared to the vaccination-only and post-vaccine
breakthrough infection groups. This “hybrid immunity” has already been
previously associated with an increased humoral response to SARS-CoV-2 [21–24]. Furthermore,
we observed a lower inhibition percentage, as
measured in the surrogate virus neutralisation test, in the “natural infection only”
group than
in all other vaccinated groups, suggesting that less neutralising antibodies
may be elicited after only a natural infection. Assis et al. investigated
the difference in humoral immunity responses in naturally infected individuals
and mRNA vaccinees. They observed that the vaccines elicited higher and broader
antibody levels than natural infections alone. Notably, they observed that sera
of vaccinees had a higher antibody titre specifically against receptor binding
domain segments [25]. Our findings may support this observation since we
observed a significant correlation between anti-S-RBD Ig measurements and neutralising
antibodies.
Interestingly, 24 donors had a sample that
was nonreactive for anti-S-RBD Ig after vaccination. However, almost all
samples were collected within 21 days of vaccination, and the antibodies may
have been undetectable due to the short interval between sample collection and
the first vaccine dose. Leuzinger et al. found that SARS-CoV-2 antibody assays
had lower sensitivity in the first one to two weeks after a positive SARS-CoV-2
diagnosis [26]. Furthermore, as the second dose had not yet been administered,
it could be assumed that a single vaccine dose might be insufficient to induce
antibodies in those donors. Two samples were still negative for anti-S-RBD Ig
36 and 178 days after the first vaccine dose, respectively. Examining the
questionnaire of the first donor, we could see that no second vaccination had
been administered at the time of the sample collection, although 36 days had
passed since the first dose. The donor also specified having no infection in
the meantime. Again, the first dose might have been insufficient to elicit
measurable antibodies for this donor.
One limitation of our study was the self-reported
questionnaire, which may contain errors. Second, our study was not a
prospective vaccine trial, and our data consisted of real-world humoral
surveillance monitoring. Third, the vaccination-only group contained six
samples that were collected before the first vaccination dose but tested
positive for anti-S-RBD Ig (≥0.8 U/ml) (figure
5A). A closer inspection of the serological results revealed that five
of these samples were also positive for anti-N Ig (≥1.0 COI). Furthermore, one
was positive for anti-S-RBD Ig but not anti-N Ig before the first vaccination
date. Therefore, we could conclude that either the anti-S-RBD Ig measurements
were falsely positive, vaccination dates were incorrectly specified, or donors
had a subclinical or asymptomatic infection before vaccination or simply forgot
about the infection. Fourth, we lack data on the vaccination and infection
status of 58.6% (1610/2748) of the donors since there was either no response to
the questionnaire or missing data entries, making it impossible for them to be
classified into the respective status, which may have introduced an unknown
bias in some of our analyses. Fifth, the surrogate virus neutralisation test
used only wild-type RBD. The receptor binding domains of the different variants
of concern are structurally divergent from the wild-type and each other due to
mutations, and it has been shown that those mutations can lead to immune
evasion [27, 28]. Therefore, if an individual tests positive for neutralising
antibodies according to our threshold for the anti-S-RBD Ig titre, those nAbs
might be unable to effectively neutralise the other variants of concern and
newly emerging variants to the same extent. Finally, we do not have complete
data for all donor characteristics (e.g. the blood type [AB0 and rhesus] and cytomegalovirus
serology status), which may have prevented us from observing a possible
connection between those characteristics and the serological responses over
time.
Our dataset included samples collected over
more than two years from the very start of the COVID-19 pandemic, covering
several infection waves caused by various novel variants of concern. The collection
of comprehensive metadata also allowed the influence of different donor
characteristics on humoral immunity to be examined. Understanding the dynamics
of the humoral immunity against SARS-CoV-2 may provide insights into the level
of protection against infection and may assist policy-making for future pandemics.
Conclusions
This study aimed to (a) explore the
correlation between anti-S-RBD Ig and surrogate virus neutralisation test
measurements and (b) describe humoral immunity against SARS-CoV-2 after
vaccination, natural infection, and breakthrough infection. We observed that 57.1%
of the investigated cohort was infected with SARS-CoV-2. Furthermore, one vaccine
dose already leads to a substantial increase in the anti-S-RBD Ig titre, while
a “hybrid immunisation” (i.e. vaccination after a previous natural infection)
seems to result in a higher and longer-lasting anti-S-RBD Ig titre after the
first vaccine dose. We also observed that vaccinations elicited higher neutralising
antibody levels than natural infections alone. An estimate of neutralisation may
be helpful to assess the risk of re-infection. Since anti-S-RBD Ig levels correlated
with surrogate virus neutralisation test results, we suggest that anti-S-RBD Ig
may be used to estimate the level of neutralising antibodies. The threshold for
protection from an unfavourable clinical outcome must be evaluated in
prospective clinical cohorts. Our study provides insights into the dynamics of
humoral immunity against SARS-CoV-2 at a single-city resolution. The analysis
of our longitudinal real-world dataset, collected over two years from the start
of the COVID-19 pandemic, may contribute to understanding the course of a
pandemic and, thus, help better prepare for and manage future pandemics.
Acknowledgments
We thank Jacqueline Esther Glaus and Titalee Ha
of the Clinical Chemistry Department at the University Hospital Basel for
analysing the samples with the Elecsys® immunoassay. We also thank the blood donation
centre staff for collecting the serum samples, especially Claudia Doepfner for
coordination. We further thank Dr Camilo Chiang and Dr Stefanie von Felten for
helping with the statistical analyses and Dr Fanny Wegner for proofreading the
manuscript.
Yukino Gütlin
Institute of Medical Microbiology
University of Zurich
Gloriastrasse 30
CH-8006 Zurich
yguetlin[at]imm.uzh.ch
Adrian Egli
Institute of Medical Microbiology
University of Zurich
Gloriastrasse 30
CH-8006 Zurich
aegli[at]imm.uzh.ch
References
1. Robinson ML, Morris CP, Betz JF, Zhang Y, Bollinger R, Wang N, et al. Impact of Severe
Acute Respiratory Syndrome Coronavirus 2 Variants on Inpatient Clinical Outcome. Clin
Infect Dis. 2023 May;76(9):1539–49. 10.1093/cid/ciac957
2. Li K, Huang B, Wu M, Zhong A, Li L, Cai Y, et al. Dynamic changes in anti-SARS-CoV-2
antibodies during SARS-CoV-2 infection and recovery from COVID-19. Nat Commun. 2020 Nov;11(1):6044.
10.1038/s41467-020-19943-y
3. Wheatley AK, Fox A, Tan HX, Juno JA, Davenport MP, Subbarao K, et al. Immune imprinting
and SARS-CoV-2 vaccine design. Trends Immunol. 2021 Nov;42(11):956–9. 10.1016/j.it.2021.09.001
4. Ju B, Zhang Q, Ge J, Wang R, Sun J, Ge X, et al. Human neutralizing antibodies elicited
by SARS-CoV-2 infection. Nature. 2020 Aug;584(7819):115–9. 10.1038/s41586-020-2380-z
5. Khoury DS, Cromer D, Reynaldi A, Schlub TE, Wheatley AK, Juno JA, et al. Neutralizing
antibody levels are highly predictive of immune protection from symptomatic SARS-CoV-2
infection. Nat Med. 2021 Jul;27(7):1205–11. 10.1038/s41591-021-01377-8
6. Addetia A, Crawford KH, Dingens A, Zhu H, Roychoudhury P, Huang ML, et al. Neutralizing
Antibodies Correlate with Protection from SARS-CoV-2 in Humans during a Fishery Vessel
Outbreak with a High Attack Rate. J Clin Microbiol. 2020 Oct;58(11):e02107-20. 10.1128/jcm.02107-20 10.1128/JCM.02107-20
7. Manenti A, Maggetti M, Casa E, Martinuzzi D, Torelli A, Trombetta CM, et al. Evaluation
of SARS-CoV-2 neutralizing antibodies using a CPE-based colorimetric live virus micro-neutralization
assay in human serum samples. J Med Virol. 2020 Oct;92(10):2096–104. 10.1002/jmv.25986
8. Ghasemiyeh P, Mohammadi-Samani S, Firouzabadi N, Dehshahri A, Vazin A. A focused review
on technologies, mechanisms, safety, and efficacy of available COVID-19 vaccines.
Int Immunopharmacol. 2021 Nov;100:108162. 10.1016/j.intimp.2021.108162
9. Elecsys® Anti-SARS-CoV-2 S [Internet]. [cited 2023 Mar 7]. Available from: https://diagnostics.roche.com/global/en/products/params/elecsys-anti-sars-cov-2-s.html#productInfo
10. R Core Team. R: A Language and Environment for Statistical Computing [Internet]. Vienna,
Austria: R Foundation for Statistical Computing; 2023. Available from: https://www.R-project.org
11. Wickham H, Averick M, Bryan J, Chang W, McGowan LD, François R, et al. Welcome to
the Tidyverse. J Open Source Softw. 2019 Nov;4(43):1686. 10.21105/joss.01686
12. Sachs MC. plotROC: A Tool for Plotting ROC Curves. J Stat Softw. 2017 Aug;79 Code
Snippet 2:1–19. 10.18637/jss.v079.c02
13. Controlling the False Discovery Rate. A Practical and Powerful Approach to Multiple
Testing - Benjamini - 1995 - Journal of the Royal Statistical Society: Series B (Methodological)
- Wiley Online Library [Internet]. [cited 2023 Feb 2]. Available from: https://rss.onlinelibrary.wiley.com/doi/10.1111/j.2517-6161.1995.tb02031.x
14. Chen C, Nadeau S, Yared M, Voinov P, Xie N, Roemer C, et al. CoV-Spectrum: analysis
of globally shared SARS-CoV-2 data to identify and characterize new variants. Bioinformatics.
2022 Mar;38(6):1735–7. 10.1093/bioinformatics/btab856
15. Coronavirus (COVID-19): Tests Basel-Stadt [Internet]. [cited 2023 Feb 5]. Available
from: https://data.bs.ch/explore/dataset/100094/table/
16. Coronavirus (Covid-19): Geimpfte Personen mit Wohnsitz in Basel-Stadt [Internet].
[cited 2023 Feb 5]. Available from: https://data.bs.ch/explore/dataset/100162/table/
17. Notarte KI, Ver AT, Velasco JV, Pastrana A, Catahay JA, Salvagno GL, et al. Effects
of age, sex, serostatus, and underlying comorbidities on humoral response post-SARS-CoV-2
Pfizer-BioNTech mRNA vaccination: a systematic review. Crit Rev Clin Lab Sci. 2022 Sep;59(6):373–90.
10.1080/10408363.2022.2038539
18. Pellini R, Venuti A, Pimpinelli F, Abril E, Blandino G, Campo F, et al. Initial observations
on age, gender, BMI and hypertension in antibody responses to SARS-CoV-2 BNT162b2
vaccine. EClinicalMedicine. 2021 Jun;36:100928. 10.1016/j.eclinm.2021.100928
19. Salvagno GL, Henry BM, di Piazza G, Pighi L, De Nitto S, Bragantini D, et al. Anti-SARS-CoV-2
Receptor-Binding Domain Total Antibodies Response in Seropositive and Seronegative
Healthcare Workers Undergoing COVID-19 mRNA BNT162b2 Vaccination. Diagnostics (Basel).
2021 May;11(5):832. 10.3390/diagnostics11050832
20. Kitagawa Y, Imai K, Matsuoka M, Fukada A, Kubota K, Sato M, et al. Evaluation of the
correlation between the access SARS-CoV-2 IgM and IgG II antibody tests with the SARS-CoV-2
surrogate virus neutralization test. J Med Virol. 2022 Jan;94(1):335–41. 10.1002/jmv.27338
21. Bates TA, McBride SK, Leier HC, Guzman G, Lyski ZL, Schoen D, et al. Vaccination before
or after SARS-CoV-2 infection leads to robust humoral response and antibodies that
effectively neutralize variants. Sci Immunol. 2022 Feb;7(68):eabn8014. 10.1126/sciimmunol.abn8014
22. Wang Z, Muecksch F, Schaefer-Babajew D, Finkin S, Viant C, Gaebler C, et al. Naturally
enhanced neutralizing breadth against SARS-CoV-2 one year after infection. Nature.
2021 Jul;595(7867):426–31. 10.1038/s41586-021-03696-9
23. Turner JS, O’Halloran JA, Kalaidina E, Kim W, Schmitz AJ, Zhou JQ, et al. SARS-CoV-2
mRNA vaccines induce persistent human germinal centre responses. Nature. 2021 Aug;596(7870):109–13.
10.1038/s41586-021-03738-2
24. Al-Sadeq DW, Shurrab FM, Ismail A, Amanullah FH, Thomas S, Aldewik N, et al. Comparison
of antibody immune responses between BNT162b2 and mRNA-1273 SARS-CoV-2 vaccines in
naïve and previously infected individuals. J Travel Med. 2021 Dec;28(8):taab190. 10.1093/jtm/taab190
25. Assis R, Jain A, Nakajima R, Jasinskas A, Khan S, Palma A, et al. Distinct SARS-CoV-2
antibody reactivity patterns elicited by natural infection and mRNA vaccination. npj.
Vaccines (Basel). 2021 Nov;6(1):1–10.
26. Leuzinger K, Osthoff M, Dräger S, Pargger H, Siegemund M, Bassetti S, et al. Comparing
Immunoassays for SARS-CoV-2 Antibody Detection in Patients with and without Laboratory-Confirmed
SARS-CoV-2 Infection. J Clin Microbiol. 2021 Nov;59(12):e0138121. 10.1128/jcm.01381-21 10.1128/JCM.01381-21
27. Baral P, Bhattarai N, Hossen ML, Stebliankin V, Gerstman BS, Narasimhan G, et al. Mutation-induced
changes in the receptor-binding interface of the SARS-CoV-2 Delta variant B.1.617.2
and implications for immune evasion. Biochem Biophys Res Commun. 2021 Oct;574:14–9.
10.1016/j.bbrc.2021.08.036
28. Lee J, Lee DG, Jung J, Ryu JH, Shin S, Cho SY, et al. Comprehensive assessment of
SARS-CoV-2 antibodies against various antigenic epitopes after naive COVID-19 infection
and vaccination (BNT162b2 or ChAdOx1 nCoV-19) [Internet]. Front Immunol. 2022 Dec;13:1038712.
[cited 2023 Jun 8] Available from: https://www.frontiersin.org/articles/10.3389/fimmu.2022.1038712 10.3389/fimmu.2022.1038712
29. Muruato AE, Fontes-Garfias CR, Ren P, Garcia-Blanco MA, Menachery VD, Xie X, et al. A
high-throughput neutralizing antibody assay for COVID-19 diagnosis and vaccine evaluation.
Nat Commun. 2020 Aug;11(1):4059. 10.1038/s41467-020-17892-0
30. Bekliz M, Adea K, Vetter P, Eberhardt CS, Hosszu-Fellous K, Vu DL, et al. Neutralization
capacity of antibodies elicited through homologous or heterologous infection or vaccination
against SARS-CoV-2 VOCs. Nat Commun. 2022 Jul;13(1):3840. 10.1038/s41467-022-31556-1
31. Lau EH, Hui DS, Tsang OT, Chan WH, Kwan MY, Chiu SS, et al. Long-term persistence
of SARS-CoV-2 neutralizing antibody responses after infection and estimates of the
duration of protection [Internet]. EClinicalMedicine. 2021 Nov;41:101174. [cited 2023
Aug 9] Available from: https://www.thelancet.com/journals/eclinm/article/PIIS2589-5370(21)00454-5/fulltext 10.1016/j.eclinm.2021.101174
32. Perera RA, Mok CK, Tsang OT, Lv H, Ko RL, Wu NC, et al. Serological assays for severe
acute respiratory syndrome coronavirus 2 (SARS-CoV-2), March 2020. Euro Surveill.
2020 Apr;25(16):2000421. 10.2807/1560-7917.ES.2020.25.16.2000421
33. Kohmer N, Rühl C, Ciesek S, Rabenau HF. Utility of Different Surrogate Enzyme-Linked
Immunosorbent Assays (sELISAs) for Detection of SARS-CoV-2 Neutralizing Antibodies.
J Clin Med. 2021 May;10(10):2128. 10.3390/jcm10102128
Appendix
Discussion about a protective titre of neutralising
antibodies against SARS-CoV-2 reinfection
The protective titre of neutralising antibodies
against a SARS-CoV-2 infection has been discussed extensively, mainly in
connection with the assessment of vaccine efficacy, the therapeutic use of
convalescent plasma or sera for patients suffering from severe COVID-19, and
pandemic surveillance and public health policy-making [29]. The gold standard
for quantifying neutralising antibodies against SARS-CoV-2 in serum samples is
the live virus plaque reduction neutralisation test (PRNT). Briefly, diluted
serum samples are mixed with live SARS-CoV-2 viruses and added to confluent TMPRSS2-expressing
Vero-E6 cells. After incubation, the cells are fixed and stained with crystal
violet, and the plaques are counted in each well and compared to the number of
plaques in the control wells. Finally, the PRNT50 or PRNT90 value, the dilution
at which the serum showed 50% or 90% reduction of plaques compared to the
controls, respectively, is computed [30].
Khoury et al. modelled the relationship
between neutralising antibody titres and protection from a detectable or severe
SARS-CoV-2 infection [5]. They found that the threshold for neutralising
antibody titres at which the serum was 50% protective against a symptomatic or
severe infection was 20.2% or 3.0% of the mean convalescent neutralising
antibody titre, respectively. These values translate into a plaque-reducing
neutralisation serum dilution of between 1:10 and 1:30 but also up to 1:200 in
one of their evaluated datasets. Using this mathematical model, Lau et al.
determined the threshold for 50% protection from a symptomatic infection at a
PRNT50 and PRNT90 titre of 1:25.9 (95% CI = 1:24.7–1:27.6) and 1:8.9 (95% CI =
1:8.6–1:9.4), respectively, in their cohort [31].
In our study, the threshold for the
presence of neutralising antibodies was set to a serum dilution of 1:10. If the
serum did not show a plaque reduction of 90% at a serum dilution of 1:10, it
was considered negative for neutralising antibodies. Previous studies have also
followed this method [30, 32]. Kohmer et al. defined the serum dilution of 1:10
as a “borderline” result and considered serum dilutions ≥1:20 as positive for neutralising
antibodies [33]. However, we did not define a threshold for the neutralising
antibody titre showing a protective effect against SARS-CoV-2 infection.
Supplementary
figures
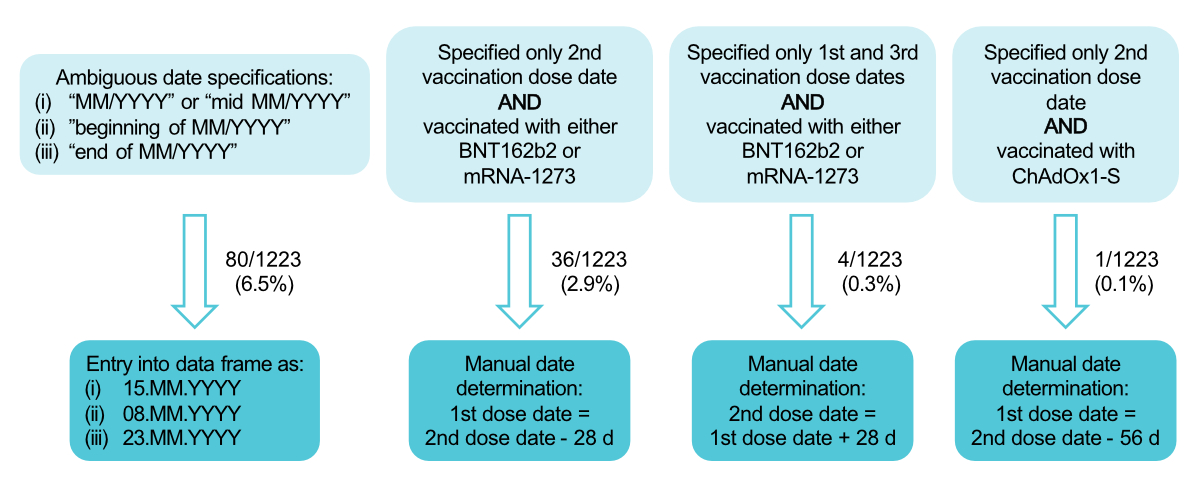
Figure S1Schematic of the manual determination of
infection and vaccination dates. The upper light blue boxes describe the
conditions that must be met for manual date determination. The bottom dark blue
boxes represent the method for manually determining the date for each
condition. The values next to the arrows represent the frequency at which the
specific type of manual date determination was conducted. Median dates were
selected for cases with ambiguous date specifications (leftmost column) to minimise
errors. Specific date intervals were chosen based on the standard vaccination
scheme of the different vaccines (three columns on the right).
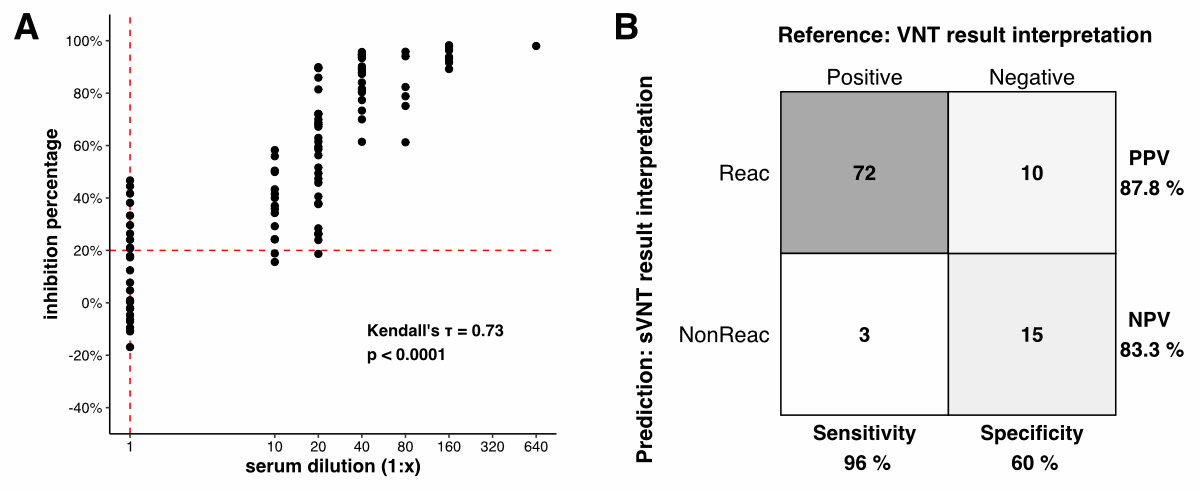
Figure S2Correlation analysis: classical virus
neutralisation test (VNT) vs surrogate virus neutralisation test (sVNT). Tested
with Wuhan wild-type SARS-CoV-2 in TMPRSS2-expressing Vero E6 cells and
SARS-CoV-2 Neutralizing Antibodies Detection Kit (Adipogen™). A The x-axis
shows the classical VNT results (i.e.
the highest serum dilution at which the serum still protected against the virus).
All samples that did not show live virus neutralisation at the lowest dilution
tested were assigned the value 1. The y-axis shows the sVNT results (i.e. the calculated
inhibition
percentages). The points represent each serum sample. Kendall’s tau (τ) and the p-value were
computed. The red dotted lines denote the respective methods’ cut-off for neutralising
activity. B The confusion matrix. Samples were classified as positive
for neutralising antibodies at an inhibition percentage ≥20% and a serum
dilution of ≥1:10 for the sVNT and VNT, respectively. PPV: positive predictive
value; NPV: negative predictive value.
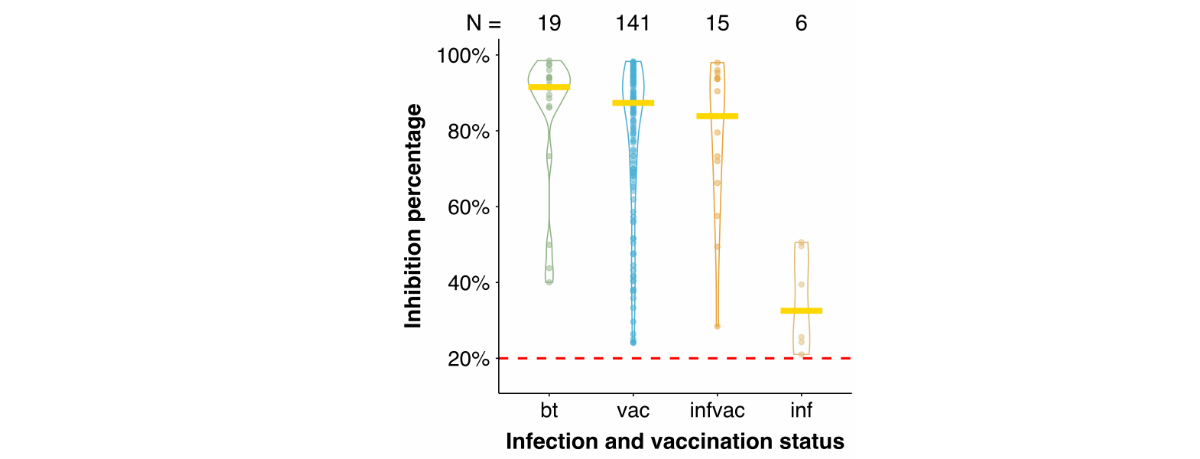
Figure S3Inhibition percentages grouped by infection and
vaccination status. Samples (dots) with an inhibition percentage measured by
the surrogate virus neutralisation test (sVNT) and the infection and
vaccination status determined by the questionnaire responses were included. The
areas around the dots represent the distribution density, the yellow line denotes
the median, and the red dashed line denotes the cut-off of the sVNT at 20%
inhibition. The values above the violin plots represent the number of samples
included in the calculations for each category. bt: post-vaccine breakthrough
infection; vac: vaccination only; infvac: infection before vaccination; inf:
natural infection only.
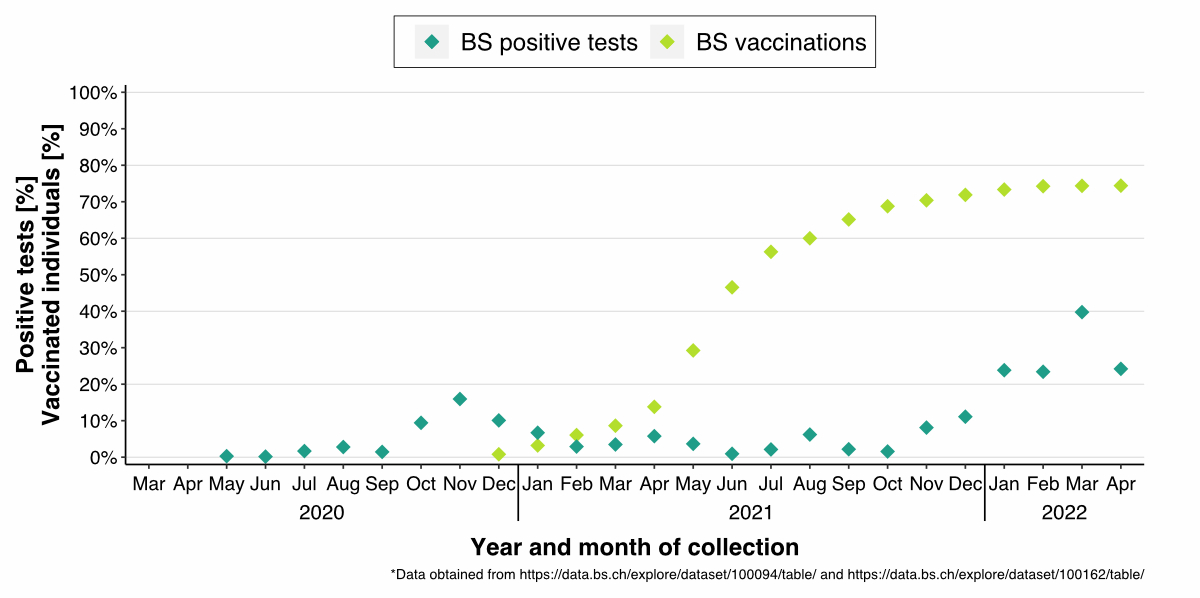
Figure S4The percentages of positive SARS-CoV-2 PCR and
rapid antigen tests and vaccinated individuals in the canton of Basel Stadt,
Switzerland, from March 2020 to April 2022. The percentages were calculated for
each month. The blue squares represent the percentage of positive tests per
month, and the green squares represent the percentage of vaccinated individuals
(who received at least one dose of a vaccine against SARS-CoV-2).