Leveraging free-text diagnoses to identify patients with diabetes mellitus, obesity
or dyslipidaemia – a cross-sectional study in a large Swiss primary care database
DOI: https://doi.org/https://doi.org/10.57187/s.3360
Donika
Balaja,
Jakob M. Burgstallera,
Audrey Wallnöfera,
Katja Weissa,
Oliver Senna,
Thomas Rosemanna,
Thomas
Grischotta*,
Stefan Markuna*,
and the
FIRE research group
a Institute of Primary Care,
University Hospital Zurich, University of Zurich, Switzerland
* Authors contributed equally
Summary
BACKGROUND: Electronic
medical records (EMRs) in general practice provide various methods for
identifying patients with specific diagnoses. While several studies have
focused on case identification via structured EMR components, diagnoses in
general practice are frequently documented as unstructured free-text entries,
making their use for research challenging. Furthermore, diagnoses may remain
undocumented even when evidence of the underlying disease exists within
structured EMR data.
OBJECTIVE: This study aimed
to quantify the extent to which free-text diagnoses contribute to identifying
additional cases of diabetes mellitus, obesity and dyslipidaemia (target
diseases) and assess the cases missed when relying exclusively on free-text
entries.
METHODS: This
cross-sectional study utilised EMR data from all consultations up to 2019 for
6,000 patients across 10 general practices in Switzerland. Diagnoses documented
in a free-text entry field for diagnoses were manually coded for target
diseases. Cases were defined as patients with a corresponding coded free-text
diagnosis or meeting predefined criteria in structured EMR components
(medication data or clinical and laboratory parameters). For each target
disease, prevalence was calculated along with the proportion of cases
identified exclusively via free-text diagnoses and the proportion missed when
using free-text diagnoses alone.
RESULTS: The prevalence estimates
for diabetes mellitus, obesity and dyslipidaemia were 8.8%, 16.2% and 38.9%, respectively.
Few cases relied exclusively on free-text diagnoses for identification, but a
substantial proportion of cases were missed when relying solely on free-text
diagnoses, particularly for obesity (19.5% exclusively identified; 50.7%
missed) and dyslipidaemia (8.7% exclusively identified; 53.3% missed).
CONCLUSION: Free-text diagnoses were of limited utility for
case identification of diabetes mellitus, obesity or dyslipidaemia, suggesting that
manual coding of free-text diagnoses may not always be justified. Relying solely
on free-text diagnoses for case identification is not recommended, as substantial
proportions of cases may remain undetected, leading to biased prevalence
estimates.
Abbreviations
- ATC
-
Anatomical
Therapeutic Chemical Classification System
- BMI
-
Body Mass Index
- CLPs
-
Clinical and laboratory parameters
- EMR
-
Electronic Medical Record
- FIRE
-
Family
Medicine Research using Electronic Medical Records
- HbA1c
-
Glycated haemoglobin
- ICPC-2
-
International
Classification of Primary Care, 2nd edition
- MED
-
Medication data
Introduction
The prevalence of chronic diseases is increasing globally, making epidemiological
research essential for surveillance and for designing targeted interventions [1].
In Switzerland, primary healthcare services are predominantly provided by general
practitioners, who are highly accessible across most regions. Patient billing follows
a nationally standardised fee-for-service tariff system, with costs beyond the deductible
covered by compulsory general health insurance. Chronic disease management is typically
conducted within this primary care setting [2, 3], making primary care data critical
for chronic disease epidemiology [4, 5]. By 2019, approximately 70% of Swiss general
practitioners were storing medical records electronically, a figure that increased
to 82% by 2023 [6]. With their growing adoption in Swiss general practice [7, 8],
electronic medical records (EMRs) from primary care databases have become an increasingly
important resource for estimating the prevalence of chronic diseases. Utilising EMR
data for epidemiological research is both time- and cost-efficient [7] as maintaining
EMRs is already an integral part of the general practitioners’ daily routine [9].
Data in EMRs are either structured (i.e., in a standardised format suitable for both
electronic processing and human interpretation) or unstructured (typically human-generated
free-text) [10]. Structured data in EMRs may include medication records or standardised
measures of clinical and laboratory parameters. Notably, for this work, certain drugs
and standardised measures within structured routine data can be sufficiently specific
to identify certain chronic diseases with reasonable certainty [11]. Common chronic
diseases identifiable through structured routine data include diabetes mellitus, which
can be recognised by the use of antidiabetic drugs or glycated haemoglobin (HbA1c)
values [12]; obesity, identified through anti-obesity medications or body mass index
(BMI) [13]; and dyslipidaemia, detected via lipid-modifying agents or serum lipid
levels [14, 15]. Unsurprisingly, standardised measures within structured data have
frequently been employed to identify these diagnoses [16–21].
In addition to structured components, EMRs frequently contain substantial amounts
of free-text data, including clinical notes entered by physicians to document reasons
for encounters, diagnostic considerations, confirmed diagnoses, and other relevant
information. Many practice software systems provide dedicated fields for recording
diagnoses and problems in free-text form (free-text diagnoses) as part of patients’
EMRs [10]. Analysing such free-text data may uncover additional cases of chronic diseases
that are not identifiable from structured EMR data alone [22, 23]. Moreover, with
recent advancements in artificial intelligence and natural language processing, free-text
data are increasingly recognised as valuable sources for identifying specific diseases
within EMRs [24]. However, to evaluate the additional utility of these approaches,
it is essential to determine the proportion of cases identified through free-text
diagnoses that would otherwise remain undetected using only structured data. Conversely,
free-text diagnoses may present significant limitations in chronic disease identification
compared to structured data. For instance, the documentation of diagnoses in free-text
form may be incomplete, inconsistent, or influenced by disease severity [25], potentially
introducing bias into case identification efforts.
The objectives of this study were threefold. First, it aimed to evaluate the extent
to which analysing free-text diagnoses from dedicated entry fields for diagnoses and
problems enhances case identification for three target diseases – diabetes mellitus,
obesity and dyslipidaemia – beyond what is achievable using structured data alone
(i.e., specific drugs, HbA1c values, BMI and serum lipid levels). Second, the study
sought to determine whether analysing free-text diagnoses alone provides prevalence
estimates comparable to those derived from combining structured and free-text data.
Finally, the third objective was to investigate whether case identification through
free-text diagnoses is associated with disease severity.
Methods
Study design and data
source
This cross-sectional study utilised anonymised patient
data from the “Family Medicine Research using Electronic Medical Records”
(FIRE) database, hosted by the Institute of Primary Care at the University
Hospital Zurich. Since its establishment in 2009, the FIRE database has
collected anonymised data from the EMRs of over 700 Swiss general practitioners
[26].
Initially, the FIRE database had only integrated data
from structured EMR components, such as administrative details, medication records,
clinical and laboratory parameters and International Classification of Primary
Care, 2nd edition (ICPC-2) coded reasons for encounters [27]. Recently,
however, an increasing number of practices have begun contributing unstructured
free-text from their patients' EMRs to the FIRE database.
For this study, we included all ten practices that had
contributed their EMR data, including unstructured free-text entries for
diagnoses and problems, to the FIRE database for the full year of 2019 at the study's
commencement. From each practice, 600 patients of any age with at least one
consultation in 2019 were randomly selected.
Database query and
data preparation
Demographic data, including birth year and sex, were
retrieved for all selected general practitioners and patients.
Diagnoses that could be derived from the unstructured free-text
diagnoses corresponding to blocks/categories E10-14, E65-68
or E78 of the 10th Revision of the International
Statistical Classification of Diseases and Related Health Problems (ICD-10)
were manually identified and coded (i.e., labelled as diabetes mellitus, obesity
or dyslipidaemia, respectively). The coding process followed
a multi-stage procedure involving independent coders, third-party arbitration for
resolving disagreements, and monitoring interrater reliability, resulting in a
dataset of coded free-text diagnoses (see appendix for details). No additional
information from unstructured EMR data was used.
From the structured EMR components, we extracted
medication data (MED) and clinical and laboratory parameters (CLPs). MED were
queried using Anatomical Therapeutic Chemical (ATC) classification
codes to identify drugs for diabetes, peripherally acting anti-obesity products
and lipid-modifying agents [28]. CLP data
included BMI, HbA1c values and serum lipid levels (high-density lipoprotein,
low-density lipoprotein, total cholesterol and triglycerides).
Coded free-text diagnoses, MED, and CLPs were considered up to
the date of the patients’ last consultations in 2019.
Criteria for case
identification using structured EMR components
We used the following
criteria for case identification based on the structured EMR components documenting
medication data or clinical and laboratory parameters.
Diabetes mellitus
At least one drug used to treat diabetes mellitus (excluding GLP-1 analogues, which
are not specific for diabetes mellitus due to their use for obesity treatment), or
at least two consecutive HbA1c values at or above the cut point stipulated by the
American Diabetes Association [12]:
≥1 drug with {ATC ∈ A10 and ATC ∉ A10BJ} (MED criterion) or
≥2 consecutive HbA1c ≥6.5 mmol/l (CLPs criterion)
Obesity
At least one prescription of a peripherally acting anti-obesity drug, or a recent
BMI that falls within the World Health Organization’s “obese” BMI category [13]:
≥1 drug with ATC ∈ A08AB (MED criterion) or
last measurement of BMI >30 kg/m2 (CLPs criterion)
Dyslipidaemia
At least one prescription of a lipid-modifying agent, or serum lipid levels repeatedly
exceeding the thresholds specified in the European Society of Cardiology (ESC) guidelines
on cardiovascular disease prevention in clinical practice [15] or the consensus statement
from the European Atherosclerosis Society and the European Federation of Clinical
Chemistry and Laboratory Medicine [14]:
≥1 drug with ATC
∈ C10 (MED criterion) or
{≥2 triglyceride >1.7 mmol/l
or ≥2 cholesterolTotal >4.9 mmol/l
or ≥2 cholesterolLDL >3.0 mmol/l
or (sex = female and ≥2 cholesterolHDL ≤1.2
mmol/l)
or (sex = male and ≥2 cholesterolHDL ≤1.0 mmol/l)}
(CLPs criterion)
Quantities of interest
and statistical analysis
To describe the study population, counts and
proportions (n and %) were reported alongside medians and interquartile
ranges (IQR).
In this study, a case of a target disease was
defined as a patient with the relevant coded free-text diagnosis or meeting the MED or CLPs criteria
for the diagnosis. Period prevalence estimates for the year 2019 were
calculated by dividing the number of cases for each target disease by the total
study population size (ncases = 6,000).
The key quantities of interest included, for each
target disease, the proportion of cases identified exclusively through coded free-text
diagnoses (denoted as e, the “exclusive” proportion) and the proportion
of cases missed by coded free-text diagnoses (denoted as m, the “missed”
proportion). These proportions were calculated relative to all cases
identifiable via coded free-text diagnoses or the structured EMR components (medication
data and clinical and laboratory parameters), representing the estimated
prevalence of the disease. Analogous metrics were also determined for both structured
EMR components (MED and CLPs).
To assess
whether the probability of a diagnosis being recorded in free-text depended on disease
severity, we determined the proportions of cases with coded free-text diagnoses
across different BMI, HbA1c and LDL classes and compared them using Fisher’s
exact test.
All analyses were performed using R software (version
4.2.0) [29]. Figure 1 was created using the R package eulerr [30].
Ethics
This study, part of the fully anonymised FIRE project,
was exempt from ethics approval under the Human Research Act, confirmed by the Ethics
Committee of the Canton of Zurich (BASEC No.
Req-2017-00797). Accordingly, no ethics application or formal protocol was
prepared.
Results
Sample characteristics
and disease prevalence estimates
The ten selected practices were staffed by a median of 3 general
practitioners (IQR 2–3). Of the 27 general practitioners, 15 (55.6%) were
female, with a median age of 51 years (IQR 45–54). The median number of
patients registered per practice was 7,381 (IQR 5,336–11,530). Table 1 presents
the demographic characteristics of the randomly selected patients (ncases = 6,000).
Table 1Patient
characteristics
(available for all patients with no missing values) by target disease.
| |
Total |
Diabetes mellitus |
Obesity |
Dyslipidaemia |
| ncases |
6,000 |
527 |
971 |
2,334 |
| Female sex, n (%) |
3,314 (55.2%) |
241 (45.7%) |
520 (53.6%) |
1,235 (52.9%) |
| Age, median (IQR) |
55 (37–70) |
71 (60–79) |
62 (50–73) |
68 (57–77) |
| Age groups, n (%) |
0–40 years |
1,786 (29.8%) |
20 (3.8%) |
141 (14.5%) |
83 (3.6%) |
| 41–64 years |
2,179 (36.3%) |
159 (30.2%) |
391 (40.3%) |
903 (38.7%) |
| 65–80 years |
1,394 (23.2%) |
239 (45.4%) |
330 (34.0%) |
959 (41.1%) |
| >80 years |
641 (10.7%) |
109 (20.7%) |
109 (11.2%) |
389 (16.7%) |
Using coded free-text diagnoses or structured EMR components (MED or CLPs), 527 cases
of diabetes mellitus (prevalence 8.8%), 971 cases of
obesity (prevalence 16.2%), and 2,334 cases of dyslipidaemia (prevalence 38.9%)
were identified. Among the 2,725 patients identified with at least one target
disease, 1,816 (66.6%) were identified with only one disease, 711 (26.1%) with
two diseases, and 198 (7.3%) with all three target diseases.
Exclusive and missed
identification by coded free-text diagnoses
Figure
1 illustrates the overlap in case identification among the three EMR components. Greater
overlap between the ovals indicates that the components identify the same
cases, while smaller overlaps suggest that a substantial proportion of cases are
identified exclusively by specific EMR components and would be missed by others. For
coded free-text diagnoses, this overlap is quantified using the previously
defined proportions e ("exclusive" proportion) and m ("missed" proportion) as
follows:
For diabetes mellitus, coded free-text
diagnoses identified 469 cases (89.0% of all cases of this disease), MED identified
400 cases (75.9%), and CLPs identified 336 cases
(63.8%). The proportion
of cases identified exclusively by coded free-text diagnoses was e = 14.0%, while the proportion of
cases missed by coded free-text diagnoses was m = 11.0%.
For obesity, coded free-text diagnoses identified
479 cases (49.3% of all cases of this disease), MED identified 18 cases (1.9%), and
CLPs identified 776 cases (79.9%). The proportion of
cases identified exclusively by coded free-text diagnoses was e = 19.5%, and the proportion of cases
missed by coded free-text diagnoses was m
= 50.7%.
For dyslipidaemia, coded free-text diagnoses identified
968 cases (41.5% of all cases of this disease), MED identified 1,090 cases (46.7%),
and CLPs identified 1,858 cases (79.6%). The proportion of cases identified exclusively
by coded free-text diagnoses was e =
5.7%, and the proportion of cases missed by coded free-text diagnoses was m = 58.5 %.
Metrics analogous to e and m were calculated for the structured EMR
components MED and CLPs and are presented
in figure 1.
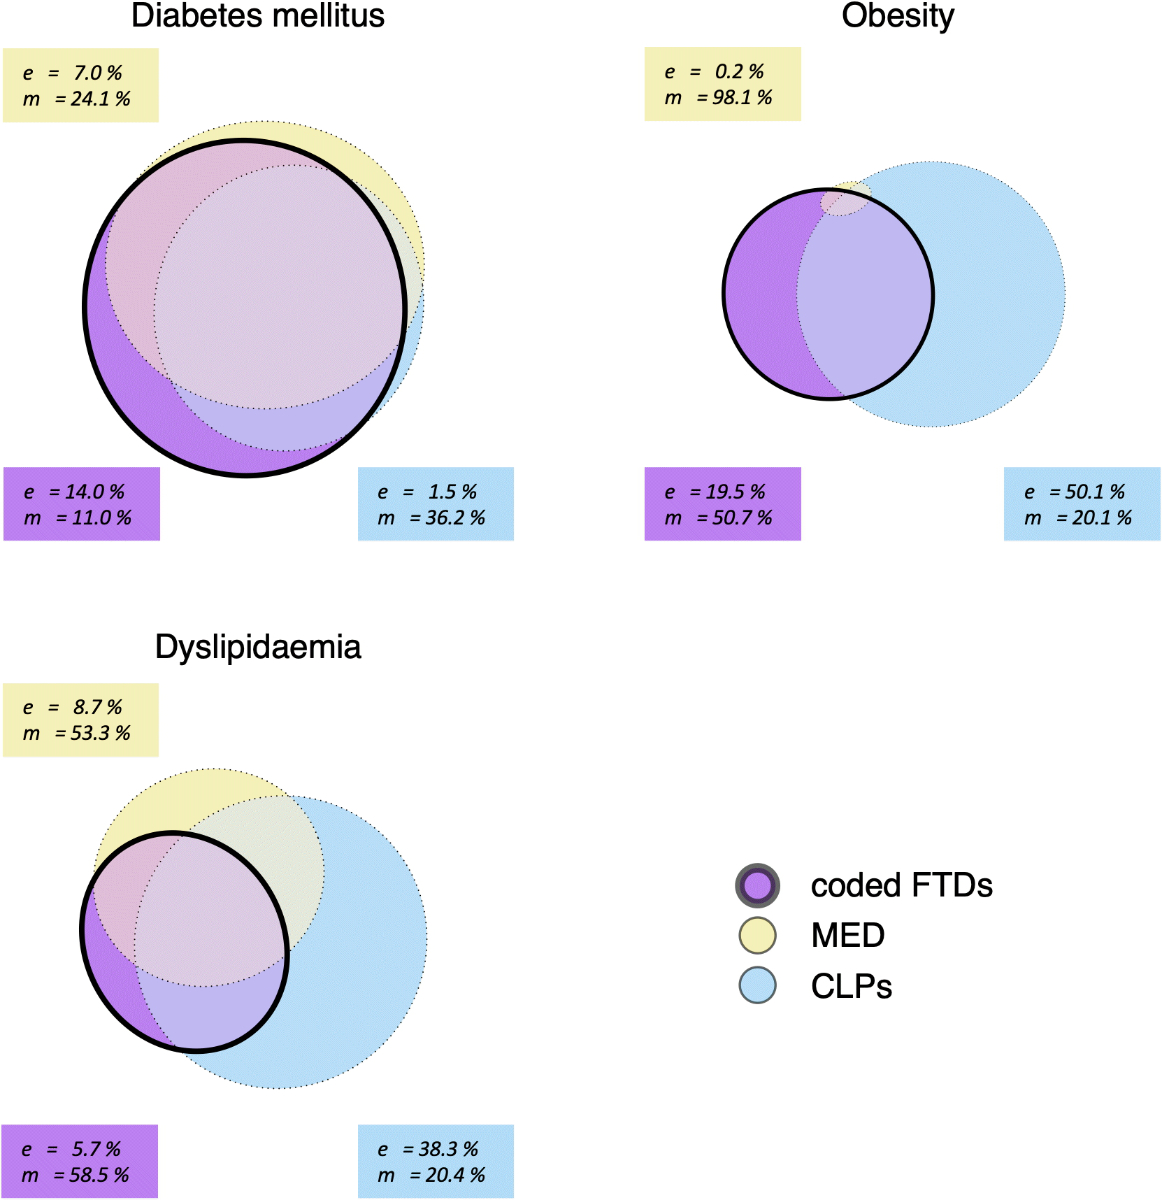
Figure 1Exclusive and
missed cases identified by individual EMR components for each target disease, displayed
as approximately area-proportional Euler diagrams. The areas represent the number
of cases identified by each EMR component. Abbreviations: coded FTDs, coded free-text
diagnoses; MED, medication data; CLPs, clinical and
laboratory parameters; e, proportion of total disease prevalence
identified exclusively by the respective EMR component; m, proportion of
total disease prevalence missed by the respective EMR component.
Case identification via coded free-text
diagnoses by disease severity
Table 2 demonstrates that the
frequency of coded free-text diagnoses for diabetes mellitus remained
consistent across all HbA1c classes, with no significant variation (p =
0.72). In contrast, coded free-text diagnoses for obesity and dyslipidaemia
were increasingly frequent in higher BMI and LDL classes, indicating an
association with greater disease severity (p <0.001 for both BMI and
LDL).
Table 2Proportions
of cases with coded free-text diagnoses across different BMI, HbA1c and
LDL classes.
| Diabetes mellitus |
Obesity |
Dyslipidaemia |
| HbA1c (%) |
Coded FTDs nFTDs/sizeclass (%) |
BMI (kg/m2) |
Coded FTDs nFTDs/sizeclass (%) |
LDL (mmol/l) |
Coded FTDs nFTDs/sizeclass (%) |
| [6.5, 7.0) |
110/115 (95.7%) |
(30, 35] |
139/529 (26.3%) |
(3, 4] |
245/695 (35.3%) |
| [7.0, 7.5) |
63/67 (94.0%) |
(35, 40] |
84/170 (49.4%) |
(4, 5] |
134/303 (44.2%) |
| ≥7.5 |
93/100 (93.0%) |
>40 |
63/77 (81.8%) |
>5 |
47/75 (62.7%) |
Discussion
In general practice, diagnoses are often documented as free-text entries in designated
fields of practice software and stored as unstructured data within patients’ EMRs
[24, 31]. However, diagnoses may be absent from these unstructured EMR data, despite
being evident from information in structured EMR components [32]. This EMR-based study
investigated the potential of diagnostic coding of free-text from entry fields intended
for diagnoses and problems for identifying cases and estimating the prevalence of
three common chronic diseases – diabetes mellitus, obesity and dyslipidaemia – compared
with identification based solely on medication data and clinical and laboratory parameters.
We found limited additional benefit in using free-text diagnoses for prevalence estimation
of the three target diseases, and many cases were overlooked when structured EMR components
were ignored.
For diabetes mellitus, incorporating free-text diagnoses for case identification increased
the prevalence estimate from 7.6% to 8.8%, a value approaching the confidence interval
for diabetes mellitus prevalence in Swiss general practice (9.0–11.9%) as reported
in a recent study by Excoffier et al. [4]. Excoffier’s study, which used prospective
epidemiological monitoring in Swiss general practices, provides a valuable comparator.
The 1.2% increase in prevalence shows that one in seven cases of diabetes mellitus
was identified exclusively via free-text diagnoses and would have been missed using
structured EMR components alone. This contribution may be relevant depending on the
specific objectives of a study or project. However, most cases could still be identified
using medication data and clinical and laboratory parameters alone. Conversely, the
risk of overlooking cases when relying exclusively on free-text diagnoses was similarly
low: only one in nine cases would have been missed if only free-text diagnoses were
considered for case identification.
For obesity, the inclusion of all EMR components yielded a prevalence estimate of
16.2%, which aligns with Excoffier’s confidence interval (13.3–17.9%). Compared to
diabetes mellitus, free-text diagnoses had a greater role in identifying cases of
obesity, with one in five cases identified exclusively via coded free-text diagnoses.
However, in contrast to diabetes mellitus, the implications of excluding structured
EMR components in the identification of obesity were substantial: more than half of
all cases would have been missed depending exclusively on free-text diagnoses.
For dyslipidaemia, the prevalence estimate was 38.9% when all EMR components were
considered. While comparable references from Swiss general practice are lacking, a
Canadian study that inferred dyslipidaemia prevalence from lipid laboratory test results
in general practice reported a prevalence of 35.8%, which closely aligns with our
findings [16]. We found that the additional contribution of free-text diagnoses to
dyslipidaemia case identification was minimal, with only one in 18 cases identified
exclusively through coded free-text diagnoses. Conversely, as with obesity, relying
on free-text diagnoses alone would have resulted in a substantial proportion of missed
cases: slightly more than half of all dyslipidaemia cases would have been overlooked
without the inclusion of structured EMR components.
The proportions of cases exclusively identified or missed by free-text diagnoses varied
considerably across the target diseases. Free-text diagnoses appeared to be more important
for the identification of obesity compared to diabetes mellitus and dyslipidaemia
and were a more effective sole detector for diabetes mellitus than for obesity or
dyslipidaemia.
This likely reflects differences in how general practitioners document these conditions.
Diabetes mellitus is more likely to be thoroughly documented due to its pressing therapeutic
implications and the frequent follow-up visits recommended by current guidelines [33,
34]. As a result, patients with diabetes mellitus likely generate more free-text diagnoses,
increasing the likelihood of case identification through this component. In contrast,
general practitioners may perceive obesity and dyslipidaemia more as risk factors
than as diseases requiring consistent documentation, leading to fewer free-text diagnoses.
Moreover, disease severity or stage might influence whether a condition is documented.
The higher frequency of free-text diagnoses for obesity and hyperlipidaemia observed
at elevated BMI and LDL levels suggests a degree of perceptual salience for these
conditions. For obesity, this aligns with earlier findings that patients with more
severe obesity are more likely to be identified as cases compared to those with less
severe forms [25]. Additionally, the substantial proportion of nearly 20% of obese
patients identified exclusively via free-text diagnoses can likely be attributed to
the limited informative value of the medication data component for obesity, due to
the low number and infrequent use of specific anti-obesity medications in clinical
practice.
Strengths and limitations
While extensive research has explored case identification using structured EMR data,
few studies have considered free-text diagnoses from dedicated entry fields [35].
There are also several studies that have investigated whether extracting information
from unstructured EMR data can improve diagnosis recognition, although most focus
on hospital settings, where the case mix differs significantly [32]. To our knowledge,
this study is the first to examine and quantify the contribution of unstructured free-text
data to case identification of chronic diseases in general practice.
Our findings offer insights into the potential for case identification using artificial
intelligence and enable an informed evaluation of the expected cost-benefit ratio,
both for research purposes and for clinical practitioners who depend on problem lists
to review patients' diagnoses and health issues. These lists are often subjective
and therefore unreliable when shared among practitioners [36], and incorporating diagnoses
inferred from all available EMR components into the problem list could enhance its
completeness, currency, reliability, and structure. This approach would preserve the
narrative and clinical reasoning embedded in free-text, which is essential for effective
communication, while simultaneously providing the structured data required for billing
and quality monitoring [37]. More comprehensive, reliable and well-structured problem
lists have the potential to improve the accuracy and efficiency of clinical decision-making
while streamlining administrative processes [38, 39].
The limitations of this study stem from its use of routine general practice data rather
than data collected through epidemiological studies with standardised patient sampling
and diagnostic criteria. Moreover, we observed missing diagnoses in the free-text
entries as well as missing information required to infer diagnoses from medication
data and from clinical and laboratory parameters data. Our results are therefore likely
biased by the included patients’ propensity to seek medical care, heterogeneous diagnostic
practices, and incomplete documentation in general practice. While computerised approaches
to improving the maintenance of free-text problem lists – such as automatic prompts
for associated indication or diagnosis when prescribing medication – are expected
to improve the accuracy of problem lists [40-42], current evidence suggests that our
study likely underestimates true prevalence rates.
Although medication data have demonstrated value in chronic disease identification
in previous studies [43, 44], relatively few cases of the target diseases were identified
through medication data in this study. This may be attributed to the focus on lifestyle
modifications as a primary therapeutic approach at the onset of these diseases [13,
15, 33]. Furthermore, the results of this study, which examined the role of free-text
diagnoses in identifying diabetes mellitus, obesity and dyslipidaemia, may not be
generalised to the identification of other conditions. As shown in a previous study,
the traces left by specific diseases in EMR data vary depending on physicians' documentation
practices, prescribing habits and the extent to which these diseases can be measured
using anthropometric or biochemical tests [21]. The diseases targeted in this study
had significant potential to be identified through from clinical and laboratory parameters
data. In contrast, other prevalent conditions, such as chronic back pain or chronic
fatigue, lack specific clinical or laboratory parameters measurements or associated
medications and may therefore rely more heavily on free-text diagnoses for identification.
Conclusion
This study demonstrated
that free-text diagnoses provided limited utility for identifying cases of
diabetes mellitus, obesity or dyslipidaemia, suggesting that manual coding of free-text
diagnoses may not always justify the effort. Furthermore, using free-text
diagnoses as the sole method of case identification for these diseases should
be discouraged, as large portions of cases may remain undetected, which could substantially
bias prevalence estimates.
Availability of
data and materials
Data
and materials are available from the corresponding author upon reasonable
request.
Acknowledgments
We
thank Adriana Keller and Gino Bopp for their assistance with diagnostic coding,
and Fabio Valeri for selecting practices, identifying patients, and retrieving
their data.
Authors'
contributions: DB, SM and JB conceived and designed the study;
DB and TG analysed the data; DB, TG and SM drafted the manuscript, and all authors
participated in revision; KW supervised diagnostic coding; OS and TR
contributed resources and project administration. All authors approved the
final manuscript for publication.
PD Dr Stefan Markun
Institute of Primary Care
University Hospital Zurich, University of Zurich
Pestalozzistrasse 24
CH-8091 Zürich
stefan.markun[at]usz.ch
References
1. Vos T, Lim SS, Abbafati C, Abbas KM, Abbasi M, Abbasifard M, et al.; GBD 2019 Diseases
and Injuries Collaborators. Global burden of 369 diseases and injuries in 204 countries
and territories, 1990-2019: a systematic analysis for the Global Burden of Disease
Study 2019. Lancet. 2020 Oct;396(10258):1204–22. doi: https://doi.org/10.1016/S0140-6736(20)30925-9
2. Cartier T, Senn N, Cornuz J, et al. Switzerland. In: Kringos DS, Boerma WGW, Hutchinson
A, et al., editors. Building primary care in a changing Europe: Case studies [Internet].
Copenhagen (Denmark): European Observatory on Health Systems and Policies; 2015. (Observatory
Studies Series, No. 40.) 29. Available from: https://www.ncbi.nlm.nih.gov/books/NBK459012/
3. Rachamin Y, Meier R, Grischott T, Rosemann T, Markun S. General practitioners’ consultation
counts and associated factors in Swiss primary care - A retrospective observational
study. PLoS One. 2019 Dec;14(12):e0227280. doi: https://doi.org/10.1371/journal.pone.0227280
4. Excoffier S, Herzig L, N’Goran AA, Déruaz-Luyet A, Haller DM. Prevalence of multimorbidity
in general practice: a cross-sectional study within the Swiss Sentinel Surveillance
System (Sentinella). BMJ Open. 2018 Mar;8(3):e019616. doi: https://doi.org/10.1136/bmjopen-2017-019616
5. Sibley LM, Moineddin R, Agha MM, Glazier RH. Risk adjustment using administrative
data-based and survey-derived methods for explaining physician utilization. Med Care.
2010 Feb;48(2):175–82. doi: https://doi.org/10.1097/MLR.0b013e3181c16102
6. Federal Office of Public Health. Swiss primary care doctors give their healthcare
system highest marks in international comparison. Bern; 2023.[Available from: https://www.edi.admin.ch/edi/en/home/dokumentation/medienmitteilungen.html.msg-id-93048.html].
7. Casey JA, Schwartz BS, Stewart WF, Adler NE. Using Electronic Health Records for Population
Health Research: A Review of Methods and Applications. Annu Rev Public Health. 2016;37(1):61–81.
doi: https://doi.org/10.1146/annurev-publhealth-032315-021353
8. Senn N, Ebert ST, Cohidon C. Die Hausarztmedizin in der Schweiz – Perspektiven. Analyse
basierend auf den Indikatoren des Programms SPAM (Swiss Primary Care Active Monitoring).
Neuchâtel: Schweizerisches Gesundheitsobservatorium (Obsan); 2016.
9. Djalali S, Markun S, Rosemann T. [Routine Data in Health Services Research: an Underused
Resource]. Praxis (Bern). 2017;106(7):365–72. doi: https://doi.org/10.1024/1661-8157/a002630
10. Shivade C, Raghavan P, Fosler-Lussier E, Embi PJ, Elhadad N, Johnson SB, et al. A
review of approaches to identifying patient phenotype cohorts using electronic health
records. J Am Med Inform Assoc. 2014;21(2):221–30. doi: https://doi.org/10.1136/amiajnl-2013-001935
11. Huber CA, Szucs TD, Rapold R, Reich O. Identifying patients with chronic conditions
using pharmacy data in Switzerland: an updated mapping approach to the classification
of medications. BMC Public Health. 2013 Oct;13(1):1030. doi: https://doi.org/10.1186/1471-2458-13-1030
12. American Diabetes Association. 2. Classification and Diagnosis of Diabetes: Standards of Medical Care in Diabetes-2019. Diabetes Care. 2019 Jan;42 Suppl 1:S13–28. doi: https://doi.org/10.2337/dc19-S002
13. World Health Organization. A healthy lifestyle - WHO recommendations [11 April 2023].
Available from: https://www.who.int/europe/news-room/fact-sheets/item/a-healthy-lifestyle---who-recommendations
14. Langlois MR, Chapman MJ, Cobbaert C, Mora S, Remaley AT, Ros E, et al.; European Atherosclerosis
Society (EAS) and the European Federation of Clinical Chemistry and Laboratory Medicine
(EFLM) Joint Consensus Initiative. Quantifying Atherogenic Lipoproteins: Current and
Future Challenges in the Era of Personalized Medicine and Very Low Concentrations
of LDL Cholesterol. A Consensus Statement from EAS and EFLM. Clin Chem. 2018 Jul;64(7):1006–33.
doi: https://doi.org/10.1373/clinchem.2018.287037
15. Piepoli MF, Hoes AW, Agewall S, Albus C, Brotons C, Catapano AL, et al.; ESC Scientific
Document Group. 2016 European Guidelines on cardiovascular disease prevention in clinical
practice: The Sixth Joint Task Force of the European Society of Cardiology and Other
Societies on Cardiovascular Disease Prevention in Clinical Practice (constituted by
representatives of 10 societies and by invited experts)Developed with the special
contribution of the European Association for Cardiovascular Prevention & Rehabilitation
(EACPR). Eur Heart J. 2016 Aug;37(29):2315–81. doi: https://doi.org/10.1093/eurheartj/ehw106
16. Asghari S, Aref-Eshghi E, Godwin M, Duke P, Williamson T, Mahdavian M. Single and
mixed dyslipidaemia in Canadian primary care settings: findings from the Canadian
primary care sentinel surveillance network database. BMJ Open. 2015 Dec;5(12):e007954.
doi: https://doi.org/10.1136/bmjopen-2015-007954
17. Kho AN, Hayes MG, Rasmussen-Torvik L, Pacheco JA, Thompson WK, Armstrong LL, et al. Use
of diverse electronic medical record systems to identify genetic risk for type 2 diabetes
within a genome-wide association study. J Am Med Inform Assoc. 2012;19(2):212–8. doi: https://doi.org/10.1136/amiajnl-2011-000439
18. McGovern A, Hinton W, Correa A, Munro N, Whyte M, de Lusignan S. Real-world evidence
studies into treatment adherence, thresholds for intervention and disparities in treatment
in people with type 2 diabetes in the UK. BMJ Open. 2016 Nov;6(11):e012801. doi: https://doi.org/10.1136/bmjopen-2016-012801
19. Mocarski M, Tian Y, Smolarz BG, McAna J, Crawford A. Use of International Classification
of Diseases, Ninth Revision Codes for Obesity: Trends in the United States from an
Electronic Health Record-Derived Database. Popul Health Manag. 2018 Jun;21(3):222–30.
doi: https://doi.org/10.1089/pop.2017.0092
20. Rigobon AV, Birtwhistle R, Khan S, Barber D, Biro S, Morkem R, et al. Adult obesity
prevalence in primary care users: An exploration using Canadian Primary Care Sentinel
Surveillance Network (CPCSSN) data. Can J Public Health. 2015 Apr;106(5):e283–9. doi: https://doi.org/10.17269/cjph.106.4508
21. Meier R, Grischott T, Rachamin Y, Jäger L, Senn O, Rosemann T, et al. Importance of
different electronic medical record components for chronic disease identification
in a Swiss primary care database: a cross-sectional study. Swiss Med Wkly. 2023 Oct;153(10):40107.
doi: https://doi.org/10.57187/smw.2023.40107
22. Jensen K, Soguero-Ruiz C, Oyvind Mikalsen K, Lindsetmo RO, Kouskoumvekaki I, Girolami M,
et al. Analysis of free text in electronic health records for identification of cancer
patient trajectories. Sci Rep. 2017 Apr;7(1):46226. doi: https://doi.org/10.1038/srep46226
23. Soguero-Ruiz C, Hindberg K, Mora-Jiménez I, Rojo-Álvarez JL, Skrøvseth SO, Godtliebsen F,
et al. Predicting colorectal surgical complications using heterogeneous clinical data
and kernel methods. J Biomed Inform. 2016 Jun;61:87–96. doi: https://doi.org/10.1016/j.jbi.2016.03.008
24. Griffon N, Charlet J, Darmoni SJ. Managing free text for secondary use of health data.
Yearb Med Inform. 2014 Aug;9(1):167–9. doi: https://doi.org/10.15265/IY-2014-0037
25. Mattar A, Carlston D, Sariol G, Yu T, Almustafa A, Melton GB, et al. The prevalence
of obesity documentation in Primary Care Electronic Medical Records. Are we acknowledging
the problem? Appl Clin Inform. 2017 Jan;8(1):67–79.
26. Chmiel C, Bhend H, Senn O, Zoller M, Rosemann T; FIRE study-group. The FIRE project:
a milestone for research in primary care in Switzerland. Swiss Med Wkly. 2011 Jan;140:w13142.
27. Classification Committee of the World Organization of Family Doctors (WICC). ICPC-2:
International Classification of Primary Care. Oxford University Press; 1997.
28. WHO Collaborating Centre for Drug Statistics Methodology. Oslo Norway. Guidelines
for ATC classification and DDD assignment 2023. 2022.
29. Team RC. A Language and Environment for Statistical Computing. Vienna, Austria: R
Foundation for Statistical Computing; 2022.
30. Larsson J. _eulerr: Area_Proportional Euler and Venn Diagrams with Ellipses_. R package
version 6.1.1 ed2021.
31. Pericin I, Larkin J, Collins C. Diagnostic coding of chronic physical conditions in
Irish general practice. Ir J Med Sci. 2022 Aug;191(4):1693–9. doi: https://doi.org/10.1007/s11845-021-02748-3
32. Ford E, Carroll JA, Smith HE, Scott D, Cassell JA. Extracting information from the
text of electronic medical records to improve case detection: a systematic review.
J Am Med Inform Assoc. 2016 Sep;23(5):1007–15. doi: https://doi.org/10.1093/jamia/ocv180
33. Cosentino F, Grant PJ, Aboyans V, Bailey CJ, Ceriello A, Delgado V, et al.; ESC Scientific
Document Group. 2019 ESC Guidelines on diabetes, pre-diabetes, and cardiovascular
diseases developed in collaboration with the EASD. Eur Heart J. 2020 Jan;41(2):255–323.
doi: https://doi.org/10.1093/eurheartj/ehz486
34. Wong TY, Sun J, Kawasaki R, Ruamviboonsuk P, Gupta N, Lansingh VC, et al. Guidelines
on Diabetic Eye Care: The International Council of Ophthalmology Recommendations for
Screening, Follow-up, Referral, and Treatment Based on Resource Settings. Ophthalmology.
2018 Oct;125(10):1608–22. doi: https://doi.org/10.1016/j.ophtha.2018.04.007
35. McBrien KA, Souri S, Symonds NE, Rouhi A, Lethebe BC, Williamson TS, et al. Identification
of validated case definitions for medical conditions used in primary care electronic
medical record databases: a systematic review. J Am Med Inform Assoc. 2018 Nov;25(11):1567–78.
doi: https://doi.org/10.1093/jamia/ocy094
36. Holmes C, Brown M, Hilaire DS, Wright A. Healthcare provider attitudes towards the
problem list in an electronic health record: a mixed-methods qualitative study. BMC
Med Inform Decis Mak. 2012 Nov;12(1):127. doi: https://doi.org/10.1186/1472-6947-12-127
37. Graber ML, Byrne C, Johnston D. The impact of electronic health records on diagnosis.
Diagnosis (Berl). 2017 Nov;4(4):211–23. doi: https://doi.org/10.1515/dx-2017-0012
38. Klappe ES, Heijmans J, Groen K, Ter Schure J, Cornet R, de Keizer NF. Correctly structured
problem lists lead to better and faster clinical decision-making in electronic health
records compared to non-curated problem lists: A single-blinded crossover randomized
controlled trial. Int J Med Inform. 2023 Dec;180:105264. doi: https://doi.org/10.1016/j.ijmedinf.2023.105264
39. Klappe ES, de Keizer NF, Cornet R. Factors Influencing Problem List Use in Electronic
Health Records-Application of the Unified Theory of Acceptance and Use of Technology.
Appl Clin Inform. 2020 May;11(3):415–26. doi: https://doi.org/10.1055/s-0040-1712466
40. Galanter WL, Hier DB, Jao C, Sarne D. Computerized physician order entry of medications
and clinical decision support can improve problem list documentation compliance. Int
J Med Inform. 2010 May;79(5):332–8. doi: https://doi.org/10.1016/j.ijmedinf.2008.05.005
41. Falck S, Adimadhyam S, Meltzer DO, Walton SM, Galanter WL. A trial of indication based
prescribing of antihypertensive medications during computerized order entry to improve
problem list documentation. Int J Med Inform. 2013 Oct;82(10):996–1003. doi: https://doi.org/10.1016/j.ijmedinf.2013.07.003
42. Grauer A, Kneifati-Hayek J, Reuland B, Applebaum JR, Adelman JS, Green RA, et al. Indication
alerts to improve problem list documentation. J Am Med Inform Assoc. 2022 Apr;29(5):909–17.
doi: https://doi.org/10.1093/jamia/ocab285
43. Henderson J, Barnett S, Ghosh A, Pollack AJ, Hodgkins A, Win KT, et al. Validation
of electronic medical data: identifying diabetes prevalence in general practice. HIM
J. 2019 Jan;48(1):3–11. doi: https://doi.org/10.1177/1833358318798123
44. Orueta JF, Nuño-Solinis R, Mateos M, Vergara I, Grandes G, Esnaola S. Monitoring the
prevalence of chronic conditions: which data should we use? BMC Health Serv Res. 2012 Oct;12(1):365.
doi: https://doi.org/10.1186/1472-6963-12-365
Appendix: Approach to diagnostic free-text coding
The following
procedure was used to identify and code target diagnoses in the unstructured
free-text from the diagnosis and problem entry fields.
As its input
unit, the procedure processed the entire contents of the entry field from an individual
documentation occasion for an individual patient, i.e. one FTD (“free-text
diagnosis”). To each such unit, the procedure assigned appropriate disease labels
if the free-text allowed for the conclusion that the patient had chronic conditions
classifiable under the International
Statistical Classification of Diseases and Related Health Problems 10th
revision (ICD-10) blocks/categories “E10-E14” (diabetes mellitus), “E65-E68” (obesity)
or “E78” (dyslipidaemia). The outputs of the procedure, i.e., the disease labels reflecting
the specified ICD-10 blocks/categories, are referred to as ”coded FTDs” in the following and in the
article’s main text.
A pilot
phase involved four coders (medical doctor candidates DB, AW, AK and GB)
without specific training in coding. Two coders (DB and AW) first piloted coding
of FTDs independently on a random sample of 381 patients and jointly developed
a coding instruction to be used by the other coders (AK and GB) who then, again
independently, verified coding according to this instruction on the FTDs of 143
patients already coded by DB and AW. Cohen’s Kappa was calculated for each pair
of coders to assess interrater-reliability of coding with excellent results
(Kappa range for diabetes 0.92 to 1, and perfect concordance with Kappa = 1 for
both obesity and dyslipidaemia).
Following
the pilot phase, DB and AW independently coded all FTDs of another 2,619
patients, and interrater-reliability was assessed again showing almost perfect
agreement (Kappa for diabetes 0.91, obesity 0.96, dyslipidaemia 0.99). Discrepancies
were resolved by arbitration by a third party (KW, a trained medical doctor
with three years working experience). In view of the very high interrater-reliability
evident after a total of 3,000 free-texts that were double-coded by DB and AW, we
considered it justifiable to continue coding by a single coder without introducing
a significant risk of bias. Consecutively, AK coded the FTDs of another 3,000 patients
without subsequent independent verification, resulting in a final dataset
containing coded FTDs from 6,000 patients.