Translational longevity medicine: a Swiss perspective in an ageing country
DOI: https://doi.org/https://doi.org/10.57187/smw.2023.40088
Marco M. Ruckstuhla,
Evelyne Bischofbc,
Dana Blatchd,
Aliki Buhayerde,
Jörg Goldhahnf,
Edouard Battegaydg,
Andre Tichellih,
Collin Y. Ewalda
a Laboratory of Extracellular Matrix Regeneration, Institute of Translational Medicine,
Department of Health Sciences and Technology, ETH Zürich, Schwerzenbach, Switzerland
b Shanghai
University of Medicine and Health Sciences, Shanghai, China
c Department
of Medical Oncology, Renji Hospital, School of Medicine, Shanghai Jiao Tong
University, Shanghai, China
d International Center for Multimorbidity and Complexity in Medicine (ICMC),
University of Zurich
e Prism Scientific Sàrl, Genève, Switzerland
f Institute of Translational Medicine, Department of Health Sciences and Technology,
ETH Zürich, Switzerland
g Department of Psychosomatic
Medicine, Merian Iselin Klinik, Basel, Switzerland
h Division
of Haematology, University Hospital Basel, Basel, Switzerland
Summary
Breakthroughs in medical research in the last century have
led to a significant extension of the human lifespan, resulting in a shift
towards an elderly population worldwide. Due to the ongoing progress of global development
towards elevated standards of living, this study specifically examines Switzerland
as a representative nation to explore the socioeconomic and healthcare ramifications
associated with an ageing population, thereby highlighting the tangible impact experienced
in this context. Beyond the exhaustion of pension funds
and medical budgets, by reviewing the literature and analysing publicly
available data, we observe a “Swiss Japanification”. Old age is associated with
late-life comorbidities and an increasing proportion of time spent in poor health.
To
address these problems, a paradigm shift in medical practice is needed to
improve health rather than respond to existing diseases. Basic ageing research
is gaining momentum to be translated into therapeutic interventions and
provides machine learning tools driving longevity medicine. We propose that
research focus on closing the translational gap between the molecular
mechanisms of ageing and a more prevention-based medicine, which would help people
age better and prevent late-life chronic diseases.
The ageing
demographics of Switzerland
Over the
past century, Switzerland’s cumulative survival over time or lifespan has
improved dramatically for both men and women (figures 1A and 1B). Although most
reports focus on life expectancy, the field of public health is shifting
towards lifespan and healthspan. From 1880 to 2018, mean lifespan increased by
98.34% and 94.61% in men and women respectively: from 41.17 to 81.66 years and from
44.14 to 85.90 years respectively (figures 1A and 1B) [1]. During the late 19th
and early 20th centuries, the improvement in overall survival was mainly due to
the reductions in infectious disease mortality and in the infant mortality rate
from its previously high level [2]. Indeed, in 1876 roughly 20% of infants died
within their first year of life [1]. The trend of increasing lifespan has
continued into the 21st century [1, 2], albeit at a slower rate, ascribed to – among
other factors – a healthier lifestyle and better treatment for cancer and
cardiovascular diseases. The median age of the Swiss population has increased
steadily even in the last 50 years, except for a brief period, mainly due to
immigration [3], in the 1990s (figure 1C) [4]. In contrast, the maximum
lifespan increased by a lower amount, by 11 and 14 years to 109 and 112 years
in 2018 for men and women, respectively (figures 1A and 1B, data source file 1 [a
link is provided at the end of the article])
[5]. The Swiss Federal Statistical Office predicts that the increases in the
mean lifespan and – to a lesser extent – the maximum lifespan will continue up to
2150 (figures 1A and 1B) [5].
Although there is debate on whether human lifespan is limited to 115–120 years [6–8],
these estimates suggest a maximal human lifespan of 112 and 115 years for Swiss
men and women, respectively, in 2150 (data source file 1).
Similar
improvements in lifespan have been recorded worldwide, with a steady increase
in life expectancies (figure 1D). Life expectancy is the estimated number of
years from birth a person is expected to live. In 2017, Japanese women had the
highest life expectancy at 87.21 years, followed by Swiss women at 85.67 years,
followed by women in higher-income OECD countries at 83.08 years (figure 1D) [9].
OECD longevity has recently been dampened by a stagnating-to-declining (2014 to
2015) life expectancy in the US due to various factors [10], including the
opioid crisis, alcoholism, external causes of death (accidents, homicides,
suicides, drug-related deaths), obesity and diabetes [11, 12], a trend not
observed in Switzerland (supplementary figures 1A–1C). Around 2005, the life
expectancy of Swiss men surpassed that of Japanese men and in 2019 they had the
highest life expectancy of men of any sovereign nation (figure 1D) [13].
Worldwide, there is a significant gap in life expectancy between men and women,
with women living longer (figure 1D). For Switzerland, this sex difference
widened during the mid-to-late 20th century (figures 1E and 1F; supplementary figures 1D and 1E).
As cardiovascular deaths of men in retirement (>65 years) are being
increasingly prevented by better medical care [2], and women more often are
exposed to similar risk factors as men (smoking, stress, etc. [14]), the sex gap
is decreasing and projected to become smaller in the next hundred years (figure
1F). Compared to other OECD countries, the sex gap in Switzerland is in the
lower range [15].
While life
expectancy in Switzerland has greatly increased over the last one and a half
centuries, birth rates have declined significantly (supplementary figure 1F) [16],
now being below the replacement rate of, on average, 2.1 births per woman [17]. These
dynamics, fuelled by progress in medical science
and increased education, have led to a dramatic change from a younger to an
elderly Swiss population, as illustrated in the population pyramids for the
years 1860, 1960, 2000 and 2019 (figures 1G to 1J, supplementary video 1).
In the 1960
population pyramid, the indentation at around 40 years of age is caused by
reduced birth numbers during the First World War (figure 1H) [18]. At the
bottom of the 1960 pyramid, two larger cohorts are observable, both belonging
to the Baby Boomer generation (born 1946–1964; figure 1H). By 2000, these two
cohorts were approaching 55 and 40, respectively (figure 1I). Their
disproportionate size exceeds the emerging Gen Y (the generation born 1981–1996)
and Gen Z (the generation born 1997–2012) numbers and results in more of
an arrow shape. In the most recent population pyramid, for 2019, this “silver
tsunami” has already partially retired; the bulk however is still approaching
retirement age (65 and 64 years for men and women, respectively) (figure 1J).
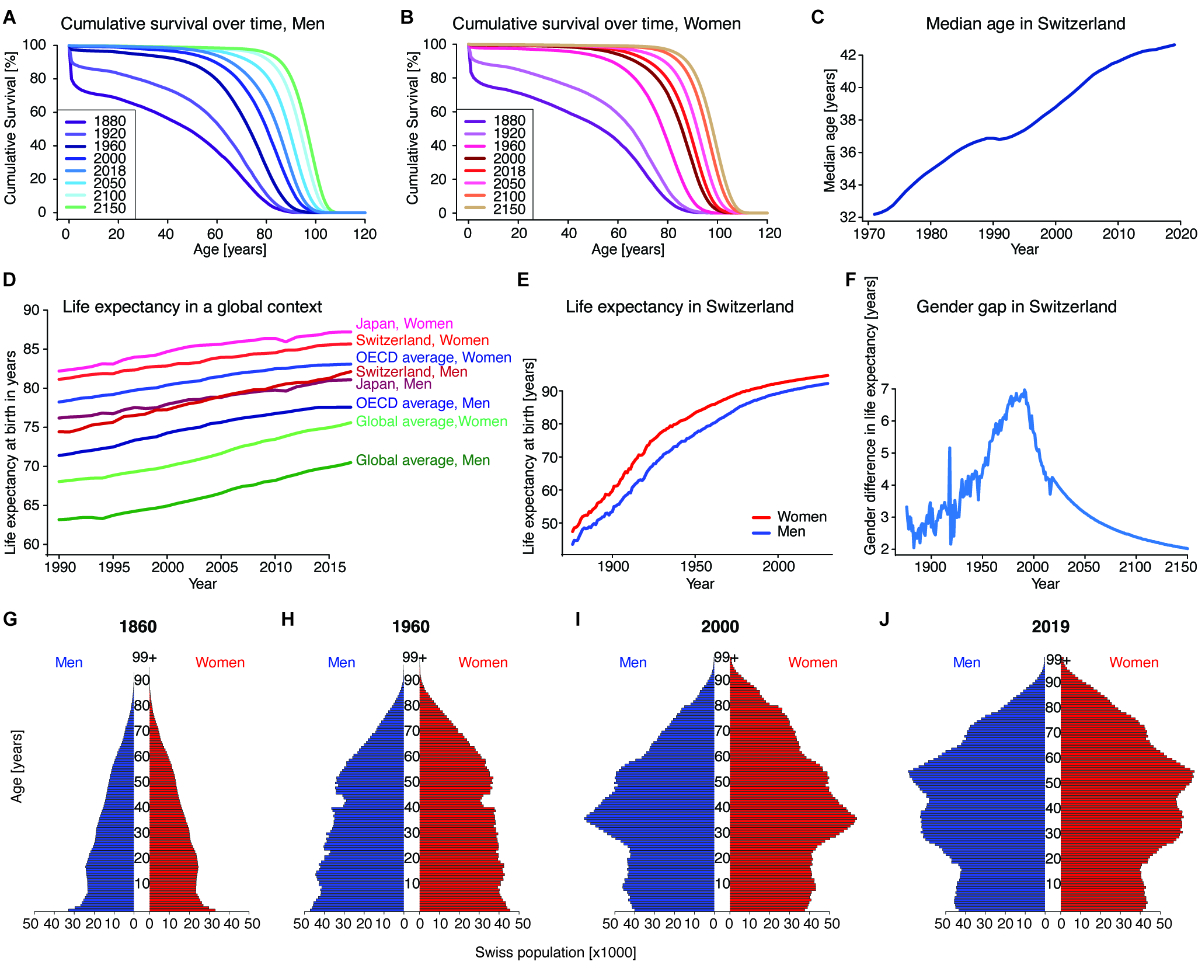
Figure 1Ageing
demographics of Switzerland. (A) and (B)
Cumulative survival order at different ages for Swiss men (A) and women (B) in
1880, 1920, 1960, 2000 and 2018 as well as projections for 2050, 2100 and 2150.
The survival order for both sexes has increased at all ages for the period
examined and is projected to continue to increase. Source: Swiss Federal
Statistical Office. (C) The median
age of the Swiss population over time. Source: Swiss Federal Statistical Office.
(D) Life
expectancy at birth for men and women in Switzerland and Japan, and the OECD
average, as well as the global average over time. Female life expectancy has
noticeably always been above male life expectancy for all geographic areas
considered. Of all sovereign nations, Japanese women have the highest life
expectancy globally, and Swiss men are the longest-living men since overtaking
Japanese men in the early 2010s. The OECD averages for men and women have been
rising slower than Swiss, Japanese and global longevity, due among other
factors to stagnant-to-decreasing life expectancy for certain populations in
the US. Source: IHME Global Burden of Disease study 2017. (E) Life
expectancy at birth in Switzerland over time as well as future projections by
the Swiss Federal Statistical Office. Female life expectancy has noticeably
always been above male life expectancy. Source: Swiss Federal Statistical
Office. (F) Sex gap
between female and male life expectancy in Switzerland over time as well as
future projections by the Swiss Federal Statistical Office. The difference was
calculated by subtracting the male life expectancy at birth from the female
life expectancy at birth. Source: Swiss Federal Statistical Office. (G-J) Swiss
Population Pyramids for the years 1860, 1960, 2000 and 2019. The blue bars on
the left represent men, the red bars on the right represent women; each bar represents
a 1-year cohort, size indicated on the x-axis. Source: Swiss Federal
Statistical Office. Source
data and more detailed references are available in source data file 1.
Supplementary video
The supplementary video
1, Ageing
demographics of Switzerland from 1861 to 2019 for men and women, is available at:
https://doi.org/10.6084/m9.figshare.21922104.v1.
Economic
implications of an ever-increasing elderly Swiss population
Along with
the increased life expectancy, the number of centenarians, defined here as people
aged 99 and over, has risen exponentially in Switzerland and can reasonably
be expected to continue to do so (figure 2A, supplementary figure 1G) [19].
When the Swiss social security system (AHV, Alters-und Hinterlassenenversicherung)
came into effect in 1948 [20], the remaining life expectancy for people aged 65
was 12.09 years for men and 13.66 years for women (data source file 1) [1], and
thus the Swiss retirement age was set at 65 years for men and women (later
reduced to 64 for women), so men and women would enjoy 12.09 and 13.66 years respectively
of retirement covered by the AHV after the original retirement age (data source
file 1). The probability of reaching the age of 65 in 1948 was 64.6% and 73.9%
for men and women respectively. Since then, life expectancy has increased to
81.66 and 85.90 years for Swiss men and women; years in retirement increased to
19.78 and 23.83 for men and women, respectively, in 2018, taking into account
the lowering of the female retirement age; while the probability of reaching
retirement age increased to 90.5% and 95.5% for men and women respectively.
Furthermore, the decrease in the younger population (figure 1J) and a younger
workforce paying into the AHV, along with the increase in the number of
retirement years plus the ever-increasing population of people over 65 years (figure
2B), poses a serious problem and increases the expenditure of the AHV (figure
2C). The number of retirement-aged people in Switzerland was 431,200 in 1948.
Hence the minimum payout was almost CHF 207 million in nominal terms
annually [20]. In 2020, approximately CHF 42,832,824,000 were paid out to 2,438,761
insured retirees, based on December 2020 data [21].

Figure 2Economic and financial implications of an ageing Swiss population. (A) Number of
men and women in Switzerland aged 99 years or older over time. While the number
of centenarians remained in the single and low double digits in the 19th and
early 20th century, towards the end of the 20th century, the number increased
rapidly, with women far overtaking men in the number of centenarians. Source:
Swiss Federal Statistical Office. (B) Fraction
of the population aged 65 years or older in Switzerland, the US, Japan and the
OECD and global averages. The fraction of people over 65 years is generally
increasing in the displayed geographies, especially in Japan, where recent data
show more than a quarter of the population was older than 65 years. Source:
World Bank. (C) The number
of retirees, in millions of people, insured under the Swiss AHV social security
system is displayed in turquoise green; total monthly payments made to retirees,
in CHF billion, are displayed in red. Source: Swiss Federal Statistical Office,
Swiss Federal Social Insurance Office. (D) Annual
operating result (Umlageergebnis) of the Swiss AHV/IV system as well as
future projections based on the current modus operandi. Swiss Federal
Statistical Office, Swiss Federal Social Insurance Office. (E) Capital of
the Swiss AHV/IV system as well as future projections based on the current
modus operandi. Swiss Federal Statistical Office, Swiss Federal Social
Insurance Office. (F) Balance
sheet of Swiss pension funds (Bilanzsumme ohne Aktiva) over time. Source:
Swiss Federal Statistical Office.(G) Old age
dependency ratios (OADRs) over time in Switzerland, the US, Japan, and OECD and
global averages. This ratio is obtained by dividing the population aged 65
years or older by the working-age population. While the path over time is
slightly different from (B), the general trend of increasing OADRs holds, with
the Swiss OADR approaching 30% and the Japanese OADR approaching 50%, i.e. two
working-age people supporting one retiree, in 2020. Source: World Bank. (G) The annual
yield on a 10-year Swiss government bond in nominal and inflation-adjusted
(real) terms over time. Source: Swiss Federal Statistical Office, Swiss
National Bank.(I)
Year-on-year growth in Swiss GDP in nominal and inflation-adjusted (real) terms
over time. Source: Swiss Federal Statistical Office, Eurostat. Source
data and more detailed references are in source data file 1.
The Swiss
First Pillar (AHV), a pay-as-you-go system [22], is projected to enter an operational
deficit in the mid-2020s [23] and rapidly drain its remaining fund assets (figure
2D, 2E). Projections by the proponents of a popular initiative assume up to a
CHF 200,000,000,000 cost to the fiscal authorities from the hole in Pillar 1
alone [24]. Swiss pension funds (Pillar 2), which are defined contribution
systems, on the other hand, are relatively well-capitalised with assets
(depending on the definition used) exceeding CHF 1,000,000,000,000 (figure 2F) [25].
With the
increasing number of older people and the decreasing size of the working-age
population, the ratio of retirement-age people (defined here as over 65 years
as used by the OECD) to the working-age population has increased [26, 27]. This
is quantified as the Old Age Dependency Ratio (OADR). An increase in OADR is
observed not only in Switzerland but also in other countries around the world,
particularly OECD countries, and notably Japan, where it is approaching 50% (figure
2G).
Beyond the
issue with pension funds and the AHV, as the fraction of workers relative to
the total population (labour force participation rate) (supplementary figures
2A and 2B) declines, GDP growth is likely to decline with it along with real (and
potentially nominal) interest rates, a phenomenon termed secular stagnation,
studied particularly for the US [28] (supplementary figures 2C–2H), but it is
a concept just as relevant for other industrialised countries [29], in
particular Switzerland, which may face “long-term secular stagnation in the
future”, though secular stagnation is not (yet) detected in Switzerland
according to Klose (2017) [30]. As observed in the US and Japan, the
demographic transition and the ageing of society likely reduce output growth,
inflation (figure 2H and 2I, supplementary figures 2C–2E, 2H), and the real as
well as the nominal interest rate (figure 2H, supplementary figures 2F and 2G).
Government policies, including fiscal and monetary stimuli as well as increased
social security spending, may have counteracted part of these effects [29].
Swiss nominal GDP growth, inflation as measured by CPI, and both nominal and
real bond yields have been declining in a similar fashion to industrialised
economy peers. (figures 2H and 2I, supplementary figures 2F and 2G).
A further
consequence of the demographic transition, which also puts further strains on pension
systems and funds, comes from the reduced real rates of return (figure 2H, supplementary
figure 2F), which can be thought of as the interest rate pension systems
receive for investing their assets. This lower interest rate can make it harder
to fund future pension obligations.
The
dynamics of population ageing and potential secular stagnation in Switzerland
and the rest of Europe have, to a certain extent, already been observed. As
shown in figure 2G, the OADR in Japan is by far the highest of any major
economy, and its rise began earlier and was steeper than the OECD average.
Colloquially, the secular stagnation dynamics caused by population ageing are
also referred to as “Japanification” [31]. In 1991, a large asset bubble burst
in Japan, followed by a deep and long recession, where asset price movements played
a role, and both Japanese economic growth and asset prices have been subdued
since [32]. Goodhart and Pradhan [33] argue that several factors in Japan actually
softened its fall in GDP growth and that these may be absent for (part of) the
rest of the industrialised world (supplementary figure 2H).
Goodhart
and Pradhan [33] argue that recent demographic trends have contributed to
rising inequality, and this inequality of income, wealth and opportunity, or at
least the perception of it, as well as the stagnation of real wages in uneducated
the so-called white non-Hispanic demographic in the US, among others, and the
accompanying “sense of hopelessness” has, in turn, contributed to rising
mortality in this demographic, particularly due to deaths of despair, such as
suicide, drug alcohol poisoning and alcohol-related liver disease [34]. While
several other advanced economies experience similar trends at a lower amplitude
than the US [34], Switzerland does not show a similar trend (supplementary figures
1A–1C, supplementary figures 2I–2M). Therefore, the US does not represent an
ideal comparison for the effects of an ageing population.
Health and medical
implications of an elderly Swiss population
Although it
is a remarkable achievement that we live longer, the increase in lifespan also
comes with an increased prevalence of age-related and chronic diseases (figures
3A–3E). This is particularly remarkable for age-related diseases such as
cardiovascular diseases (figure 3A) and neurodegenerative diseases (Alzheimer’s
disease and dementia; figure 3B), which respectively increase linearly after
the age of 40 or exponentially after the age of 70. Other chronic diseases
including diabetes (figure 3C) and neoplasms/tumours (figure 3D) show a steep
incline at the age of 40 but then decline after the age of 70, maybe due to
poor survival of the patients. Comparable to OECD, the US or worldwide, the
prevalence of cardiovascular diseases and diabetes increases steadily with ageing
(figure 3E; supplementary figures 3A–3C) [35]. Some of the diseases occur
either earlier in life, for example, multiple sclerosis, for which less than
10% of patients have the late-onset disease (after the age of 50) [36]. The
persistent prevalence of multiple sclerosis in patients older than 60 is due to
these late-onset diseases and to a slower progression of multiple sclerosis,
which is mainly observed in older patients (figure 3E) [37]. Thus, the
increased occurrence of these chronic diseases during old age results in an
overall more than linearly increased risk of dying from the age of 75 years (figure
3F), resulting in a steep decline in cumulative survival (figure 3G).
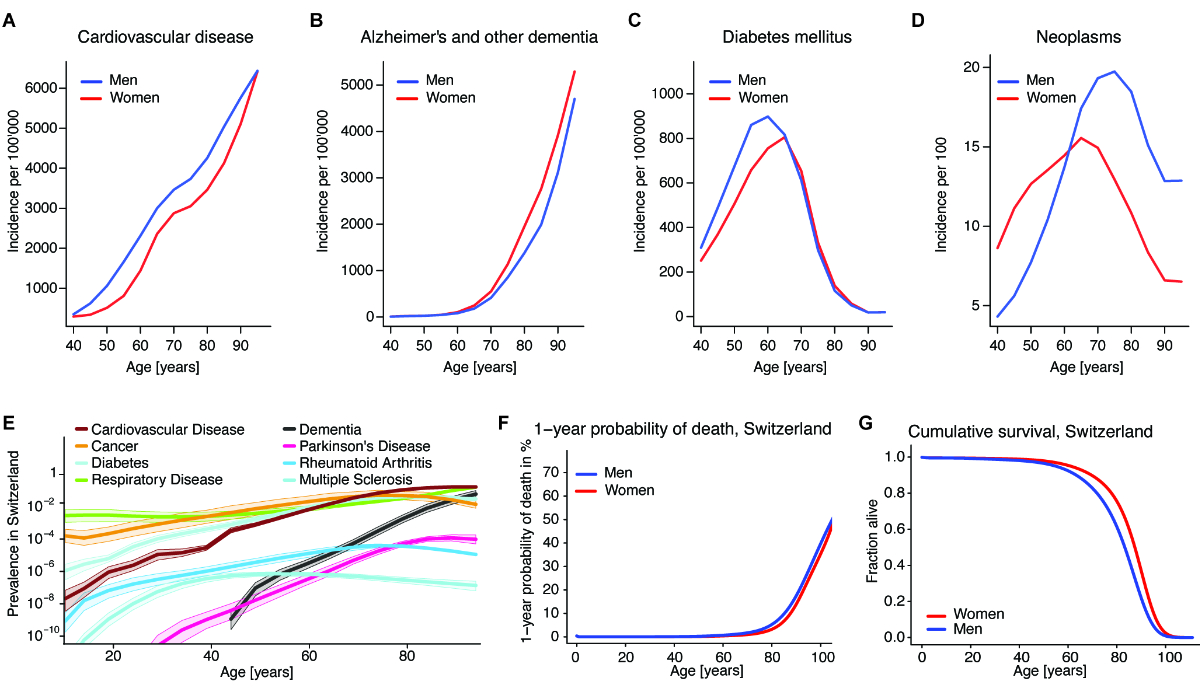
Figure 3Disease incidence, prevalence, and cumulative survival. (A) Incidence
rate of cardiovascular disease (including ischaemic and rheumatic heart disease
and stroke) for men and women in Switzerland during 5-year age ranges. Source:
IHME Global Burden of Disease study, 2019 data. (B) Incidence
rate of Alzheimer’s disease and other dementia for men and women in Switzerland
during 5-year age ranges. Source: IHME Global Burden of Disease study, 2019
data. (C) Incidence
rate of type I and type 2 diabetes mellitus for men and women in Switzerland
during 5-year age ranges. Source: IHME Global Burden of Disease study, 2019
data. (D) Incidence
rate of neoplasms for men and women in Switzerland during 5-year age ranges.
Source: IHME Global Burden of Disease study, 2019 data. (E) Prevalence
of cardiovascular diseases (including ischaemic and rheumatic heart disease and
stroke), cancers, diabetes, chronic respiratory diseases (including COPD),
dementia, Parkinson’s disease, rheumatoid arthritis and multiple sclerosis in
Switzerland at various ages. Prevalence is on a logarithmic scale as YLDs (Years
Lived with Disability). Source: IHME Global Burden of Disease study, 2019 data. (F)
The 1-year
probability of death for men and women at various ages. The value indicates the
probability of dying at a certain age conditional on being alive at the
beginning of the observed life year. Source: Swiss Federal Statistical Office,
Swiss mortality tables 2008–2013. (G) Cumulative
survival for men and women at various ages according to Swiss mortality tables
2008–2013. This number indicates the fraction of hypothetical men and women
alive at a given age from their hypothetical birth cohort, at current mortality
rates. Source: Swiss Federal Statistical Office. The data are from Swiss
mortality tables 2008–2013. Source
data and more detailed references are in source data file 1.
As outlined
above, these chronic diseases are the leading causes of death, markedly
decreasing the cumulative survival of the Swiss population, as illustrated in figure
4A. In the last 50 years, the ranking of the top ten causes of death has remained
more or less unchanged, except for dementia (and accidents in men) (figures 4B–4G,
supplementary figures 4A–E). The proportion of deaths due to cardiovascular
diseases decreased more markedly in women, while cancer deaths increased mainly
in men (figures 4F–G, supplementary figure 4A). The increase in dementia is
more pronounced in females because dementia is a progressive and disabling
disorder of the elderly, and women have longer survival and therefore a higher
risk of dementia (figures 4F–G) [38]. The estimated cost of Alzheimer’s
disease alone is CHF 11.8 billion with direct costs (e.g. the cost of care, medical
treatment, medications, diagnostics) representing 53% (CHF 6.3 billion) of
the cost, according to the Swiss cost of dementia study published in 2019 [39].
However society also bears indirect costs of CHF 5.5 billion due to informal
care.
Other
non-communicable diseases also cause notable costs to the economy, both direct
and indirect. In 2011, the sum of direct and indirect costs of musculoskeletal
diseases was CHF 8.7 billion; CHF 4 billion for cancer; CHF 1.6
billion for chronic respiratory diseases; and CHF 1 billion for diabetes [40].
The total economic cost of obesity was estimated at CHF 7.99 billion as of 2012
[41]. Cardiovascular diseases are the leading cause of death but have declined
over the past 50 years (figures 4A–H). Similarly to the reduced cardiovascular
deaths in Switzerland (figure 4H), in Japan, for instance, in the last 20
years, ischaemic strokes appeared later in life and were less severe, findings that
have been attributed to improved prophylactic measures and treatments [42].
The
elderly, especially those with chronic health conditions such as diabetes
mellitus [43], are more susceptible to heat and heat waves [44], which are
projected to increase globally with climate change [45], with temperatures in
Switzerland increasing at up to twice the rate [46].
During the
COVID-19 pandemic, the elderly population died at a much higher rate than would
be expected normally by the Swiss Federal Statistical Office (supplementary figure
4F), especially during the COVID waves in the spring of 2020, autumn/winter of
2020/2021 and winter of 2022 [47]. The risk of dying of COVID-19 drastically
increased with older age [48], unlike during the 1918 influenza pandemic [49].
Mortality of the elderly population, especially in autumn and winter, from
highly transmissible viruses is not limited to COVID-19 or coronaviruses more
broadly: In the late 20th century, the US CDC determined that 80–90%
of influenza fatalities were among people 65 years or older [50].
The above raises
the question of what can be done to address these socioeconomic and medical
problems. This means that in addition to research on cardiovascular diseases
and cancer, research on different kinds of dementia and cognitive diseases
should be encouraged and supported.
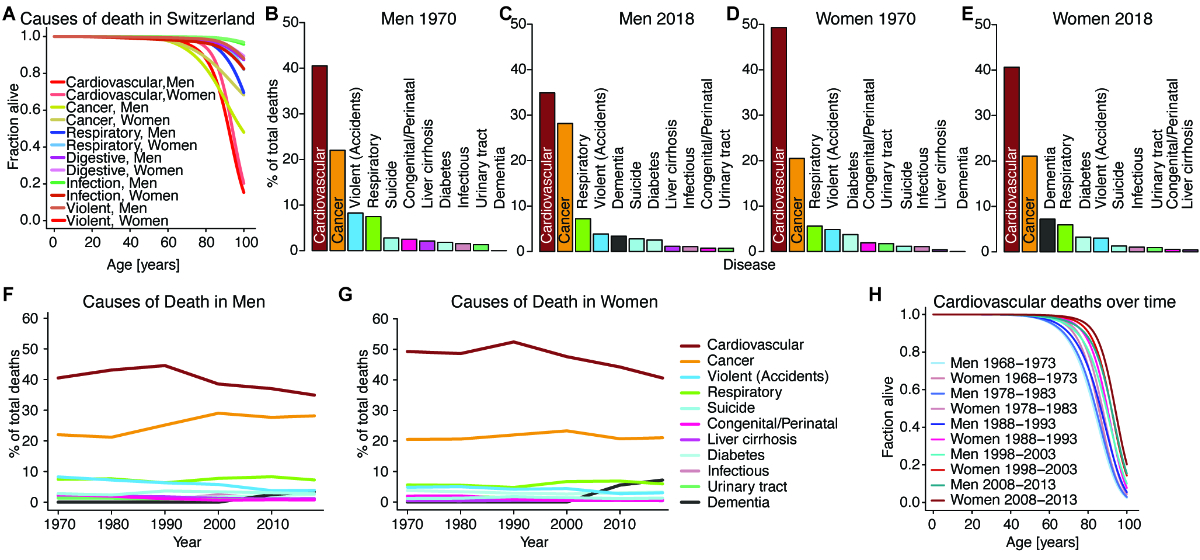
Figure 4Causes
of death in Switzerland. (A) Specific
survival order of men and women in Switzerland with regard to the following
causes of death: cardiovascular cause, cancer, respiratory disease, diseases
affecting the digestive tract, violent death (including suicides, accidents and
homicides). Source: Swiss Federal Statistical Office. The data are from Swiss
mortality tables 2008–2013. (B) and (C)
The leading causes of death in Switzerland for men in 1970 and 2018: Most men
die of either cardiovascular causes (including heart attack and ischaemic
stroke) or cancers, with the fraction of cardiovascular deaths in men declining
from 1970 to 2018 due to better therapy of chronic cardiovascular disease,
among other factors. Progress has been slower in the therapy of cancer. Source:
Swiss Federal Statistical Office. (D) and (E)
The leading causes of death in Switzerland for women in 1970 and 2018: Most
women die of either cardiovascular causes (including heart attacks and ischaemic
strokes) or cancers, with the fraction of cardiovascular deaths in women
declining from 1970 to 2018, like for men. Dementia is a more frequent cause of
death in women than men and only appears in the statistics in the 21st century.
Source: Swiss Federal Statistical Office. (F) and (G)
The leading causes of death as a percentage of total deaths in Switzerland for
men (I) and women (J) over time from 1970 to 2018. Age-standardised mortality
has declined for almost all causes of death; however, with an ageing society
and better therapeutics for certain chronic diseases, some causes of death become
relatively more frequent. Source: Swiss Federal Statistical Office. (H) Specific
survival order of men and women at different ages in Switzerland with regard to
cardiovascular causes of death during several 6-year observation periods for
mortality tables. Source: Swiss Federal Statistical Office. The data are from Swiss
mortality tables 2008–2013. Source
data and more detailed references are in source data file 1.
Geroscience is
linking molecular ageing research to late-life diseases
Medical
improvements resulted in increased survival of the Swiss population (figure 4, supplementary
figures 4A–4E). The way the research and medical system is currently set up addresses
each chronic disease in isolation. While this is a good strategy, the common
denominator and highest risk factor of each of these diseases is age. Research
into ageing itself, or geroscience, is still a relatively small
interdisciplinary field combining research on basic ageing biology, chronic
diseases and healthy ageing [51]. Although the ageing process is complex,
recent molecular insights revealed a finite number of only nine fundamental
hallmarks of ageing [52]. Furthermore, ageing is malleable, and intervening
with any of these hallmarks extends the lifespan of model organisms [52]. Thus,
the goal of geroscience is to understand the ageing process leading up to and
enabling disease and to exploit these insights to prevent, ameliorate or delay these
age-dependent diseases, thereby improving the health of humans during ageing
and compressing years of sickness (figure 5A).
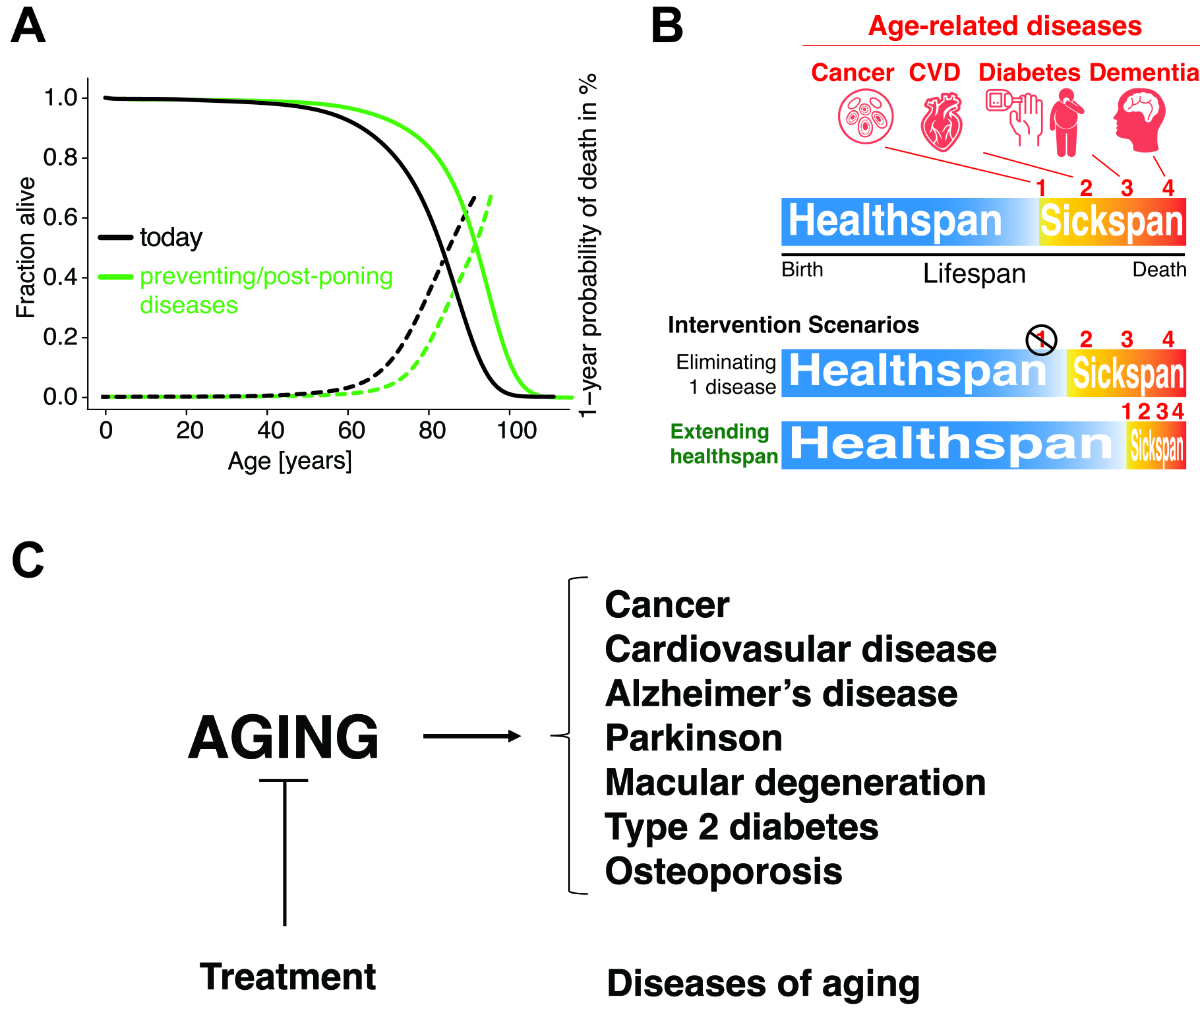
Figure 5The
goals of geoscience and longevity medicine. (A) Medicine
increases lifespan by increasing survival rates and hence decreasing mortality.
(B) With an
effective longevity intervention, the onset of many ageing-related diseases
could be postponed, and, besides achieving a longer lifespan, the sickspan, the
time spent in poor health, could be shortened, hence healthspan, the time spent
in good health, could be prolonged. CVD = cardiovascular disease. (C) Schematic
representation of the working model of geroscience. Instead of targeting each
chronic disease individually, the aim is to slow the ageing process in order to
extend the healthspan.
Although
our lifespans have increased, the time we spend in good health, i.e. healthspan, has
not followed
this trend (figure 5B) [53]. Swiss men and women spend on average around 14.1% and
17.2%, respectively, of their lifespan in poor health [1, 54], i.e. sickspan, with
late-life comorbidities
[53, 55]. In a self-rated health report of the Swiss National Cohort of 17,000 people,
an average of about 6–10% of the life expectancy beyond 30 years was spent in
poor health, depending on the level of school education [53]. Currently, by the
Swiss retirement age of mid-60s years of age, more than half of the Swiss
population has a score of at least 3 on the Thurgau Morbidity Index [56], which
corresponds to three or more mild-to-moderate conditions, while over 80% take
at least one medication chronically [56]. It has been estimated that if we
could defer the health-related consequences of one of these late-life diseases,
such as cancer, cardiovascular disease (CVD), diabetes or Alzheimer’s disease,
then the lifespan and healthspan would increase by about three years [57].
However, we have to be aware that if we cure one morbidity in a person, another
one will set in (figure 5B). Alternatively, if we could delay the onset of
age-related diseases by one year, it would save USD 38 trillion, as
estimated only for the US [58]. Assuming a proportional benefit for the Swiss
population and purchasing power parity in the exchange rate calculation, the
benefits of deferring the morbidities in Switzerland would amount to
approximately CHF 900 billion (calculation shown in source data file 1). Delaying
the onset of the sickspan, even at a very old age, and even reversing ageing is
biologically possible, as demonstrated in model organisms [59–62]. Furthermore,
centenarians (figure 2A, supplementary figures 1D–1G) are living examples of
healthy ageing and display a delayed onset and a lower incidence rate of
late-life morbidities [63–68]. The recent breakthroughs in geroscience are
starting to be translated and tested in clinical trials with tantalizing
results indicating pharmacological strategies for reversing ageing at the
cellular and tissue levels in humans (figure 5C) [69–79].
These pilot
clinical trials pave the way for identifying interventions that promote healthy
ageing. However, ageing is not classified as a disease, making it challenging
to design and run clinical trials targeting the ageing process [80–84].
Currently, the clinical trial strategy is to use indications associated with the
ageing process as surrogate markers for ageing. These include frailty
(NCT03451006) [79], vascular stiffness (NCT01842399) and reprogramming of
transcriptional gene expression to a more youthful state (NCT02953093,
NCT02432287). Other secondary markers used in clinical trials to indicate efficacy
in slowing ageing are epigenetic ageing clocks [69, 71, 72], immunological
changes (NCT03451006) [72, 75] and regeneration of the thymus [72].
Furthermore, recent efforts are trying to establish clinical trials with
companion dogs since they live in our households and enjoy sophisticated
healthcare but age faster than us, making them ideal for long-term longitudinal
and intervention studies on ageing [85].
Thus, novel
biomarkers and indicators of healthy ageing are needed. Today’s geroscience
brings systems biological understanding of underlying mechanisms of ageing to
enable and form a more preventive model of medicine, helping people to age
better by postponing or preventing late-life chronic pathologies (figure 5C).
The problem of
dealing with multimorbidities in current healthcare systems
Rates of multimorbidity keep rising
due to increased life expectancy and improved medical treatment. Chronic
diseases and conditions become more common with ageing [86], with an estimated
prevalence of over 65% among adults aged 65 years or older [87] and exceeding
75% between the ages of 85 and 89 years [88]. Multimorbidity, defined as having
two or more co-occurring chronic diseases, challenges healthcare systems around
the world [89] and emphasises the need to improve the care of patients with
co-occurring chronic conditions rather than focusing on individual chronic
diseases. Although most people with a chronic condition suffer from multiple
conditions, patients with multiple chronic conditions are commonly
underrepresented in clinical trials [90], and evidence-based treatment for
patients with multimorbidity is limited [91] and too often not addressed in
professional guidelines and clinical resources [92, 93]. This situation raises
treatment safety issues, such as polypharmacy, which is a common challenge when
caring for patients with multimorbidities. The increased risk of drug-disease
and drug-drug interactions leads to therapeutic conflicts and contra-indicated
treatments in about 50% of cases [94]. This leads to a dilemma for patients and
healthcare workers who want to make appropriate treatment decisions.
Multimorbidity
imposes a substantial economic burden on health systems and society [95] and
increases the demand for healthcare resources [96]. This complexity also
negatively impacts patients’ functional impairment, everyday life and quality
of life [86].
Consultation
length and continuity of care may also need to be substantially enhanced in
order to adequately address older patients’ health needs, as it has been
reported that older adults perceive a general unwillingness from their
providers to treat their multiple health conditions and address their
individual preferences for care. Older adults may require more in-depth
communication with their providers in addition to individualised treatment
plans that address their preferences for comorbidity management [97].
Consequently, as the prevalence of multimorbidity continues to rise, countries
face not only the challenges of providing quality care but also the economic
burden it incurs.
Health
practitioners, and especially primary care teams, have a key role in managing
patients with multimorbidity using a patient-centred generalist approach. This
will require a radical change in how healthcare systems are organised and
funded in order to effectively meet the challenges of multimorbidity [98].
Healthy longevity medicine
The recent advancements in artificial intelligence (AI), big data collection and analysis,
technologies, and the emergence of geroscience as an interdisciplinary approach
to the enhancement of healthspan and lifespan have given rise to a new field of
medicine that aims to restore and optimise the biological age of a specific
individual, along their lifespan [99]. Longevity medicine’s core target is to
extend a person’s healthspan by integrating innovations in human and AI and
creating applicable trajectories to identify, mitigate and optimally also
eliminate the risk of (age-related) diseases (most of which are the main
contributors to the global burden of diseases). Current medicine still has a
reactive pillar and a preventive pillar.
Longevity
medicine: translating and applying the hallmarks of ageing into practice
This new burgeoning
medical discipline is of a distinct character, shaped by multidisciplinarity (virtually
all disciplines of clinical medicine, including genetics, radiology and
pathology) [100] and interdisciplinarity (AI, computational science,
gerontology, geroscience, engineering, etc), with strong roots in internal
medicine dealing with the complexity of comorbidity and multimorbidity.
In
Switzerland, longevity medicine is particularly important due to the country’s ageing
population. As discussed above, as people are living longer, the prevalence of
age-related diseases such as dementia, arthritis and cardiovascular disease is
increasing. Longevity medicine can help to prevent or delay the onset of these
conditions, allowing individuals to maintain their independence and live
healthier, more active lives for longer.
A prime
example of a longevity medicine approach is the interconnection of ageing and
cancer. Ageing is the primary risk factor for cancer [101] and the incidence of
most types of cancer increases with advancing age (figure 3E). The crossroads
and valuable knowledge of ageing and cancer, as well as the insights from
treatment and diagnosis of the oldest cancer patients (which arrived only late
due to the exclusion of this population from most clinical trials), brought a
new area in medicine called geroncology [102]. This field aims to identify
further and specific targets of mechanisms that contribute to both ageing and
cancer and to develop strategies to prevent or treat age-related cancers.
Geroncologists not only investigate and translate into daily practice the
complex relationships between genomic instability, epigenetic changes, cellular
senescence and immune dysfunction in the context of ageing and cancer but also
apply the longevity diagnostics, such as biological age measurement or speech
recognition for natural language processing (NLP), into the standard clinical
protocols and use those tools to navigate therapies and follow-up, striking a
balance between toxicity and quality of life for patients [103]. By integrating
knowledge from diverse fields such as genetics, immunology and oncology,
geroncologists seek to uncover new insights into the underlying biology of
age-related cancers and to develop innovative approaches to prevention and
treatment.
In addition
to its importance in the clinic, longevity medicine can also be applied in
daily life through the adoption of healthy habits such as exercising regularly,
eating a balanced diet and getting enough sleep. These habits can help to
promote healthy ageing and reduce the risk of age-related diseases and
conditions. Overall, the importance of longevity medicine in the clinic and in
daily life cannot be overstated, as it has the potential to greatly improve the
lives of older individuals and promote healthy ageing.
Longevity
medicine has not yet been officially defined by a central medical body, but
expert recommendations suggest that longevity medicine is AI-driven precision
medicine guided by biological age determination with ageing clocks [99]. The
formal definition might be further enriched by the core goal of longevity
medicine, which is to establish and restore the biological age of an individual
at each specific point of time to the biological age of optimal individual
performance [84]. Longitudinally and cumulatively, this leads to mitigation
and, ideally also, elimination of risks of age-related and overall morbidity.
Therefore, the main focus of longevity medicine is to prolong life lived in
good health, both physically and mentally, ergo: extension of the healthy
lifespan and not solely the healthspan (simple prevention) or solely the
lifespan (reactive medicine, i.e.
sickcare) [84]. Recent attempts to implement ageing as a disease in the ICD
code would allow longevity medicine to set up more randomised controlled trials
and thus allow the validation of biomarkers of ageing and the creation of clinical
guidelines. Currently, ICD-11 has not implemented this core step in the
categorisation; however, the debate stimulated more clinicians to be alert, and
experts shifted the focus of their argumentation to longevity medicine as a
discipline to quantifiable measurements and biomarkers and to the necessity for
clinicians to have the (coding) tools [84].
Longevity
physicians
Longevity
medicine is an evolving field fuelled by the exponentially growing arena of
geroscience and AI, as well as implementable point-of-care (POC) and inpatient
technologies, which allow a longitudinal measurement of objective and subjective
assessments with high granularity. With the advent of deep learning models, the
establishment of deep ageing clocks (DACs) in 2018 opened the possibility for
clinicians to vigilantly track the progress of a patient’s/individual’s
biological age based on various modalities, e.g. haematological tests, methylation,
metabolomic or microbiome.
Both static values and rate of ageing are of value, while an integrative
comprehensive biological age clock at each of the organism levels (tissue,
cell, omics, etc.) would provide the greatest value.
Concluding remarks
Life
expectancy in Switzerland has steadily increased with a decreasing rate over
the past few decades. Along with life expectancy, the OADR has also increased.
As ageing is associated with many morbidities, their prevalence is destined to
further increase unless further measures are taken. The increased OADR will
lead to secular stagnation in the economy and threaten the sustainability of
pension systems.
The
demographic transition and ageing population, therefore, pose important
challenges to Swiss society from several perspectives. Given our findings here,
we suggest the following potential strategies to address these challenges. By
researching the molecular mechanisms involved in the biology of ageing and
expanding epidemiological and clinical research on ageing, we should aim to
bridge the gaps between basic research of geroscience and medical applications.
We need to establish protocols for clinical trials on ageing that include
functional capacity, frailty and time to events of onset of age-related
diseases. For this, we need to establish clinically relevant biomarkers of
healthy ageing and incorporate a more complete interconnected picture of comorbidities.
Applying AI-powered solutions to disease diagnosis and monitoring could help to
shift towards a more preventive medical approach. With this, we can hopefully
improve the quality of health in the ageing population.
Without
changes in the biological and medical fields, the socioeconomic impacts of ageing
might become devastating. Hence it is indispensable to invest in the future of ageing
research.
Materials and methods
Data analysis
All plots
were made using the R Project for statistical computing, the “readxl” package
and the “RColorBrewer” package [104].
The
demographic data for the population pyramids and centenarians were taken from
three sources: The data up to and including 1980 originate from the census
(“VZ”) data (https://www.bfs.admin.ch/bfs/en/home/basics/census.html).
In order
to avoid discrepancies, especially at older ages, between the data sets from
1981 onwards, a dataset [19] harmonising the ESPOP (1981–2010;
https://www.bfs.admin.ch/bfs/de/home/statistiken/bevoelkerung/erhebungen/espop.html)
and STATPOP (from 2010 onwards; https://www.bfs.admin.ch/bfs/de/home/statistiken/bevoelkerung/erhebungen/statpop.html) statistics was used for the period
1981–2009. From 2010 onwards, the STATPOP dataset was used.
Source data
All sources
are cited in the text. All source data that we used for our analysis are provided
as data source file 1. Figshare: https://doi.org/10.6084/m9.figshare.21922095.v2
All data
used for graphs are publicly available from the sources stated, mainly the
Swiss Federal Statistical Office.
Acknowledgements
Author
contributions: All authors participated in analyzing and interpreting the data and
writing the manuscript. MMR and CYE designed,
conceptualized, and made the figures.
Collin Y.
Ewald
Laboratory
of Extracellular Matrix Regeneration
Institute
of Translational Medicine
Department
of Health Sciences and Technology
ETH Zürich
CH-8603 Schwerzenbach
collin-ewald[at]ethz.ch
References
1. Migration BSD und. Periodensterbetafeln für die Schweiz (1876-2150) nach Jahr, Geschlecht
und Alter [Internet]. Bundesamt für Statistik; 2019 Apr. Available from: https://www.bfs.admin.ch/asset/de/px-x-0102020300_102
2. Kohli R. Sterbetafeln für die Schweiz 2008/2013 [Internet]. Bundesamt für Statistik;
2017. Available from: https://www.google.com/url?sa=t&rct=j&q=&esrc=s&source=web&cd=&ved=2ahUKEwi8qb_ygPL2AhWM_6QKHbVxD54QFnoECAYQAQ&url=https%3A%2F%2Fwww.bfs.admin.ch%2Fbfsstatic%2Fdam%2Fassets%2F2103067%2Fmaster&usg=AOvVaw2eaEcfFAosBN8xQfnibWiJ
3. STATPOP BE. Wachstum der ständigen Wohnbevölkerung nach Staatsangehörigkeit 1970-2020
[Internet]. Bundesamt für Statistik; 2021 Sep. Available from: https://www.bfs.admin.ch/bfs/de/home/statistiken/bevoelkerung/stand-entwicklung/alter-zivilstand-staatsangehoerigkeit.assetdetail.18264538.html
4. BFS. Medianalter der ständigen Wohnbevölkerung nach Geschlecht und Staatsangehörigkeitskategorie,
1971-2020 [Internet]. Bundesamt für Statistik; 2021 Sep. Available from: https://www.bfs.admin.ch/bfs/de/home/statistiken/kataloge-datenbanken/tabellen.assetdetail.18344318.html
5. BFS. Kohortensterbetafeln für die Schweiz, Geburtsjahrgänge 1876-2030, Technischer
Bericht 2018 [Internet]. Bundesamt für Statistik; 2019 Apr. Available from: https://www.bfs.admin.ch/bfs/de/home/statistiken/bevoelkerung/geburten-todesfaelle/lebenserwartung.assetdetail.8126461.html
6. Dong X, Milholland B, Vijg J. Evidence for a limit to human lifespan. Nature. 2016 Oct;538(7624):257–9.
10.1038/nature19793
7. Olshansky SJ, Carnes BA. Inconvenient Truths About Human Longevity. Newman A, editor.
The journals of gerontology Series A, Biological sciences and medical sciences. 2019 Nov 13;74(Supplement_1):S7–12.
10.1093/gerona/glz098
8. Barbi E, Lagona F, Marsili M, Vaupel JW, Wachter KW. The plateau of human mortality:
demography of longevity pioneers. Science. 2018 Jun;360(6396):1459–61. 10.1126/science.aat3119
9. Network GB of DC. Global Burden of Disease Study 2017 (GBD 2017) Results [Internet].
Institute for Health Metrics and Evaluation (IHME); 2018. Available from: http://ghdx.healthdata.org/gbd-results-tool
10. Xu J, Murphy SL, Kochanek KD, Arias E. Mortality in the United States, 2015 [Internet].
NCHS Data Brief. 2016 Dec;(267):1–8. Available from: https://pubmed.ncbi.nlm.nih.gov/27930283/
11. Rosenquist K, Fox C. Chapter 36 Mortality Trends in Type 2 Diabetes. In: Diabetes
in America. 3rd edition. 2018. Available from: https://www.ncbi.nlm.nih.gov/books/NBK568010
12. Case A, Deaton A. Mortality and morbidity in the 21st century. Brookings Pap Econ Act. 2017;2017(1):397–476. 10.1353/eca.2017.0005
13. Group WB. Databank World Development Indicators [Internet]. 2022 [cited 2022 Feb 27].
Available from: https://databank.worldbank.org/reports.aspx?source=2&series=SP.DYN.LE00.MA.IN&country=
14. Janssen F, van Poppel F. The Adoption of Smoking and Its Effect on the Mortality Gender
Gap in Netherlands: A Historical Perspective. BioMed Res Int. 2015;2015:370274. 10.1155/2015/370274
15. OECD. Health at a Glance 2021. Heal Glance; 2021.
16. Migration BSD und. Lebendgeburten nach Monat und Geburtenhäufigkeit seit 1803 [Internet].
Bundesamt für Statistik; 2021. Available from: https://www.pxweb.bfs.admin.ch/pxweb/de/px-x-0102020204_111/px-x-0102020204_111/px-x-0102020204_111.px
17. Craig J. Replacement level fertility and future population growth. Popul Trends. 1994;(78):20–2.
18. Wyler J. Die Geburtenhäufigkeit der Schweiz während des Weltkrieges [Internet]. 1921.
Available from: https://www.sgvs.ch › sjesBackIssues › 1921_PDF
19. Wanner P. Harmonisation de la statistique ESPOP 1981-2010 avec la statistique STATPOP.
Universite de Geneva; 2012.
20. Bauer AB. AHV-Statistik: Die Geschichte der AHV [Internet]. Hintergrunddokument Die
Geschichte der AHV. 2018 [cited 2022 Mar 20]. Available from: https://www.bsv.admin.ch/bsv/de/home/sozialversicherungen/ahv/statistik.html
21. Sozialversicherungen B für. Anzahl AHV-Renten, Rentensumme und Mittelwert im Dezember
nach Rententyp, Wohnsitzstaat (Kategorie), Staatsangehörigkeit (Kategorie) und Geschlecht
[Internet]. 2020. Available from: https://www.pxweb.bfs.admin.ch/pxweb/de/px-x-1305000000_101/px-x-1305000000_101/px-x-1305000000_101.px
22. Feldstein M, Liebman J. Social Security. 10.3386/w8451
23. Schaltegger C, Leisibach P. Eidgenössische Volksinitiative «Für eine sichere und nachhaltige
Altersvorsorge» (Renteninitiative) Eine ökonomische Beurteilung der wichtigsten Argumente
[Internet]. Universitaet Luzern; 2020 May p. 1–60. Available from: https://renten-sichern.ch/uploads/renteninitiative/Gutachten_Renteninitiative.pdf
24. Wasserfallen C. Renteninitiative [Internet]. 2022 [cited 2022 Mar 20]. Available from:
https://renten-sichern.ch/article/4566/gesucht-200-milliarden-franken
25. Vorsorge SB. Überblick über den Stand der Vorsorgeeinrichtungen (VE): Bilanzsumme,
aktive Versicherte, Bezüger und Leistungen [Internet]. Bundesamt für Statistik; 2022.
Available from: https://www.pxweb.bfs.admin.ch/pxweb/de/px-x-1303030000_101/px-x-1303030000_101/px-x-1303030000_101.px
26. OECD. Old-age dependency ratio [Internet]. 2022 [cited 2022 Jun 6]. Available from:
https://data.oecd.org/pop/old-age-dependency-ratio.htm
27. Bank TW. Age dependency ratio, old (% of working-age population) [Internet]. 2022
[cited 2022 Jun 6]. Available from: https://data.worldbank.org/indicator/SP.POP.DPND.OL
28. Summers L. Accepting the Reality of Secular Stagnation. Finance Dev. 2020;57(1).
29. Rachel Ł, Summers L. On Secular Stagnation in the Industrialized World. 10.3386/w26198
30. Klose J. Secular Stagnation in Non-EMU European Countries : Equilibrium Real Rate
Approach. J Econ Integr. 2017;32(2):400–32. 10.11130/jei.2017.32.2.400
31. Murakami Y, Bohn J. The Japanification of the world [Internet]. 2020 [cited 2022 Apr
3]. Available from: https://www.swissre.com/institute/conferences/the-ageing-effect/the-japanification-of-the-world.html
32. Brunner AD, Kamin S; System B of G of the FR. Brunner AD, Kamin S. Determinants of
the 1991-93 Japanese Recession: Evidence from a Structural Model of the Japanese Economy.
Int Finance Discuss Pap. 1994;1994(479):1–56. 10.17016/IFDP.1994.479
33. Goodhart C, Pradhan M. The Great Demographic Reversal: Ageing Societies, Waning Inequality,
and an Inflation Revival. Palgrave Macmillan; 2020. 280 pp. 10.1007/978-3-030-42657-6
34. Case A, Deaton A. Mortality and morbidity in the 21st century. Brookings Pap Econ Act. 2017;2017(1):397–476. 10.1353/eca.2017.0005
35. Partridge L, Fuentealba M, Kennedy BK. The quest to slow ageing through drug discovery.
Nat Rev Drug Discov. 2020 Aug;19(8):513–32. 10.1038/s41573-020-0067-7
36. Polliack ML, Barak Y, Achiron A. Late-onset multiple sclerosis. J Am Geriatr Soc.
2001 Feb;49(2):168–71. 10.1046/j.1532-5415.2001.49038.x
37. Vaughn CB, Jakimovski D, Kavak KS, Ramanathan M, Benedict RH, Zivadinov R, et al. Epidemiology
and treatment of multiple sclerosis in elderly populations. Nat Rev Neurol. 2019 Jun;15(6):329–42.
10.1038/s41582-019-0183-3
38. Fratiglioni L, De Ronchi D, Agüero-Torres H. Worldwide prevalence and incidence of
dementia. Drugs Aging. 1999 Nov;15(5):365–75. 10.2165/00002512-199915050-00004
39. Schweiz GP. Alzheimer Schweiz Demenzkostenstudie 2019 [Internet]. 2019 [cited 2022
Jun 14]. Available from: https://www.alzheimer-schweiz.ch/de/ueber-demenz/beitrag/alzheimer-schweiz-demenzkostenstudie-2019-gesellschaftliche-perspektive
40. Wieser S. Die Kosten der nichtübertragbaren Krankheiten in der Schweiz : Schlussbericht
[Internet]. 2014 [cited 2022 Jun 14]. Available from: https://digitalcollection.zhaw.ch/handle/11475/14988
41. Schneider H, Venetz W. Cost of Obesity in Switzerland in 2012 [Internet]. Bundesamt
für Gesundheit, Contract-Number 13.005335; 2012 [cited 2022 Jun 14]. Available from:
https://www.google.com/url?sa=t&rct=j&q=&esrc=s&source=web&cd=&ved=2ahUKEwjA9rv31tD7AhWTgv0HHVVsA7wQFnoECA8QAQ&url=https%3A%2F%2Fwww.bag.admin.ch%2Fdam%2Fbag%2Ffr%2Fdokumente%2Fnpp%2Fforschungsberichte%2Fforschungsberichte-e-und-b%2Fcost-of-obesity.pdf.download.pdf%2Fcost-of-obesity.pdf&usg=AOvVaw0qr2JEtm2J7f4oM8cjH_l4
42. Toyoda K, Yoshimura S, Nakai M, Koga M, Sasahara Y, Sonoda K, et al.; Japan Stroke
Data Bank Investigators. Twenty-Year Change in Severity and Outcome of Ischemic and
Hemorrhagic Strokes. JAMA Neurol. 2022 Jan;79(1):61–9. 10.1001/jamaneurol.2021.4346
43. Antonia K, Glen P K, Andreas D F. P KG, D FA. The Impact of Heat Waves on Mortality
among the Elderly: A Mini Systematic Review. J Geriatr Med Gerontol. 2018;4(3). 10.23937/2469-5858/1510053
44. Kenny GP, Sigal RJ, McGinn R. Body temperature regulation in diabetes. Temperature.
2016 Jan;3(1):119–45. 10.1080/23328940.2015.1131506
45. Meehl G, Stocker T. Global Climate Projections. In: Climate Change 2007 [Internet].
2007. Available from: https://www.ipcc.ch/site/assets/uploads/2018/02/ar4-wg1-chapter10-1.pdf
46. Kohler A. So stark trifft der Klimawandel die Schweiz [Internet]. 2019 [cited 2022
Jun 14]. Available from: https://www.swissinfo.ch/ger/schweiz-klimawandel-temperaturen-hitze/45090938
47. Statistik B für. Weekly number of deaths, 2020-2022 [Internet]. 2022 [cited 2022 Jun
14]. Available from: https://www.bfs.admin.ch/bfs/de/home/statistiken/kataloge-datenbanken/tabellen.assetdetail.22264685.html
48. Kohli R. Auswirkungen der Covid-19-Pandemie auf die Sterblichkeit in der Schweiz [Internet].
2021 [cited 2022 Jun 14]. Available from: https://www.bfs.admin.ch/bfs/de/home/statistiken/bevoelkerung/geburten-todesfaelle/lebenserwartung.assetdetail.19305028.html
49. Gagnon A, Miller MS, Hallman SA, Bourbeau R, Herring DA, Earn DJ, et al. Age-specific
mortality during the 1918 influenza pandemic: unravelling the mystery of high young
adult mortality. PLoS One. 2013 Aug;8(8):e69586. 10.1371/journal.pone.0069586
50. Simonsen L, Clarke MJ, Schonberger LB, Arden NH, Cox NJ, Fukuda K. Pandemic versus
epidemic influenza mortality: a pattern of changing age distribution. J Infect Dis.
1998 Jul;178(1):53–60. 10.1086/515616
51. Kennedy BK, Berger SL, Brunet A, Campisi J, Cuervo AM, Epel ES, et al. Geroscience:
linking aging to chronic disease. Cell. 2014 Nov;159(4):709–13. 10.1016/j.cell.2014.10.039
52. López-Otín C, Blasco MA, Partridge L, Serrano M, Kroemer G. The hallmarks of aging.
Cell. 2013 Jun;153(6):1194–217. 10.1016/j.cell.2013.05.039
53. Remund A, Cullati S, Sieber S, Burton-Jeangros C, Oris M, Egger M, et al.; Swiss National
Cohort. Longer and healthier lives for all? Successes and failures of a universal
consumer-driven healthcare system, Switzerland, 1990-2014. Int J Public Health. 2019 Nov;64(8):1173–81.
10.1007/s00038-019-01290-5
54. Statistik B für. Lebenserwartung in guter Gesundheit nach Staatsangehörigkeit und
Geschlecht [Internet]. 2019 [cited 2022 Jun 14]. Available from: https://www.bfs.admin.ch/bfs/de/home/statistiken/bevoelkerung/migration-integration/integrationindikatoren/indikatoren/lebenserwartung-gute-gesundheit.assetdetail.9186024.html
55. Partridge L, Deelen J, Slagboom PE. Facing up to the global challenges of ageing.
Nature. 2018 Sep;561(7721):45–56. 10.1038/s41586-018-0457-8
56. Gnädinger M, Herzig L, Ceschi A, Conen D, Staehelin A, Zoller M, et al. Chronic conditions
and multimorbidity in a primary care population: a study in the Swiss Sentinel Surveillance
Network (Sentinella). Int J Public Health. 2018 Dec;63(9):1017–26. 10.1007/s00038-018-1114-6
57. Olshansky SJ, Carnes BA, Cassel C. In search of Methuselah: estimating the upper limits
to human longevity. Science. 1990 Nov;250(4981):634–40. 10.1126/science.2237414
58. Scott AJ, Ellison M, Sinclair DA. The economic value of targeting aging. Nat Aging.
2021 Jul;1(7):616–23. 10.1038/s43587-021-00080-0
59. Statzer C, Reichert P, Dual J, Ewald CY. Longevity interventions temporally scale
healthspan in Caenorhabditis elegans. Biorxiv. 2021;2021.05.31.446397.
60. Venz R, Pekec T, Katic I, Ciosk R, Ewald CY. End-of-life targeted degradation of DAF-2
insulin/IGF-1 receptor promotes longevity free from growth-related pathologies. eLife.
2021 Sep;10:e71335. 10.7554/eLife.71335
61. Lu Y, Brommer B, Tian X, Krishnan A, Meer M, Wang C, et al. Reprogramming to recover
youthful epigenetic information and restore vision. Nature. 2020 Dec;588(7836):124–9.
10.1038/s41586-020-2975-4
62. Ocampo A, Reddy P, Martinez-Redondo P, Platero-Luengo A, Hatanaka F, Hishida T, et
al. In Vivo Amelioration of Age-Associated Hallmarks by Partial Reprogramming. Cell.
2016 Dec;167(7):1719–1733.e12. 10.1016/j.cell.2016.11.052
63. Ailshire JA, Beltrán-Sánchez H, Crimmins EM. Becoming centenarians: disease and functioning
trajectories of older US Adults as they survive to 100. J Gerontol A Biol Sci Med
Sci. 2015 Feb;70(2):193–201. 10.1093/gerona/glu124
64. Ismail K, Nussbaum L, Sebastiani P, Andersen S, Perls T, Barzilai N, et al. Compression
of Morbidity Is Observed Across Cohorts with Exceptional Longevity. J Am Geriatr Soc.
2016 Aug;64(8):1583–91. 10.1111/jgs.14222
65. Andersen SL, Sebastiani P, Dworkis DA, Feldman L, Perls TT. Health span approximates
life span among many supercentenarians: compression of morbidity at the approximate
limit of life span. J Gerontol A Biol Sci Med Sci. 2012 Apr;67(4):395–405. 10.1093/gerona/glr223
66. Evans CJ, Ho Y, Daveson BA, Hall S, Higginson IJ, Gao W, et al. Place and cause of
death in centenarians: a population-based observational study in England, 2001 to
2010. Prigerson HG, editor. PLoS medicine. 2014 Jun;11(6):e1001653.
67. Evert J, Lawler E, Bogan H, Perls T. Morbidity profiles of centenarians: survivors,
delayers, and escapers. The Journals of Gerontology: Series A. 2003 Mar;58(3):232–7.
10.1093/gerona/58.3.M232
68. Kheirbek RE, Fokar A, Shara N, Bell-Wilson LK, Moore HJ, Olsen E, et al. Characteristics
and Incidence of Chronic Illness in Community-Dwelling Predominantly Male U.S. Veteran
Centenarians. J Am Geriatr Soc. 2017 Sep;65(9):2100–6. 10.1111/jgs.14900
69. Demidenko O, Barardo D, Budovskii V, Finnemore R, Palmer FR 3rd, Kennedy BK, et al. Rejuvant®,
a potential life-extending compound formulation with alpha-ketoglutarate and vitamins,
conferred an average 8 year reduction in biological aging, after an average of 7 months
of use, in the TruAge DNA methylation test. Aging (Albany NY). 2021 Nov;13(22):24485–99.
10.18632/aging.203736
70. Kaeberlein M. Translational geroscience: A new paradigm for 21st century medicine. Transl Med Aging. 2017 Oct;1:1–4. 10.1016/j.tma.2017.09.004
71. Fitzgerald KN, Hodges R, Hanes D, Stack E, Cheishvili D, Szyf M, et al. Potential
reversal of epigenetic age using a diet and lifestyle intervention: a pilot randomized
clinical trial. Aging (Albany NY). 2021 Apr;13(7):9419–32. 10.18632/aging.202913
72. Fahy GM, Brooke RT, Watson JP, Good Z, Vasanawala SS, Maecker H, et al. Reversal of
epigenetic aging and immunosenescent trends in humans. Aging Cell. 2019 Dec;18(6):e13028.
10.1111/acel.13028
73. Justice JN, Nambiar AM, Tchkonia T, LeBrasseur NK, Pascual R, Hashmi SK, et al. Senolytics
in idiopathic pulmonary fibrosis: results from a first-in-human, open-label, pilot
study. EBioMedicine. 2019 Feb;40:554–63. 10.1016/j.ebiom.2018.12.052
74. Hickson LJ, Langhi Prata LG, Bobart SA, Evans TK, Giorgadze N, Hashmi SK, et al. Senolytics
decrease senescent cells in humans: preliminary report from a clinical trial of Dasatinib
plus Quercetin in individuals with diabetic kidney disease. EBioMedicine. 2019 Sep;47:446–56.
10.1016/j.ebiom.2019.08.069
75. Mannick JB, Morris M, Hockey HP, Roma G, Beibel M, Kulmatycki K, et al. TORC1 inhibition
enhances immune function and reduces infections in the elderly. Sci Transl Med. 2018 Jul;10(449):eaaq1564.
10.1126/scitranslmed.aaq1564
76. Chung CL, Lawrence I, Hoffman M, Elgindi D, Nadhan K, Potnis M, et al. Topical rapamycin
reduces markers of senescence and aging in human skin: an exploratory, prospective,
randomized trial. Geroscience. 2019 Dec;41(6):861–9. 10.1007/s11357-019-00113-y
77. Andreux PA, Blanco-Bose W, Ryu D, Burdet F, Ibberson M, Aebischer P, et al. The mitophagy
activator urolithin A is safe and induces a molecular signature of improved mitochondrial
and cellular health in humans. Nat Metab. 2019 Jun;1(6):595–603. 10.1038/s42255-019-0073-4
78. Nielsen JL, Bakula D, Scheibye-Knudsen M. Clinical Trials Targeting Aging. Front Aging.
2022 Feb;3:820215. 10.3389/fragi.2022.820215
79. Liu S, D’Amico D, Shankland E, Bhayana S, Garcia JM, Aebischer P, et al. Effect of
Urolithin A Supplementation on Muscle Endurance and Mitochondrial Health in Older
Adults: A Randomized Clinical Trial. JAMA Netw Open. 2022 Jan;5(1):e2144279. 10.1001/jamanetworkopen.2021.44279
80. Bulterijs S, Hull RS, Björk VC, Roy AG. It is time to classify biological aging as
a disease. Front Genet. 2015 Jun;6:205. 10.3389/fgene.2015.00205
81. Zhavoronkov A, Bhullar B. Classifying aging as a disease in the context of ICD-11.
Front Genet. 2015 Nov;6:326. 10.3389/fgene.2015.00326
82. Flatt T. A new definition of aging? Front Genet. 2012 Aug;3:148. 10.3389/fgene.2012.00148
83. Banerjee D, Mukhopadhyay S, Rabheru K, Ivbijaro G, de Mendonca Lima CA. Not a disease:
a global call for action urging revision of the ICD-11 classification of old age.
Lancet Healthy Longev. 2021 Oct;2(10):e610–2. 10.1016/S2666-7568(21)00201-4
84. Bischof E, Maier AB, Lee KF, Zhavoronkov A, Sinclair D. Advanced pathological ageing
should be represented in the ICD. Lancet Healthy Longev. 2022 Jan;3(1):e12. 10.1016/S2666-7568(21)00303-2
85. Creevy KE, Akey JM, Kaeberlein M, Promislow DE, Consortium TD, Barnett BG, et al.;
Dog Aging Project Consortium. An open science study of ageing in companion dogs. Nature.
2022 Feb;602(7895):51–7. 10.1038/s41586-021-04282-9
86. Maresova P, Javanmardi E, Barakovic S, Barakovic Husic J, Tomsone S, Krejcar O, et
al. Consequences of chronic diseases and other limitations associated with old age
- a scoping review. BMC Public Health. 2019 Nov;19(1):1431. 10.1186/s12889-019-7762-5
87. Jindai K, Nielson CM, Vorderstrasse BA, Quiñones AR. Multimorbidity and Functional
Limitations Among Adults 65 or Older, NHANES 2005-2012. Prev Chronic Dis. 2016 Nov;13:E151.
10.5888/pcd13.160174
88. Salive ME. Multimorbidity in older adults. Epidemiol Rev. 2013;35(1):75–83. 10.1093/epirev/mxs009
89. Harrison C, Fortin M, van den Akker M, Mair F, Calderon-Larranaga A, Boland F, et
al. Comorbidity versus multimorbidity: why it matters. J Multimorb Comorb. 2021 Mar;11:2633556521993993.
10.1177/2633556521993993
90. Pitkala KH, Strandberg TE. Clinical trials in older people. Age Ageing. 2022 May;51(5):afab282.
10.1093/ageing/afab282
91. Smith SM, Soubhi H, Fortin M, Hudon C, O’Dowd T. Managing patients with multimorbidity:
systematic review of interventions in primary care and community settings. Bmj Br
Medical J. 2012;345(sep03 1):e5205. 10.1136/bmj.e5205
92. Guthrie B, Payne K, Alderson P, McMurdo MET, Mercer SW. Adapting clinical guidelines
to take account of multimorbidity. Bmj Br Medical J. 2012;345(oct04 1):e6341. 10.1136/bmj.e6341
93. Organization WH. Medication Safety in Polypharmacy: Technical Report [Internet]. 2016
[cited 2022 Oct 14]. Available from: https://apps.who.int/iris/handle/10665/325454
94. Markun S, Holzer BM, Rodak R, Kaplan V, Wagner CC, Battegay E, et al. Therapeutic
conflicts in emergency department patients with multimorbidity: a cross-sectional
study. PLoS One. 2014 Oct;9(10):e110309. 10.1371/journal.pone.0110309
95. Tran PB, Kazibwe J, Nikolaidis GF, Linnosmaa I, Rijken M, van Olmen J. Costs of multimorbidity:
a systematic review and meta-analyses. BMC Med. 2022 Jul;20(1):234. 10.1186/s12916-022-02427-9
96. McPhail SM. Multimorbidity in chronic disease: impact on health care resources and
costs. Risk Manag Healthc Policy. 2016 Jul;9:143–56. 10.2147/RMHP.S97248
97. Beverly EA, Wray LA, Chiu CJ, LaCoe CL. Older Adults’ Perceived Challenges With Health
Care Providers Treating Their Type 2 Diabetes and Comorbid Conditions. Clin Diabetes.
2014 Jan;32(1):12–7. 10.2337/diaclin.32.1.12
98. Moffat K, Mercer SW. Challenges of managing people with multimorbidity in today’s
healthcare systems. BMC Fam Pract. 2015 Oct;16(1):129. 10.1186/s12875-015-0344-4
99. Zhavoronkov A, Bischof E, Lee KF. Artificial intelligence in longevity medicine. Nat
Aging. 2021 Jan;1(1):5–7. 10.1038/s43587-020-00020-4
100. Bischof E, Scheibye-Knudsen M, Siow R, Moskalev A. Longevity medicine: upskilling
the physicians of tomorrow. Lancet Healthy Longev. 2021 Apr;2(4):e187–8. 10.1016/S2666-7568(21)00024-6
101. The importance of aging in cancer research. Nat Aging. 2022 May;2(5):365–6. 10.1038/s43587-022-00231-x
102. Management of Elderly and Old Cancer Patients – Geriatric Oncology. Heal Times Oncol
Hematology. 2021;(10).
103. Hurria A, Mohile S, Gajra A, Klepin H, Muss H, Chapman A, et al. Validation of a Prediction
Tool for Chemotherapy Toxicity in Older Adults With Cancer. J Clin Oncol. 2016 Jul;34(20):2366–71.
10.1200/JCO.2015.65.4327
104. Ihaka R, Gentleman RR. A Language for Data Analysis and Graphics. J Comput Graph Stat.
2012;5(3):299–314.
Appendix
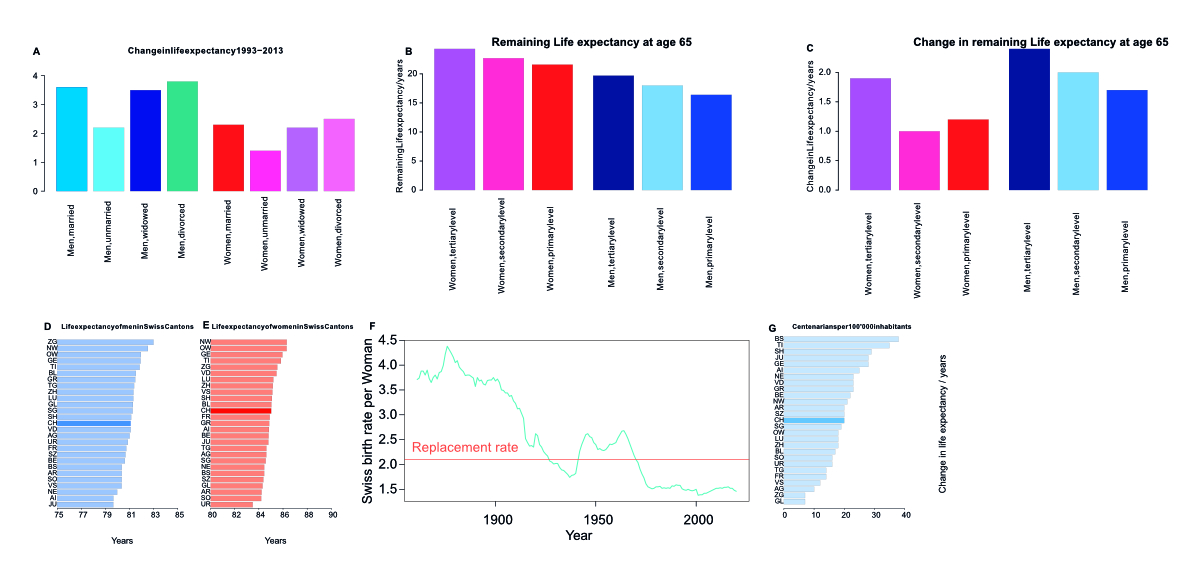
Supplementary figure 1Life expectancy and centenarians in Swiss cantons; birth rates. (A) Change in life
expectancy in Switzerland at age 65 conditional on being alive from the 1988-1993
period to the 2008–2013 period, in years, by marriage status: married, unmarried,
widowed, divorced. While divorced men and women have gained the most ground in the
observed period, married men and women still live the longest. (B) Remaining life
expectancy at age 65 conditional on being alive in the period 2000–2005. Grouped by
sex and education level.
(C) Change in remaining life expectancy at age 65 conditional on being alive from
1990–1995 to the 2000–2005 period. Grouped by sex and education level.
Both in men and women, the more educated, the longer lived. Men and women with tertiary
education have also seen the most increase in life expectancy from 1990–1995 to the
2000– 2005 period. (D) and (E) Life expectancy at birth of men (D) and women (E) in
the Swiss Cantons and the Swiss average. (F) The birth rate in Switzerland as per
live births per woman. The UN-defined replacement rate of 2.1 births per woman is
indicated as a horizontal line. (G) The number of centenarians per 100’000 inhabitants
in the Swiss Cantons as well as the Swiss average.
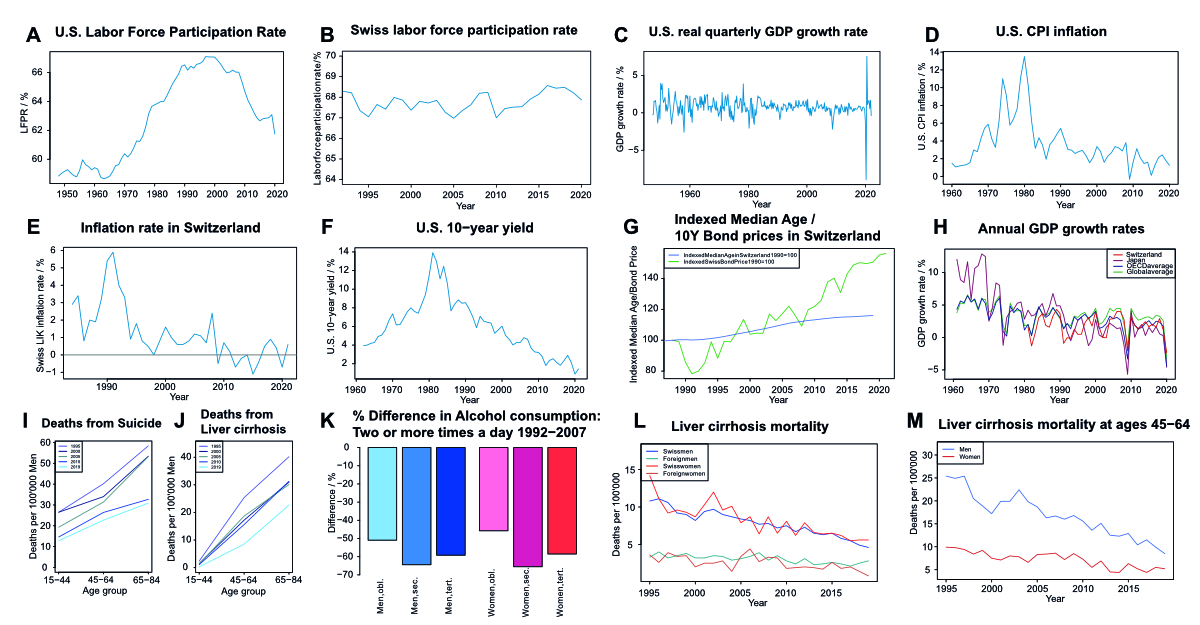
Supplementary figure 2Economic data for Switzerland, the United States, and global comparisons, as well
as Swiss inequality data. (A) and (B) Labor force participation rate in the United
States (A) and Switzerland (B) as the fraction of people in the labor force divided
by the population over time.
(C) United States quarter-on-quarter growth in real (inflation-adjusted) gross domestic
product. (D) United States consumer price inflation as the annual rate in percent
over time. (E) Annual inflation rate measured as LIK (“Landesindex der Konsumentenpreise”)
in Switzerland over time. (F) Nominal annualized yield on 10-year United States government
bonds over time. (G) The median age of the Swiss population over time indexed to 100
in 1988, and the price of a hypothetical 10-year Swiss government bond indexed to
100 with the yield of 1988. The yield and price of a bond are negatively correlated.
No causative correlation can be extrapolated, though a general uptrend with a similar
shape is visible for both. Asset prices, for example, bond prices, are, in general,
inversely correlated to the future rate of return on that asset. Since the financial
crisis, asset prices have increased broadly (asset price inflation) [28], as shown
here with the example of a hypothetical Swiss bond (=asset) that increases in value
as its interest rate decreases. Of course, a causal relationship cannot be implied,
but it is notable that both the median age of the Swiss population and the bond price
moved upward in a similar fashion. (H) The year-on-year annual percentage growth rate
of GDP at market prices is based on constant local currency in Switzerland, Japan,
the OECD average, and the global average over time. Global GDP growth has exceeded
OECD growth every year this millennium, as have emerging economies. While the Japanese
economy grew very fast in the 1960s and 1970s and continued to largely grow faster
than the global and OECD averages until 1990, the bursting of the asset bubble and
economic crisis of the 1990s has led to Japan growing slowly ever since, with Switzerland,
also a comparatively slow-growing economy, mostly advancing faster than Japan. The
two large drops in 2008/2009 and 2020 are due to the great financial crisis and the
COVID-19 pandemic, respectively, both of which severely affected the Japanese economy,
especially the great financial crisis, from which Japan struggled to emerge with positive
real growth rates despite large fiscal and monetary stimulus. The Swiss economy, on
the other hand, while also being adversely affected by both crises, was overall more
resilient in terms of GDP growth than Japan as well as the OECD as a whole. One
possible explanation is that Switzerland has been described by Nassim taleb as “antifragile”
(ISBN 978-0-14-103822-3), getting stronger in turmoil and shock, due to a variety
of factors, including its political, monetary, and economic systems (https://fortune.com/2012/12/14/antifragility-how-disorder-makes-us-stronger/). (I) and (J) Mortality as the number of deaths from suicide (I) and liver cirrhosis
(J) per 100’000 people at risk in three age groups (15–44, 45–64, and 65–84) in 1995,
2000, 2005,
2010 and 2019 for men. (K) % Change (not % point) in consumption of alcohol at least
twice a day from 1992–2007 for men and women that have completed obligatory, secondary,
or tertiary education in Switzerland. (L) Mortality rates (Deaths per 100’000 people
at risk) in Switzerland (all ages) with liver cirrhosis as a cause of death, over
time, by sex and citizenship status. (M) Mortality rates (Deaths per 100’000 people
at risk) in the 45–64 age group in Switzerland with liver cirrhosis as a cause of
death, over time, by sex.
Remarks concerning Supplementary figures 2 (I)-(M): Overall, Supplementary Figures 2 (I)-(M) show that some of the negative trends in
mortality observable in many industrialized economies, especially English-speaking
ones, do not appear to be present in Switzerland to a noteworthy degree. While in
the US, and other countries, to a lesser degree, White non-Hispanics (WNHs), especially
middle-aged, non-college-educated WNHs, have experienced a rise in mortality, dominated
by deaths of despair (liver disease from excessive alcohol consumption, alcohol, and
drug poisoning, suicide), Swiss men (and women) have seen a significant decline of
suicide and liver cirrhosis mortality in middle age (45-64) from 1995 to 2019 (I),
(J), (L) and (M), while the vast majority of people residing in Switzerland are part
of the WNH demographic. When comparing middle-aged people with foreign citizenship
with people with Swiss citizenship within Switzerland, mortality from suicide and
liver cirrhosis appears lower for foreigners. Men are more likely to die of suicide
than women, both in the Swiss and foreigners, which is a concerning trend also observed
in other OECD countries. Liver cirrhosis mortality does not differ significantly between
sexes, but the lower mortality of foreigners might be explained by some foreign cultures
and religions being less tolerant of the consumption of alcohol.Very frequent alcohol
consumption of 2 or more times a day has decreased dramatically in men and women of
all three educational strata assessed from 1992–2007 (K). This contrasts with the
US, where the better educated (at least a Bachelor’s degree) have seen a decrease
in mortality and are less afflicted by alcohol-related deaths, while less educated
WNHs see an increase in alcohol and drug-related deaths. Overall, Switzerland does
not exhibit the concerning trends of the WNH middle-aged demographic (rising suicide
and substance abuse) in other advanced economies, with the US being at the front line.Footnote:
Some of the figures were partially used in an unpublished previous assignment by MMR.
They were created by him using the data cited.
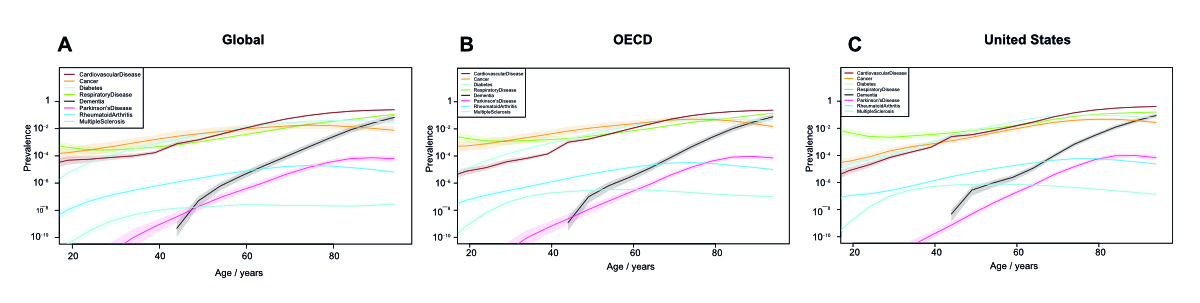
Supplementary figure 3Disease prevalence generally increases with age globally. (A)-(C) Prevalence of cardiovascular
diseases (including ischemic and rheumatic heart disease and stroke), cancers, diabetes,
chronic respiratory diseases (including COPD), dementia, Parkinson’s disease, rheumatoid
arthritis, and multiple sclerosis globally (A), in the OECD average (B) and in the
United States (C) at various ages according to the IHME Global Burden of Disease data.
Prevalence is on a logarithmic scale as YLDs (Years Lived with Disability).
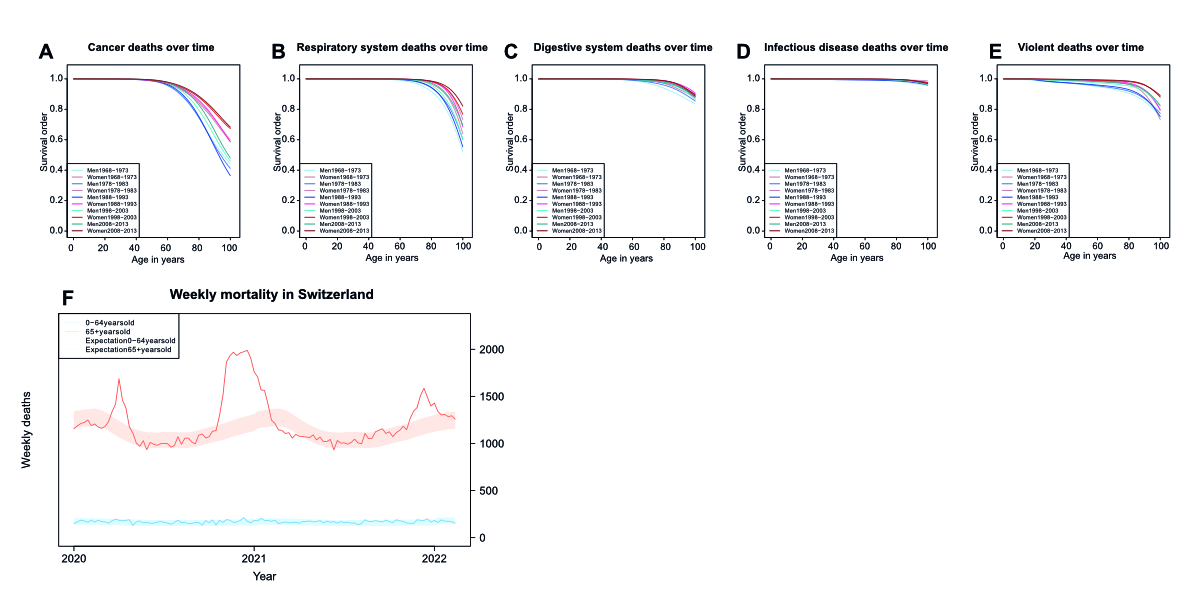
Supplementary figure 4Specific Survival orders for various causes of death over time. Specific survival
order of men and women at different ages in Switzerland with regards to (A) cancer,
(B) respiratory system, (C) digestive system, (D) infectious disease, and (E) violent
(accidents, suicides, homicides) related causes of death during several six-year observational
periods for mortality tables. (F) Weekly mortality in Switzerland during the early
2020s, with the blue line representing mortality at ages 64 and below and the red
line for ages 65 and above. The shaded areas indicate the range of expected weekly
deaths based on previous years as estimated by the Swiss Federal statistical office.
During the waves of COVID infection in spring and winter 2020, and winter 2021, the
mortality exceeded the range of expected values.
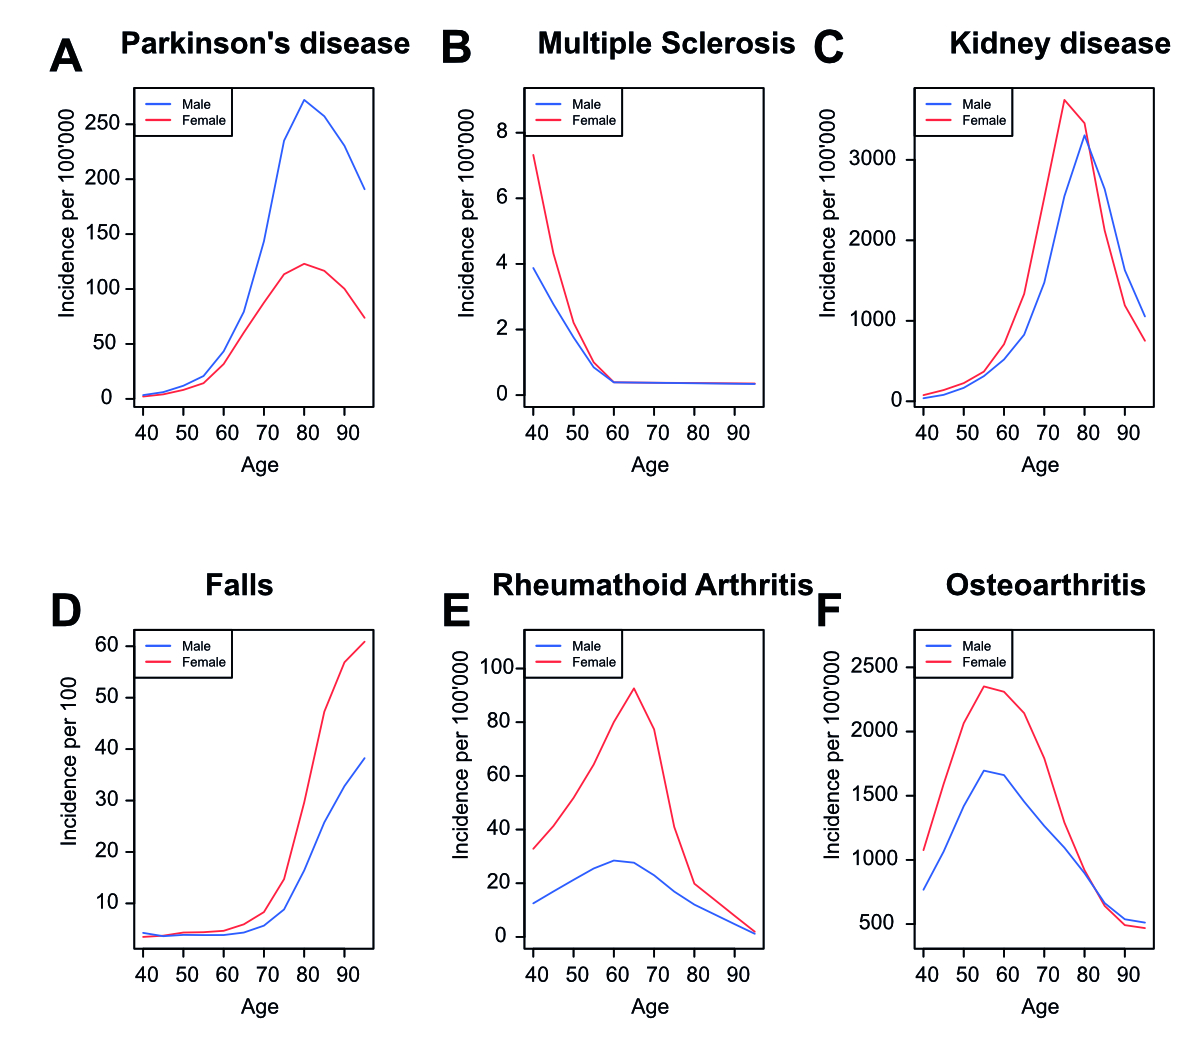
Supplementary figure 5Incidence rates of diseases in Switzerland. Incidence rate of Parkinson’s disease
(A), multiple sclerosis (B), kidney disease (C), injuries from falls (D), rheumatoid
arthritis (E), and osteoarthritis (F) in Switzerland for men and women in Switzerland
during 5-year age ranges according to the IHME Global Burden of Disease data.