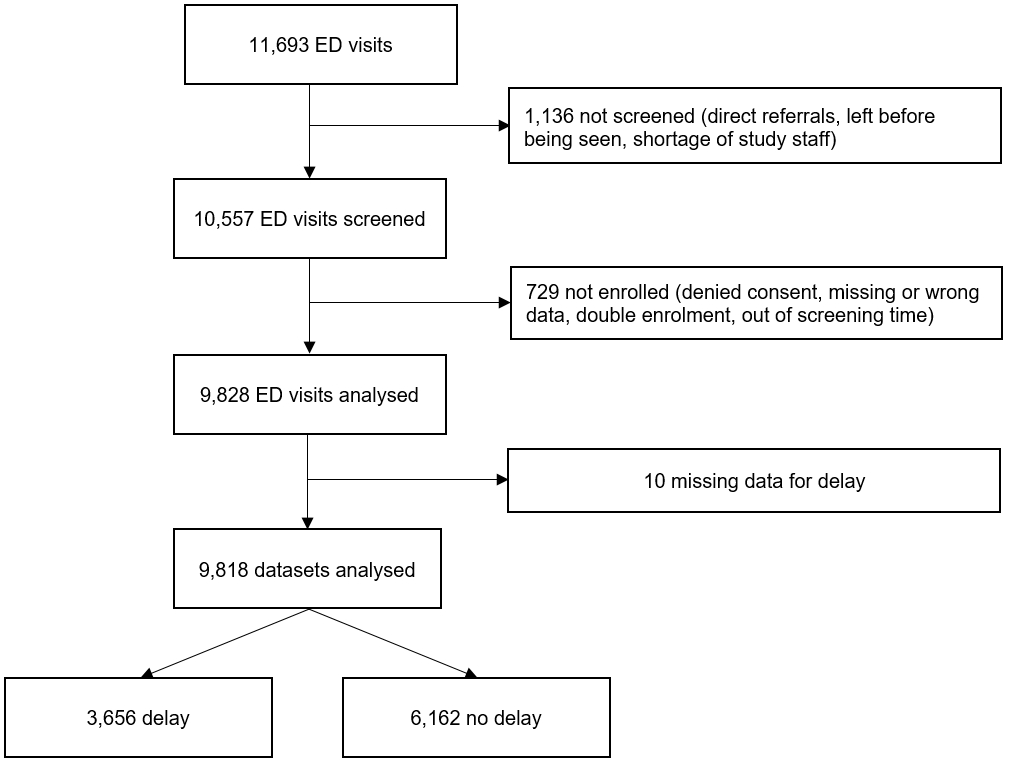
Figure 1Flow chart of the study population. A total of 1875 patients were excluded, leaving a final study population of 9818 ED patients.
DOI: https://doi.org/https://doi.org/10.57187/smw.2023.40084
confidence interval
emergency department
Emergency Severity Index
interquartile range
Odds ratio
standard deviation
Delays during emergency department (ED) work-ups are a major concern in many healthcare systems [1, 2]. The negative impacts on ED caregivers are apparent, as delays lead to increasing throughput times, accumulating patient numbers, crowding, and, ultimately, a near break-down of ED operations, contributing to the depletion of the ED workforce [3]. The major consequences of ED delays among patients are decreasing patient satisfaction, declining quality of care, and increasing complications and, ultimately, mortality [4, 5]. The reasons for delays typically include demographic changes, comorbidity, complexity, and increasing numbers of walk-in patients [6] as well as referred and transferred patients, particularly in tertiary or reference centres [7].
The concept of the Emergency Severity Index (ESI) stipulates that patients should be “streamed” to different locations within the ED [8]. According to the theory of queuing [9], streaming is also pivotal for the reduction of complexity to reduce throughput variance in a single stream while reducing competition between acute/non-acute and complex/non-complex cases [10].
A generic model of ED operations reduces the complexity of all processes to three: input, throughput, and output [11]. Each of these main processes may be modified or improved, but systemic elements, such as patient numbers or hospital beds, are given and render input and output that are difficult to tweak from an ED perspective [12]. Therefore, throughput times are key ED performance indicators and a cornerstone of quality improvement initiatives.
Throughput times depend on patient factors, such as acuity, prognosis, and complexity, as well as unfavourable systemic factors, such as complex protocols, serial instead of parallel processes, and the number of “external resources” used, including clinical chemistry, imaging, or specialist consultations. The increasing public demand for specialized or holistic acute care, call for standardization, and snowballing of “maximum safety” desires will not ease the pressure on ED throughput.
Throughput can be measured as an absolute amount of time between presentation and admission/discharge. However, this interval does not contain much meaningful information on delay, as the demand of individual cases largely determines the respective optimal throughput time. As there is no framework containing all relevant factors (e.g. complaints, acuity, severity, complexity, diagnostic groups, prediction of disposition and outcome) for the determination of optimal throughput time, only expert opinions are useful for adjudication of delay.
Albeit subjective, emergency physician-adjudicated delay is a key performance indicator for ED operations [13]. In this study, we planned to assess the decisions of emergency physicians regarding delays in consecutive patients. The hypotheses of this prospective study were that the causes of delay may be broadly distributed, that vulnerable patients [14, 15] may carry a higher burden of delay, and that cases with delays may experience unfavourable outcomes.
This study aimed to identify parameters available at triage associated with delays during ED work-up, to describe emergency physician-adjudicated reasons for delay, and to assess outcomes in patients with delays.
This prospective observational cohort study investigated patients presenting to the ED of the University Hospital of Basel, an academic centre in Switzerland with a census of over 50,000 visits. Patients were included by a designated study team 24 hours a day 7 days a week (from 30 January 2017 to 19 February 2017 and from 18 March 2019 to 20 May 2019). The data collection was part of a quality-control study (ClinicalTrials.gov Identifier: NCT05400707), and conducted in compliance with the WMA Declaration of Helsinki. Oral consent was obtained and documented. Patients who refused to provide research consent were excluded. The study was conducted in accordance with the STROBE [16] guidelines.
The data collection was approved by the responsible ethics committee (EKNZ-236/13; www.eknz.ch). Oral consent was obtained and documented.
All patients presenting to the ED were eligible. Obstetric and paediatric patients were not included, as they were treated elsewhere. Patients who were unable to be screened, were directly referred to other departments, or left without being seen were also not included. Multiple visits by the same patient were allowed for inclusion.
Input was defined as the number of patients presenting to the ED, including air rescue and ambulance transport. Output was defined as the number of patients admitted (to any hospital bed) or discharged (home or back to nursing home). Throughput was defined as the number of patients undergoing an ED work-up. Throughput time was defined as the interval between presentation (generation of electronic health record [EHR] file) and admission (effective transfer out of the treatment bay) or discharge (time leaving the treatment bay). Patients whose ED work-up was completed, who could be discharged, and who were only waiting for discharge were taken to the ED waiting room. Discharge time stamps were applied when leaving the treatment bay. Delay was adjudicated by a senior physician, the emergency physician in charge. The decision was based on the subjective opinion of the physician regarding delay during ED work-up. Every patient was evaluated individually regarding delay, independently of throughput time, taking a theoretical optimal throughput into account. Emergency physicians were trained regarding the main question “was there a delay during ED work-up?”, and the question was repeatedly discussed at each morning round.
The cause of delay was defined as the main reason for delay, as adjudicated by emergency physicians, and assigned to one of the following pre-defined categories: “resident work-up”, “senior physician availability”, “consultation”, “imaging”, “clinical chemistry”, “exit block”, or “other”. A resident was defined as the junior physician responsible for the ED work-up. Resident work-up was defined as history-taking, physical examination, and other necessities for the generation of a working hypothesis.
Consultation was defined as a request of the emergency physician for a specialist consultation during ED work-up. Imaging was defined as plain radiography, computed tomography, magnetic resonance imaging, or any external ultrasound examination. Clinical chemistry was defined as any test performed by the central laboratory, excluding point-of-care testing.
Exit block was defined as the inability to transfer patients to the assigned hospital beds within an hour after completion of ED work-up, as previously suggested [17].
Acuity was measured using the Emergency Severity Index. The Emergency Severity Index is a five-level triage algorithm used to assess treatment priority based on the severity of illness or injury and expected resource consumption [18].
Impaired mobility on presentation (IMOP) was defined as the lack of a stable independent gait [19].
Reported symptoms and chief complaints were recorded using a pre-defined list of 35 symptoms [20]. Weakness and fatigue were defined as nonspecific complaints [21], chief complaint as the main symptom and reason for visiting the ED, and chief complaint replacement as replacement of the patient-defined chief complaint by the resident (unaware of the recorded chief complaint at presentation) after history-taking [22].
Frailty was defined as a Clinical Frailty Scale (CFS [23]) score of >4.
Hospitalization was defined as admission to the hospital from the ED to any ward, including the geriatric, palliative care, or intensive care unit (ICU). Patients who were admitted to the observation unit in the ED were considered as hospitalized.
The internal factors for delay were either resident work-up or senior physician availability. The external factors were either exit block, consultation, imaging, or clinical chemistry.
The primary outcome was delay adjudicated by the responsible emergency physician. The secondary outcomes were the throughput time; 7-, 100-, and 365-day mortality rates; and admission to the hospital and ICU.
Data collection
At presentation, an electronic health record (ISMed® by Protec-Data, Boswil, Switzerland) containing automatically generated time stamps and baseline data was generated. Patients were triaged according to the Emergency Severity Index and impaired mobility on presentation by registered nurses or emergency physicians, and the CFS score was additionally used among patients aged 65 years and older.
Immediately after triage, the chief complaints, total number of complaints, and additional information (e.g. presentation after trauma) were recorded by a trained study team, personally interviewing patients or proxies.
Immediately after the first physician assessment, the chief complaints and total number of complaints, as documented by the residents, were recorded by the study team.
At discharge/admission, another time stamp was recorded automatically, and the responsible emergency physicians (senior physicians) were interviewed by the study team. Adjudication of delay and causes of delays were recorded according to the pre-defined categories.
Chart reviews were conducted for patients with throughput times over 30 hours and manually corrected in case of missing electronic exit time stamps.
Follow-ups at 30, 100, and 365 days were performed via standardized telephone interviews with patients, proxies, or family physicians. In case of unavailability, the electronic health record, insurance data, or registration offices of the residents were consulted for further information. Patients lost to 365-day follow-up were not excluded from the calculations.
All data were recorded on machine-readable case report forms with unique patient IDs. In a two-step process, the scanned forms were cleaned: first by the ED administrators, who checked the forms for handwriting issues and unexplainable data (e.g. blood pressure of 500 mmHg), and second by an external company (Swiss Post®), which was responsible for transferring the data to the electronic database. With the unique patient ID, all other data from the electronic health record of the patients were transferred to the database.
For descriptive statistics, categorical variables were shown as counts and frequencies and metric variables as means with standard deviations. Variable comparisons for patients with missing data on delays were tested using the Kruskal–Wallis test, the chi-square test, or Fisher’s exact test as appropriate.
Univariable logistic regression analyses for the predictors of delay were performed to calculate odds ratios (ORs), 95% confidence intervals (CIs), and p-values. Multivariable logistic regression for mortality outcomes was corrected for age, sex, and acuity (Emergency Severity Index). An Emergency Severity Index of 1 and a CFS score of 1–4 were considered as references for the regression analysis – no delay was expected in this group. Ρ-values of <0.05 were defined as significant.
The R software (version 4.2.2) was used for all analyses.
For inclusion, 10,557 presentations were eligible. A total of 739 presentations were excluded for missing data, denied consent, or double enrolment. The final cohort consisted of 9818 presentations (figure 1).
Figure 1Flow chart of the study population. A total of 1875 patients were excluded, leaving a final study population of 9818 ED patients.
There were no significant differences in sex, age, and the Emergency Severity Index between the patients with missing adjudication (n = 10) and the final cohort (table S1). ((To the authors: table S2 is not mentioned in the text))
The median patient age was 52 (interquartile range: 34–72) years; 4648 (47.3%) patients were women; and an Emergency Severity Index of 3 (n = 4150, 42.3%) was the most common acuity (table 1).
Table 1Patient characteristics.
| n | All | Delay | No delay | SMD | Missing values | |
| n (%) | 9818 | 9818 | 3656 (37.3) | 6162 (62.7) | ||
| Age, mean (SD) | 9818 | 53 (–22) y | 58 (22) y | 51 (21) y | 0.320 | – |
| Female sex, n (%) | 9818 | 4648 (47.3) | 1771 (48.4) | 2877 (46.7) | 0.035 | – |
| ESI, n (%) | 9818 | 0.588 | – | |||
| 1 | 246 (2.5) | 52 (1.4) | 194 (3.1) | |||
| 2 | 2534 (25.8) | 1130 (30.9) | 1404 (22.8) | |||
| 3 | 4150 (42.3) | 1931 (52.8) | 2219 (36.0) | |||
| 4 | 2693 (27.4) | 536 (14.7) | 2157 (35.0) | |||
| 5 | 195 (2.0) | 7 (3.0.2) | 188 (3.1) | |||
| Throughput time, mean (SD) | 9330 | 4 h 45 min (3 h 37 min) | 7 h 57 min (3 h 59 min) | 3 h 24 min (2 h 32 min) | 1.059 | 488 |
| Presentation, n (%) | 9689 | 0.155 | 129 | |||
| Walk-in patients | 8709 (89.9) | 3149 (86.9) | 5560 (91.7) | |||
| Ambulance referred | 980 (10.1) | 475 (13.1) | 505 (8.3) | |||
| Impaired mobility, n (%) | 9672 | 0.245 | 146 | |||
| Impaired mobility on presentation | 2943 (30.4) | 1356 (37.5) | 1587 (26.2) | |||
| MOP | 6729 (69.6) | 2256 (62.5) | 4473 (73.8) | |||
| CFS score, n (%)a | 7186 | 0.152 | 2632 | |||
| 1–4 | 6059 (84.3) | 1977 (80.6) | 4082 (86.2) | |||
| 5–9 | 1127 (15.7) | 476 (19.4) | 651 (13.8) | |||
| Trauma vs no trauma, n (%) | 9738 | 0.058 | 80 | |||
| Trauma | 1027 (10.5) | 342 (9.4) | 685 (11.2) | |||
| No trauma | 8711 (89.5) | 3279 (90.6) | 5432 (88.8) | |||
| Symptoms, n (%) | 9608 | 0.116 | 210 | |||
| Nonspecific complaintsb | 472 (4.9) | 233 (6.5) | 239 (4.0) | |||
| Specific complaints | 9136 (95.1) | 3333 (93.5) | 5803 (96.0) | |||
| Number of symptoms, mean (SD)a | 7298 | 2.1 (1.4) | 2.3 (1.4) | 2.0 (1.3) | 0.236 | 2520 |
| Chief complaint replacement, n (%)a | 7056 | 0.168 | 2762 | |||
| No | 4604 (65.2) | 1430 (59.9) | 3174 (68.0) | |||
| Yes | 2452 (34.8) | 956 (40.1) | 1496 (32.0) | |||
| Imaging, n (%) | 9818 | 2297 (23.4) | 1248 (34.1) | 1049 (17.0) | 0.400 | – |
| >1 Imaging, n (%) | 922 (9.4) | 533 (15.1) | 369 (6.0) | 0.301 | ||
| Consultation, n (%) | 9818 | 3134 (31.9) | 1649 (45.1) | 1485 (24.1) | 0.453 | – |
| >1 Consultation, n (%) | 127 (1.3) | 86 (2.4) | 41 (0.7) | 0.301 | ||
| Consultation and imaging, n (%) | 9818 | 1017 (10.4) | 633 (17.3) | 384 (6.2) | 0.349 | – |
Data are shown as means and SDs for continuous variables and as numbers and percentages for categorical variables. The population analyzed (n) varied owing to different availability of values.
SD: standard deviation, SMD: standard mean deviation, ESI: Emergency Severity Index, CFS: Clinical Frailty Scale
a Only assessed during data collection from March to May 2019
b Nonspecific complaints defined as weakness and fatigue
A total of 3658 (37.3%) patients were adjudicated with delays (table 1). The patients with delays were older (mean age: 58 vs 51 years) and more likely had an Emergency Severity Index of 2 or 3 than those without delays. The mean throughput time was 4 hours 45 minutes longer in the patients with delays than in those without delays (7 hours 57 minutes vs 3 hours 24 minutes). The patient with delays more likely had impaired mobility (37.5% vs 26.2%), nonspecific complaints (6.5% vs 4.0%), and frailty (19.4% vs 13.8%) than those without delays. Chief complaint replacement was identified more often (40.1% vs 32.0%), and imaging and consultations were more frequently requested in the patients with delays than in those without delays.
The main adjudicated causes of delay were resident work-up (20.4%), consultations (20.2%), and imaging (19.4%) (table 2).
Table 2Causes of delay (total delays, n = 3656).
| Resident work-up | 745 (20.4%) |
| Specialist consultation | 739 (20.2%) |
| Imaging | 709 (19.4%) |
| Other | 514 (14.0%) |
| Clinical chemistry | 257 (7.0%) |
| Senior physician availability | 361 (9.9%) |
| Exit block | 310 (8.5%) |
| NA | 21 (0.6%) |
An Emergency Severity Index of 2 and 3, impaired mobility, nonspecific complaints, and frailty were predictive of delays (table 3).
Table 3Predictors of delay: univariable logistic regression.
| Delay | |||
| OR | 95% CI | ||
| Age, per 10 years | 1.16 | 1.14–1.18 | |
| Female sex | 1.07* | 0.99–1.16 | |
| ESI | 1 | Reference | Reference |
| 2 | 3.00 | 2.21–4.16 | |
| 3 | 3.25 | 2.40–4.48 | |
| 4 | 0.93* | 0.68–1.29 | |
| 5 | 0.14 | 0.06–0.29 | |
| Presentation, ambulance referred | 1.66 | 1.45–1.90 | |
| Impaired mobility on presentation | 1.69 | 1.55–1.85 | |
| CFS scorea | 1–4 | Reference | Reference |
| 5–9 | 1.51 | 1.33–1.72 | |
| Trauma | 0.83 | 0.72–0.95 | |
| Nonspecific complaints | 1.70 | 1.41–2.04 | |
| Chief complaint replacementa | 1.42 | 1.28–1.57 | |
| Number of symptomsa | 1.18 | 1.14–1.23 | |
| Imaging | 2.81 | 2.57–3.06 | |
| Consultation | 2.59 | 2.37–2.83 | |
| Consultation and imaging | 2.89 | 2.62–3.19 | |
The table contains the results of the univariable regression for delay, including the following variables: age (per decade), sex, Emergency Severity Index, presentation, impaired mobility on presentation, CFS score, trauma, nonspecific complaints, chief complaint replacement, number of symptoms, imaging, consultation, and consultation and imaging. An Emergency Severity Index of 1 and a CFS score of 1–4 were used as the reference category – no delay was expected in this group. All ORs are adjusted for age and sex.
OR: odds ratio, CI: confidence interval, ESI: Emergency Severity Index, CFS: Clinical Frailty Scale
a Only assessed during data collection from March to May 2019
* No statistical significance
Of 3447 admitted patients, 49.5% were affected by delays. The 7-day mortality rate was higher in the patients without delays than in those with delays; meanwhile, the 100- and 365-day mortality rates were higher in the patients with delays than in those without delays (table 4).
Table 4Outcomes of patients with delay (n = 9818).
| n | All patients | Delay | No delay | |
| 7-day mortality, n (%) | 9552 | |||
| Dead | 110 (1.2) | 33 (0.9) | 77 (1.3) | |
| Alive | 9442 (98.8) | 3532 (99.1) | 5910 (98.7) | |
| 100-day mortality, n (%) | 9529 | |||
| Dead | 376 (3.9) | 159 (4.5) | 217 (3.6) | |
| Alive | 9153 (96.1) | 3397 (95.5) | 5756 (96.4) | |
| 365-day mortality, n (%) | 9514 | |||
| Dead | 685 (7.2) | 295 (8.3) | 390 (6.5) | |
| Alive | 8829 (92.8) | 3258 (91.7) | 5571 (93.5) | |
| In-hospital mortality, n (%) | 9818 | |||
| Dead | 123 (1.3) | 44 (1.2) | 79 (1.3) | |
| Alive | 9695 (98.7) | 3612 (98.8) | 6083 (98.7) | |
| Admission to hospital, n (%) | 9818 | |||
| Admission | 3447 (35.1) | 1705 (46.6) | 1742 (28.3) | |
| No admission | 6371 (64.9) | 1951 (53.4) | 4420 (71.7) | |
| Admission to ICU, n (%) | 9818 | |||
| Admission | 493 (5.0) | 143 (3.9) | 350 (5.7) | |
| No admission | 9325 (95.0) | 3513 (96.1) | 5812 (94.3) |
The population analyzed (n) varied owing to different availability of values.ICU: intensive care unit. Data are shown as numbers and percentages for categorical variables.
Delay corrected for age, sex, and acuity (Emergency Severity Index) was associated with a higher likelihood of admission and a lower likelihood of intensive care (table 5). Mortality was not significantly associated with delay. The patients with a throughput time of 8–12 hours had higher odds of having 100- and 365-day mortalities (OR: 1.69, CI: 1.21–2.34; p = 0.002; OR: 1.55, CI: 1.19–2.01, p < 0.001).
Table 5Multivariable logistic regression analysis for the association of delay with admission and mortality
| Admission to hospital | Admission to ICU | In-hospital mortality | 7-day mortality | 100-day mortality | 365-day mortality | ||||||||
| OR | 95% CI | OR | 95% CI | OR | 95% CI | OR | 95% CI | OR | 95% CI | OR | 95% CI | ||
| Age | 1.04 | 1.04–1.04 | 1.02 | 1.03–1.04 | 1.06 | 1.05–1.08 | 1.08 | 1.06–1.10 | 1.07 | 1.06–1.08 | 1.07 | 1.07–1.08 | |
| Female sex | 0.89 | 0.81–1.0 | 0.57 | 0.46–0.70 | 0.47 | 0.30–0.65 | 0.80* | 0.53–1.20 | 0.65 | 0.52–0.82 | 0.67 | 0.57–0.80 | |
| ESI | |||||||||||||
| 1 | Ref. | – | Ref. | – | Ref. | – | Ref. | – | Ref. | – | Ref. | - | |
| 2 | 0.10 | 0.06–0.17 | 0.10 | 0.08–0.14 | 0.08 | 0.05–0.13 | 0.10 | 0.06–0.16 | 0.19 | 0.13–0.27 | 0.27 | 0.19–0.38 | |
| 3 | 0.04 | 0.03–0.07 | 0.03 | 0.18–0.03 | 0.04 | 0.03–0.07 | 0.04 | 0.00–0.06 | 0.15 | 0.10–0.22 | 0.24 | 0.17-0.34 | |
| 4 | 0.01 | 0.00–0.01 | 0.0 | 0.00–0.01 | 0.00 | 0.00–0.02 | 0.00 | 0.00–0.02 | 0.04 | 0.02–0.07 | 0.09 | 0.06–0.14 | |
| 5 | 0.00 | 0.00–0.00 | ** | ** | ** | ** | ** | ** | 0.04 | 0.00–0.21 | 0.07 | 0.01–0.22 | |
| Delay | 1.56 | 1.41–1.73 | 0.56 | 0.44–0.67 | 0.89* | 0.59–1.32 | 0.65* | 0.41–1.00 | 0.91* | 0.73–1.14 | 0.89* | 0.75–1.06 | |
The table contains the results of the multivariable regression for admission and mortality outcomes, including the following variables: age (per year), sex, ESI, and delay. An ESI of 1 was used as the reference category – no delay was expected in this group. The ORs for the ESI and delay are adjusted for age, sex, and the ESI.
OR: odds ratio, CI: confidence interval, ESI: Emergency Severity Index* No statistical significance
** Since no event occurred, testing was not applicable.
The main results of this prospective study are that the causes of ED delay were broadly distributed, that the vulnerable patient groups carried a higher risk for delay, and that the patients with delays did not experience unfavourable outcomes, apart from a higher rate of hospitalization. In detail, delays were adjudicated in 37% of all ED patients. The patients with the highest odds for delays were triaged as having an Emergency Severity Index of 2 or 3 and had imaging or consultations by specialists. Frugal predictors of delays such as older age, nonspecific complaints, frailty, and immobilization may point to a throughput problem in vulnerable populations. The reasons for this finding remain unclear, as both patient and physician factors may be involved. Certain patient factors (vulnerability) may support the hypothesis that case complexity could be responsible for slow throughput. Meanwhile, physicians may de-prioritize older and frail patients with “difficult symptoms”, such as weakness or fatigue [24, 25]. It is under debate whether such symptoms can be considered predictors of serious outcomes [24–26]. The triage literature does not offer clear statements on nonspecific complaints and the necessity to up-triage, but a recent review has suggested that nonspecific complaints are still not gaining the attention they deserve [27]. Physician factors may include “ageism” (a prejudice against older patients in the ED [28]), uncertainty about the work-up [29], or the traditional “wait-and-see” strategy for frail older patients [30].
Other factors include the number of symptoms and the phenomenon of complaint replacement. While it is understandable that patients with a high number of symptoms at triage may take more time, it is a rather new finding that the chief complaints are often replaced by treating physicians. In both cases, patients have a higher use of resources and rate of admission [20, 22]. As our study was a hypothesis-generating venture, the case complexity could only be speculated to contribute to these findings. Meanwhile, patients who experience trauma have a decreased risk of delay, as their process may be more linear, highly standardized, and handled with greater routine.
Herein, delays were associated with hospitalization, but it remains unclear whether the decision to hospitalize could be a factor of slow throughput, or whether prolonged throughput may influence emergency physicians to hospitalize patients. Mortality was not associated with emergency physician-adjudicated delays but with throughput times of 8–12 hours. This association has also been previously reported [31] (see table S2).
It seems important to gather knowledge on the associations of patient-, physician-, and system-related factors with delays, as this may help to increase patient safety and improve patient experience. Older and frailer patients should not be subjected to slow work-up, as their risk of delirium may increase with every hour spent in the ED. Meanwhile, normal mobility at triage helps to identify patients with a low risk for mortality. This finding could prevent unnecessary hospitalizations and their associated complications [32].
The reasons for delays may be divided into external reasons, such as imaging and consultations (40%), and internal reasons, such as time constraints of residents (20%). ED operations, transfers, or exit blocks are probably the most discussed issues [31], but exit blocks are adjudicated only in a small minority. Therefore, throughput delays for internal reasons should be paid more attention. Aggressive work-up or treatment aimed at avoiding unnecessary admission [33] may contribute to throughput delays. Early disposition decisions [30] may help to decide whether admission can realistically be avoided. If hospitalization is not preventable in older, frail, and immobile patients, the use of external resources should be limited, as delays in throughput without change in outcome are likely.
Future research on interventions for improvement of patient flow should focus on the adequacy of external resources used and on internal processes, such as adequate staffing and flagging of patients at risk of delay.
This study was conducted in a single academic tertiary care centre in Switzerland. Therefore, the external validity of the results may be limited. Furthermore, we focused on patient factors and did not analyze physician factors such as years of experience, number of attended patients, or subjective competence, as well as availability, accessibility, and quality of primary care, which may well be among the predictors of delay. The CFS score, number of symptoms, and chief complaint replacement data were collected only in the 2019 cohort; nevertheless, this cohort comprised the vast majority of all patients included. Other possible confounders, such as comorbidity, the number of patients in the ED, occupied ED rooms, and other data to measure crowding, were not recorded owing to resource constrains. Therefore, these factors could neither be considered as potential confounders in the analysis nor used to analyze heterogeneity of the two groups. As this study was conducted before the COVID-19 pandemic, the lack of ward nursing was not an issue at the time of the study.
The Hawthorne effect, describing changes in behaviour owing to awareness of individuals being observed, could also be attributed to a possible bias. The interviews on delays and possible reasons may have reduced the availability of senior physicians and may therefore have contributed to delays. Further, delays were adjudicated by one emergency physician in charge. Therefore, no interrater reliability could be assessed.
Finally, re-presentations were not excluded. However, this concerned a small minority of all patients.
At triage, simple predictors such as age, immobility, nonspecific complaints, and frailty may help to identify patients at risk of delay during ED work-up. The main reasons for delays are resident work-up, imaging, and consultations. This hypothesis-generating observation will allow the design of studies aimed at the identification and elimination of possible throughput obstacles.
Data cannot be shared without written consent of the local ethics committee. Requests for data sharing will be forwarded to the ethics committee. If the request is granted, data can be shared in fully anonymized form.
We would like to thank Artur Stickel and Klaus Baumgartl for their valuable support with data science; the Department of Clinical Research University of Basel for their statistical advice; Monika Stadler and the ED staff for their contribution to the study; and the participants for their participation in the study.
Authors' contributions: Conceptualization, R.B. and C.H.N.; Formal analysis, I.A. and J.B.; Methodology, I.A., C.H.N. and R.B.; Project administration, R.B.; Supervision, R.B. and C.H.N; Writing—original draft, I.A., L.T., C.H.N. and R.B.; All authors have read and agreed to the published version of the manuscript.
Scientific funds from the University Hospital of Basel.
All authors have completed and submitted the International Committee of Medical Journal Editors form for disclosure of potential conflicts of interest. Prof. Bingisser and Prof. Nickel report being editors of medStandards.com. No other potential conflict of interest was disclosed.
1. Guttmann A, Schull MJ, Vermeulen MJ, Stukel TA. Association between waiting times and short term mortality and hospital admission after departure from emergency department: population based cohort study from Ontario, Canada. BMJ. 2011 Jun; jun01 1:d2983. 10.1136/bmj.d2983
2. Di Somma S, Paladino L, Vaughan L, Lalle I, Magrini L, Magnanti M. Overcrowding in emergency department: an international issue. Intern Emerg Med. 2015 Mar;10(2):171–5. 10.1007/s11739-014-1154-8
3. Camille Stromboni GR. A growing crisis in French emergency rooms. Le Monde. 2022.
4. Shetty A, Gunja N, Byth K, Vukasovic M. Senior Streaming Assessment Further Evaluation after Triage zone: a novel model of care encompassing various emergency department throughput measures. Emerg Med Australas. 2012 Aug;24(4):374–82. 10.1111/j.1742-6723.2012.01550.x
5. Forero R, McCarthy S, Hillman K. Access Block and Emergency Department Overcrowding. In: Vincent JL, editor. Annual Update in Intensive Care and Emergency Medicine 2011. Berlin, Heidelberg: Springer Berlin Heidelberg; 2011. pp. 720–8. 10.1007/978-3-642-18081-1_63
6. Carter EJ, Pouch SM, Larson EL. The relationship between emergency department crowding and patient outcomes: a systematic review. J Nurs Scholarsh. 2014 Mar;46(2):106–15. 10.1111/jnu.12055
7. Chaou CH, Chen HH, Chang SH, Tang P, Pan SL, Yen AM, et al. Predicting Length of Stay among Patients Discharged from the Emergency Department-Using an Accelerated Failure Time Model. PLoS One. 2017 Jan;12(1)e0165756. 10.1371/journal.pone.0165756
8. Grossmann FF, Nickel CH, Christ M, Schneider K, Spirig R, Bingisser R. Transporting clinical tools to new settings: cultural adaptation and validation of the Emergency Severity Index in German. Ann Emerg Med. 2011 Mar;57(3)257–64. 10.1016/j.annemergmed.2010.07.021
9. Sundarapandian V. Probability, Statistics and Queing Theory: PHI Learning; 2009.
10. Hall R. Patient Flow. Second Edition ed2013. 547 p. 10.1007/978-1-4614-9512-3
11. Steward D, Glass TF, Ferrand YB. Simulation-Based Design of ED Operations with Care Streams to Optimize Care Delivery and Reduce Length of Stay in the Emergency Department. J Med Syst. 2017 Sep;41(10):162. 10.1007/s10916-017-0804-6
12. Bingisser R, Nickel CH. The last decade of symptom-oriented research in emergency medicine: triage, work-up, and disposition. Swiss Med Wkly. 2019 Oct;:w20141. 10.4414/smw.2019.20141
13. Medicine TRCoE. Improving Quality Indicators and System Metrics for Emergency Departments in England. 2019.
14. Calf AH, Lubbers S, van den Berg AA, van den Berg E, Jansen CJ, van Munster BC, et al. Clinical impression for identification of vulnerable older patients in the emergency department. Eur J Emerg Med. 2020 Apr;27(2):137–41. 10.1097/MEJ.0000000000000632
15. Grossmann FF, Zumbrunn T, Ciprian S, Stephan FP, Woy N, Bingisser R, et al. Undertriage in older emergency department patients—tilting against windmills? PLoS One. 2014 Aug;9(8)e106203. 10.1371/journal.pone.0106203
16. Vandenbroucke JP, von Elm E, Altman DG, Gøtzsche PC, Mulrow CD, Pocock SJ, et al.; STROBE Initiative. Strengthening the Reporting of Observational Studies in Epidemiology (STROBE): explanation and elaboration. Epidemiology. 2007 Nov:805–35. 10.1097/EDE.0b013e3181577511
17. Mason S, Knowles E, Boyle A. Exit block in emergency departments: a rapid evidence review. Emerg Med J. 2017 Jan;34(1):46–51. 10.1136/emermed-2015-205201
18. Fernandes CM, Tanabe P, Gilboy N, Johnson LA, McNair RS, Rosenau AM, et al. Five-level triage: a report from the ACEP/ENA Five-level Triage Task Force. J Emerg Nurs. 2005 :39–50. 10.1016/j.jen.2004.11.002
19. Kellett J, Clifford M, Ridley A, Murray A, Gleeson M. A four item scale based on gait for the immediate global assessment of acutely ill medical patients– one look is more than 1000 words. Eur Geriatr Med. 2014;5(2):92–6. 10.1016/j.eurger.2013.11.011
20. Weigel K, Nickel CH, Malinovska A, Bingisser R. Symptoms at presentation to the emergency department: predicting outcomes and changing clinical practice? Int J Clin Pract. 2018 72(1):e13033. 10.1111/ijcp.13033
21. Nemec M, Koller MT, Nickel CH, Maile S, Winterhalder C, Karrer C, et al. Patients presenting to the emergency department with non-specific complaints: the Basel Non-specific Complaints (BANC) study. Acad Emerg Med. 2010 Mar;17(3):284–92. 10.1111/j.1553-2712.2009.00658.x
22. Rueegg M, Nickel CH, Bingisser R. Disagreements between emergency patients and physicians regarding chief complaint - Patient factors and prognostic implications. Int J Clin Pract. 2021 May;75(5):e14070. 10.1111/ijcp.14070
23. Rockwood K, Song X, MacKnight C, Bergman H, Hogan DB, McDowell I, et al. A global clinical measure of fitness and frailty in elderly people. CMAJ. 2005 Aug;173(5):489–95. 10.1503/cmaj.050051
24. Kuster T, Nickel CH, Jenny MA, Blaschke LL, Bingisser R. Combinations of Symptoms in Emergency Presentations: prevalence and Outcome. J Clin Med. 2019 Mar;8(3):345. 10.3390/jcm8030345
25. Jenny MA, Hertwig R, Ackermann S, Messmer AS, Karakoumis J, Nickel CH, et al. Are Mortality and Acute Morbidity in Patients Presenting With Nonspecific Complaints Predictable Using Routine Variables? Acad Emerg Med. 2015 Oct;22(10):1155–63. 10.1111/acem.12755
26. Herzog SM, Jenny MA, Nickel CH, Nieves Ortega R, Bingisser R. Emergency department patients with weakness or fatigue: can physicians predict their outcomes at the front door? A prospective observational study. PLoS One. 2020 Nov;15(11):e0239902. 10.1371/journal.pone.0239902
27. Kemp K, Mertanen R, Lääperi M, Niemi-Murola L, Lehtonen L, Castren M. Nonspecific complaints in the emergency department - a systematic review. Scand J Trauma Resusc Emerg Med. 2020 Jan;28(1):6. 10.1186/s13049-020-0699-y
28. Oliver D. ‘Acopia’ and ‘social admission’ are not diagnoses: why older people deserve better. J R Soc Med. 2008 Apr;101(4):168–74. 10.1258/jrsm.2008.080017
29. Rohacek M, Nickel CH, Dietrich M, Bingisser R. Clinical intuition ratings are associated with morbidity and hospitalisation. Int J Clin Pract. 2015 Jun;69(6):710–7. 10.1111/ijcp.12606
30. Misch F, Messmer AS, Nickel CH, Gujan M, Graber A, Blume K, et al. Impact of observation on disposition of elderly patients presenting to emergency departments with non-specific complaints. PLoS One. 2014 May;9(5):e98097. 10.1371/journal.pone.0098097
31. Jones S, Moulton C, Swift S, Molyneux P, Black S, Mason N, et al. Association between delays to patient admission from the emergency department and all-cause 30-day mortality. Emerg Med J. 2022 Mar;39(3):168–73. 10.1136/emermed-2021-211572
32. Nieves-Ortega R, Brabrand M, Dutilh G, Kellett J, Bingisser R, Nickel CH. Assessment of patient mobility improves the risk stratification of triage with the Emergency Severity Index: a prospective cohort study. Eur J Emerg Med. 2021 Dec;28(6):456–62. 10.1097/MEJ.0000000000000845
33. Fatovich DM, Hirsch RL. Entry overload, emergency department overcrowding, and ambulance bypass. Emerg Med J. 2003 Sep;20(5):406–9. 10.1136/emj.20.5.406
Table S1Comparison of excluded patients because of missing information on delay with the study population.
| Variable | Study population | Population with missing data on delay | p-values |
| n (%) | 9818 | 10 | |
| Age, median (IQR) | 52 (34–72) y | 72.5 (36–79) y | 0.44 |
| Female sex, n (%) | 4648 (47.3) | 4 (40) | 0.76 |
| ESI | 0.46 | ||
| 1, n (%) | 246 (2.5) | 0 (0) | |
| 2, n (%) | 2534 (25.8) | 5 (50.0) | |
| 3, n (%) | 4150 (42.3) | 4 (40.0) | |
| 4, n (%) | 2693 (27.4) | 1 (10.0) | |
| 5, n (%) | 195 (2.0) | 0 |
IQR: interquartile range, ESI: Emergency Severity Index
Table S2Comparison of patient groups according to the length of stay in the emergency department.
| n | All | LOS of <8 h | LOS of 8–12 h | LOS of >12 h | SMD | Missing values | |
| n (%) | 9330 | 8192 | 792 | 346 | – | ||
| Age, mean (SD) | 9330 | 54 (–22) y | 52 (22) y | 64 (20) y | 62 (22) y | 0.367 | – |
| Female sex, n (%) | 9330 | 4387 (47.0) | 3841 (46.9) | 387 (48.9) | 159 (46.0) | 0.039 | – |
| Delay, n (%) | 9330 | 3560 (38.2) | 2597 (31.7) | 675 (85.2) | 288 (83.2) | 0.857 | – |
| ESI, n (%) | 9330 | – | |||||
| 1 | 205 (2.2) | 182 (2.2) | 16 (2.0) | 7 (2.0) | |||
| 2 | 2465 (26.4) | 2063 (25.2) | 283 (35.7) | 119 (34.4) | |||
| 3 | 4021 (43.1) | 3390 (41.1) | 437 (55.2) | 194 (56.1) | |||
| 4 | 2453 (26.3) | 2372 (29.0) | 56 (7.1) | 25 (7.2) | |||
| 5 | 186 (2.0) | 185 (2.3) | 0 | 1 (0.3) | |||
| Throughput time, mean (SD) | 9330 | 4 h 45 min (3 h 37 min) | 3 h 45 min (1 h 52 min) | 9 h 28 min (1 h 4 min) | 17 h 35 min (5 h 15 min) | 3.126 | – |
| Presentation, n (%) | 9201 | 0.293 | 129 | ||||
| Walk-in patients | 8323 (90.5) | 7383 (91.5) | 680 (86.7) | 260 (75.6) | |||
| Ambulance referred | 878 (9.5) | 690 (8.5) | 104 (13.3) | 84 (24.4) | |||
| Impaired mobility, n (%) | 9184 | 0.383 | 146 | ||||
| Impaired mobility on presentation | 2806 (30.6) | 2244 (27.8) | 372 (52.3) | 190 (55.2) | |||
| MOP | 6378 (69.4) | 5816 (72.2) | 408 (47.7) | 154 (44.8) | |||
| CFS score, n (%)a | 7170 | 0.270 | 2160 | ||||
| 1–4 | 6046 (84.3) | 5485 (86.1) | 405 (69.6) | 156 (72.2) | |||
| 5–9 | 1124 (15.7) | 887 (13.9) | 177 (30.4) | 60 (27.8) | |||
| Trauma vs no trauma, n (%) | 9269 | 0.165 | 61 | ||||
| Trauma | 984 (10.6) | 929 (11.4) | 39 (5.0) | 16 (4.7) | |||
| No trauma | 8285 (89.4) | 7218 (88.6) | 744 (95.0) | 323 (95.3) | |||
| Symptoms, n (%) | 9139 | 0.199 | 191 | ||||
| Nonspecific complaintsb | 414 (4.5) | 310 (3.9) | 65 (8.4) | 39 (11.7) | |||
| Specific complaints | 8725 (95.5) | 7725 (96.1) | 706 (91.6) | 294 (88.3) | |||
| Number of symptoms, mean (SD)a | 7279 | 2.1 (1.4) | 2.0 (1.4) | 2.4 (1.4) | 2.4 (1.4) | 0.193 | 2051 |
| Chief complaint replacement, n (%)a | 7040 | 0.098 | 2290 | ||||
| No | 2449 (34.8) | 2137 (34.1) | 225 (39.6) | 87 (41.2) | |||
| Yes | 4591 (65.2) | 4124 (65.9) | 343 (60.4) | 124 (58.8) | |||
| Imaging, n (%) | 9330 | 5472 (58.6) | 4540 (55.4) | 662 (83.6) | 270 (78.0) | 0.426 | – |
| >1 imaging, n (%) | 2233 (23.9) | 1714 (20.9) | 363 (45.8) | 156 (45.1) | 0.365 | ||
| Consultation, n (%) | 9330 | 3037 (32.6) | 2406 (29.4) | 43 (55.3) | 193 (55.8) | 0.369 | – |
| >1 consultation, n (%) | 25 (0.3) | 16 (0.2) | 6 (0.8) | 3 (0.9) | 0.062 | – | |
| Consultation and imaging, n (%) | 9330 | 1195 (12.8) | 855 (10.4) | 242 (30.6) | 98 (28.3) | 0.343 | – |
Data are shown as means and SDs for continuous variables and as numbers and percentages for categorical variables. The population analyzed (n) varied owing to different availability of values.
SD: standard deviation, SMD: standard mean deviation, ESI: Emergency Severity Index, CFS: Clinical Frailty Scale, LOS: length of stayNonspecific complaints defined as weakness and fatigue Only assessed during data collection from March to May 2019 Nonspecific complaints defined as weakness and fatigue
a Only assessed during data collection from March to May 2019
b Nonspecific complaints defined as weakness and fatigue
Attached base packages: stats, graphics, grDevices utils, datasets methods base
Other attached packages: lubridate_1.9.2, chron_2.3-59, pROC_1.18.0, survival_3.4-0, ranger_0.14.1, survminer_0.4.9, ggpubr_0.6.0, ggplot2_3.4.1, questionr_0.7.8, tableone_0.13.2, magrittr_2.0.3, dplyr_1.1.0
Loaded via namespace (ant not attached): Rcpp_1.0.10, lattice_0.20-45, tidyr_1.3.0, class_7.3-20, zoo_1.8-11, digest_0.6.31, utf8_1.2.3, mime_0.12, R6_2.5.1, plyr_1.8.8, backports_1.4.1, labelled_2.10.0, e1071_1.7-13, survey_4.1-1, highr_0.10, pillar_1.8.1, rlang_1.0.6, rstudioapi_0.14, data.table_1.14.8 miniUI_0.1.1.1, car_3.1-1, Matrix_1.5-1, labeling_0.4.2, splines_4.2.2, munsell_0.5.0, proxy_0.4-27, shiny_1.7.4, broom_1.0.3, compiler_4.2.2, httpuv_1.6.9, xfun_0.37, pkgconfig_2.0.3, htmltools_0.5.4, mitools_2.4, tidyselect_1.2.0, tibble_3.1.8, gridExtra_2.3, km.ci_0.5-6, fansi_1.0.4, crayon_1.5.2, withr_2.5.0, later_1.3.0, MASS_7.3-58.1, grid_4.2.2, xtable_1.8-4, gtable_0.3.1, lifecycle_1.0.3, DBI_1.1.3, KMsurv_0.1-5, scales_1.2.1, cli_3.6.0 , carData_3.0-5, farver_2.1.1, ggsignif_0.6.4, promises_1.2.0.1, ellipsis_0.3.2, survMisc_0.5.6, generics_0.1.3, vctrs_0.5.2, tools_4.2.2, forcats_1.0.0, glue_1.6.2, purrr_1.0.1, hms_1.1.2, abind_1.4-5, fastmap_1.1.1, timechange_0.2.0, colorspace_2.1-0, rstatix_0.7.2, knitr_1.42, haven_2.5.2.