Adolescents’ self-reported health status, behaviours and health issues addressed during
routine school doctor consultations in Switzerland: an observational study
DOI: https://doi.org/https://doi.org/10.57187/smw.2023.40078
Yael Rachaminab, Sofia Elena Nerlicha, Levy Jägera, Saskia Maria De Ganic, Olivier Favred, Oliver Senna
a Institute
of Primary Care, University of Zurich and University Hospital Zurich, Zurich,
Switzerland
b Campus
Stiftung Lindenhof Bern (SLB), Bern, Switzerland
c Careum
Center for Health Literacy, Careum Foundation, Zurich, Switzerland
d Department of Child and Adolescent Health, Office of Public Health, Canton of
Zug, Zug, Switzerland
Summary
BACKGROUND: We aimed to investigate the
self-reported health status and behaviours of 7th-grade adolescents,
associations with gender and educational track, as well as health issues
addressed during routine school doctor consultations in Switzerland.
METHODS: Data on health status and behaviours,
specifically general well-being, stimulant and addictive substance use,
bullying/violence, exercise, nutrition and health protection, and puberty/sexuality,
were drawn from routinely collected self-assessment questionnaires from 1076 (of
a total of 1126) students from 14 schools in the Swiss canton of Zug in 2020. Data
on health issues addressed in school doctor consultations were collected by nine
school doctors (for 595 individual consultations). Multilevel logistic
regression analyses were used to investigate the association of gender and educational
track with unfavourable health status or behaviours.
RESULTS: Although 92% (n = 989) of the students
reported being happy or satisfied overall, 21% (n = 215) often or almost always
felt sad, and 5-10% had repeatedly been seriously physically hurt (n = 67),
sexually harassed with words (n = 88) or experienced uncomfortable physical
contact (n = 60). Female gender and a lower educational track were associated
with unfavourable health status. In 90% (n = 533) of the school doctor consultations,
at least one topic of disease prevention or health promotion was addressed, whereby
the topics addressed depended strongly on the individual school doctors.
CONCLUSIONS:
Our findings revealed that unfavourable health status and behaviours were prevalent
among adolescents but the health topics addressed in school doctor
consultations were not tailored to students’ self-reported health issues. A
school-based approach that strengthens adolescents’ health literacy and
provides opportunities for patient-centred counselling
has the potential to improve the current and future health of adolescents and,
ultimately, adults. To realise this potential, it is essential for school
doctors to be sensitised and trained to address students’ health concerns. Emphasis
should be placed on the importance of patient-centred counselling, the high
prevalence of bullying, and gender and educational differences.
Introduction
Adolescence
is an important time for the detection and prevention of health concerns [1–3].
Adolescents are faced with multiple challenges caused by physiological and
social role changes [3]. Unfavourable health behaviours such as substance use
and high-risk sexual behaviour are often initiated during adolescence [3], and 10–20%
of adolescents are estimated to suffer from mental disorders, both globally and
in Switzerland [4, 5]. Such health
problems of adolescents are often not sufficiently recognised [6–8], which
is particularly concerning given the high impact of health in childhood and adolescence
on health in adulthood [1,
2, 9].
School
health services provide an opportunity to prevent potential health issues in
later life by identifying and treating young people who have health problems or
are at risk of developing them [2, 9, 10]. In this regard, for example, it has
been shown that students at schools offering comprehensive psychosocial
assessments report lower levels of depressive symptoms [11]. Importantly, even
when the beneficial effects are small, they may be meaningful at a population
level [9].
In
Switzerland, school health services are federally regulated and organised, that
is, by each canton (region) [12]. In the case of the canton of Zug, in
preparation for the mandatory routine school doctor consultation in the 7th
grade, students fill out a self-assessment questionnaire to reflect on their
health status and health behaviours regarding different health topics under health
prevention and promotion (including well-being, addictive substance use and
bullying). This information is brought along to the school doctor consultation
to serve as a basis for discussion. Through this process, students are
encouraged to reflect on their health status and behaviours and are reminded of
health issues they want to discuss with the school doctor. Moreover, school doctors
can identify the health issues of high priority to the students.
Knowledge
of adolescents’ health status and behaviours as well as health issues addressed
during school doctor consultations is crucial to improve school health services
and other preventive and health-promoting programs. In particular, gender- and education-specific
analyses could promote an understanding of the health differences between girls
and boys as well as adolescents with different socioeconomic backgrounds and
thus may enable the development of specific health prevention and promotion strategies
that ultimately could benefit society as a whole [13].
Therefore,
with this study, we aimed to investigate the self-reported health status and behaviours
of 7th-grade adolescents, associations with gender and educational track,
and health issues addressed during school doctor consultations in the Swiss canton
of Zug.
Methods
Design and setting
This study was
part of an evaluation of the school health service in the 7th grade in
the Swiss canton of Zug, conducted in the school year 2020/2021 (August 2020–July
2021). The school doctor consultation
in the 7th grade (International Standard Classification of Education
(ISCED) 2 = lower secondary education [14]) is the last of three mandatory
routine school doctor consultations in the canton of Zug, with the first taking
place in kindergarten (ISCED 0 = early childhood education [14]) and the second
in 5th grade (ISCED 1 = primary education [14]). The school doctor
consultations are organised by the municipalities and carried out by family
doctors or paediatricians.
The school
health service in the 7th grade includes an in-school “preparation
lesson” with cantonal prevention specialists preceding the school doctor consultation.
The 45-minute preparation lesson includes a brief introduction to health
prevention and promotion topics, as well as a discussion of case studies to
show the students when, how and where they can get help. Furthermore, an
explanation of what happens at the school doctor consultation is provided.
Finally, the students are given 20 minutes to individually complete a self-assessment
questionnaire on several health topics and to transfer results in terms of topic-specific
“scores” onto a separate evaluation sheet (for categorisation, see below). The
self-assessment questionnaire is anonymous, and students are informed about the
confidentiality of both their responses and the school doctor consultation. The
evaluation sheet is meant to serve as a basis for the discussion with the
school doctor (see figure 1 for an illustration of the process). The school
doctor consultation takes place during school hours without the presence of
parents. Besides the conversation on health topics, the school doctors are
advised to assess height and weight, vision, blood pressure and pulse, and
posture and skeleton and check the students’ vaccination status. As board-certified
specialists for primary care/paediatrics, school doctors are allowed to take
measures or refer students to specialists according to usual care.
The local
ethics committee (“Ethikkommission Nordwest- und Zentralschweiz”) waived the
need for ethics approval because the study was part of a quality improvement
project (reference number: Req-2020-00539). The data from students were
collected anonymously by the Department of Child and Adolescent Health of the
canton of Zug as part of a yearly routine assessment. Since the Federal Act on
Research Involving Human Beings does not apply to anonymised health data (Human
Research Act, Art. 2), it was not necessary to obtain the students' informed
consent. No study protocol has been published.
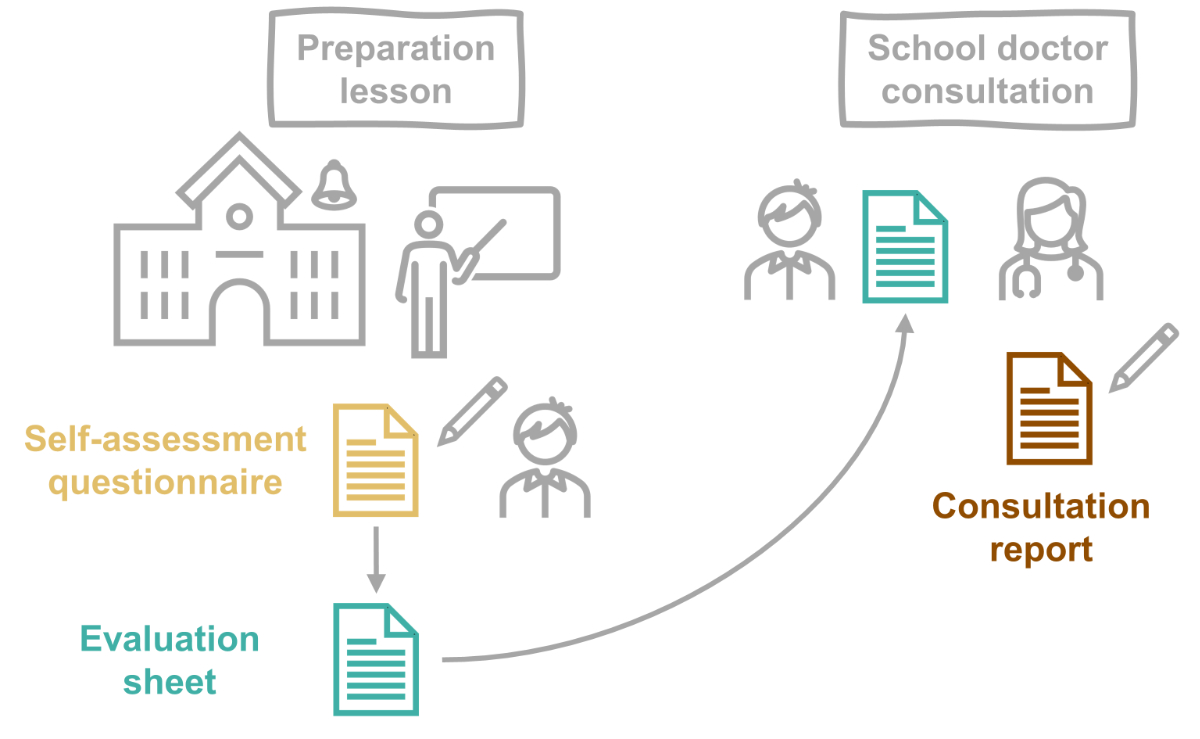
Figure 1Overview of the process. During the preparation lesson, the students fill out a
“self-assessment questionnaire”. The answers are transferred to an “evaluation
sheet” which is brought to the school doctor consultation and serves as a basis
for the conversation. Afterwards, the school doctors tick off the health topics
addressed on the “consultation report”.
Data collection
Two data
sources were used:
- the self-assessment questionnaire,
which was part of the routine preparation for the school doctor consultation;
- a consultation report specifically
designed to evaluate the school health service.
The
self-assessment questionnaire contained 39 questions about the students’ health
status and behaviours under five overarching health topics:
- well-being;
- stimulant and addictive substance
use;
- exclusion, bullying and violence;
- exercise, nutrition and health
protection;
- puberty and sexuality.
The
questionnaire was anonymous (i.e., no student names) but contained information
on the students’ gender (female, male or diverse) and their class, including educational
track and school. In the canton of Zug, lower secondary education comprises
three educational tracks: level A (German: “Kantonsschule”), the highest level,
preparing students for tertiary education; the intermediate level B (German:
“Sekundarschule”), and the lowest level C (German: “Realschule”), which
prepares students for vocational training.
The consultation
report was designed specifically for evaluation purposes to assess the topics
addressed in the school doctor consultation. It was a student-specific sheet
where school doctors ticked off all addressed topics (regarding the overarching
topics mentioned above, plus subtopics). Like the self-assessment
questionnaire, it contained no identifying student information (i.e., names)
but carried information on students’ gender and their class (including educational
track and school).
Both types
of data were originally collected on paper (see supplementary files A and B available
for download at https://doi.org/10.57187/smw.2023.40078) and
subsequently digitalised (to Excel) by a member of the study team (SEN,
consultation report) and by personnel of the Department of Child and Adolescent
Health of the canton of Zug (self-assessment questionnaire).
Categorisation of
health status and behaviours
Each answer
to the (mostly Likert-type) questions on the self-assessment questionnaire was
assigned a pre-determined score, with more unfavourable answers translating to
higher scores. In the preparation lesson, students were asked to calculate the
overall score of each overarching health topic by summing up the individual
scores. These overall scores translated into one of three categories indicating
the degree to which they were unfavourable (“high”, “middle”’ and “low”) and
were transferred by the students to the evaluation sheet, which then served as the
basis for discussion in the school doctor consultation (figure 1).
For this
study, the students’ health status and behaviours were categorised as “unfavourable”
(i.e., concerning or problematic) vs. “favourable” at both the level of the individual question (35 of the 39 questions were analysed) and
the level of the overarching health topic (five
topics overall). For individual questions, this required dichotomizing answers
that were on a 4-point Likert scale, whereas, for overarching health topics, it
entailed combining the categories “middle” and “low”.
Participants
All 7th
grade students in the canton of Zug (n = 1126) and their school doctors (n =
13) were eligible. Of all 1126 approached students, 1085 (96.4%) filled out
the self-assessment questionnaire. Nine students were excluded due to missing information
on class level (n = 7) or gender (n = 2), leaving 1076 (95.8% of the total number
of students) for analysis. Of the 13 approached school doctors, nine filled out
the consultation reports (69.2%). Due to time constraints, one school doctor
filled out the tool for a random sample of 50% of the students only. For each
filled-out tool, school doctors received a reimbursement in the amount of 3 Swiss
francs.
Data analysis
Data were
described using counts (n) and proportions (%) or means and standard
deviations (SDs). Missing rates were reported. For the calculation of students’
(topic-specific) overall scores, missing answers to single questions were
replaced with the mean value (across all students).
To
investigate the association of gender and educational track with health status
and behaviours, for the overarching health topics (overall scores) and all individual
questions combined, multilevel logistic regression analyses were used, adjusted
for the school (random intercept) and with interaction terms between the fixed
effects male/female gender and educational track A/B/C. Significance was
assumed for p <0.05. The correlation between responses to individual
questions was analysed by means of Spearman’s correlation and presented
graphically; significance was assessed with the Spearman rank correlation test.
Data were analysed
using R software version 4.2.0 [15]. The R package lme4 was used to fit
multilevel logistic regression models [16]. To translate calculated effect
sizes from regression analyses with interaction effects into odds ratios (ORs) with
95% confidence intervals (CIs) and p values, the glht() function from
the R package multcomp was used [17].
Results
Study population
We analysed
data on 1076 students from 64 classes in 14 different schools. Of all students,
52.0% identified as female, 47.3% as male and 0.7% as non-binary gender. The
educational track level A contained 29.7% of the students, level B had 46.8%
and level C had 23.4%. The consultation reports covered data from 595 students (49.9%
female, level A: 28.1%, level B: 41.4%, level C: 22.2%, mixed/unassignable educational
track: 8.4%) from 43 classes in 10 different schools. The majority of the
students were 14 years old in the year 2020 (63.5%; 24.0% were 13 years old and
9.4% were 15 years old), and the mean student age was 13.8 years (SD 0.6; with
a mean student age of 13.6 years in educational track level A, 13.8 years in
level B and 14.0 years in level C). The characteristics of the school doctors
are presented in table S1 in the appendix.
Self-reported
health status and behaviours
The proportion
of students with unfavourable health status or behaviours according to the
individual questions, overall as well as by educational track and gender, is
displayed in table 1. The overall score per health topic is shown in figure 2. Generally,
female students and students in educational track levels B and particularly C
had more unfavourable self-reported health status and behaviours than male
students and those in level A (see figure 3 and table S2 in the appendix for the
regression results). The main results within each health topic are presented in
the following paragraphs.
Table 1Proportion of students with unfavourable health status or behaviours, overall
and by educational track and gender.
| Variable |
Overall |
Level
A |
Level
B |
Level
C |
MD |
| |
(n =
1076) |
Female
students(n = 172) |
Male
students(n = 144) |
Female
students(n = 279) |
Male
students(n = 223) |
Female
students(n = 109) |
Male
students(n = 142) |
|
| Well-being |
| Feels not
very or not at all healthy or satisfied |
7.6 (81) |
7.6 (13) |
2.1 (3) |
9.4 (26) |
5.8 (13) |
15.9 (17) |
5.6 (8) |
0.6 |
| Is often
or almost always sad or unhappy |
20.5
(215) |
24.1 (41) |
13.2 (19) |
27.9 (75) |
12.3 (27) |
37.9 (39) |
9.4 (13) |
2.5 |
| Is often
or almost always in pain |
30.9
(317) |
29.6 (47) |
23.0 (32) |
36.5 (97) |
27.2 (59) |
46.6 (48) |
24.3 (33) |
4.7 |
| Can
rarely or never fall asleep easily and sleep through the night |
15.8
(168) |
15.6 (26) |
12.7 (18) |
17.1 (47) |
13.5 (30) |
25.9 (28) |
11.3 (16) |
1.3 |
| Can rarely
or never motivate themselves for school and studying |
21.5
(226) |
14.2 (24) |
23.6 (33) |
17.8 (49) |
23.3 (51) |
31.1 (33) |
25.4 (35) |
2.2 |
| Is not
very or not at all satisfied with their appearance |
20.3
(210) |
26.3 (44) |
9.4 (13) |
30.4 (80) |
11.4 (25) |
32.7 (33) |
10.6 (15) |
3.8 |
| Would
change something about their appearance if it were possible |
46.5
(496) |
54.7 (93) |
37.3 (53) |
60.2
(165) |
35.4 (79) |
54.6 (59) |
30.3 (43) |
0.9 |
| Stimulants
and addictive substances |
| Has
consumed (from time to time or regularly): |
…
cigarettes |
2.2 (24) |
0.0 (0) |
0.7 (1) |
2.2 (6) |
1.8 (4) |
4.6 (5) |
5.7 (8) |
0.5 |
| …
e-cigarettes/e-shisha |
3.3 (35) |
0.0 (0) |
4.2 (6) |
2.5 (7) |
2.3 (5) |
6.5 (7) |
7.1 (10) |
0.6 |
| … snus or
shisha |
3.0 (32) |
0.0 (0) |
2.8 (4) |
2.2 (6) |
1.8 (4) |
9.3 (10) |
5.9 (8) |
1.6 |
| … marijuana |
0.8 (9) |
0.6 (1) |
2.1 (3) |
0.4 (1) |
1.4 (3) |
0.9 (1) |
0.0 (0) |
0.5 |
| … alcohol |
8.8 (94) |
4.1 (7) |
9.2 (13) |
10.6 (29) |
8.1 (18) |
9.2 (10) |
12.0 (17) |
1.0 |
| … other
drugs |
0.9 (10) |
0.6 (1) |
0.0 (0) |
0.4 (1) |
0.5 (1) |
0.9 (1) |
4.3 (6) |
0.7 |
| Has
contact with adolescents who regularly use stimulants and addictive
substances |
36.4
(388) |
25.7 (44) |
33.1 (47) |
39.4
(109) |
39.9 (89) |
36.1 (39) |
42.4 (59) |
0.8 |
| Feels not
very well or not at all well-informed about the effects and risks of
addictive substances |
8.0 (83) |
4.7 (8) |
4.9 (7) |
8.5 (23) |
7.9 (17) |
12.5 (13) |
10.3 (14) |
3.0 |
| Exclusion,
bullying and violence |
| Seldom or
never feels accepted by others |
6.1 (66) |
3.5 (6) |
4.2 (6) |
7.2 (20) |
6.3 (14) |
9.2 (10) |
6.3 (9) |
0 |
| Feels
often or very often excluded by others |
4.5 (48) |
3.5 (6) |
3.5 (5) |
5.8 (16) |
4.0 (9) |
6.4 (7) |
2.8 (4) |
0.3 |
| Has been
(a few times or repeatedly) |
…
seriously offended / hurt / threatened |
22.5
(242) |
19.8 (34) |
16.0 (23) |
23.3 (65) |
20.7 (46) |
39.8 (43) |
19.7 (28) |
0.2 |
| …seriously
physically hurt |
6.2 (67) |
2.3 (4) |
4.9 (7) |
6.5 (18) |
7.6 (17) |
9.2 (10) |
5.6 (8) |
0.1 |
| …
sexually harassed with words |
8.2 (88) |
11.0 (19) |
2.1 (3) |
10.0 (28) |
4.1 (9) |
19.3 (21) |
4.9 (7) |
0.1 |
| …
experienced harassment / uncomfortable physical contact |
5.6 (60) |
7.0 (12) |
2.1 (3) |
7.2 (20) |
0.9 (2) |
11.9 (13) |
4.2 (6) |
0.1 |
| Has (a
few times or repeatedly) |
|
|
|
|
|
|
|
|
| …
seriously offended / hurt / threatened others |
10.1
(109) |
2.9 (5) |
12.5 (18) |
4.3 (12) |
13.5 (30) |
12.0 (13) |
21.1 (30) |
0.1 |
| …
seriously physically hurt others |
3.1 (33) |
1.2 (2) |
4.9 (7) |
1.8 (5) |
2.7 (6) |
1.8 (2) |
7.0 (10) |
0.1 |
| Exercise,
nutrition and health protection |
| Exercises
only once a month or less often |
8.7 (93) |
9.9 (17) |
5.6 (8) |
7.9 (22) |
5.0 (11) |
16.7 (18) |
10.6 (15) |
0.3 |
| Rarely or
never eats breakfast |
28.5
(306) |
15.1 (26) |
19.4 (28) |
33.6 (93) |
25.1 (56) |
51.4 (56) |
32.1 (45) |
0.4 |
| Seldom or
never eats healthy |
14.6
(157) |
9.9 (17) |
15.3 (22) |
12.6 (35) |
15.2 (34) |
20.4 (22) |
19.0 (27) |
0.2 |
| Is often
or very often bored |
18.3
(197) |
16.9 (29) |
14.6 (21) |
20.4 (57) |
14.3 (32) |
27.5 (30) |
19.0 (27) |
0 |
| Is often
or very often online longer than intended |
46.5
(499) |
53.5 (92) |
37.5 (54) |
51.6
(144) |
38.7 (86) |
52.8 (57) |
44.4 (63) |
0.2 |
| Seldom or
never protects the skin from strong sunlight |
24.1
(259) |
12.2 (21) |
29.2 (42) |
20.1 (56) |
30.6 (68) |
22.9 (25) |
31.7 (45) |
0.1 |
| Seldom or
never protects the ears from loud music |
43.1
(462) |
40.9 (70) |
36.1 (52) |
44.1
(123) |
44.8 (99) |
46.8 (51) |
45.8 (65) |
0.3 |
| Seldom or
never wears a helmet when cycling |
47.1
(505) |
34.9 (60) |
30.8 (44) |
50.7
(141) |
45.5
(101) |
63.3 (69) |
62.7 (89) |
0.3 |
| Puberty
and sexuality |
| Is worried
about something concerning their physical development |
31.5
(336) |
33.1 (57) |
21.5 (31) |
40.2
(111) |
19.9 (44) |
50.9 (54) |
26.4 (37) |
0.9 |
| Feels not
very well or not at all well-informed about contraception |
7.7 (82) |
6.4 (11) |
2.1 (3) |
5.0 (14) |
7.2 (16) |
16.7 (18) |
13.6 (19) |
0.5 |
| Feels not
very well or not at all well-informed about protection against STDs |
34.4
(369) |
31.6 (54) |
20.8 (30) |
37.1
(103) |
28.7 (64) |
46.3 (50) |
46.1 (65) |
0.4 |
| Feels not
well educated about sexuality |
5.3 (56) |
3.0 (5) |
1.4 (2) |
4.4 (12) |
4.5 (10) |
14.2 (15) |
8.0 (11) |
1.8 |
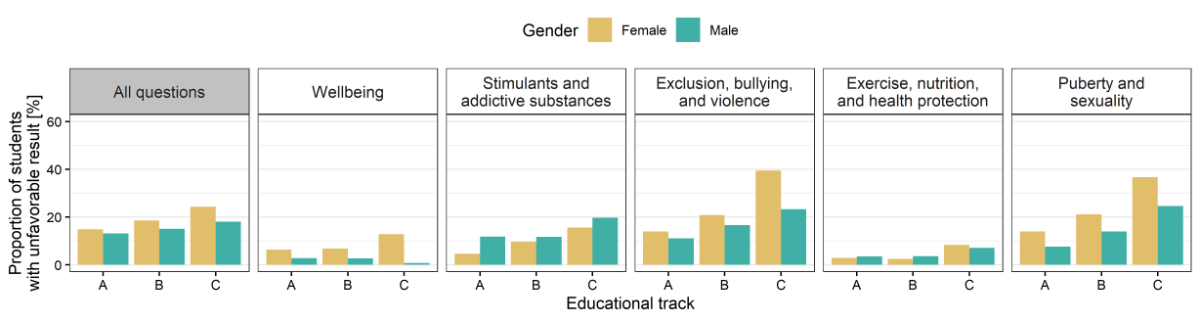
Figure 2Proportion of
students with unfavourable scores, for all questions and within the five
overarching health topics, by educational track and gender. Educational tracks:
A (highest), B (intermediate) and C (lowest). Number of students: n = 1069.
Well-being
Overall,
the majority of the 1076 students reported feeling quite or very happy and
satisfied. Still, every fifth student reported feeling sad often or almost
always. In just under a third, pain was experienced often or almost always. Every
fifth student was quite or very unhappy with their appearance, and almost half
of the students reported that they would like to change something about their
appearance if they could. Female students in educational track levels B and C had
higher proportions of unfavourable “well-being” scores compared to male
students (figure 3).
Stimulants and
addictive substances
The vast
majority of students reported that they had never consumed cigarettes, e-cigarettes
or e-shisha, snus or shisha, or marijuana and that they felt quite well or even
very well-informed about the effects and risks of addictive substances. Alcohol
was consumed more often, with more than every third student having tried it at
least once, but less than every tenth student reported consuming it from time
to time or even regularly. When asked about the behaviour of others, over a
third of the students reported that other adolescents whom they met regularly
consumed addictive substances. Female students in educational track A had lower
proportions of unfavourable scores compared to those in level C and compared to
their male counterparts (figure 3).
Exclusion,
bullying and violence
Most of the
students reported feeling accepted by others for who they were always or most
of the time. Conversely, around one in 20 students seldom or never felt accepted
by others or often or very often felt excluded from others. Half of the
students had been seriously offended, hurt or threatened at least once, and almost
one-fifth had been seriously physically hurt, sexually harassed with words or experienced
uncomfortable physical contact. Students in educational track level C more often
had unfavourable “exclusion, bullying and violence” scores than those in level
A, particularly females (figure 3).
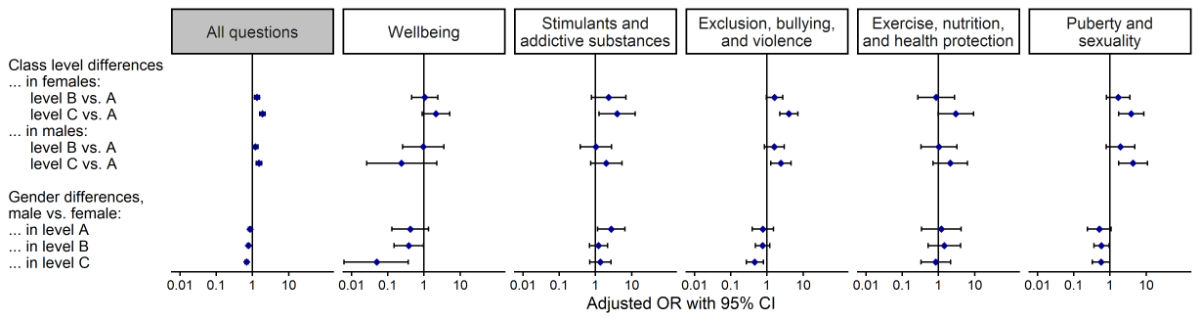
Figure 3Associations
of gender and educational track with unfavourable scores, for all questions and
within the five overarching health topics. Odds ratios (ORs) with 95% confidence
intervals (CIs) are presented on a logarithmic scale. ORs >1 indicate a
positive association with unfavourable scores. For “Exclusion, bullying and
violence” and “Exercise, nutrition and health protection”, we used simple
logistic regression without random effects to ensure well-defined models.
Number of students: n = 1069.
Exercise,
nutrition and health protection
Nearly
three-quarters of the students reported doing sports more than once per week in
their spare time. Most students also reported eating healthy often or always,
but almost half of the students often or very often spent more time online than
they intended, and roughly one-quarter did not use sunscreen in strong sun.
Puberty and
sexuality
Almost all
students reported feeling well-informed about sexuality. Most felt well-informed
about contraception, but one-third felt quite or very badly informed about
sexually transmitted diseases (STDs). Almost one-third of the students were worried
about issues concerning their physical development. Students in educational
track level C had more unfavourable “puberty and sexuality” scores, and females
in educational track levels B and C had more unfavourable scores than their
male counterparts (figure 3).
Correlation
There was a
clear correlation between different questions within the same overarching
health topic (figure S1 in the appendix). Apart from that, the highest
correlation was observed between feeling sad/unhappy or unhealthy/unsatisfied and
not feeling accepted, having been seriously offended/hurt/threatened, having
been sexually harassed with words, or worrying about one’s physical development,
as well as between worrying about one’s physical development and being unhappy
about or wanting to change something about one’s appearance. There was hardly
any negative correlation, that is, an unfavourable response to one question
correlating with a favourable response to another question.
Health issues
addressed in the school doctor consultation
According
to the 595 filled-out consultation reports, at least one of the five
overarching health topics was addressed in 89.6% of the consultations. In over
half of the consultations, all five health topics from the evaluation sheet
were addressed. The most frequently addressed topics were “exercise, nutrition
and health protection” (in 86.7%), “stimulants and addictive substances” (in
86.4%), and “well-being” (in 72.9%).
Whether and
which health issues were addressed varied highly by school doctor. Seven of the
nine school doctors addressed at least one health issue in all consultations,
whereas one school doctor did so in only 60.0% (of n = 20) and another in none
(of n = 54). The variation by health topic is shown in figure 4A (overarching
health topics) and figure 4B (subtopics).
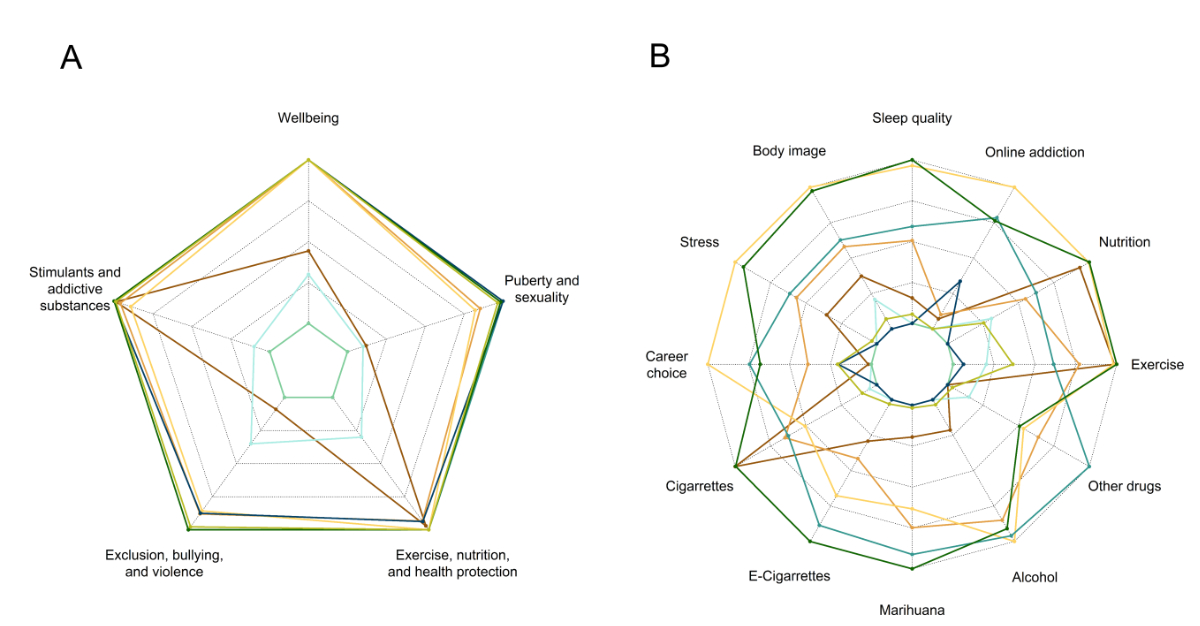
Figure 4Health issues
addressed, stratified by school doctor. Proportion of consultations in which A)
overarching health topics or B) specific subtopics were addressed (information
on specific subtopics was only available for “well-being”, “exercise, nutrition
and health prevention”, and “stimulants and addictive substances”). The
innermost polygon represents 0% (addressed in zero consultations); the outmost
polygon represents 100% (addressed in every consultation). The different colours
represent different school doctors. Number of school doctors: n = 9.
Discussion
In this
study, we set out to describe the self-reported health status and behaviours of
over 1000 Swiss adolescents aged 13–15 years and the health issues that were
addressed in their routine school doctor consultations. We found that although the
vast majority of students reported being happy and satisfied overall, around
20% often felt sad and 5–10% had repeatedly been seriously physically hurt,
sexually harassed with words or experienced uncomfortable physical contact. Female
gender and lower educational track were associated with more unfavourable
health status, with females in the lowest educational track having the least favourable
health status. Furthermore, we found that in 90% of the analysed school doctor consultations,
at least one health prevention or promotion topic was addressed, with the most frequently
addressed topics being “exercise, nutrition and health protection”, “stimulants
and addictive substances”, and “well-being”. The topics discussed depended strongly
on the individual school doctors.
Our
descriptive results with regard to well-being and bullying are well in line
with the literature, for example, the Swiss results from the Health Behaviour
in School-aged Children (HBSC) survey conducted in 2018 [18] and the Swiss results
from the Programme for International Student Assessment (PISA) [19, 20]. The
high proportion of bullying is concerning, given its many negative effects on
overall health later in life [21, 22]. Some studies have shown that the adverse
effects of negative peer relationships on mental health can be even worse than
childhood maltreatment, suggesting that bullying should be addressed as a major
public health concern [23].
Our inferential
results are also well in line with the literature: the association of both lower
socioeconomic status [24–26] and female gender [6, 24, 27, 28] with unfavourable
self-reported health status is well documented. For instance, the HBSC survey found
that adolescents from less wealthy families and female adolescents reported lower
levels of life satisfaction and health [18, 24]. Interestingly, we observed that
females in the lowest educational track had the most unfavourable health status.
The literature paints a heterogeneous picture of the relationship of socioeconomic
status and gender with health, which seems to depend on both the definition of
socioeconomic status and the studied outcomes [29, 30]. Regardless, our
findings suggest that health promotion and prevention should focus on promoting
equal opportunities for students of different socioeconomic backgrounds, especially
for female adolescents. This is particularly relevant because health in
adolescence impacts health in adulthood, during which the negative associations
of socioeconomic status and gender with health are still present [25, 27]. Despite
the generally better health reported by males compared to females, it should be
noted that males are also at risk of being undertreated: compared to females,
males have higher suicide rates, lower health care utilisation, higher unmet
needs and lower life expectancy [31]. For adolescents specifically, it has
previously been shown that females are more likely than males to seek social support,
plan and vent their emotions in early adolescence, whereas males increase their
use of these strategies only as they hit late adolescence [32]. Gender-specific
health prevention and promotion strategies may thus be indicated [33, 34].
Regarding
the discussion of health issues, we found that the health topics from the
evaluation sheet were frequently addressed. This is encouraging, given that studies
have shown that adolescents find it important to have the opportunity to talk
with their doctor about these health topics [35–37] and these health issues are often
not sufficiently
recognised [6, 7]. However, in our study, the health issues discussed
depended heavily on the school doctor, suggesting that the discussion was not always
patient-centred. This is consistent with the findings of a recent Swiss study
of young adults (aged 17–26 years), which showed that the likelihood of risk behaviours
being addressed by primary care physicians was largely independent of the risk
factors and wishes of the youth [26]. Moreover, consistent with previous
studies [37], the most frequently addressed health topics were “exercise,
nutrition and health protection” and “stimulants and addictive substances”. Yet,
adolescents’ self-reported health status and behaviours were more favourable regarding
these health topics than others. It is plausible that school doctors felt most
responsible for – and familiar with – these “classical” health topics in the
sense of having the appropriate education and skills to handle these topics [38].
This should be placed in the broader context: despite repeated legislative
efforts, Switzerland has no federal law on health prevention and promotion [39].
However, in recognition of the importance of health prevention, a national
strategy to prevent non-communicable diseases during the period 2017-2024 was
introduced to strengthen preventive measures and improve the integration of
prevention into acute and long-term care policies [40]. This includes strengthening
the training of health professionals to carry out preventive measures [39].
Whether this will be effective remains to be seen.
Importantly,
a systematic school-based approach, that is a doctor consultation with a preparation
lesson, constitutes a unique, low-threshold and equal opportunity to improve
the health literacy of adolescents. Health literacy is an important health
determinant and includes the motivation, knowledge and skills to acquire,
understand and assess health information, communicate on health issues, and
make informed decisions to maintain and promote one’s health [41, 42].
Reflecting on one’s health status and behaviours as well as having easy access
to a health professional promotes the development of adolescents’ autonomy,
their self-management skills and their ability to make informed decisions and take
responsibility for their own health [43]. The same can be argued for the
preparation lesson on health prevention and promotion topics as well as the
completion of a self-assessment questionnaire included in the school setting. Low-threshold
and equal access is especially important because, as with unfavourable health
status and behaviours, there is an association between lower health literacy
and lower socioeconomic status [44]. Another advantage of the school-based
approach is that adolescents have private time with the doctor, that is,
without parents present. This is important to adolescents and has been shown to
increase discussion about risky behaviours but is often not granted in the
context of regular adolescent-physician encounters [35, 37]. However, it is
important for the success of the school-based approach that the students are
not only encouraged to reflect on their health status but also to actively
address health issues as needed rather than relying solely on the school
doctor, who cannot know what is most important to the student (even if an
“assessment sheet” is available). In general, further research is needed to identify
the needs and preferences of both students and school doctors. Ultimately, different
types of school health services may be compared to determine which is most
beneficial.
Strengths and limitations
Our study
offers detailed insights into the self-reported health status and behaviours of
adolescents and the addressing of these health issues. There was a very high
coverage of virtually all 7th-grade students in the canton of Zug,
as well as high completeness rates, with <5% missing data for all variables.
Moreover, the increased correlation of responses within health topics speaks to
the validity of the self-assessment questionnaire. A major limitation of this
study was that due to anonymised data collection, the matching of the self-assessment
questionnaires and consultation reports at the student level was not possible. The
limitations of the consultation report were that i) only nine out of 13 school
doctors participated, and this may not be a random sample (participation bias)
and ii) we could not discriminate whether a health issue was only addressed briefly
or discussed in detail. Moreover, the study was restricted to the school doctor
consultation, without any follow-up of the subsequent clinical pathways. The limitations
of the self-assessment questionnaire were as follows: first, there was a possible
social desirability bias in the reporting of health status and behaviours,
especially for the topic “stimulants and addictive substances”, which covers illicit
activities [45]. Second, the COVID-19 pandemic might have impacted the
responses in our study, considering that many studies have raised concerns regarding
the negative impact of the pandemic on mental health among children and
adolescents [46]. Finally, the canton of Zug is not fully representative of the
whole country of Switzerland (above average economy and education) [47]. Nevertheless,
our results were in line with previous data from Switzerland.
Conclusions
Our
findings point to the importance of health prevention and promotion in
adolescence. A school-based approach that strengthens adolescents' health
literacy and provides opportunities for patient-centred counselling has the
potential to improve the current and future health of adolescents and,
ultimately, adults. To realise this potential, it is essential for school
doctors to be sensitised and trained to address students’ health concerns. Emphasis
should be placed on the importance of patient-centred counselling, the high
prevalence of bullying, and gender and educational differences.
Data sharing
The
datasets generated and/or analysed during the current study are not publicly
available due to the ethics approval waiver only applying to the specific
project but are available from the corresponding author on reasonable request
and with the permission of the local ethics committee (“Ethikkommission
Nordwest- und Zentralschweiz”).
Acknowledgements
Our thanks
go to Katja Fischer and Nicolas Wild for digitalising the self-assessment questionnaires.
Author contributions:
YR: conceptualisation; methodology; data curation; visualisation; writing –
original draft; writing – review and editing; supervision. SEN: data curation;
writing – review and editing. LJ: methodology; writing – review and editing.
SMD: writing – review and editing. OF: writing – review and editing. OS:
conceptualisation; resources; writing – review and editing.
Yael Rachamin PhD
Institute of Primary
Care
University of Zurich
and University Hospital Zurich
Pestalozzistrasse 24
CH-8091 Zurich
yael.rachamin[at]usz.ch
References
1. Sawyer SM, Afifi RA, Bearinger LH, Blakemore SJ, Dick B, Ezeh AC, et al. Adolescence:
a foundation for future health. Lancet. 2012 Apr;():1630–40. 10.1016/S0140-6736(12)60072-5
2. Forrest CB, Riley AW. Childhood origins of adult health: a basis for life-course health
policy. Health Aff (Millwood). 2004;():155–64. 10.1377/hlthaff.23.5.155
3. Harris SK, Aalsma MC, Weitzman ER, Garcia-Huidobro D, Wong C, Hadland SE, et al. Research
on Clinical Preventive Services for Adolescents and Young Adults: Where Are We and
Where Do We Need to Go? J Adolesc Health. 2017 Mar;():249–60. 10.1016/j.jadohealth.2016.10.005
4. Wieber F, von Wyl A, Crameri A, Dratva J, Passalacqua S, et al. Psychische Gesundheit
in der kinder- und hausärztlichen Versorgungspraxis. ZHAW; 2020.
5. UNICEF Data. Mental health 2021 [Available from: https://data.unicef.org/topic/child-health/mental-health/#_edn1
6. Jeannin A, Narring F, Tschumper A, Bonivento LI, Addor V, Bütikofer A, et al. Self-reported
health needs and use of primary health care services by adolescents enrolled in post-mandatory
schools or vocational training programmes in Switzerland. Swiss Med Wkly. 2005 Jan;():11–8.
7. Mohler-Kuo M, Schnyder U, Dermota P, Wei W, Milos G. The prevalence, correlates, and
help-seeking of eating disorders in Switzerland. Psychol Med. 2016 Oct;():2749–58.
10.1017/s0033291716001136 10.1017/S0033291716001136
8. Collins L, Smiley SL, Moore RA, Graham AL, Villanti AC. Physician tobacco screening
and advice to quit among U.S. adolescents - National Survey on Drug Use and Health,
2013. Tob Induc Dis. 2017 Jan;():2. 10.1186/s12971-016-0107-6
9. Langford R, Bonell C, Jones H, Pouliou T, Murphy S, Waters E, et al. The World Health
Organization’s Health Promoting Schools framework: a Cochrane systematic review and
meta-analysis. BMC Public Health. 2015 Feb;():130. 10.1186/s12889-015-1360-y
10. Alemán-Díaz AY, Backhaus S, Siebers LL, Chukwujama O, Fenski F, Henking CN, et al. Child
and adolescent health in Europe: monitoring implementation of policies and provision
of services. Lancet Child Adolesc Health. 2018 Dec;():891–904. 10.1016/S2352-4642(18)30286-4
11. Denny S, Howie H, Grant S, Galbreath R, Utter J, Fleming T, et al. Characteristics
of school-based health services associated with students’ mental health. J Health
Serv Res Policy. 2018 Jan;():7–14. 10.1177/1355819617716196
12. Lüthi F, Balthasar A, Laubereau B. Organisation der schulärztlichen Untersuchungen
in der Schweiz - Versuch einer Systematisierung kantonaler Modelle. Schweiz Arzteztg.
2019;():686–9. 10.4414/saez.2019.17871
13. Gesundheit und Geschlecht Neuchâtel, Switzerland: Federal Statistical Office; 2020
[Available from: https://www.bfs.admin.ch/bfs/de/home/statistiken/kataloge-datenbanken/publikationen.assetdetail.15284969.html
14. International Standard Classification of Education (ISCED). UNESCO Institute for Statistics;
[cited 2021 5.11.2021]. Available from: http://uis.unesco.org/en/topic/international-standard-classification-education-isced
15. R Core Team. R: A language and environment for statistical computing. Vienna, Austria:
R Foundation for Statistical Computing; 2020.
16. Bates D, Mächler M, Bolker B, Walker S. Fitting Linear Mixed-Effects Models Using
lme4. J Stat Softw. 2015;():1–48. 10.18637/jss.v067.i01
17. Hothorn T, Bretz F, Westfall P. Simultaneous inference in general parametric models.
Biom J. 2008 Jun;():346–63. 10.1002/bimj.200810425
18. Ambord S, Eichenberger Y, Delgrande Jordan M. Gesundheit und Wohlbefinden der 11-
bis 15-jährigen Jugendlichen in der Schweiz im Jahr 2018 und zeitliche Entwicklung
- Resultate der Studie “Health Behaviour in School-aged Children” (HBSC) (Forschungsbericht
Nr. 113). Lausanne, Switzerland: Sucht Schweiz; 2020.
19. OECD. PISA 2018 Results (Volume III) 2019.
20. Konsortium PISA.ch. PISA 2018: Schülerinnen und Schüler der Schweiz im internationalen
Vergleich. Bern und Genf: SBFI/EDK und Konsortium PISA.ch; 2019.
21. Wolke D, Lereya ST. Long-term effects of bullying. Arch Dis Child. 2015 Sep;():879–85.
10.1136/archdischild-2014-306667
22. Kaess M. Bullying: peer-to-peer maltreatment with severe consequences for child and
adolescent mental health. Eur Child Adolesc Psychiatry. 2018 Aug;():945–7. 10.1007/s00787-018-1201-5
23. Lereya ST, Copeland WE, Costello EJ, Wolke D. Adult mental health consequences of
peer bullying and maltreatment in childhood: two cohorts in two countries. Lancet
Psychiatry. 2015 Jun;():524–31. 10.1016/S2215-0366(15)00165-0
24. World Health Organization. Key findings. Regional Office for E. Spotlight on adolescent
health and well-being. Findings from the 2017/2018 Health Behaviour in School-aged
Children (HBSC) survey in Europe and Canada. International report. . Copenhagen: World
Health Organization. Regional Office for Europe; 2020.
25. Selbst wahrgenommener Gesundheitszustand nach Geschlecht, Alter, Bildungsniveau, Sprachgebiet
Neuchâtel, Switzerland: Federal Statistical Office; 2017 [Available from: https://www.bfs.admin.ch/asset/de/6466030
26. Eisner-Fellay T, Akre C, Auderset D, Barrense-Dias Y, Suris JC. Far from acceptable:
youth-reported risk behaviour screening by primary care physicians. Fam Pract. 2020 Nov;():759–65.
10.1093/fampra/cmaa068
27. Boerma T, Hosseinpoor AR, Verdes E, Chatterji S. A global assessment of the gender
gap in self-reported health with survey data from 59 countries. BMC Public Health.
2016 Jul;():675. 10.1186/s12889-016-3352-y
28. Dey M, Jorm AF, Mackinnon AJ. Cross-sectional time trends in psychological and somatic
health complaints among adolescents: a structural equation modelling analysis of ‘Health
Behaviour in School-aged Children’ data from Switzerland. Soc Psychiatry Psychiatr
Epidemiol. 2015 Aug;():1189–98. 10.1007/s00127-015-1040-3
29. O’Neil A, Russell JD, Thompson K, Martinson ML, Peters SA. The impact of socioeconomic
position (SEP) on women’s health over the lifetime. Maturitas. 2020 Oct;:1–7. 10.1016/j.maturitas.2020.06.001
30. Phillips SP, Hamberg K. Women's relative immunity to the socio-economic health gradient:
artifact or real? Global health action. 2015;8:27259-. doi: 10.3402/gha.v8.27259.
31. Kaul P, Irwin CE Jr. Serving the Underserved: The Health and Well-Being of Adolescent
and Young Adult Males. J Adolesc Health. 2018 Mar;( 3s):S1–2. 10.1016/j.jadohealth.2017.12.008
32. Flannery KM, Vannucci A, Ohannessian CM. Using Time-Varying Effect Modeling to Examine
Age-Varying Gender Differences in Coping Throughout Adolescence and Emerging Adulthood.
J Adolesc Health. 2018 Mar;( Supplement):S27–34. 10.1016/j.jadohealth.2017.09.027
33. Östlin P, Eckermann E, Mishra US, Nkowane M, Wallstam E. Gender and health promotion:
a multisectoral policy approach. Health Promot Int. 2006 Dec; Suppl 1:25–35. 10.1093/heapro/dal048
34. Lynch L, Long M, Moorhead A. Young Men, Help-Seeking, and Mental Health Services:
Exploring Barriers and Solutions. Am J Men Health. 2018 Jan;():138–49. 10.1177/1557988315619469
35. Rutishauser C, Esslinger A, Bond L, Sennhauser FH. Consultations with adolescents:
the gap between their expectations and their experiences. Acta Paediatr. 2003 Nov;():1322–6.
10.1111/j.1651-2227.2003.tb00503.x
36. Turner L, Spencer L, Strugnell J, Di Tommaso I, Tate M, Allen P, et al. Young people
have their say: what makes a youth-friendly general practice? Aust Fam Physician.
2017;():70–4.
37. Klein JD, Wilson KM. Delivering quality care: adolescents’ discussion of health risks
with their providers. J Adolesc Health. 2002 ;():190–5. 10.1016/S1054-139X(01)00342-1
38. Cheng TL, DeWitt TG, Savageau JA, O’Connor KG. Determinants of counseling in primary
care pediatric practice: physician attitudes about time, money, and health issues.
Arch Pediatr Adolesc Med. 1999 Jun;():629–35. 10.1001/archpedi.153.6.629
39. Trein P. Switzerland implements a national strategy to prevent non-communicable diseases.
European Social Policy Network (ESPN) - European Comission; 2017.
40. National Strategy for the Prevention of Noncommunicable Diseases (NCD strategy): Federal
Office of Public Health; [cited 2021 23.11.2021]. Available from: https://www.bag.admin.ch/bag/en/home/strategie-und-politik/nationale-gesundheitsstrategien/strategie-nicht-uebertragbare-krankheiten.html
41. Abel T, Hofmann K, Ackermann S, Bucher S, Sakarya S. Health literacy among young adults:
a short survey tool for public health and health promotion research. Health Promot
Int. 2015 Sep;():725–35. 10.1093/heapro/dat096
42. Fleary SA, Joseph P, Pappagianopoulos JE. Adolescent health literacy and health behaviors:
A systematic review. J Adolesc. 2018 Jan;():116–27. 10.1016/j.adolescence.2017.11.010
43. Alderman EM. AMA Guidelines for Adolescent Preventive Services (GAPS): recommendations
and rationale. JAMA. 1994;():980–1. 10.1001/jama.1994.03520120090040
44. Bieri U, Kocher JP, Gauch C, Tschöpe S, Venetz A, et al. Bevölkerungsbefragung "Erhebung
Gesundheitskompetenz 2015" [Population survey "Health literacy survey 2015"]. Bern,
Switzerland: gfs.bern; 2016.
45. Smetana JG, Villalobos M, Tasopoulos-Chan M, Gettman DC, Campione-Barr N. Early and
middle adolescents’ disclosure to parents about activities in different domains. J
Adolesc. 2009 Jun;():693–713. 10.1016/j.adolescence.2008.06.010
46. Racine N, McArthur BA, Cooke JE, Eirich R, Zhu J, Madigan S. Global Prevalence of
Depressive and Anxiety Symptoms in Children and Adolescents During COVID-19: A Meta-analysis.
JAMA Pediatr. 2021 Nov;():1142–50. 10.1001/jamapediatrics.2021.2482
47. Kantonsvergleich: Gesundheitsdirektion Kanton Zug, Fachstelle für Statistik; [cited
2021 25.11.2021]. Available from: https://www.zg.ch/behoerden/gesundheitsdirektion/statistikfachstelle/zug-im-vergleich?chart=04-01&order=asc
Appendix
Table S1Characteristics of school doctors.
| Variable |
School doctors (n = 9*) |
| Gender |
% female |
33% |
| % male |
66% |
| Medical speciality |
% General internal medicine |
89% |
| % Paediatrics |
11% |
| Mean number of years of working experience (SD) |
28 (9) |
| Median number of years of experience as a school doctor for the 7th
grade (SD) |
21 (8) |
Table S2Association of student gender and class level with unfavourable results, and
random effects (school).*
| |
OR |
95% CI |
p |
| All questions (random intercept: SD = 0.09, 95% CI = 0.05 to 0.15) |
| Female students |
Class level B (vs. A) |
1.33 |
1.14 to
1.56 |
<0.001 |
| Class level C (vs. A) |
1.89 |
1.59 to
2.23 |
<0.001 |
| Male students |
Class level B (vs. A) |
1.20 |
1.01 to
1.42 |
0.036 |
| Class level C (vs. A) |
1.51 |
1.01 to
1.79 |
<0.001 |
| Class level A |
Male gender (vs. female) |
0.86 |
0.77 to
0.96 |
0.006 |
| Class level B |
Male gender (vs. female) |
0.77 |
0.71 to
0.84 |
<0.001 |
| Class level C |
Male gender (vs. female) |
0.69 |
0.62 to
0.76 |
<0.001 |
| Well-being (random intercept: SD = 0.16, 95% CI = 0.00 to 0.73) |
| Female students |
Class level B (vs. A) |
1.05 |
0.46 to
2.41 |
0.908 |
| Class level C (vs. A) |
2.14 |
0.89 to
5.14 |
0.089 |
| Male students |
Class level B (vs. A) |
0.96 |
0.26 to
3.57 |
0.946 |
| Class level C (vs. A) |
0.24 |
0.03 to 2.26 |
0.214 |
| Class level A |
Male gender (vs. female) |
0.42 |
0.13 to
1.34 |
0.143 |
| Class level B |
Male gender (vs. female) |
0.38 |
0.15 to
0.97 |
0.043 |
| Class level C |
Male gender (vs. female) |
0.05 |
0.01 to
0.37 |
0.004 |
| Stimulants and addictive substances (random intercept: SD = 0.46, 95% CI = 0.21 to
0.84) |
| Female students |
Class level B (vs. A) |
2.31 |
0.77 to
6.88 |
0.134 |
| Class level C (vs. A) |
3.97 |
1.26 to
12.51 |
0.019 |
| Male students |
Class level B (vs. A) |
1.03 |
0.38 to 2.75 |
0.960 |
| Class level C (vs. A) |
1.98 |
0.73 to
5.36 |
0.177 |
| Class level A |
Male gender (vs. female) |
2.72 |
1.14 to
6.49 |
0.024 |
| Class level B |
Male gender (vs. female) |
1.21 |
0.68 to
2.15 |
0.515 |
| Class level C |
Male gender (vs. female) |
1.36 |
0.69 to
2.67 |
0.368 |
| Exclusion, bullying and violence* |
| Female students |
Class level B (vs. A) |
1.62 |
0.96 to
2.72 |
0.069 |
| Class level C (vs. A) |
4.02 |
2.26 to
7.16 |
<0.001 |
| Male students |
Class level B (vs. A) |
1.59 |
0.85 to
2.98 |
0.147 |
| Class level C (vs. A) |
2.42 |
1.27 to
4.64 |
0.008 |
| Class level A |
Male gender (vs. female) |
0.77 |
0.39 to
1.51 |
0.450 |
| Class level B |
Male gender (vs. female) |
0.76 |
0.48 to
1.20 |
0.234 |
| Class level C |
Male gender (vs. female) |
0.46 |
0.27 to
0.80 |
0.006 |
| Exercise, nutrition and health protection* |
| Female students |
Class level B (vs. A) |
0.86 |
0.27 to
2.75 |
0.799 |
| Class level C (vs. A) |
3.01 |
0.98 to
9.22 |
0.054 |
| Male students |
Class level B (vs. A) |
1.03 |
0.33 to
3.23 |
0.954 |
| Class level C (vs. A) |
2.11 |
0.70 to
6.32 |
0.184 |
| Class level A |
Male gender (vs. female) |
1.20 |
0.34 to
4.23 |
0.775 |
| Class level B: |
Male gender (vs. female) |
1.45 |
0.52 to
4.05 |
0.483 |
| Class level C |
Male gender (vs. female) |
0.84 |
0.33 to
2.15 |
0.719 |
| Puberty and sexuality (random intercept: SD = 0.34, 95% CI = 0.15 to 0.63) |
| Female students |
Class level B (vs. A) |
1.69 |
0.80 to
3.58 |
0.173 |
| Class level C (vs. A) |
3.86 |
1.73 to
8.62 |
<0.001 |
| Male students |
Class level B (vs. A) |
1.95 |
0.79 to
4.85 |
0.150 |
| Class level C (vs. A) |
4.33 |
1.74 to
10.80 |
0.002 |
| Class level A |
Male gender (vs. female) |
0.51 |
0.24 to
1.07 |
0.074 |
| Class level B |
Male gender (vs. female) |
0.58 |
0.36 to
0.95 |
0.029 |
| Class level C |
Male gender (vs. female) |
0.57 |
0.33 to
0.99 |
0.045 |
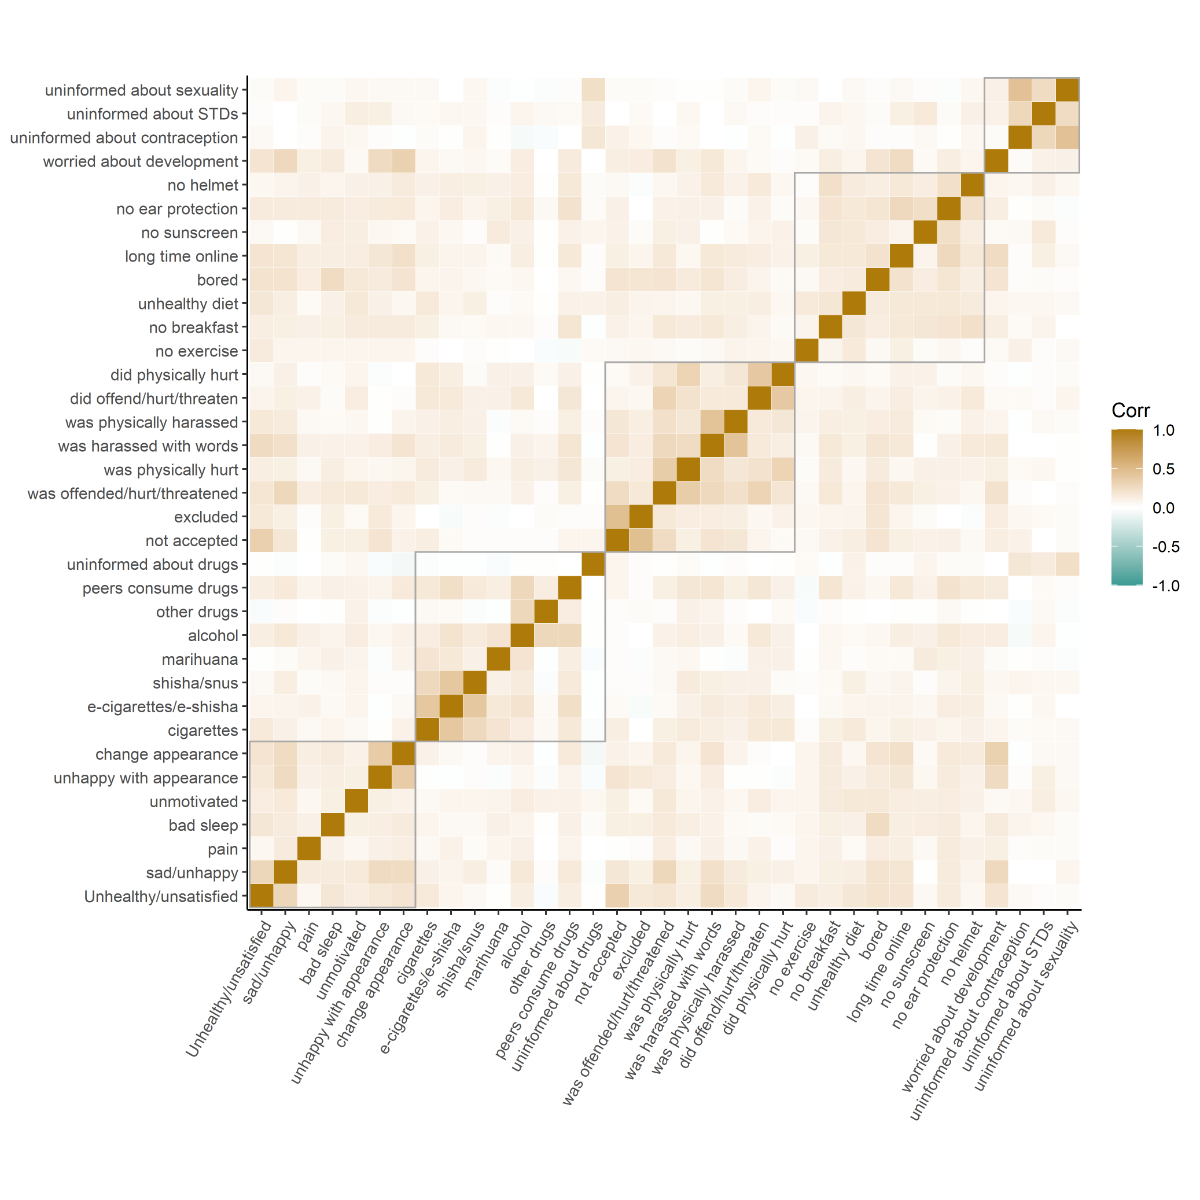
Figure S1Correlation of responses to individual questions. Grey rectangles outline
questions belonging to the same overarching health topic. The colour indicates
the direction and strength of the correlation.