Investigating the association of measures of epigenetic age with COVID-19 severity: evidence from secondary analyses of open access data
DOI: https://doi.org/https://doi.org/10.57187/smw.2023.40076
Jonviea D.
Chamberlaina, Sébastien
Nussléb, Murielle
Bochuda, Semira
Gonseth-Nussléab
aDepartment of Epidemiology and Health Systems (DESS), Center for Primary Care and Public Health (Unisanté), University of Lausanne, Lausanne, Switzerland
b
Genknowme, Lausanne, Switzerland
Summary
BACKGROUND: Epigenetic modifications may contribute to inter-individual
variation that is unexplainable by presently known risk factors for COVID-19
severity (e.g., age, excess weight, or other health conditions). Estimates of
youth capital (YC) reflect the difference between an individual’s epigenetic –
or biological – age and chronological age, and may quantify abnormal aging due
to lifestyle or other environmental exposures, providing insights that could
inform risk-stratification for severe COVID-19 outcomes. This study aims to
thereby a) assess the association between YC and epigenetic signatures of
lifestyle exposures with COVID-19 severity, and b) to assess whether the inclusion
of these signatures in addition to a signature of COVID-19 severity (EPICOVID)
improved the prediction of COVID-19 severity.
METHODS: This study uses data from two publicly-available studies
accessed via the Gene Expression Omnibus (GEO) platform (accession references:
GSE168739 and GSE174818). The GSE168739 is a retrospective, cross-sectional
study of 407 individuals with confirmed COVID-19 across 14 hospitals in Spain,
while the GSE174818 sample is a single-center observational study of
individuals admitted to the hospital for COVID-19 symptoms (n = 102). YC was
estimated using the (a) Gonseth-Nusslé, (b) Horvath, (c) Hannum, and (d)
PhenoAge estimates of epigenetic age. Study-specific definitions of COVID-19
severity were used, including hospitalization status (yes/no) (GSE168739) or
vital status at the end of follow-up (alive/dead) (GSE174818). Logistic
regression models were used to assess the association between YC, lifestyle
exposures, and COVID-19 severity.
RESULTS: Higher YC as estimated using the Gonseth-Nusslé, Hannum and
PhenoAge measures was associated with reduced odds of severe symptoms (OR = 0.95,
95% CI = 0.91–1.00; OR = 0.81, 95% CI = 0.75 - 0.86; and OR = 0.85, 95% CI = 0.81–0.88, respectively) (adjusting for chronological age and sex). In contrast, a
one-unit increase in the epigenetic signature for alcohol consumption was
associated with 13% increased odds of severe symptoms (OR = 1.13, 95% CI = 1.05–1.23).
Compared to the model including only age, sex and the EPICOVID signature, the
additional inclusion of PhenoAge and the epigenetic signature for alcohol
consumption improved the prediction of COVID-19 severity (AUC = 0.94, 95% CI = 0.91–0.96
versus AUC = 0.95, 95% CI = 0.93–0.97; p = 0.01). In the GSE174818 sample, only
PhenoAge was associated with COVID-related mortality (OR = 0.93, 95% CI = 0.87–1.00)
(adjusting for age, sex, BMI and Charlson comorbidity index).
CONCLUSIONS: Epigenetic age is a potentially useful tool in primary
prevention, particularly as an incentive towards lifestyle changes that target
reducing the risk of severe COVID-19 symptoms. However, additional research is
needed to establish potential causal pathways and the directionality of this
effect.
Introduction
Among the many identified risk factors for
Coronavirus disease (COVID-19) severity, such as sex, obesity, diabetes or
hypertension, COVID-19 severity is strongly associated with age, with older
individuals having a notably higher risk of mortality [1]. However, much
inter-individual variation exists, even within age groups, that is not
explainable by presently known risk factors [2, 3]. One
potential explanation for the inter-individual variation could be differences
in individuals’ epigenetic profiles.
Epigenetic modifications – which can be
induced by environmental and lifestyle behaviors and subsequently alter gene
expression – have been implicated in the pathophysiology of COVID-19 severity [4],
with epigenetic factors potentially contributing to COVID-19 susceptibility by
interfering with viral replication and infection [5]. For example,
recent evidence suggests that epigenetic regulation of interferons and
inflammatory signaling modulates expression of the ACE2 gene (a gene
responsible for the production of the angiotensin converting enzyme 2); it is
via ACE2 enzyme receptors that SARS-CoV-2 (severe acute respiratory syndrome
coronavirus 2, the virus responsible for COVID-19) enters the human body [4, 6]. Likewise,
epigenetic modifications have also been linked with the severity of response to
infection, particularly in relation to inflammation and the so-called “cytokine
storm” [7]. Epigenetic modifications, in particular estimates of epigenetic
age, could thereby help explain the observed variation in COVID-19 symptom
severity. To this effect, estimates of epigenetic age have been linked to
adverse health outcomes such as cardiovascular disease, dementia and mortality [8].
Moreover, the difference between epigenetic and chronological age has been
shown to be a consequence of lifestyle and environmental exposures [9, 10].
According to a recent survey in Nature, like other coronavirus variants,
60% of scientists believe that the SARS-CoV-2 virus will very likely become
endemic [11]. Identifying long-term targeted therapies are therefore imperative
for secondary prevention to reduce COVID-19 severity among individuals infected
with the SARS-CoV-2 virus. Of note is that most epigenetic modifications are
reversible. Identification of differential patterns of methylation associated
with COVID severity could aid in identifying secondary, epigenetic targets of
intervention. Moreover, estimates of youth capital (YC), which reflect the
difference between an individual’s epigenetic and chronological age, may
quantify abnormal aging due to lifestyle or other environmental exposures and
provide insights that could inform risk-stratification for severe COVID-19
outcomes. The specific aims of the present study are to assess the association
between different measures of epigenetic age and COVID-19 severity, as well as
the added predictive value when including estimates of youth capital alongside
the EPICOVID signature. We hypothesize that older epigenetic age and lifestyle
exposures, including tobacco exposure and alcohol consumption, are associated
with more severe COVID-19 outcomes.
Methods and materials
Data sources
This study is based on two study samples,
referred to here by their Gene Expression Omnibus (GEO) accession references:
GSE168739 [12] and GSE174818 [13]. Described in detail by Castro de Moura et
al., briefly the GSE168739 is a retrospective, cross-sectional study that
included 407 individuals with confirmed COVID-19 from 14 hospitals across
Spain, had a BMI <30, not presenting with risk factors for comorbidities
(diabetes, hypertension, auto-immune disorders, and chronic cardiovascular or lung
diseases), non-smokers (including previous smokers) and less than 61 years of
age [14]. COVID-19 severity was categorized into asymptomatic or
paucisymptomatic (not hospitalized) and severe (requiring hospitalization
including oxygen therapy or mechanical ventilation). The original study further
stratified between those requiring oxygen therapies and those requiring
mechanical ventilation. Whole blood samples – from which peripheral
blood-derived DNA methylation was obtained – were retrospectively collected
between March 7th 2020 and September 14th 2020.
In contrast, the second sample (GSE174818)
is a single-center observational study of individuals admitted to the hospital
for COVID-19 symptoms (n = 102), 18 years or older, who provided consent and
were not at risk of imminent death. In this sample, Balnis et al. collected
information on COVID-19 severity (intensive care unit [ICU] admittance or
non-ICU), mortality status, as well as sociodemographic characteristics,
severity indexes (e.g., Charlson comorbidity index), and other biomarkers of
interest (e.g., C-Reactive protein [CRP]) [13]. Whole blood
samples were collected at the time of study enrollment, succeeding admittance
to Albany Medical Center, from April 6th 2020 through to May 1st
2020. Information on non-COVID patients (n = 26) admitted for unrelated
respiratory health concerns, as well as healthy control patients (n = 39)
identified prior to the COVID-19 pandemic, was also collected in the original
study. However, these patients are excluded from the present manuscript. Given
that this study is a secondary analysis of publicly available data, the sample
size was pre-determined.
Data management and normalization
For both the GSE168739 and GSE174818
samples, DNA methylation was obtained using the Illumina Infinium
MethylationEPIC Beadchip array (850K). DNA methylation is an epigenetic
modification incorporated via the covalent attachment of a methyl group to the
5’ position of the cytosine ring; the location of this chemical modification is
termed a ‘CpG site’. Beta values quantify the level of methylation at each
individual CpG site, with zero representing no methylation and one representing
full methylation. Files containing raw data were downloaded from GEO accession
and subsequently normalized using an internally adapted version of the quantile
normalization that included an eight-sample reference to ensure comparability [15,16].
Beta values were calculated using the reference sample-normalized data.
Additional variables on patient-specific outcomes were obtained from the
original study authors directly via e-mail (addresses obtained from the description
page for each study on the GEO website) (e.g., Charlson comorbidity index, BMI,
Fibrinogin, Albumin); details on variable collection are provided in the
original manuscript [13,14]. An open science protocol was not prepared, nor registered for the
present study.
Epigenetic signatures
Epigenetic age was assessed using three
individual measures; epigenetic age as proposed by Hannum et al. [17] (Hannum),
Horvath et al.[18] (Horvath),
Levine et al.[19] (DNAm
PhenoAge; referred to as PhenoAge in the present study) and Gonseth-Nusslé et
al.(Gonseth-Nusslé). These individual epigenetic signatures
represent first- (Horvath and HannumHa) and second-generation (Gonseth-Nusslé, and PhenoAge) estimates
of epigenetic age. Whereas first-generation signatures were maximized to
predict chronological age, second-generation signatures maximize “biological
age” and subsequent disease prediction. To this effect, the Gonseth-Nusslé
epigenetic signature accounts more for lifestyle effects, while the PhenoAge
signature maximizes disease prediction. Lifestyle exposures, and tobacco and
alcohol consumption were also assessed using epigenetic signatures.
Briefly, the lifestyle signatures for
tobacco and alcohol consumption were determined by generating hundreds of
thousands of models using data from a general population-based cohort (n = 694)
[20], which included random combinations of CpGs identified in the
literature as explanatory variables and respectively the number of cigarettes
smoked per day or the number of standard glasses drunk per week as dependent
variables. To minimize the risk of false findings, each random model went
through a stepwise procedure based on Bayesian Information Criterion (BIC) statistics,
and the CpG combination that maximized the goodness-of-fit (r-squared) was
finally selected as the epigenetic signature. In a second step, an epigenetic
age formula was estimated using a conditional regression framework to account
for the contribution of lifestyle exposures on epigenetic age (Patent
reference: EP 22 162 216.0), thereby identifying CpG sites associated with
chronological age without controlling for lifestyle exposures. Signatures were
calibrated using a subset of the original population (n = 442), and then
validated using data from the remaining subset (n = 248). The epigenetic
signature for alcohol consumption was then transformed to correspond to units of
alcohol consumed, whereby a score of 12 equates to a consumption of 12 standard
units of alcohol per week. CpGs identified for inclusion in the Gonseth-Nusslé
epigenetic age signature were conditional on maximizing the association between
the residual of the age-CpG model with lifestyle exposures. The epigenetic
signatures Horvath, Hannum, and
PhenoAge have been described previously [17–19]. Youth capital was calculated as the difference between epigenetic
age and chronological age, such that a higher youth capital denotes a lower
epigenetic age compared to the chronological age. The EPICOVID signature,
described previously by Castro de Moura et al., is an epigenetic signature
composed of 44 CpGs identified as being associated with the clinical severity
of COVID-19 [14].
Ethics approval and consent to participate
Ethics
approvals from the institutional ethics review boards, and written informed
consent from all participants were obtained in the previous studies included in
this work [13, 14].
Statistical analysis
Age, BMI, the Charlson comorbidity index (an
ordered variable ranging from 0 to 11) and all epigenetic signatures, including
youth capital, were considered as continuous variables. Only sex was considered
as a dichotomous (male/female) variable. In case of missing data, cases were
planned to be excluded from statistical analyses, although data were
non-missing for variables of interest (age, sex, and epigenetic signatures). The
association between youth capital, as the independent variable of interest, and
COVID-19 severity, as the primary dependent variable of interest, was assessed
using logistic regression models; model assumptions were tested [21]. Separate
models were used for each measure of youth capital (e.g., Hannum, Horvath,
PhenoAge, and Gonseth-Nusslé), as well as for epigenetic signatures of lifestyle
exposures, including alcohol consumption (GSE168739 and GSE174818 samples), and
tobacco consumption (only the GSE174818 sample). To assess the predictive
capacity of models to predict severity status when including youth capital and
other epigenetic signatures, confidence intervals and point estimates for the
receiving operator curve (ROC) summary area under the curve (AUC) measure were
estimated using 10-fold cross-validation with the cvAUC package. Sensitivity – i.e., the ability of the model to
correctly identify true positives – and specificity – the ability of the model
to correctly identify true negatives – values (according to a threshold of 0.5)
are also reported. Due to the likely overestimation of youth capital with
increasing age, and the known influence of age on COVID-19 severity, all models
were adjusted for chronological age and sex [22].
All analyses were carried out using R
Studio (R version 4.0.2) [23].
Results
Descriptive statistics for the GSE168739
and GSE174818 studies are provided in table 1. Participants included in the
GSE168739 study and who had severe clinical symptoms were on average older than
those without symptoms or paucisymptomatic, had a higher average epigenetic age,
and a greater proportion were male (67.6%) (table 1).
Table 1Descriptive
table of study characteristics, stratified by severity.
| |
GSE168739
(n = 407)
|
GSE 157103
(n = 102)
|
|
Asymptomatic / paucisymptomatic
(n = 194)
|
Severe
(n = 213)
|
Alive
(n = 77)
|
Dead
(n = 25)
|
|
Mean (SD); Q1,Q3
|
Mean (SD); Q1,Q3
|
Mean (SD); Q1,Q3
|
Mean (SD); Q1,Q3
|
| Chronological age (years) |
39.4 (10.7); 31.0, 47.0 |
44.6 (9.4); 39.0, 51.0 |
58.8 (16.3); 50.0, 72.0 |
69.3 (14.1); 64.0, 78.0 |
| Epigenetic age |
Gonseth-Nusslé |
42.5 (11.8); 33.5, 51.8 |
50.0 (10.7); 42.3,57.1 |
61.0 (14.7); 52.2, 69.7 |
71.3 (14.7); 67.0,82.7 |
| Horvath |
36.3 (10.9); 28.3, 44.6 |
41.3 (10.2); 34.0, 48.5 |
51.6 (13.2); 43.5, 60.4 |
60.1 (14.5); 55.0, 69.8 |
| Hannum |
31.1 (10.2); 23.7, 38.7 |
39.5 (8.4); 34.0, 44.5 |
50.6 (13.1); 44.3, 59.8 |
60.0 (11.2); 58.1, 65.8 |
| PhenoAge |
27.1 (14.3); 16.5, 37.2 |
39.3 (10.4); 32.9, 46.2 |
54.4 (16.2); 46.0, 65.3 |
67.5 (15.1); 66.1, 75.1 |
| Youth capital
|
Gonseth-Nusslé |
–3.1 (5.3); –5.9, –0.3 |
–5.42 (5.5); –8.5, –2.3 |
–2.1 (7.3); –7.0, 2.1 |
–1.9 (7. 6); –6.6, 4.0 |
| Horvath |
3.0 (4.9); 0.2, 5.9 |
3.3 (5.1); 0.3, 6.6 |
7.4 (6.1); 3.3, 11.8 |
9.5 (5.9); 3.6, 14.2 |
| Hannum |
8.3 (4.7); 5.6, 10.8 |
5.1 (4.8); 1.9, 8.0 |
8.0 (6.0); 3.3, 12.0 |
9.1 (6.7); 4.8, 13.0 |
| PhenoAge |
12.2 (8.0); 8.5, 15.6 |
5.2 (7.0); 0.7,9.7 |
4.4 (7.5); –0.5, 8.6 |
1.8 (7.7); –4.1, 7.5 |
| Females; n (%) |
153 (78.9) |
69 (32.4) |
29 (37.7) |
10 (40.0) |
Similar sample distributions were observed
for the GSE174818 study. A higher correlation between youth capital and
chronological age was observed for the GSE174818 sample compared to the GSE168739
sample (figure 1). In comparison to individuals with less severe symptoms,
youth capital was lower for those with severe symptoms; similarly, individuals
who died had lower youth capital in comparison to those who survived (table 1
and figure 1). The epigenetic age estimated by Gonseth-Nusslé et al. was the
only measure that reported an average epigenetic age that was older than the reported
chronological age (table 1). Across all measures of epigenetic age, youth
capital improved with chronological age (figure 1).
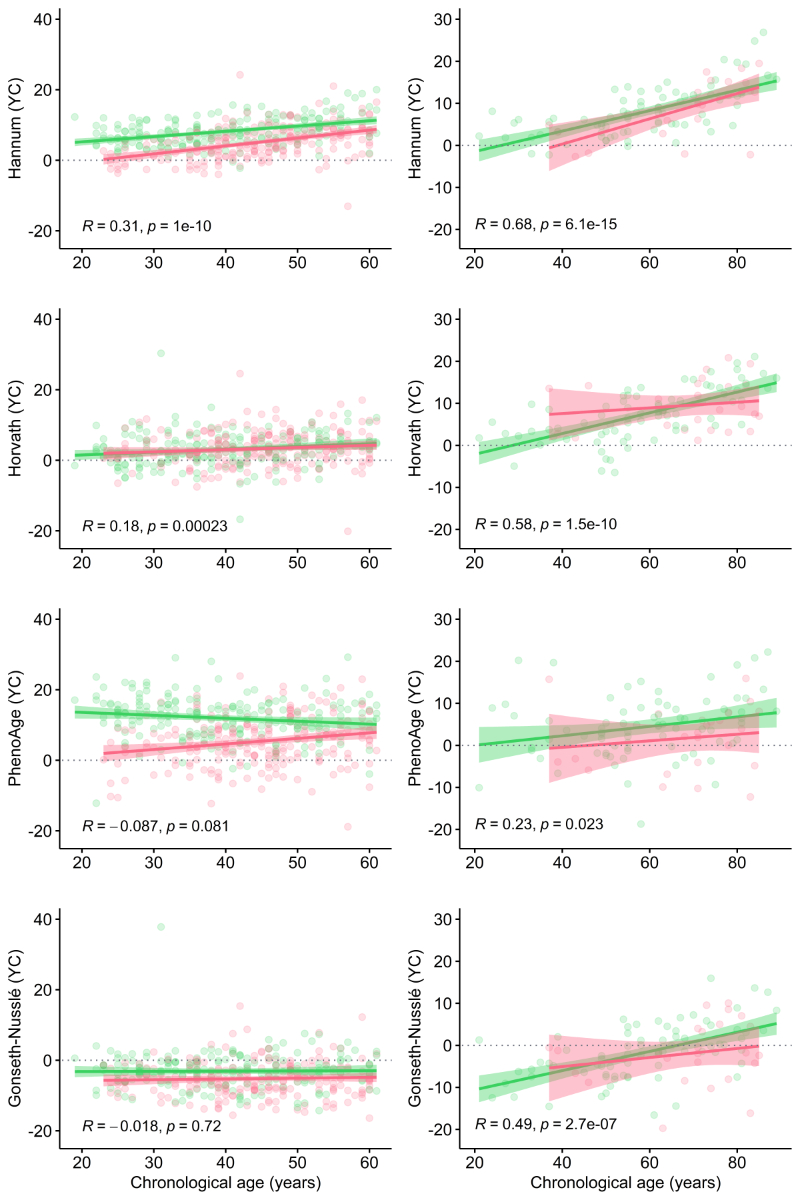
Figure 1 Correlation between youth capital
and chronological age. Plots depict the correlation between measures of youth
capital (y-axis) and chronological age (x-axis) (assessed using Spearman’s rank
correlation coefficient). Plots on the left-hand side correspond to COVID-19
severity in the GSE168739 sample; plots on the right-hand side correspond to
COVID-19 severity in the GSE174818 sample. For all plots, the green line
represents less severe symptoms, and the red line represents severe
symptoms/death.
Epigenetic age and symptom severity
Improved youth capital was associated with
reduced odds of severe symptoms for the Gonseth-Nusslé, Hannum and PhenoAge measures
(OR = 0.95, 95% CI = 0.91–1.00; OR = 0.81, 95% CI = 0.75–0.86; and OR = 0.85,
95% CI = 0.81–0.88, respectively), albeit not Horvath (table 2). Moreover,
when adjusting for age and sex, the PhenoAge youth capital was associated with reduced
odds of COVID-associated mortality (OR = 0.93, 95% CI = 0.86–0.99; unadjusted
OR = 0.96, 95% CI = 0.90–1.02). This association persisted when additionally
adjusting for BMI, the Charlson comorbidity index. A weak association was also
observed for Hannum’s youth capital, although not significant (p = 0.09). The epigenetic
signature (ES) for alcohol consumption, was associated with COVID-19 severity
in the GSE168739 study. For example, a one-unit increase in the ES of alcohol
consumption was associated with a 13% increased odds of severe symptoms (OR = 1.13,
95% CI = 1.05–1.23). This association remained even when adjusting for youth
capital. No lifestyle exposures were associated with COVID-associated mortality
in the GSE174818 sample.
Table 2Logistic
regression results for the association between youth capital and COVID-19
severity (GSE168739). Presented coefficients represent odds ratios
and 95% confidence intervals. COVID-19 severity is defined according to hospitalization
status (yes/no).
| |
Gonseth-Nusslé
|
Horvath
|
Hannum
|
PhenoAge
|
| Unadjusted
model |
0.92 (0.8–0.95) |
1.01 (0.97–1.05) |
0.85 (0.80–0.89) |
0.85 (0.82–0.88) |
| Adjusted
model |
Youth capital |
0.95 (0.91–1.00) |
1.00 (0.96–1.05) |
0.81 (0.75–0.86) |
0.85 (0.81–0.88) |
| Chronological age |
1.05 (1.03–1.07) |
1.05 (1.02–1.07) |
1.09 (1.06–1.13) |
1.06 (1.03–1.08) |
| Sex |
6.62 (4.17–10.71) |
7.49 (4.77–11.99) |
4.64 (2.83–7.70) |
8.07 (4.77–13.64) |
In comparison with the base model (adjusting
only for age and sex), the AUC value was significantly improved when also
including the ES of alcohol consumption and the PhenoAge youth capital estimate
(AUC = 0.79, 95% CI = 0.74–0.83 versus 0.85, 95% CI = 0.81–0.88, respectively: p <0.001)
(figure 2). At a threshold of 0.5, the base model had a sensitivity of 75.8%
and specificity of 70.4%, while the model, including the PhenoAge youth capital
and the ES for alcohol consumption had a sensitivity of 80.4% and specificity
of 80.8%. Finally, the inclusion of the epigenetic signature for alcohol
consumption and the PhenoAge youth capital with the EPICOVID signature improved
the model performance (AUC = 0.94, 95% CI = 0.91–0.96 versus AUC = 0.95, 95% CI
= 0.93–0.97; p = 0.01).
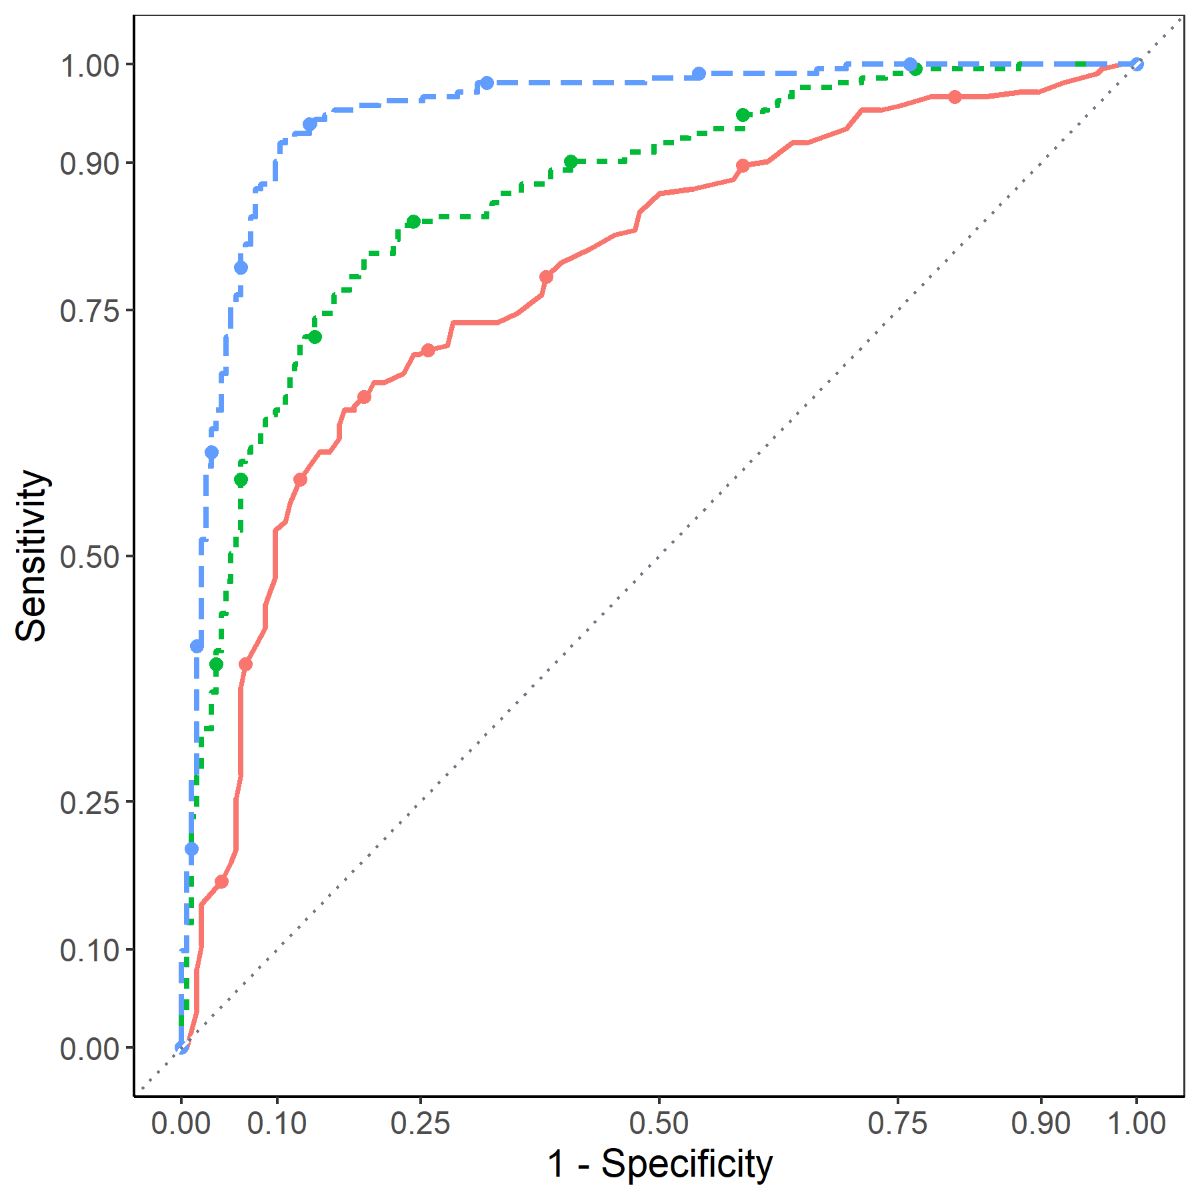
Figure 2 ROC curves for COVID-19 severity
discrimination (GSE168739). The orange, solid line corresponds to the base
model (age and sex); the green, short-dashed line corresponds to the model
adjusting for age, sex, the epigenetic signature for alcohol and PhenoAge youth
capital; the blue, dashed line corresponds to the model adjusting for age, sex,
the epigenetic signature for alcohol consumption, PhenoAge youth capital, and
the EPICOVID signature.
Discussion
All
measures of epigenetic age, except for the Horvath signature, were associated
with COVID-19 symptom severity. However, the association across
individual epigenetic signatures was not homogenous, as a stronger association
with COVID-19 severity was observed for both the Hannum and PhenoAge
signatures. The inclusion of PhenoAge youth capital and the EpiAlc signature
alongside the age, sex, and the EPICOVID signature modestly improved the
predictive capacity for COVID-19 severity. Finally, only the PhenoAge-based
measure of youth capital was associated with an elevated COVID-related
mortality.
The results
from the present study support evidence for an association between epigenetic
age and COVID-19-related outcomes. The observed variation in the strength of association across epigenetic signatures likely reflects
differences in how the individual signatures were developed, but may also capture
different aging processes [24]. For instance, the epigenetic age
signature by Horvath et al. was
developed using 51 different tissue and cell types and a 27k DNA methylation
array, uses 353 age-associated CpG sites, and was optimized to measure
chronological age [25]. In contrast, Hannum et al. used blood-derived DNA, an Illumina
450k micro-array platform, and subsequently identified 71 CpG sites associated
with chronological age [17]. Gonseth-Nusslé et al. similarly used blood-derived DNA, but used an EPIC 850k
micro-array platform, and identified chronological age-associated CpGs (n = 11)
that were conditional on maximizing the contribution by epigenetic signatures
of lifestyle exposures (patent reference: EP 22 162 216.0). Of the epigenetic
signatures included in the present study, the DNAm PhenoAge signature is the
only one that specifically incorporated measures of inflammation and immune
system reactivity in its initial creation [19]. Recent
evidence has pointed towards a so-called cytokine storm to be at the root of
severe COVID-19 outcomes [26]. To this effect, age-associated changes
to the immune system modify the immune response, particularly contributing to over
activity, which may help to explain the worse COVID-19 symptomology observed
among the elderly [26]. This could, in turn, explain why the DNAm PhenoAge signature – but
not the other signatures – was associated with COVID-related mortality. Importantly,
recent evidence based on Mendelian
Randomization techniques suggests that epigenetic age does not lead to
increased COVID-19 severity [27].
Epigenetic age is not sufficient to triage
patients in the hospital as it is not as effective as the EPICOVID signature or
interferon-based detection tests [28]. However, these signatures could serve to
inform prevention efforts aimed at lifestyle management to prevent severe
COVID-19 symptomology [29]. To this
effect, the Gonseth-Nusslé signature
also represents a convenient way of capturing the impact of exposure to
lifestyle even when these exposures have not been adequately assessed in a
given study. Recently, promising results have demonstrated
the reversibility of epigenetic age. For
example, a randomized clinical trial that targeted sleep, diet, physical
activity, stress, and the gut microbiome found that at the end of the 8-week
treatment program, participants in the intervention arm reduced their epigenetic
age (measured using the Horvath signature) by an average of nearly two years [30]. Another clinical study targeted epigenetic
age by repurposing pharmacological therapies, and administering
individual-based doses of rhGH, DHEA, and metformin [31]. At the end of a 1-year study protocol,
epigenetic age was reduced by an average of 2.5 years; an effect that persisted
for up to six months post-study [31].
Unfortunately, considering the very small sample size (n = 10), further
validation is needed. Targeting epigenetic modifications associated with
COVID-19 severity could also inform the development of medications (e.g.,
“epidrugs”) to limit the severity of symptoms or in the identification of
currently existing drug therapies that could be repurposed for tertiary
prevention (i.e., the reduction of symptom severity) [32]. Finally, while DNA methylation techniques
based on microarrays remain expensive and slow, emerging techniques – such as
nanopore sequencing – could accelerate DNA methylation sequencing for use in a
triage setting [33].
Strengths and limitations
The present study uses two separate,
publicly available datasets to investigate the association between epigenetic
age and COVID-19 severity. Both included studies were restricted to individuals
identified in a hospital setting with COVID-19 diagnosis. The GSE168739 sample
excluded individuals who smoked tobacco, presented with comorbidities (e.g.,
BMI ³30), and were 61 years of age or older at time of inclusion. Results
are thus not generalizable to the broader general population, particularly
those known to be at higher risk of experiencing more severe COVID-19
symptomology. Furthermore, given the restriction to non-smokers it was not
possible to investigate the contribution of tobacco consumption to COVID-19
severity. However, although there was no evidence for an association between
the epigenetic signature of tobacco consumption and symptom severity in the GSE174818
sample, this could be due to the limited power to detect small effect sizes.
Finally, the restriction of the GSE168739 sample to a population without known
risk factors for COVID-19 severity, but also disease in the general population,
may have contributed to the weaker association between the Gonseth-Nusslé
epigenetic age and COVID-19 symptom severity.
In comparison to other epigenetic ages, the
Gonseth-Nusslé estimated overall poorer youth capital, while the epigenetic age
estimated using Hannum’s signature was overall younger. Such global differences
could be influenced by platform effects, insomuch that the Hannum score was
built based on a 450K assay, while the Gonseth-Nusslé score was based on the
850K EPIC assay. Moreover, while epigenetic age measures may capture different underlying
aging processes, estimates of epigenetic age may be subject to measurement
error or survivor bias, particularly among the elderly. El Khoury et al. recently demonstrated the systematic
underestimation of epigenetic age among the elderly [22]. In theory,
if such an effect is not present, youth capital should remain uncorrelated with
chronological age; in the present study, although the Hannum signature was most
strongly associated with COVID-19 severity in the GSE168739 sample, youth
capital was also correlated with chronological age; demonstrating a dependence
on chronological age (R2 = 0.3). In contrast, youth capital remained
weakly associated with chronological age when measured using the Gonseth-Nusslé
or PhenoAge signatures (R2 = 0.02 and 0.07, respectively). Another
limitation of the present study is the lack of longitudinal measures of epigenetic
age. It is thus unclear whether factors external to epigenetic age influence
COVID-19 severity, which subsequently increases epigenetic age, or whether
higher epigenetic age prior to infection plays a role in disease severity. Contributing
to this incertitude, the stability of epigenetic mechanisms and signatures of
epigenetic age is not well understood. Finally, it is necessary to note that
the analyses included within this study are secondary analyses based on
datasets that have additionally been used in two prior publications[34,35].
Complementing the results of these previous publications, this study
investigates novel signatures of epigenetic age, tobacco, and alcohol
consumption in association with COVID-19 outcomes.
Conclusions
Consideration of epigenetic age does not
meaningfully improve the prediction of COVID-19 severity, but is a potentially
useful tool in primary prevention, particularly as an incentive towards
lifestyle changes that target reducing the risk of severe COVID-19 symptoms. Therefore,
the development and extension of epigenetic-based tools towards routine
clinical care should be encouraged, particularly in the context of chronic
disease prevention. Unfortunately, the results from the present study cannot
disentangle the relationship between COVID-19 severity and epigenetic age. To
address this limitation, longitudinal studies are required to understand the
interplay between epigenetic age and COVID-19 severity.
Availability of data and materials
The datasets analyzed during the current
study are available in the GEO Accession repository:
GSE174818[13]:
https://www.ncbi.nlm.nih.gov/geo/query/acc.cgi?acc = GSE174818
GSE168739[14]:
https://www.ncbi.nlm.nih.gov/geo/query/acc.cgi?acc = GSE168739
Statistical code and the epigenetic signatures
described in this study (that is, those created by genknowme) are available
upon request for non-commercial use by contacting genknowme at
labo[at]genknowme.com.
Acknowledgements
We would like to extend a special thank you to Sylvain Pradervand
for
supporting data management questions and issues that arose during the
preparation of this manuscript.
Authors'
contributions: JDC:
Conceptualization, methodology, formal analysis, writing – Original draft, MB: Investigation, writing – review &
editing, SB and SGN: writing – review & editing, supervision,
funding acquisition.
Jonviea D. Chamberlain
Département Epidémiologie et
Systèmes de Santé
Route de la Corniche 10
CH-1010 Lausanne
jonviea.chamberlain[at]unisante.ch
References
1.
Wolff D
,
Nee S
,
Hickey NS
,
Marschollek M
. Risk factors for Covid-19 severity and fatality: a structured literature review. Infection. 2021 Feb;49(1):15–28. https://doi.org/10.1007/s15010-020-01509-1
2.
Pereira NL
,
Ahmad F
,
Byku M
,
Cummins NW
,
Morris AA
,
Owens A
, et al.
COVID-19: Understanding Inter-Individual Variability and Implications for Precision Medicine. Mayo Clin Proc. 2021 Feb;96(2):446–63. https://doi.org/10.1016/j.mayocp.2020.11.024
3.
COVID-19 Host Genetics Initiative
. Mapping the human genetic architecture of COVID-19. Nature. 2021 Dec;600(7889):472–7. https://doi.org/10.1038/s41586-021-03767-x
4.
Chlamydas S
,
Papavassiliou AG
,
Piperi C
. Epigenetic mechanisms regulating COVID-19 infection. Epigenetics. 2021 Mar;16(3):263–70. https://doi.org/10.1080/15592294.2020.1796896
5.
Sen R
,
Garbati M
,
Bryant K
,
Lu Y
. Epigenetic mechanisms influencing COVID-19. Genome. 2021 Apr;64(4):372–85. https://doi.org/10.1139/gen-2020-0135
6.
Lopez L
,
Sang PC
,
Tian Y
,
Sang Y
. Dysregulated Interferon Response Underlying Severe COVID-19. Viruses. 2020 Dec;12(12):E1433. https://doi.org/10.3390/v12121433
7.
Jit BP
,
Qazi S
,
Arya R
,
Srivastava A
,
Gupta N
,
Sharma A
. An immune epigenetic insight to COVID-19 infection. Epigenomics. 2021 Mar;13(6):465–80. https://doi.org/10.2217/epi-2020-0349
8.
Tan Q
. Epigenetic age acceleration as an effective predictor of diseases and mortality in the elderly. EBioMedicine [Internet]. Elsevier; 2021 [cited 2021 Nov 8];63.
9.
Peng H
,
Gao W
,
Cao W
,
Lv J
,
Yu C
,
Wu T
, et al.
Combined healthy lifestyle score and risk of epigenetic aging: a discordant monozygotic twin study. Aging (Albany NY). 2021 May;13(10):14039–52. https://doi.org/10.18632/aging.203022
10.
de Prado-Bert P
,
Ruiz-Arenas C
,
Vives-Usano M
,
Andrusaityte S
,
Cadiou S
,
Carracedo Á
, et al.
The early-life exposome and epigenetic age acceleration in children. Environ Int. 2021 Oct;155:106683. https://doi.org/10.1016/j.envint.2021.106683
11.
Phillips N
. The coronavirus is here to stay - here’s what that means. Nature. 2021 Feb;590(7846):382–4. https://doi.org/10.1038/d41586-021-00396-2
12.
Castro de Moura M
,
Davalos V
,
Planas-Serra L
,
Alvarez-Errico D
,
Arribas C
,
Ruiz M
, et al.
Epigenome-wide association study of COVID-19 severity with respiratory failure. EBioMedicine. 2021 Apr;66:103339. https://doi.org/10.1016/j.ebiom.2021.103339
13.
Balnis J
,
Madrid A
,
Hogan KJ
,
Drake LA
,
Chieng HC
,
Tiwari A
, et al.
Blood DNA methylation and COVID-19 outcomes. Clin Epigenetics. 2021 May;13(1):118. https://doi.org/10.1186/s13148-021-01102-9
14.
Castro de Moura M
,
Davalos V
,
Planas-Serra L
,
Alvarez-Errico D
,
Arribas C
,
Ruiz M
, et al.
Epigenome-wide association study of COVID-19 severity with respiratory failure. EBioMedicine. 2021 Apr;66:103339. https://doi.org/10.1016/j.ebiom.2021.103339
15.
Bolstad BM
,
Irizarry RA
,
Astrand M
,
Speed TP
. A comparison of normalization methods for high density oligonucleotide array data based on variance and bias. Bioinformatics. 2003 Jan;19(2):185–93. https://doi.org/10.1093/bioinformatics/19.2.185
16.
Lehne B
,
Drong AW
,
Loh M
,
Zhang W
,
Scott WR
,
Tan ST
, et al.
A coherent approach for analysis of the Illumina HumanMethylation450 BeadChip improves data quality and performance in epigenome-wide association studies. Genome Biol. 2015 Feb;16(1):37. https://doi.org/10.1186/s13059-015-0600-x
17.
Hannum G
,
Guinney J
,
Zhao L
,
Zhang L
,
Hughes G
,
Sadda S
, et al.
Genome-wide methylation profiles reveal quantitative views of human aging rates. Mol Cell. 2013 Jan;49(2):359–67. https://doi.org/10.1016/j.molcel.2012.10.016
18.
Horvath S
,
Raj K
. DNA methylation-based biomarkers and the epigenetic clock theory of ageing. Nat Rev Genet. 2018 Jun;19(6):371–84. https://doi.org/10.1038/s41576-018-0004-3
19.
Levine ME
,
Lu AT
,
Quach A
,
Chen BH
,
Assimes TL
,
Bandinelli S
, et al.
An epigenetic biomarker of aging for lifespan and healthspan. Aging (Albany NY). 2018 Apr;10(4):573–91. https://doi.org/10.18632/aging.101414
20.
Alwan H
,
Pruijm M
,
Ponte B
,
Ackermann D
,
Guessous I
,
Ehret G
, et al.
Epidemiology of masked and white-coat hypertension: the family-based SKIPOGH study. PLoS One. 2014 Mar;9(3):e92522. https://doi.org/10.1371/journal.pone.0092522
21.
Stoltzfus JC
. Logistic regression: a brief primer. Acad Emerg Med. 2011 Oct;18(10):1099–104. https://doi.org/10.1111/j.1553-2712.2011.01185.x
22.
El Khoury LY
,
Gorrie-Stone T
,
Smart M
,
Hughes A
,
Bao Y
,
Andrayas A
, et al.
Systematic underestimation of the epigenetic clock and age acceleration in older subjects. Genome Biol. 2019 Dec;20(1):283. https://doi.org/10.1186/s13059-019-1810-4
23.
RStudio Team
. RStudio: Integrated Development Environment for R [Internet]. Boston, MA: RStudio, PBC; 2020. Available from: http://www.rstudio.com/
24.
Gibson J
,
Russ TC
,
Clarke TK
,
Howard DM
,
Hillary RF
,
Evans KL
, et al.
A meta-analysis of genome-wide association studies of epigenetic age acceleration. PLoS Genet. 2019 Nov;15(11):e1008104. https://doi.org/10.1371/journal.pgen.1008104
25.
Horvath S
. DNA methylation age of human tissues and cell types. Genome Biol. 2013;14(10):R115. https://doi.org/10.1186/gb-2013-14-10-r115
26.
Nidadavolu LS
,
Walston JD
. Underlying Vulnerabilities to the Cytokine Storm and Adverse COVID-19 Outcomes in the Aging Immune System. J Gerontol A Biol Sci Med Sci. 2021 Feb;76(3):e13–8. https://doi.org/10.1093/gerona/glaa209
27.
Xu W
,
Zhang F
,
Shi Y
,
Chen Y
,
Shi B
,
Yu G
. Causal association of epigenetic aging and COVID-19 severity and susceptibility: A bidirectional Mendelian randomization study. Front Med (Lausanne). 2022 Sep;9:989950. https://doi.org/10.3389/fmed.2022.989950
28.
Lopez J
,
Mommert M
,
Mouton W
,
Pizzorno A
,
Brengel-Pesce K
,
Mezidi M
, et al.
Early nasal type I IFN immunity against SARS-CoV-2 is compromised in patients with autoantibodies against type I IFNs [Internet]. J Exp Med. 2021 Oct;218(10):e20211211. [cited 2021 Sep 13] https://doi.org/10.1084/jem.20211211
29.
Declerck K
,
Vanden Berghe W
. Back to the future: epigenetic clock plasticity towards healthy aging. Mech Ageing Dev. 2018 Sep;174:18–29. https://doi.org/10.1016/j.mad.2018.01.002
30.
Fitzgerald KN
,
Hodges R
,
Hanes D
,
Stack E
,
Cheishvili D
,
Szyf M
, et al.
Potential reversal of epigenetic age using a diet and lifestyle intervention: a pilot randomized clinical trial. Aging (Albany NY). 2021 Apr;13(7):9419–32. https://doi.org/10.18632/aging.202913
31.
Fahy GM
,
Brooke RT
,
Watson JP
,
Good Z
,
Vasanawala SS
,
Maecker H
, et al.
Reversal of epigenetic aging and immunosenescent trends in humans. Aging Cell. 2019 Dec;18(6):e13028. https://doi.org/10.1111/acel.13028
32.
Ganesan A
,
Arimondo PB
,
Rots MG
,
Jeronimo C
,
Berdasco M
. The timeline of epigenetic drug discovery: from reality to dreams. Clin Epigenetics. 2019 Dec;11(1):174. https://doi.org/10.1186/s13148-019-0776-0
33.
Schatz MC
. Nanopore sequencing meets epigenetics. Nat Methods. 2017 Mar;14(4):347–8. https://doi.org/10.1038/nmeth.4240
34.
Franzen J
,
Nüchtern S
,
Tharmapalan V
,
Vieri M
,
Nikolić M
,
Han Y
, et al.
Epigenetic clocks are not accelerated in COVID-19 patients [Internet]. 2020 Nov p. 2020.11.13.20229781. https://doi.org/10.1101/2020.11.13.20229781
35.
Cao X
,
Li W
,
Wang T
,
Ran D
,
Davalos V
,
Planas-Serra L
, et al.
Accelerated biological aging in COVID-19 patients. Nat Commun. 2022 Apr;13(1):2135. https://doi.org/10.1038/s41467-022-29801-8
Appendix

Figure S1 Correlation between chronological age and epigenetic ages (Horvath, Hannum, and Gonseth-Nusslé). Plots A-C correspond to COVID-19 severity in the GSE168739 sample; D-E correspond to COVID-19 severity in the GSE174818 sample. For all plots, the blue line represents less severe symptoms, and the red line represents severe symptoms/death.

Figure S2 Youth capital stratified by
categories of age and severity. Legend: Red boxplot corresponds to youth
capital calculated using the Gonseth-Nusslé signature; green to those
calculated with Hannum signature; teal to Horvath signature; and purple to the
youth capital when using PhenoAge signature.