Optimising the current model of care for knee osteoarthritis with the implementation of guideline recommended non-surgical treatments: a model-based health economic evaluation
DOI: https://doi.org/https://doi.org/10.57187/smw.2023.40059
Thomas
Vetscha, Jan
Taeymansab, Nathanael
Lutzab
a Department
of Health, Bern University of Applied Sciences, Discipline of Physiotherapy, Bern, Switzerland
b Faculty
of Sports and Rehabilitation Sciences, Vrije Universiteit Brussel, Brussels, Belgium
Summary
AIMS OF THE
STUDY: Structured exercise, education, weight management and painkiller
prescription are guideline recommended non-surgical treatments for
patients suffering from knee osteoarthritis. Despite its endorsement,
uptake of guideline recommended non-surgical treatments remains low. It is unknown whether the implementation of these treatments
into the current model of care for knee osteoarthritis would be cost-effective
from a Swiss statutory healthcare perspective. We therefore aimed to (1) assess
the incremental cost-effectiveness ratio of an optimised model of care incorporating guideline recommended non-surgical treatments in adults with knee osteoarthritis and (2) the effect of total
knee replacement (TKR) delay with guideline recommended non-surgical treatments on the cost-effectiveness of the overall
model of care.
METHODS: A
Markov model from the Swiss statutory healthcare perspective was used to
compare an optimised model of care incorporating guideline recommended non-surgical treatments
versus the current model of care without standardised guideline recommended non-surgical treatments. Costs were derived
from two Swiss health insurers, a national database, and a reimbursement
catalogue. Utility values and transition probabilities were extracted from
clinical trials and national population data. The main outcome was the incremental
cost-effectiveness ratio for three scenarios: “base case” (current model of care vs optimised model of care with no delay of total knee replacement), “two-year delay” (current model of care vs optimised model of care +
two-year delay of total knee replacement) and “five-year delay” (current model of care vs optimised model of care +
five-year delay of total knee replacement). Costs and utilities were discounted
at 3% per year and a time horizon of 70 years was chosen. Probabilistic
sensitivity analyses were conducted.
RESULTS: The
“base case” scenario led to 0.155 additional quality-adjusted life years (QALYs)
per person at an additional cost per person of CHF 341 (ICER = CHF 2,203 / QALY
gained). The “two-year delay” scenario led to 0.134 additional QALYs and CHF –14 cost per person. The “five-year delay” scenario led to 0.118 additional QALYs
and CHF –501 cost per person. Delay of total knee replacement by two and five
years led to an 18% and 36% reduction of revision surgeries, respectively, and
had a cost-saving effect.
CONCLUSION:
According to this Markov model, the optimisation of the current model of care
by implementing guideline recommended non-surgical treatments would likely be
cost-effective from a statutory healthcare perspective. If implementing guideline recommended non-surgical treatments delays
total knee replacement by two or five years, the amount of revision surgeries may
be reduced.
Introduction
Knee osteoarthritis is a painful
condition that leads to loss of function and is one of the most common reasons
for disability worldwide [1]. With an estimated overall prevalence of 8.5% and
an attribution to 5,150 disability-adjusted life years in 2019 in Switzerland, knee
osteoarthritis places a substantial burden on health and the healthcare system
[2]. The economic burden of knee osteoarthritis on the Swiss statutory healthcare
system was estimated at 1.12 billion CHF in 2011 [3]. The association of
osteoarthritis with reduced physical activity levels may promote frailty and/or
cardiovascular disease in the aging population, which negatively affects
overall health [4].
Current treatment guidelines recommend
non-surgical and surgical treatments for patients suffering from knee
osteoarthritis [5, 6]. When non-surgical treatment fails to achieve sufficient
symptom relief, total knee replacement (TKR) is endorsed [7]. Even though total knee replacement was
shown to be highly effective in patients with moderate to severe knee osteoarthritis [8], up to
30% of the operated patients experienced chronic pain after the procedure [9].
Additionally, total knee replacement is associated with adverse events and
implants have a limited lifespan leading to implant failure and subsequent revision
surgery, which is associated with high costs and less favourable outcomes [10].
The younger the patient who receives a total knee replacement, the higher the
risk of revision surgery is in his/her lifetime [11].
Guideline recommended non-surgical
treatments are exercise, education about self-management strategies,
weight reduction if indicated, painkiller prescription and insoles [5]. Albeit
recommended, uptake of guideline recommended non-surgical treatments remains low in clinical practice. Less than 40% of knee
osteoarthritis patients receive appropriate non-surgical care in the U.S. [12].
It is currently unknown what proportion of knee osteoarthritis patients receive guideline recommended non-surgical treatments in
Switzerland. As of 2019, physiotherapists can be certified as GLA:D©
therapists, a certification course that trains therapists in the delivery of guideline recommended non-surgical treatments
[13]. By the end of 2022, around 700 therapists had completed this course. With
more than 11,000 licensed physiotherapists in Switzerland [14], this is a small
proportion and the need for such a certification course may be seen as evidence
that the uptake of guideline recommended non-surgical treatments is still low in Switzerland.
A recent systematic review by Mazzei et al.
[15] including 23 health economic evaluations concluded that guideline
recommended non-surgical treatments are cost-effective and implementation should
be encouraged. The authors commented that cost-effectiveness, from a healthcare
perspective, may be underestimated if guideline recommended non-surgical treatments delay total knee replacement. Even
though there is some evidence that guideline recommended non-surgical treatments can delay total knee replacement in
eligible patients [16, 17], more research is needed to draw any firm
conclusions. Yet, it seems plausible that the delay of total knee replacement through guideline recommended non-surgical treatments is
possible and the cost-effectiveness may be even greater when analysed in the context
of total knee replacement delay as this likely reduces the amount of revision surgeries needed
[11].
Considering the potential effect of guideline
recommended non-surgical treatments in delaying total knee replacement and the
insufficient implementation of guideline recommended non-surgical treatments in the current model of care for knee
osteoarthritis in Switzerland, the aim of this health economic evaluation was
to answer the following research questions:
- Is a model of care optimised by
the implementation of guideline recommended non-surgical treatments cost-effective
from a Swiss statutory healthcare perspective?
- What is the effect of total
knee replacement delay by guideline recommended non-surgical treatments on the
cost-effectiveness?
Methods
Overview and model
We report this health economic evaluation according
to the Consolidated Health Economic Evaluation Reporting Standards [18] and have
constructed a Markov model following the recommendations of the International
Society for Pharmacoeconomic and Outcome Research [19]. Effectiveness
(expressed as quality-adjusted life years [QALYs]), treatment costs, and
transition probabilities have been determined for two model of care consisting
of surgical and non-surgical treatments for knee osteoarthritis: A) the current
model of care in which non-surgical treatment primarily consists of
painkillers and written advice and B) an optimised model of care in
which guideline recommended non-surgical treatments are implemented.
We coded a state-transition Markov model in
RStudio (Version 1.3.1093) [20]. Data manipulation and plots were realised
using the “tidyverse” package (Version 1.3.0) [21]. The model represents the various states for patients
with knee osteoarthritis in the healthcare system. A major advantage of using Markov modelling is that it encompasses the whole
lifetime of each patient allowing us to implement delays
with so called “tunnel states” [22]. The structure of the developed model is
based on previously published studies [23–25].
Figure 1 depicts a detailed description of
the model. We conducted the analysis from the statutory Swiss healthcare perspective.
Outcomes were reported as incremental cost-effectiveness ratio which
describes the additional costs per quality-adjusted life year gained. The cycle
time was defined as one year with a time horizon of 70 years which is
considered lifelong.
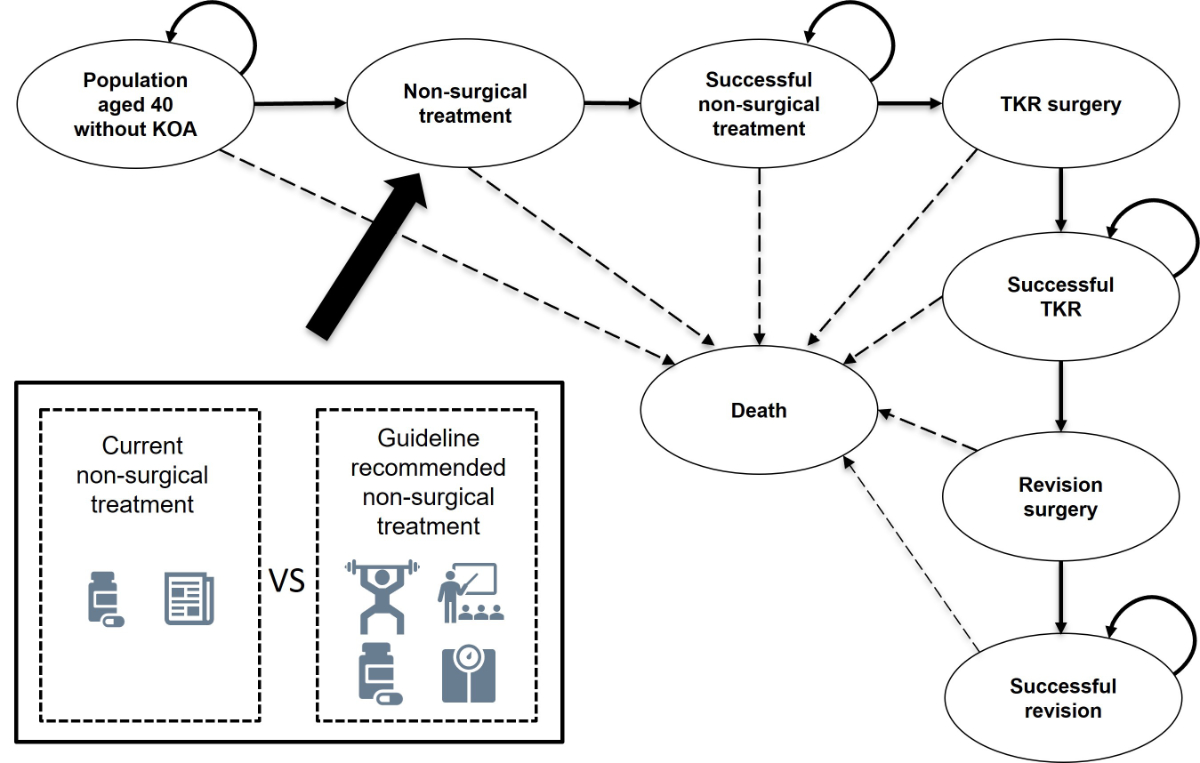
Figure 1 Conceptualisation
of the proposed Markov model visualising the current model of care and
the proposed optimised model of care. The difference between current model of care and the optimised model of care is the addition of more extensive guideline recommended non-surgical
treatments. By evaluating the cost-effectiveness of the whole model of
care the dynamics between the surgical and non-surgical treatments can be
investigated. In our scenario analysis, we analysed the effect a delay of total
knee replacement (TKR) by guideline recommended non-surgical treatments by two and five years on the cost-effectiveness
of the whole model of care. The delay of TKR is modelled by adding tunnel
states after “Successful non-surgical care”. For Switzerland a “willingness to
pay” threshold of 100,000 CHF was considered.
CHF: Swiss francs; KOA: knee osteoarthritis
Based on a health economic evaluation conducted
in the context of Switzerland [26], we decided to apply a discount rate of 3%
to costs and health-utilities gained starting from the second year and a
willingness to pay threshold of CHF 100,000.
No study protocol was registered or published.
Patient population
The population of interest were individuals
at risk of developing symptomatic radiographic-confirmed knee osteoarthritis
living in Switzerland aged 40 years in 2019. We chose this starting age because
the prevalence of knee osteoarthritis in patients younger than 40 is very low [27]. Absolute population
numbers were derived from the Swiss Federal Statistics database from 2019 [28].
Cost data
Because the statutory healthcare
perspective was chosen for this health economic evaluation, only direct costs
were considered while indirect costs and intangible costs were omitted. Cost
data were calculated using the following formula: Cost = unit consumed x unit price
(i.e., non-aggregated form). Costs were expressed in 2019 Swiss francs.
Non-surgical treatments for knee
osteoarthritis are delivered in an outpatient setting. Outpatient costs are listed
by the physician outpatient services catalogue, which is used for the
reimbursement of individual statutory healthcare services in Switzerland [29].
Because of Swiss privacy legislation, it is not possible to link individual
healthcare services to a diagnosis. Nevertheless, to estimate the costs
attributed to outpatient treatments we contacted various clinical experts (orthopaedic
surgeons, physicians, physiotherapists). The costs accumulated during the time
individuals were successfully treated with non-surgical measures, reflected by
the “Successful non-surgical treatment” state, were based on expert opinion.
Surgical treatments (total knee replacement
and revision surgery) are delivered in an inpatient setting. Unlike outpatient
treatments, inpatient reimbursement is regulated by “diagnosis related groups”
(DRG). DRGs are classifications of specific case groups based on diagnoses and
treatments. Reimbursements are paid as a flat rate depending on diagnosis, of
which publicly accessible databases are available [30]. To separate costs
related to total knee replacement versus revision surgery we used insurance claims
provided by two health insurance providers, which together hold a market share
of 14.4% (i.e., 1,226,535 individuals in Switzerland in 2019 [31]). DRG code
I43C was used to calculate costs related to total knee replacement while
revision surgery costs were retrieved through DRG codes I04A, I04B, I43A and
I43B. We made assumptions regarding the cost incurring after total knee
replacement and revision surgery, reflected by “Successful TKR” and “Successful revision” states. Table 1 provides an overview of
the costs used in the model. A detailed description of the cost estimation can
be found in Appendix 1.
Table 1Overview of cost data used in the model. For both, optimised model
of care and current model of care, clinical experts were contacted
to make valuation assumptions. When available, data was drawn from
health-insurance claims. Costs described under “Successful non-surgical
treatment” reflect statutory healthcare spending that occurs in the state when
patients are successfully managed with non-surgical care and are therefore
lower than the intervention costs which only are applied for one year. All
costs are occurring in one year and are expressed in 2019 Swiss francs (CHF).
|
State
|
Source
|
Current model of care
|
Source
|
Optimised model of care
|
| Non-surgical treatment |
Health insurance claims |
CHF 222 |
Health insurance claims |
CHF 1,209 |
| Successful non-surgical treatment |
Expert opinion |
CHF 200 |
Expert opinion |
CHF 200 |
| TKR surgery |
Health insurance claims |
CHF 18,326 (SD = CHF 1,606, SE =
CHF 46) |
Health insurance claims |
CHF 18,326 (SD = CHF 1,606, SE =
CHF 46) |
| Successful TKR |
Expert opinion |
CHF 500 |
Expert opinion |
CHF 500 |
| Revision surgery |
Health insurance claims |
CHF 28,776 (SD = CHF 6,436, SE =
CHF 536) |
Health insurance claims |
CHF 28,776 (SD = CHF 6,436, SE =
CHF 536) |
| Successful revision |
Expert opinion |
CHF 500 |
Expert opinion |
CHF 500 |
Utility data
To represent utilities for successful
non-surgical treatment, we used data from a randomised controlled trial (RCT)
that reported data calculated for Denmark [32]. We decided to use data from
this trial because it resembled the treatment regimens used in our models and
Denmark, like Switzerland, is a western high-income country. In this trial,
patients (n = 100) with symptomatic knee osteoarthritis and
radiographic confirmed knee OA (Kellgren&Lawrence score ≥1) not eligible
for total knee replacement were either randomised to current non-surgical care (painkiller prescription, written/oral
advice) or guideline recommended non-surgical treatments (exercise, dietary
intervention, insoles, painkillers, education classes). The proportion of women
was 51% and mean age of the total sample was 66 years (SD 8.9 years). During
the follow-up of 12 months, health utilities were assessed using the EuroQol
5-Dimensions 5-Levels (EQ5D-5L) questionnaire for both groups. At the end of
the follow-up, health utility gains of the guideline recommended non-surgical treatments-group were higher (+0.125)
compared to the usual care group (+0.091). We used these values for the “Successful
non-surgical treatment” state for the current model of care and the optimised model of care,
respectively, in our model.
For total knee replacement and revision
surgery, another RCT from the same research group was used to extract health utility
data for successful total knee replacement [16]. In this trial, patients (n = 100)
eligible for total knee replacement (pain and Kellgren & Lawrence score ≥2)
were either randomised to immediate total knee replacement or a period of guideline
recommended non-surgical treatments with the option of total knee replacement at any time. The
proportion of women was 62% and mean age of the total sample was 66.4 years (SD
= 8.7). Health utilities were reported for both groups after a follow-up period
of 24 months using the EQ5D-5L. Quality-adjusted life year values of the total knee replacement
group after 12 months were extracted and imputed in the model as health utility
value of the “Successful TKR” state.
The health utilities (using EQ5D-5L) for “Revision
surgery” were derived from a study that gathered follow-up data of patients (n
= 5,398) receiving revision surgery in a hospital in New York, USA [33]. During
the year of surgery, we assumed patients to have baseline utilities as mobility
is usually severely restricted during the first months after surgery. Table 2
depicts utility values used in the model.
Table 2Overview of utility values used in the
model. The utility for successful non-surgical treatment differs between
current model of care and optimised model of care. In the optimised model of care,
guideline recommended non-surgical treatments results in a higher
treatment effect [32]. All other utility values remain the same for the current model of care and the optimised model of care.
|
State
|
Current model of care
|
Optimised model of care
|
| Non-surgical treatment [32] |
0.658 |
0.658 |
| Successful non-surgical treatment[32] |
+0.091 (SD = 0.158, SE = 0.025) |
+0.125 (SD = 0.108, SE = 0.017) |
| TKR surgery |
0.658 |
0.658 |
| Successful TKR [16] |
+0.22 (SD = 0.151, SE = 0.024) |
+0.22 (SD = 0.151, SE = 0.024) |
| Revision surgery |
0.658 |
0.658 |
| Successful revision [33] |
+0.102 |
+0.102 |
Transition probabilities
The first state in our model accounts for
all males and females living in Switzerland aged 40 years in 2019 without
symptomatic knee osteoarthritis. Pooled global incidence for symptomatic
radiographically confirmed knee osteoarthritis was reported as 0.02% per year in individuals
aged over 20 years [27]. This incidence was used for all ages and for males and
females. Using the incidence, the annual number of individuals making the
transition from the general population to non-surgical treatment because of the
development of knee osteoarthritis was calculated. It was assumed that persons with symptomatic
knee osteoarthritis seek help from their physician and receive non-surgical
care. The same transition probability for non-surgical treatment was used for current
model of care and optimised model of care.
We calculated age-specific probabilities
for the transition from the “Successful non-surgical treatment” state towards
the “TKR surgery” state as follows:
(1) Define the number of persons
living in Switzerland in 2019 by age group and gender.
(2) Establish the prevalence of
symptomatic radiographically confirmed knee osteoarthritis by age group and
gender for western Europe using data from the Global Burden of Disease Study
[1].
(3) Estimate the number of persons
living with symptomatic radiographically confirmed knee osteoarthritis by age group
and gender by multiplication of population at risk with prevalence.
(4) Assess the number of total knee
replacement in Switzerland in 2019 by age group and gender [34].
(5) Assess the probability for
undergoing total knee replacement by dividing the number of TKR by estimated
persons having symptomatic radiographically confirmed knee osteoarthritis:
number of total knee replacements 2019 / population 2019 ×
prevalence knee osteoarthritis
Steps 1 to 5 described above allowed us to
calculate the age and gender specific proportion of individuals with
symptomatic knee osteoarthritis who received total knee replacement in
Switzerland in 2019. These proportions were then used as model input. The obtained
transition probabilities are in line with incidence rates for total knee replacements published
elsewhere [35]. See Appendix 2 for more detail.
We used preliminary data from the “Swiss
National Hip and Knee Surgery” database (SIRIS) [34] to calculate age-specific
annual probabilities for the transition from “Successful TKR” to “Revision
surgery”. Currently, cumulative revision risks for a follow-up period of 8
years are available, which we used for our calculations. The same annual
revision probability was used for optimised model of care and current model of care model
calculations. See Appendix 3 for more detail.
For the transition probability from any
state to death, crude age-specific mortality rates in Switzerland for 2019 were
calculated using population data from the Federal Statistical Office [28] according
to the following formula:
deaths in age group (2019) / persons in age group (2019)
See Appendix 1 for more detail.
Table 3 provides an overview of all transition
probabilities used in the model.
Table 3Overview of the transition probabilities used
in the model. Age-specific probabilities were used if available.
|
Probabilities
|
Annual
probability OMOC/CMOC
|
| Population aged
40 without knee osteoarthritis |
To non-surgical
treatment [27] |
0.02 |
| To death [28] |
Age-specific
mortality CH 2019 |
| Successful
non-surgical treatment |
To total knee replacement [28, 34] |
40–44 |
0.004 |
| 45–54 |
0.008 |
| 55–64 |
0.025 |
| 65–74 |
0.049 |
| 75–84 |
0.057 |
| 85+ |
0.022 |
| To death [28] |
Age-specific
mortality CH 2019 |
| Successful TKR |
To revision [34] |
40–44 |
0.021 |
| 45–55 |
0.015625 |
| 55–64 |
0.011625 |
| 65–74 |
0.008125 |
| 75–84 |
0.005375 |
| 85+ |
0.0035 |
| To death [28] |
Age-specific
mortality CH 2019 |
|
Successful
revision |
To death [28] |
Age-specific
mortality CH 2019 |
Scenario analysis
In this health economic evaluation three different
scenarios were defined. Scenario one is described as “base case”. In this
scenario the incremental cost-effectiveness ratio for optimised model of care vs current model of
care without delay of total knee replacement has been calculated. The second
and third scenario were calculated under the assumption that guideline
recommended non-surgical treatments can delay total knee replacement by two or
by five years, respectively.
Sensitivity analysis
We evaluated model robustness by
probabilistic sensitivity analysis (PSA) with 10,000 iterations on cost and
health utility parameters. We used beta distribution for health utilities and
transition probabilities because the imputed values were not close to zero and
calculated by the method of moments [36]. For cost data we used gamma
distributions, as recommended by guidelines [36]. PSA was conducted for all
three proposed scenarios.
The developed model has been validated
technically and clinically. To ensure technical validity, two differently coded
models within RStudio were used to compare the outcomes and the coded model was
checked for errors by the last author. Clinical validation was performed by a
primary care physician, an orthopaedic surgeon and a physiotherapist specialised
in knee osteoarthritis treatments.
Results
Calculations from the model for the current
model of care resulted in CHF 4,465 cost per person and 16.92 quality-adjusted
life years per person over a period of 70 years. Calculations for optimised model of care with no
delay of total knee replacement resulted in CHF 4,806 cost per person and 17.07
QALY per person. Therefore, the “base case” scenario yielded higher costs
(+CHF 341) and higher QALY gains (+0.155) over 70 years resulting in an incremental
cost-effectiveness ratio of CHF 2,203 per additional QALY gained. This incremental
cost-effectiveness ratio falls in the north-eastern quadrant of the cost-effectiveness
plane (figure 2).
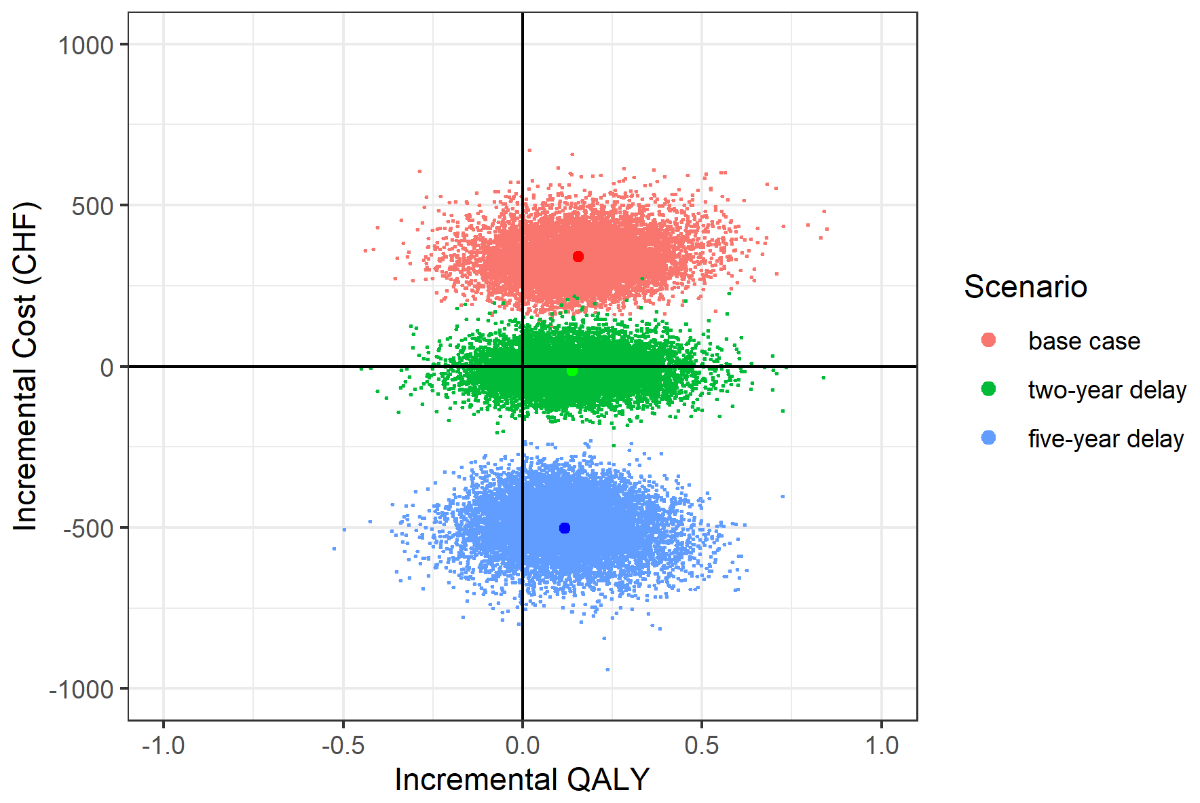
Figure 2 Cost-effectiveness
plane showing the incremental cost-effectiveness ratio for all three
scenarios and the results of the probabilistic sensitivity analysis (PSA). The
incremental cost-effectiveness ratio for the “base case” scenario equals to 2,203 CHF per quality-adjusted life
year (QALY). The other scenarios simulating a “two-year delay” and “five-year
delay” yield an incremental cost-effectiveness ratio of –101 CHF per QALY and –4,267 CHF per QALY,
respectively. The PSA was run with 10,000 iterations. Cost and utility data was
altered according to its standard errors.
CHF:
Swiss francs
In the “two-year delay” scenario cost per person
was CHF 4,451 and QUALY per person was 17.07
calculated over a period of 70 years. In comparison to the current model of
care, cost reduction was CHF –14 and quality-adjusted life year gain per person
was +0.13. The incremental cost-effectiveness ratio of the “two-year delay” equals
to CHF –101 per additional QALY gained and dominates current model of care
(figure 2).
In the “five-year delay” scenario cost per person
was CHF 3,964 and quality-adjusted life years per person was 17.03 calculated
over a period of 70 years. Comparing the “five-year delay” scenario with current
model of care, a cost reduction of CHF –501 and a QALY gain per person of +0.12
was found. The corresponding incremental cost-effectiveness ratio of the
“five-year delay scenario” equals extra CHF –4,267 per additional QALY gained
when compared to the current model of care scenario (i.e., “dominant”) and
falls in the south-eastern quadrant of the cost-effectiveness plane (Figure 2).
The computed main results are reported in table 4.
Table 4Overview of the calculated results for the three
proposed scenarios. Current model of care versus optimised model of care
without delay, with two-year delay and with five-year delay of TKR. Incremental cost-effectiveness ratio, cost and QALY are reported per person and over the modelling time horizon
of 70 years.
|
Model
|
Per
person cost
|
Per
person QALY
|
| Current model of care |
4,465 |
16.92 |
| OMOC no
delay |
4,806 |
17.07 |
| OMOC two-year
delay |
4,451 |
17.06 |
| OMOC five-year
delay |
3,964 |
17.03 |
|
Scenario
|
ICER
|
Cost
delta
|
QALY
delta
|
| Base case (CMOC vs
OMOC no delay) |
2,203 |
341 |
0.155 |
| Two-year
delay (CMOC vs
OMOC two-year delay) |
–101 |
–14 |
0.134 |
| Five-year
delay (CMOC vs
OMOC five-year delay) |
–4,267 |
–501 |
0.118 |
Figure 2 presents the results of the PSA
(10,000 iterations for each scenario) in a cost-effectiveness plane for all
scenarios. Of the simulated incremental cost-effectiveness ratios of the “base
case” scenario 15.8% fell into the south-eastern and 59.2% in the north-eastern
quadrant. For the “two-year delay” scenario 27.3% fell into the south-eastern
and 45.1% in the north-eastern quadrant, while for the “five-year delay”
scenario 79.2% fell in the south-eastern and 0% in the north-eastern quadrant.
The modelled delay of total knee
replacement by two and five years resulted in a reduction of revision surgeries
by 18% and 36%, respectively. Figure 3 depicts the number of revision surgeries
for each scenario.
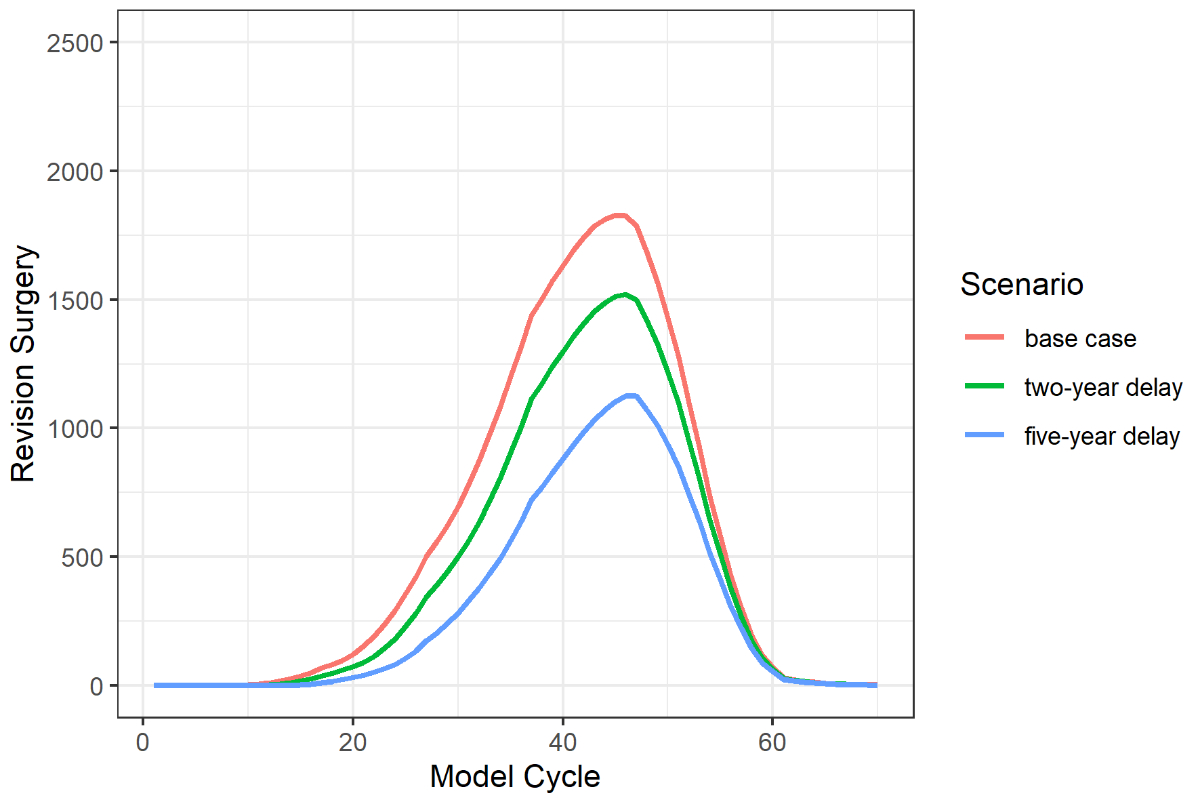
Figure 3 Number
of revision surgeries for each scenario and model cycle. The “two-year delay”
scenario and “five-year delay” scenario resulted in a reduction of revision
surgeries by 18% and 36% respectively when compared to the “base case
scenario”.
In the cost-effectiveness acceptability
analysis, we assumed a “willingness to pay” threshold of CHF 100,000 for
Switzerland [26]. Based on this threshold, the probability for cost-effectiveness
with the “base case” scenario equals 0.75, for the “two-year delay” scenario
the probability is 0.72, and the probability is 0.79 for the “five-year delay”
scenario (figure 4). All input parameters that were included in the
probabilistic sensitivity analysis are reported in table 5.
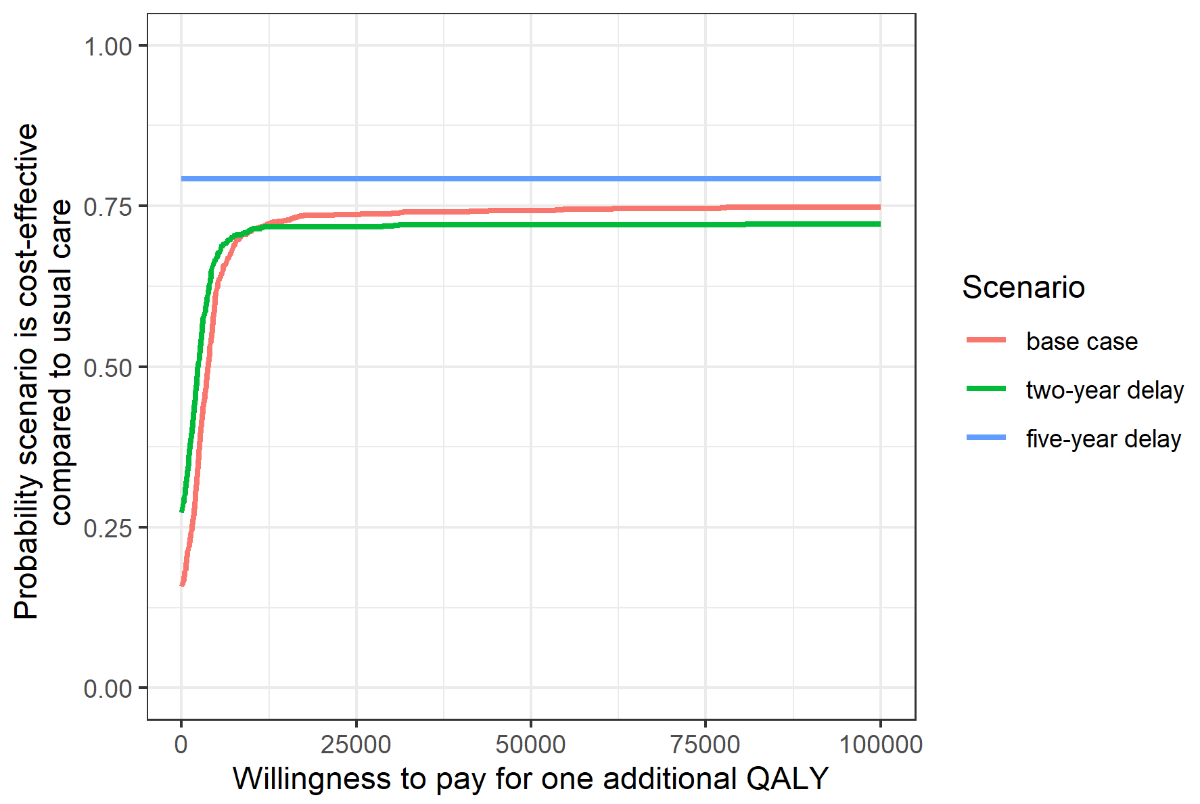
Figure 4 Cost-effectiveness
acceptability curve of the three analysed scenarios.
QALY:
quality-adjusted life year
Table 5Input
parameters included in the probabilistic sensitivity analysis (PSA) with the
distribution type applied.
| |
SD
/ SE
|
Distribution
|
| Cost
(CHF) |
TKR
surgery |
18,326 |
1,606 /
46 |
γ |
| Revision
surgery |
28,776 |
6,436 /
536 |
γ |
| Utility |
Successful
non-surgical treatment |
CMOC
0.749 |
CMOC
0.158 / 0.0246 |
β |
| OMOC
0.783 |
OMOC
0.108 / 0.0168 |
β |
| Successful
TKR |
0.878 |
0.151 /
0.023 |
β |
| Transition
probability |
Population
aged 40 without knee osteoarthritis |
|
|
|
| To
non-surgical treatment |
0.02 |
SE = 0.00510 |
β |
According to our model the lifetime
probability to develop radiographically confirmed symptomatic knee
osteoarthritis was 57% and the lifetime probability for total knee replacement
after diagnosed knee osteoarthritis was 55.7%.
Discussion
This Markov modelling study is, to the best
of our knowledge, the first to estimate the cost-effectiveness of a complete
model of care involving both non-surgical and surgical treatments for knee
osteoarthritis. We conducted model calculations for three different scenarios.
The first scenario represented the implementation of guideline recommended non-surgical treatments with no delay on total
knee replacement. The second and third scenarios represented the implementation
of guideline recommended non-surgical treatments with a delay of total knee replacement by two and five years,
respectively. The incremental cost-effectiveness ratio for the “base case” (current model of care
versus optimised model of care with no delay of total knee replacement) was extra CHF 2,203 per additional quality-adjusted
life year gained, which is highly cost-effective considering a “willingness to
pay” threshold of CHF 100,000 per QALY in Switzerland [26]. The “two-year
delay” and the “five-year delay” scenario both resulted in dominant incremental
cost-effectiveness ratios and had a cost-saving effect. In all three scenarios,
the incremental cost-effectiveness ratios were calculated over 70 years from the Swiss statutory healthcare
perspective and dominated the current model of care. The achieved QALY gains
over the modelling period are in line with other studies using a lifetime
horizon [25].
Regarding undiscounted costs per person for
each scenario, most costs were due to total knee replacement surgery (figure 5).
This is explained by the high procedure costs. Another important share of costs
was related to the “Successful non-surgical” state. Despite these costs being low,
many individuals remain in this state for a long time accumulating costs. The
effect of total knee replacement delay is most prominently reflected in the costs caused by “Revision
surgery”. These costs were reduced by 55% with a delay of total knee
replacement of five years when compared to current model of care.
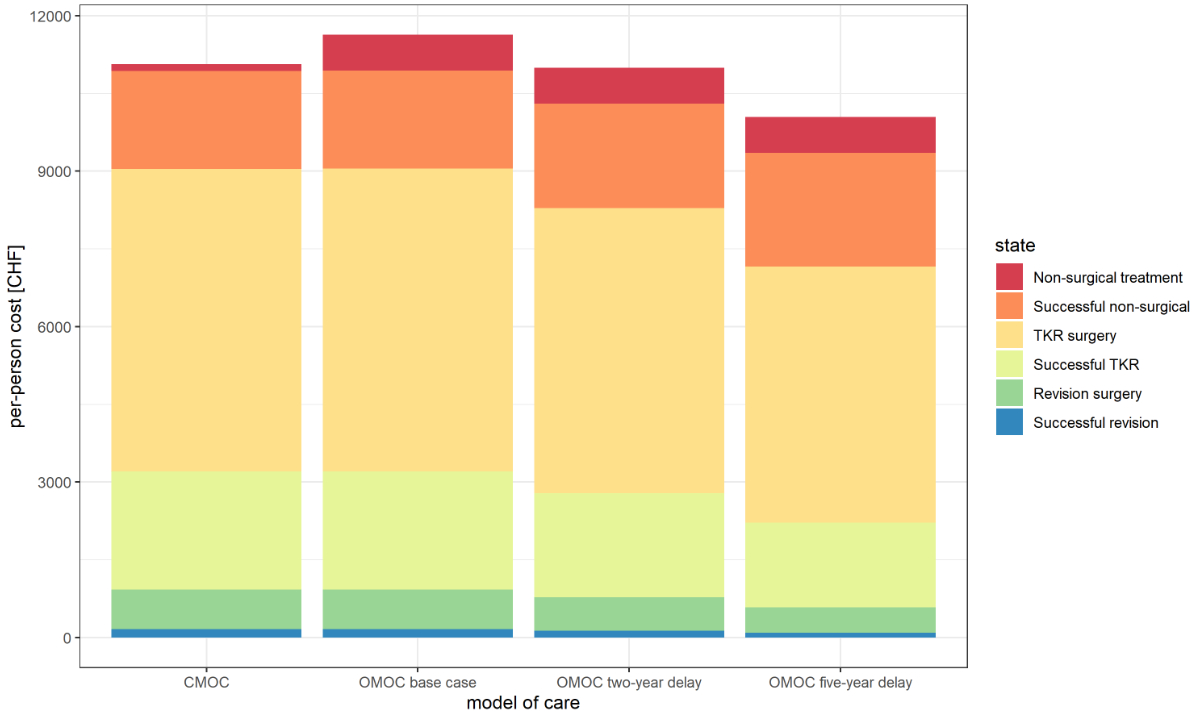
Figure 5 Costs
per person (undiscounted) for each scenario and the current model of care
(CMOC). The optimised model of care calculated under “base case”
conditions, meaning with no delay of total knee replacement (TKR), results in
the highest overall costs (CHF 11,634). This is due the more intensive
non-surgical treatment costs. The optimised model of care calculated with a delay of TKR by two
years results in lower costs per person (CHF 10,997) and the optimised model of care calculated
with a delay of TKR by five years reduces the total costs even further (CHF
10,044). The reduction of costs by these two scenarios can be explained because
of less TKR and revision surgeries performed.
CHF:
Swiss francs; TKR: total knee replacement
The observed reduction of revision
surgeries by 18% in the “two-year delay” and 36% in the “five-year delay”
scenario is due the fact that revision risk is cumulative and consequently
becomes higher the longer the implant is in use, which rises in parallel with a
younger age of implantation [11]. Our calculated reduction is supported by the
results of Gademan et al. [39], who reported a reduction of revision surgeries
by 17% when modelling the delay of total knee replacement by five years in
individuals under 75 using joint registry data from the Netherlands. The
difference to our results may be explained by higher total knee replacement
rates (+58% in Switzerland versus the Netherlands [40]) and the assumption in
this present health economic evaluation was that total knee replacement was delayed for all ages. There
is great consent that the need for revision surgery should be kept at the
lowest possible rate as it is considered an expensive and challenging procedure
with often unreproducible results [41]. Revision rates are therefore frequently
used to determine the outcome of total knee replacement [42].
The modelled lifetime probability to
develop radiographically confirmed symptomatic knee osteoarthritis (57%) is
somewhat higher than reported in the study of Murphy et al. using data from a
cohort of 3,068 U.S. participants reporting a lifetime probability of 44.7% (95%
CI 40%–49%) [37]. The probability for total knee replacement after diagnosed
knee osteoarthritis in our model was 55.7%. This result is in line with the study of Weinstein
et al. who reported 52.2% for males and 50.6% for females using the
Osteoarthritis Policy Model, a validated computer simulation model of knee osteoarthritis based
on U.S. data [38].
Our findings suggest that an investment in
more intensive, guideline recommended non-surgical treatments is likely to be cost- effective in
the context of the Swiss statutory healthcare system. If guideline recommended non-surgical treatments lead to a delay of
total knee replacement, for which robust empirical evidence is still lacking,
it may prevent a significant amount of revision surgeries and therefore has the
potential to enhance total knee replacement outcomes and save costs. The
developed model shows that non-surgical and surgical care should be delivered
in an integrated manner with the aim to select patients for total knee
replacement only after appropriate non-surgical care has failed. As clear
indications for total knee replacement are still missing and the decision to undergo
surgery is mostly influenced by the patient’s willingness [43, 44], it is vital
to provide guideline recommended non-surgical treatments before total knee replacement is considered.
The reported results must be interpreted
with caution because modelling studies always have limitations. First, we did
not account for costs that are associated with inpatient rehabilitation after total
knee replacement. Not accounting for these costs may have underestimated the
cost-effectiveness of guideline recommended non-surgical treatments, as some
studies suggest that up to 50% are referred to inpatient rehabilitation after total
knee replacement [45].
Second, we did not adjust our model for
patients who had already received total knee replacement and were therefore
cured from knee osteoarthritis. This may have led to an overestimation of the
performed total knee replacement surgeries in our model and therefore overestimated the cost-effectiveness
of guideline recommended non-surgical treatments.
Third, we assumed that total knee replacement is the only
available surgical treatment option. Nevertheless, in 2019, 2,908 partial knee
replacements were implanted in Switzerland for the treatment of knee
osteoarthritis (total knee replacement 15,378, partial knee
replacements 2,908) and its usage is currently rising [34]. In
addition to partial knee
replacements, high tibial osteotomy is also a commonly performed surgical
option for which we did not account for.
Fourth, other Markov models included
re-revision surgery, for which we did not account for [46]. The assumption that
all revisions are successful (meaning no re-revision is needed) is very
conservative. In fact, re-revision surgery after revision surgery are six times
more likely to be needed than revision surgery after total knee replacement
[41]. Again, the lack of accounting for re-revision surgery is likely to have
underestimated cost-effectiveness of guideline recommended non-surgical
treatments.
Fifth, conclusions drawn from modelling
studies need to be interpreted with caution. A narrow perspective was taken in
this analysis and utility data from Denmark and the U.S. were used which were
not degraded with rising age. This limits the model’s generalisability. To
confirm our results, long-term data in the context of the Swiss statutory healthcare
system is needed. Like the Swiss Implant Registry, which provides reliable data
regarding total knee replacement and revision surgery, a national health record
or an extension of this registry would be needed to provide data on how
patients move through the healthcare system after they have been diagnosed with
knee osteoarthritis.
Conclusion
According to this Markov model, the
implementation of guideline recommended non-surgical treatments in Switzerland
would likely be cost-effective from a statutory healthcare perspective. If implementing
guideline recommended non-surgical treatments leads to delaying total knee replacement by two or five years, we would
achieve a cost-saving effect and a reduction of needed revision surgeries by 18%
and 36%, respectively.
Acknowledgements
Darren Mazzei and Niklaus Meier
provided valuable advice while we developed the protocol and model.
Contributions: TV, NL and JT developed the study
concept. To the study protocol inputs were provided by TV, NL and JT. TV and NL
coded the model, interpreted results, and prepared the manuscript. All authors
contributed to the final manuscript.
Thomas Vetsch
Department of Health
Discipline of Physiotherapy
Bern University of Applied
Sciences
Schwarztorstrasse 48
CH-3007 Bern
thomas.vetsch[at]insel.ch
References
1.
Cross M
,
Smith E
,
Hoy D
,
Nolte S
,
Ackerman I
,
Fransen M
, et al.
The global burden of hip and knee osteoarthritis: estimates from the global burden of disease 2010 study. Ann Rheum Dis. 2014 Jul;73(7):1323–30. https://doi.org/10.1136/annrheumdis-2013-204763
2. GHDx. Global Burden of Disease Study 2019 (GBD 2019) results. Published 2020. Accessed March 15, 2021. http://ghdx.healthdata.org/gbd-results-tool
3.
Schneider H
,
Venetz W.
Cost of Obesity in Switzerland in 2012. Rep Prep Behalf Bundesamt Gesundh. Published online 2012:82.
4.
Wang H
,
Bai J
,
He B
,
Hu X
,
Liu D
. Osteoarthritis and the risk of cardiovascular disease: a meta-analysis of observational studies. Sci Rep. 2016 Dec;6(1):39672. https://doi.org/10.1038/srep39672
5.
Arden NK
,
Perry TA
,
Bannuru RR
,
Bruyère O
,
Cooper C
,
Haugen IK
, et al.
Non-surgical management of knee osteoarthritis: comparison of ESCEO and OARSI 2019 guidelines. Nat Rev Rheumatol. 2021 Jan;17(1):59–66. https://doi.org/10.1038/s41584-020-00523-9
6.
McGrory BJ
,
Weber KL
,
Jevsevar DS
,
Sevarino K
. Surgical Management of Osteoarthritis of the Knee: evidence-based Guideline. J Am Acad Orthop Surg. 2016 Aug;24(8):e87–93. https://doi.org/10.5435/JAAOS-D-16-00159
7.
Carr AJ
,
Robertsson O
,
Graves S
,
Price AJ
,
Arden NK
,
Judge A
, et al.
Knee replacement. Lancet. 2012 Apr;379(9823):1331–40. https://doi.org/10.1016/S0140-6736(11)60752-6
8.
Skou ST
,
Roos EM
,
Laursen MB
,
Rathleff MS
,
Arendt-Nielsen L
,
Simonsen O
, et al.
A Randomized, Controlled Trial of Total Knee Replacement. N Engl J Med. 2015 Oct;373(17):1597–606. https://doi.org/10.1056/NEJMoa1505467
9.
Beswick AD
,
Wylde V
,
Gooberman-Hill R
,
Blom A
,
Dieppe P
. What proportion of patients report long-term pain after total hip or knee replacement for osteoarthritis? A systematic review of prospective studies in unselected patients. BMJ Open. 2012 Feb;2(1):e000435. https://doi.org/10.1136/bmjopen-2011-000435
10.
Healy WL
,
Della Valle CJ
,
Iorio R
,
Berend KR
,
Cushner FD
,
Dalury DF
, et al.
Complications of total knee arthroplasty: standardized list and definitions of the Knee Society. Clin Orthop Relat Res. 2013 Jan;471(1):215–20. https://doi.org/10.1007/s11999-012-2489-y
11.
Bayliss LE
,
Culliford D
,
Monk AP
,
Glyn-Jones S
,
Prieto-Alhambra D
,
Judge A
, et al.
The effect of patient age at intervention on risk of implant revision after total replacement of the hip or knee: a population-based cohort study. Lancet. 2017 Apr;389(10077):1424–30. https://doi.org/10.1016/S0140-6736(17)30059-4
12.
Hagen KB
,
Smedslund G
,
Østerås N
,
Jamtvedt G
. Quality of Community-Based Osteoarthritis Care: A Systematic Review and Meta-Analysis. Arthritis Care Res (Hoboken). 2016 Oct;68(10):1443–52. https://doi.org/10.1002/acr.22891
13.
GLA
. D® Schweiz: Arthrose nachhaltig mit Übungen behandeln. GLAD Schweiz. Accessed December 10, 2022. https://gladschweiz.ch/arthrose/
14. physioswiss - Schweizer Physiotherapie Verband. Statistiken Mitgliederservices. Accessed December 10, 2022. https://www.physioswiss.ch/de/news/2022/statistiken-mitgliederservices
15.
Mazzei DR
,
Ademola A
,
Abbott JH
,
Sajobi T
,
Hildebrand K
,
Marshall DA
. Are education, exercise and diet interventions a cost-effective treatment to manage hip and knee osteoarthritis? A systematic review. Osteoarthritis Cartilage. Published online November 2020:S1063458420311651. doi:https://doi.org/10.1016/j.joca.2020.10.002
16.
Skou ST
,
Roos E
,
Laursen M
,
Arendt-Nielsen L
,
Rasmussen S
,
Simonsen O
, et al.
Cost-effectiveness of total knee replacement in addition to non-surgical treatment: a 2-year outcome from a randomised trial in secondary care in Denmark. BMJ Open. 2020 Jan;10(1):e033495. https://doi.org/10.1136/bmjopen-2019-033495
17.
Teoh LS
,
Eyles JP
,
Makovey J
,
Williams M
,
Kwoh CK
,
Hunter DJ
. Observational study of the impact of an individualized multidisciplinary chronic care program for hip and knee osteoarthritis treatment on willingness for surgery. Int J Rheum Dis. 2017 Oct;20(10):1383–92. https://doi.org/10.1111/1756-185X.12950
18.
Husereau D
,
Drummond M
,
Petrou S
,
Carswell C
,
Moher D
,
Greenberg D
, et al.; ISPOR Health Economic Evaluation Publication Guidelines-CHEERS Good Reporting Practices Task Force
. Consolidated Health Economic Evaluation Reporting Standards (CHEERS)—explanation and elaboration: a report of the ISPOR Health Economic Evaluation Publication Guidelines Good Reporting Practices Task Force. Value Health. 2013;16(2):231–50. https://doi.org/10.1016/j.jval.2013.02.002
19.
Roberts M
,
Russell LB
,
Paltiel AD
,
Chambers M
,
McEwan P
,
Krahn M
; ISPOR-SMDM Modeling Good Research Practices Task Force
. Conceptualizing a model: a report of the ISPOR-SMDM Modeling Good Research Practices Task Force-2. Med Decis Making. 2012;32(5):678–89. https://doi.org/10.1177/0272989X12454941
20.
RStudio Team
. RStudio: Integrated Development Environment for R. Published online 2020. http://www.rstudio.com/
21.
Wickham H
,
Averick M
,
Bryan J
,
Chang W
,
McGowan L
,
François R
, et al.
Welcome to the tidyverse. J Open Source Softw. 2019;4(43):1686. https://doi.org/10.21105/joss.01686
22.
Carta A
,
Conversano C
. On the Use of Markov Models in Pharmacoeconomics: Pros and Cons and Implications for Policy Makers. Front Public Health. 2020 Oct;8:569500. [cited 2022 Mar 23] Available from: https://www.frontiersin.org/article/10.3389/fpubh.2020.569500 https://doi.org/10.3389/fpubh.2020.569500
23.
Losina E
,
Usiskin IM
,
Smith SR
,
Sullivan JK
,
Smith KC
,
Hunter DJ
, et al.
Cost-effectiveness of generic celecoxib in knee osteoarthritis for average-risk patients: a model-based evaluation. Osteoarthritis Cartilage. 2018 May;26(5):641–50. https://doi.org/10.1016/j.joca.2018.02.898
24.
Ponnusamy KE
,
Vasarhelyi EM
,
Somerville L
,
McCalden RW
,
Marsh JD
. Cost-Effectiveness of Total Knee Arthroplasty vs Nonoperative Management in Normal, Overweight, Obese, Severely Obese, Morbidly Obese, and Super-Obese Patients: A Markov Model. J Arthroplasty. 2018 Jul;33(7 7S):S32–8. https://doi.org/10.1016/j.arth.2018.02.031
25.
Rajan PV
,
Ng MK
,
Klika A
,
Kamath AF
,
Muschler GF
,
Higuera CA
, et al.
The Cost-Effectiveness of Platelet-Rich Plasma Injections for Knee Osteoarthritis: A Markov Decision Analysis. J Bone Joint Surg Am. 2020 Sep;102(18):e104. https://doi.org/10.2106/JBJS.19.01446
26.
Ademi Z
,
Gloy V
,
Glinz D
,
Raatz H
,
Van S
,
Bucher HC
, et al.
Cost-effectiveness of primarily surgical versus primarily conservative treatment of acute and subacute radiculopathies due to intervertebral disc herniation from the Swiss perspective. Swiss Med Wkly. 2016;146:w14382. https://doi.org/10.4414/smw.2016.14382
27.
Cui A
,
Li H
,
Wang D
,
Zhong J
,
Chen Y
,
Lu H
. Global, regional prevalence, incidence and risk factors of knee osteoarthritis in population-based studies. EClinicalMedicine. 2020 Nov;29-30:100587. https://doi.org/10.1016/j.eclinm.2020.100587
28.
BFS
. Struktur der ständigen Wohnbevölkerung nach Kanton, 1999-2019 - 1999-2019 | Tabelle. Bundesamt für Statistik. Published August 27, 2020. Accessed March 15, 2021. /content/bfs/de/home/statistiken/bevoelkerung/stand-entwicklung.assetdetail.13707204.html
29.
TARMED
. TARMED Online Browser. TARMED Leistungen und Tarife nach Dignität, Leistungsblöcken oder Leistungsgruppen online abfragen. Published March 15, 2021. Accessed March 15, 2021. https://www.tarmed-browser.ch/de
30.
Swiss DR
. SwissDRG. Published March 15, 2021. Accessed March 15, 2021. https://www.swissdrg.org/de
31.
BAG
. Statistik der obligatorischen Krankenversicherung. Published online June 1, 2021. Accessed August 27, 2021. https://www.bag.admin.ch/bag/de/home/zahlen-und-statistiken/statistiken-zur-krankenversicherung/statistik-der-obligatorischen-krankenversicherung.html
32.
Skou ST
,
Roos EM
,
Laursen M
,
Arendt-Nielsen L
,
Rasmussen S
,
Simonsen O
, et al.
Cost-effectiveness of 12 weeks of supervised treatment compared to written advice in patients with knee osteoarthritis: a secondary analysis of the 2-year outcome from a randomized trial. Osteoarthritis Cartilage. 2020 Jul;28(7):907–16. https://doi.org/10.1016/j.joca.2020.03.009
33.
Konopka JF
,
Lee Y
,
Su EP
,
McLawhorn AS
. Lee Y yu, Su EP, McLawhorn AS. Quality-Adjusted Life Years After Hip and Knee Arthroplasty. JBJS Open Access. 2018;3(3):e0007. https://doi.org/10.2106/JBJS.OA.18.00007
34.
SIRIS
. Swiss National Hip & Knee Joint Registry.; 2020. Accessed December 11, 2020. https://www.siris-implant.ch/media/archive1/201204_SIRIS-Report2020_online.pdf
35.
Bager CL
,
Karsdal M
,
Bihlet A
,
Thudium C
,
Byrjalsen I
,
Bay-Jensen AC
. Incidence of total hip and total knee replacements from the prospective epidemiologic risk factor study: considerations for event driven clinical trial design. BMC Musculoskelet Disord. 2019 Jun;20(1):303. https://doi.org/10.1186/s12891-019-2680-3
36.
Briggs AH
,
Claxton K
,
Sculpher MJ
. Decision Modelling for Health Economic Evaluation. Oxford University Press; 2006.
37.
Murphy L
,
Schwartz TA
,
Helmick CG
,
Renner JB
,
Tudor G
,
Koch G
, et al.
Lifetime risk of symptomatic knee osteoarthritis. Arthritis Rheum. 2008 Sep;59(9):1207–13. https://doi.org/10.1002/art.24021
38.
Weinstein AM
,
Rome BN
,
Reichmann WM
,
Collins JE
,
Burbine SA
,
Thornhill TS
, et al.
Estimating the burden of total knee replacement in the United States. J Bone Joint Surg Am. 2013 Mar;95(5):385–92. https://doi.org/10.2106/JBJS.L.00206
39.
Gademan MG
,
Van Steenbergen LN
,
Cannegieter SC
,
Nelissen RG
,
Marang-Van De Mheen PJ
. Population-based 10-year cumulative revision risks after hip and knee arthroplasty for osteoarthritis to inform patients in clinical practice: a competing risk analysis from the Dutch Arthroplasty Register. Acta Orthop. 2021 Jun;92(3):280–4. https://doi.org/10.1080/17453674.2021.1876998
40.
OECD
. Health at a Glance 2017: OECD Indicators. Published 2017. Accessed December 8, 2020. https://www.oecd-ilibrary.org/social-issues-migration-health/health-at-a-glance-2017_health_glance-2017-en
41.
Ong KL
,
Lau E
,
Suggs J
,
Kurtz SM
,
Manley MT
. Risk of subsequent revision after primary and revision total joint arthroplasty. Clin Orthop Relat Res. 2010 Nov;468(11):3070–6. https://doi.org/10.1007/s11999-010-1399-0
42.
Bae DK
,
Song SJ
,
Heo DB
,
Lee SH
,
Song WJ
. Long-term survival rate of implants and modes of failure after revision total knee arthroplasty by a single surgeon. J Arthroplasty. 2013 Aug;28(7):1130–4. https://doi.org/10.1016/j.arth.2012.08.021
43.
Mandl LA
. Determining who should be referred for total hip and knee replacements. Nat Rev Rheumatol. 2013 Jun;9(6):351–7. https://doi.org/10.1038/nrrheum.2013.27
44.
Wright JG
,
Hawker GA
,
Hudak PL
,
Croxford R
,
Glazier RH
,
Mahomed NN
, et al.; Toronto Arthroplasty Research Group Writing Committee
. Variability in physician opinions about the indications for knee arthroplasty. J Arthroplasty. 2011 Jun;26(4):569–575.e1. https://doi.org/10.1016/j.arth.2010.04.028
45.
Ong KL
,
Lotke PA
,
Lau E
,
Manley MT
,
Kurtz SM
. Prevalence and Costs of Rehabilitation and Physical Therapy After Primary TJA. J Arthroplasty. 2015 Jul;30(7):1121–6. https://doi.org/10.1016/j.arth.2015.02.030
46.
McLawhorn AS
,
Southren D
,
Wang YC
,
Marx RG
,
Dodwell ER
. Cost-Effectiveness of Bariatric Surgery Prior to Total Knee Arthroplasty in the Morbidly Obese: A Computer Model-Based Evaluation. J Bone Joint Surg Am. 2016 Jan;98(2):e6. https://doi.org/10.2106/JBJS.N.00416
Appendices: Supplementary data
The Appendices 1-4 are available for download as separate files at https://doi.org/10.57187/smw.2023.40059.