How time consuming are general practitioners’ home visits? Insights from a cross-sectional study in Switzerland
DOI: https://doi.org/10.57187/smw.2023.40038
Rafael D.
Fritza, Christoph
Merlobc, Stefan
Essigb
a Joint Medical Master University of Lucerne and University of Zurich, Switzerland
b Centre of Primary and Community Care Lucerne, University of Lucerne, Switzerland
c Swiss Sentinel Surveillance System, Federal Office of Public Health, Bern, Switzerland
Summary
BACKGROUND:
Worldwide, the number of home visits has been decreasing over past decades. Lack
of time and long journeys have been reported to hinder general practitioners (GPs)
from conducting home visits. In Switzerland also, home visits have declined. Time
constraints in a busy GP practice could be one reason. Therefore, the aim of this
study was to analyse the time requirements of home visits in Switzerland.
METHODS: A
one-year cross-sectional study involving GPs from the Swiss Sentinel
Surveillance System (Sentinella) was conducted in 2019. GPs provided basic
information on all home visits performed throughout the year and additionally detailed
reports of up to 20 consecutive home visits. Univariable and multivariable
logistic regression analyses were run to identify factors affecting journey and
consultation duration.
RESULTS:
In total, 95 GPs conducted 8489 home visits in Switzerland, 1139 of which have
been characterised in detail. On average, GPs made 3.4 home visits per week.
Average journey and consultation duration were 11.8 and 23.9 minutes,
respectively. Prolonged consultations were provided by GPs working part-time
(25.1 minutes), in group practice (24.9 minutes) or in urban regions (24.7 minutes).
Rural environments and short journey to patient’s home were both found to lower
the odds of performing a long consultation compared to a short consultation (odds
ratio [OR] 0.27, 95% confidence interval [CI] 0.16–0.44 and OR 0.60, 95% CI
0.46–0.77, respectively). Emergency visits (OR 2.20, 95% CI 1.21–4.01),
out-of-hours appointments (OR 3.06, 95% CI 2.36–3.97) and day care involvement
(OR 2.78, 95% CI 2.13–3.62) increased the odds of having a long consultation.
Finally, patients in their 60s had markedly higher odds of receiving long
consultations than patients in their 90s (OR 4.13, 95% CI 2.27–7.62), whereas lack
of chronic conditions lowered the odds of a long consultation (OR 0.09, 95% CI
0.00–0.43).
CONCLUSION: GPs perform rather few but long home visits, especially for multimorbid patients. GPs working part-time, in group practice or in urban regions devote more time to home visits.
Background
There has been a long-term decline in home visits in many countries [1–5]. Time constraints were reported to be major obstacles to providing
primary care to homebound patients. Lack of time and long travel distances are the
most frequently reported barriers to home visits [6–9]. The importance of time issues is also stressed by the recent
motion of UK’s general practitioners (GPs) to remove home visits from their
work contracts [10]. Indeed, home visits account for a substantial amount of workload,
as shown in a recent study from Germany [11]. Similarly, increased geographical distance has been associated
with decreased frequency of primary care supply including home visits in other
countries [12, 13]. Besides long journeys, the consultation itself might be long. The
consultation duration seem to primarily depend on patients’ health status, i.e.,
their age, number of comorbidities and medical problem [14–16]. With the population growing older, GPs might encounter exactly
those patients who are elderly, frail and complex [17] and therefore need a high investment of time.
There
is some research on home visits in Switzerland. Most studies are based on the
analysis of billing data. Mirroring the global trend, home visits are declining
in Switzerland. In the canton of Vaud, home visits per physician dropped by 40%
between 2006 and 2015. In the same time span, the number of home visits per
patient increased by 7.8% [18]. The
majority of home visits in Switzerland have been scheduled as routine
appointments without additional investigation [19]. The
beneficiaries of home visits were older and showed increased hospitalisation
and mortality rates compared with the matched patient population not receiving
home visits [20].
In summary, knowledge on time
requirements in relation to home visits is limited. Internationally, a few
analyses were performed. Nonetheless, which factors influence consultation
duration during home visits remains unknown. In Switzerland, time issues have
never been investigated in detail. The aim of this study was to analyse this
pivotal factor affecting home visits based on systematic reports by GPs.
Methods
Study design and ethics
The
study is based on a one-year data collection performed by the Swiss Sentinel Surveillance
System (Sentinella) between 1 January and 31 December 2019. Sentinella is a Swiss-wide,
voluntary and representative network of GPs, internists and paediatricians
serving in primary care [21]. The network is operated and funded by the Swiss Federal Office of
Public Health. Physicians are grouped into six geographical regions. The
network is organised on the practice level, encompassing single-handed as well
as group practices. Sentinella physicians routinely report surveillance data weekly
(mainly concerning infectious diseases) and are invited to take part in various
additional studies (mainly concerning health services). They receive a small amount
of financial compensation for participation and data collection.
During the entire year 2019, participating
physicians were asked to record two datasets on home visits by means of a
digital questionnaire in German or French [22]. The first dataset (referred to as the
basic dataset) includes basic information only. For details, see the Variables
subsection below. The second dataset (extended dataset) was obtained from up to
20 consecutive home visits and contains additional variables. To cover the
entire year and prevent seasonal bias, study physicians were randomly assigned
to a starting point throughout the year from which the extended data collection
began.
Sample and exclusion criteria
All Sentinella
physicians, i.e., 200 physicians employed in 169 practices, were invited to
participate in the present study (see fig. 1).
Routine
visits to nursing homes, i.e., ward rounds where GPs consecutively see multiple
patients, were not considered eligible. Home visits conducted while on public
emergency service were excluded as well because these patients are unknown to
the GP and have to be visited as part of the service (no choice of visiting
available). GPs who did not conduct home visits or reported <10 weeks per
year were excluded. Since the study focuses on GPs, paediatricians were removed
from the dataset as well. Finally, 152 datasheets, each corresponding to a
single home visit, were removed due to incomplete data entries with missing key
variables.
To test for data robustness, sensitivity
analyses were run with more stringent exclusion criteria to remove both rare
and frequent responders from the data set. For this purpose, GPs reporting
<10 weeks throughout the year and those reporting <10 or >120 home
visits were excluded.
Variables
The
basic dataset consisted of the following variables: patient’s year of birth and
sex, place of visit (i.e., private home, nursing home, workplace or other),
journey duration to the place of visit as well as information regarding
repeated visits to the same patient within the study period.
The
extended dataset included additional variables to characterise home visits. To
analyse the temporal domain of home visits, we focused on two main variables: (1) journey duration in minutes, which accounts for the
travel time to the patient’s home (primary outcome) and (2) consultation
duration in minutes, which accounts for the time spent with the patient
(secondary outcome). Temporal variables were dichotomised as follows: journey
duration – long (>10 min) vs short (≤10 min) and consultation duration –
long (>25 min) vs medium (16–25 min) or short (≤15 min). The dichotomisation
was based on data distribution to yield groups of comparable size.
Further variables to characterise home
visits included: urbanisation level (urban, intermediate [dense semi-urban
space and rural centres], rural) as defined by the Swiss Federal Statistical Office
[23], urgency level (regular, urgent and
emergency) as defined by the Swiss Tarmed reimbursement system [24], reasons for home visit (impaired
mobility, lack of transport, infectivity, poor general condition, patient’s
request, GP absent from doctor’s office owing to conducting another home visit,
attending further education courses, or other), out-of-hours home visits,
GP-dependent hospitalisation during/after home visit and GP-independent
hospitalisation within 24 hours after conducting the home visit. The patient
population was characterised by the following variables: age, sex, type of household,
private/public day care, patient’s condition at doctor’s arrival (chronically
ill with/without acute problem, healthy with acute problem, palliative care,
recovering from medical interventions, or other), number of chronic conditions
and finally the actual health problem (musculoskeletal, respiratory,
neurological, digestive, cardiovascular, endocrine/metabolic/nutritional,
general, psychological, social, other, unclear or no obvious diagnosis) defined
by the main chapters of the International Classification of Primary Care 2 [22,
25].
Statistical analysis and graphical display
Descriptive
statistics including percentages, mean, standard deviation (SD), median,
interquartile range (IQR), minimum to maximum (min–max) and 95% confidence interval (95% CI) were used to report patient
and home visit characteristics. Data distribution was analysed by the Shapiro-Wilk
test. Since data were not distributed normally, the Kruskal-Wallis rank sum
test was used to compare between groups. The Wilcoxon test with Bonferroni
correction was applied to account for multiple testing. A p-value <0.05 was considered statistically
significant. Univariable and multivariable logistic regression analyses were performed
to identify potential predictors for long travel and long consultation duration
and were expressed as odds ratios (ORs). The independent variables in the
multivariable regression model were patients’ age and sex as well as GPs’
working time (full or part-time) and practice type (single or group practice). For
logistic regression analysis, medium and short consultation duration were
pooled to compare the odds of having long vs. non-long (i.e. short and medium)
consultation.
All analyses were carried out using
the open-source software RStudio (RStudio, Inc.) version 1.2.5033. Standard
R-functions were used for data analysis and no new analytical code has been
created. The map representing the geographical distribution of GPs in
Switzerland was generated with the open-source software QGIS Desktop version
3.6.3. The map shapefile was obtained from the Swiss Federal Office of
Topography.
Ethics
approval and consent to participate
The current study (Req-2020-01088)
was approved by the ethics committees of Bern (KEK) and central and
northwestern Switzerland (EKNZ). All data were collected anonymously, thus
patient consent was not required. A study protocol has not been published.
Results
Participants
Out of
the 200 physicians participating in the study, we excluded 32 paediatricians
and 73 GPs (fig. 1).
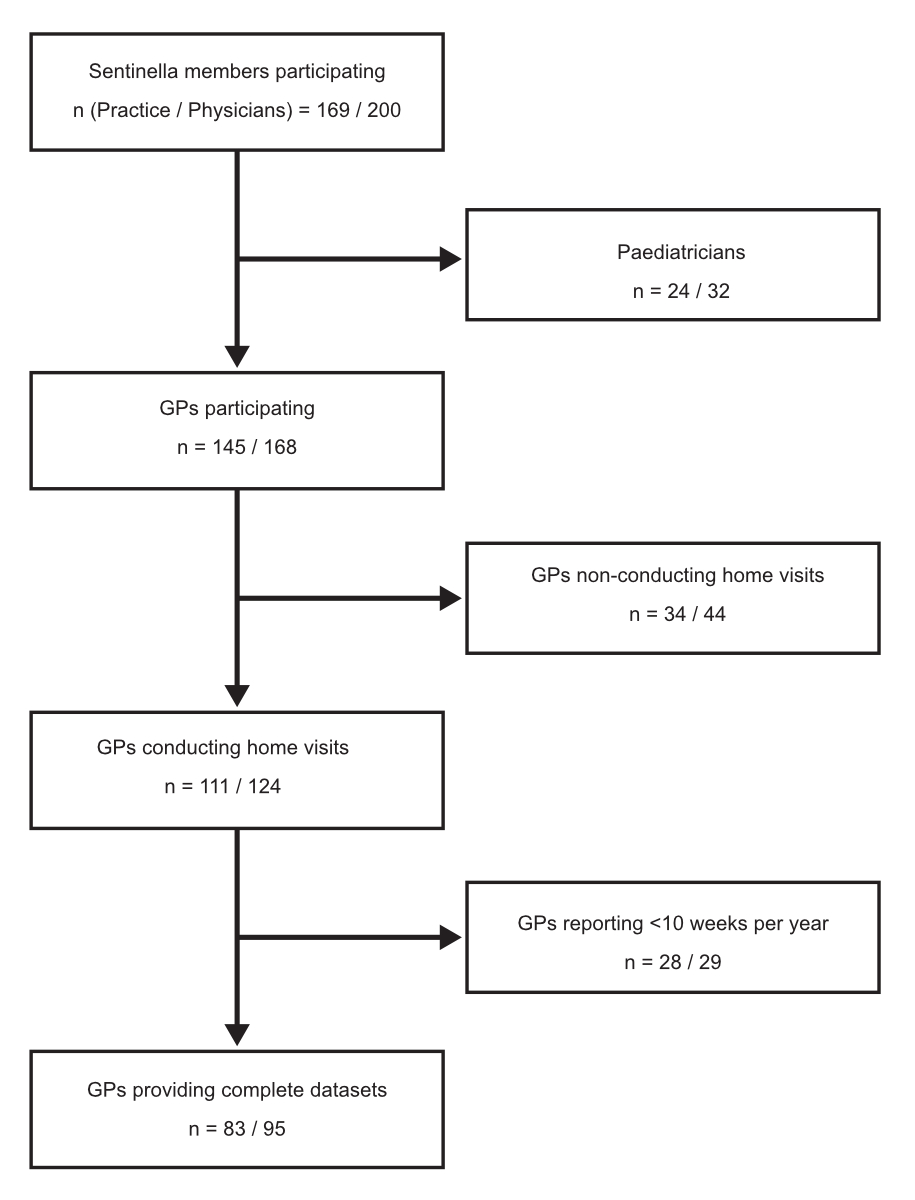
Figure 1 Flow diagram of the Sentinella study on home visits. The Sentinella network is organised
on practice level with an individual identification number assigned to each
registered practice. Practices are run either by single or multiple physicians.
Both the number of practices and physicians are given. The 95 GPs provided in
total 1291 detailed reports, 152 of which were incomplete and thus removed,
yielding 1139 reports included in the extended dataset.
The 95 GPs included in our sample were located all over Switzerland with the fewest GPs present in the central region (fig. 2).

Figure 2 Regional distribution of participating GPs. The numbers of participating
practices and Sentinella GPs are shown per geographical region. GPs are further
divided according to sex and urbanisation level. Square brackets denote the
number of physicians providing primary care including GPs and paediatricians
according to statistics provided by the Swiss Federal Statistical Office [32]. The corresponding figures on
country level are shown in the box to the left.
Most GPs reported from urban areas (n = 63; 66.3%), followed by intermediate (n = 18; 18.9%) and rural environments (n = 14; 14.7%). In total, 23 GPs were female (24.2%) and the proportion of women varied between 14.3% and 41.7% across Sentinella regions (table 1 and figure 2). About one third of GPs worked part-time (n = 33; 34.7%) (table 1).
Table 1GP
and dataset characteristics.
| |
n (%)*
|
| Practice |
83
(100.0) |
| Group
practice |
43 (51.8) |
| GPs |
95
(100.0) |
| GPs
working in group practice |
55 (57.9) |
| GPs
working part-time |
33 (34.7) |
| Female
GPs |
23 (24.2) |
| GPs’ age |
30–39
years |
11 (11.8) |
| 40–49
years |
15 (16.1) |
| 50–59
years |
27 (29.0) |
| 60–69
years |
35 (37.6) |
| >69
years |
5 (5.4) |
| Total
home visits |
8489 |
| Home
visits per GP per week |
Mean ± SD |
3.4 ±
3.5 |
| Median /
IQR / min–max |
2.3 / 2.0
/ 1.1–26.9 |
| Home
visits per practice per year |
Mean ± SD |
104.1 ±
110.5 |
| Median /
IQR / min–max |
57.0 /
105.5 / 13–619 |
| Home
visits with short reports (basic dataset)** |
7350 |
| Home
visits per GP per week |
Mean ± SD |
3.6 ± 3.9 |
| Median /
IQR / min–max |
2.3 / 2.4
/ 0–30.1 |
| Home
visits with detailed reports (extended dataset)** |
1139 |
| Home
visits per GP per week |
Mean ± SD |
2.8 ± 2.0 |
| Median /
IQR / min–max |
2.2 / 1.8
/ 1–11 |
Slightly
more than half of the GPs worked in group practices (n = 55; 57.9%). Among the
GPs working in group practice, 34.5% were female and 52.7% worked part-time (supplementary
table 1 in the appendix); 43% of GPS were 60 years old or older (table 1). GPs
working solo and full time were older than their colleagues working in group
practices and part-time (supplementary table 1). GPs performing home visits
tended to be male, older, work solo and full time, compared with GPs who did
not conduct home visits or with low frequency only (supplementary table 2).
Characteristics of home visits
The
characteristics of home visits are summarised in tables 1 and 2 and supplementary
tables 1 and 3.
Table 2Characteristics of home visits (n = 1139).
|
Main
variables
|
n (%)*
|
| Journey duration (min) |
Mean ± SD |
11.8 ±
7.2 |
| Median / IQR / min–max |
10 / 8 /
1–60 |
| Journey
duration |
Long:
>10 min |
456
(40.0) |
| Short: ≤10 min |
683
(60.0) |
| Consultation duration (min) |
Mean ± SD |
23.9 ±
12.9 |
| Median / IQR / min-max |
20 / 15 /
5–120 |
| Consultation
duration |
Long:
>25 min |
360
(31.6) |
| Medium:
16–25 min |
375
(32.9) |
| Short: ≤15 min |
404
(35.5) |
| Visit characteristics |
| Level of
urbanisation |
Urban |
835 (73.3) |
| Intermediate |
159 (14.0) |
| Rural |
145 (12.7) |
| Urgency** |
Regular |
824
(72.3) |
| Urgent |
269
(23.6) |
| Emergency |
46 (4.0) |
| Reasons
for house visit*** |
Impaired mobility |
784
(68.8) |
| Lack of
private or public transport |
60 (5.3) |
| Infectivity |
6 (0.5) |
| Poor
general condition |
155
(13.6) |
| Patient’s
request |
39 (3.4) |
| GP absent
from doctor’s office |
3 (0.3) |
| Other
reason |
92 (8.1) |
| Out-of-hours
house visits |
426
(37.4) |
| Hospitalisations
during/after house visit |
30 (2.6) |
| GP-independent
hospitalisations within 24 hours after house visit |
14 (1.2) |
| Patient characteristics |
| Age
(years) |
Mean ± SD |
83.0 ±
13.0 |
| Median /
IQR / min–max |
86 / 11.5
/ 0–104 |
| Age
categories (years) |
≥90 |
372
(32.7) |
| 80–89 |
482
(42.3) |
| 70–79 |
169
(14.8) |
| 60–69 |
51 (4.5) |
| <60 |
65 (5.7) |
| Woman |
743
(65.2) |
| Single-handed
household |
238
(20.9) |
| Public or
private day care |
347
(30.5) |
| Patients’
condition on doctor’s arrival*** |
Chronically
ill patients |
638
(56.0) |
| Chronically
ill patients with acute disease |
317
(27.8) |
| Palliative
care patients |
63 (5.5) |
| Recovering
patients (e.g., from surgery) |
25 (2.2) |
| Healthy
patients with acute disease |
56 (4.9) |
| Other
condition |
40 (3.5) |
| Number of
chronic conditions |
≥5 |
435
(38.2) |
| 2–4 |
610
(53.6) |
| 1 |
59 (5.2) |
| 0 |
20 (1.8) |
| Unknown |
15 (1.3) |
| Diagnostic
class or problem area*** |
Musculoskeletal |
209
(18.3) |
| Respiratory |
116
(10.2) |
| Neurological |
102 (9.0) |
| Digestive |
50 (4.4) |
| Cardiovascular |
172
(15.1) |
| Endocrine,
metabolic and nutritional |
24 (2.1) |
| General |
95 (8.3) |
| Psychological |
86 (7.6) |
| Social
problems |
15 (1.3) |
| Other
diagnosis or problem |
142
(12.5) |
| No
obvious diagnosis or problem |
97 (8.5) |
| Diagnosis
unclear |
31 (2.7) |
In total, GPs conducted 8489 home visits and provided 7350 basic and 1139 detailed reports (table 1). On average, 3.4 ± 3.5 (mean ± SD) visits were performed per GP per week. GPs spent on average 11.8 ± 7.2 minutes travelling to the patient’s place and 23.9 ± 12.9 minutes on consultation (table 2). Consultation duration was prolonged for GPs working part-time (25.1 ± 12.3 minutes) or in a group practice (24.9 ± 13.8 minutes) (supplementary table 1) and by practicing in urban regions (24.7 ± 13.4 minutes) (supplementary table 3). In total, 824 visits (72.3%) were of a regular character without urgency or emergency (table 2). Accordingly, only a minority of visits resulted in immediate hospitalisation or hospitalisation within 24 hours after the visit (n = 44; 3.8%). A total of 426 visits (37.4%) were out-of-hours. Main reasons for home visits were impaired mobility (n = 784; 68.8%) and poor general condition (n = 155; 13.6%). About 75% of all home visits were to patients older than 80 years (n = 854). Patients’ mean age was 83 ± 13 years. The majority of home visits were for women (n =743; 65.2%). Private or public day care was involved in 347 (30.5%) cases. Chronic illness without an acute disease was the condition most often encountered (n = 638; 56.0%), followed by chronic illness with an acute disease (n = 317; 27.8%). Correspondingly, 610 (53.6%) and 435 (38.2%) home visits were for patients suffering from more than two and more than five chronic conditions, respectively. Musculoskeletal and cardiovascular complaints were most frequently reported (n = 209; 18.3% and 172; 15.1%, respectively).
Logistic regression analysis of factors impacting the duration of home
visits
Associations
of temporal variables, i.e., journey and consultation duration, with further
home visit characteristics are reported in table 3, which shows the crude ORs.
Table 3Associations of characteristics of home visits and visited patients with journey duration and consultation duration. 95% CIs not including zero are presented in bold.
|
Journey
duration
|
Long
journey (vs. short), crude OR (95% CI)
|
Consultation
duration
|
Long
consultation (vs. short/medium)
crude OR (95% CI)
|
|
Long, n (%)
|
Short, n (%)
|
Long, n (%)
|
Medium, n (%)
|
Short, n (%)
|
|
Main
variables
|
| Journey
duration |
Long:
>10 min |
456 (100.0 |
0 (0.0) |
– |
175 (38.4) |
146 (32.0) |
135 (29.6) |
1 |
| Short: ≤10 min |
0 (0.0) |
683
(100.0) |
– |
185 (27.1) |
229 (33.5) |
269 (39.4) |
0.60 (0.46–0.77)
|
| Consultation
duration |
Long:
>25 min |
175 (48.6) |
185 (51.4) |
1 |
360 (100.0) |
0 (0.0) |
0 (0.0) |
– |
| Medium:
16–25 min |
146 (38.9) |
229 (61.1) |
0.67 (0.50–0.90)
|
0 (0.0) |
375 (100.0) |
0 (0.0) |
– |
| Short: ≤15 min |
135 (33.4) |
269 (66.6) |
0.53 (0.40–0.71)
|
0 (0.0) |
0 (0.0) |
404 (100.0) |
– |
|
Visit characteristics
|
| Level of
urbanisation |
Urban |
385 (46.1) |
450 (53.9) |
1 |
297 (35.6) |
249 (29.8) |
289 (34.6) |
1 |
| Intermediate |
37 (23.3) |
122 (76.7) |
0.35 (0.24–0.52)
|
44 (27.7) |
68 (42.8) |
47 (29.5) |
0.69
(0.47–1.00) |
| Rural |
34 (23.4) |
111 (76.6) |
0.36 (0.24–0.53)
|
19 (13.1) |
58 (40.0) |
68 (46.9) |
0.27 (0.16–0.44)
|
| Urgency* |
Regular |
338 (41.0) |
486 (59.0) |
1 |
242 (29.4) |
262 (31.8) |
320 (38.8) |
1 |
| Urgent |
101 (37.5) |
168 (62.5) |
0.86
(0.65–1.15) |
96 (35.7) |
95 (35.3) |
78 (29.0) |
1.33
(1.00–1.78) |
| Emergency |
17 (37.0) |
29 (63.0) |
0.84
(0.45–1.54) |
22 (47.8) |
18 (39.1) |
6 (13.1) |
2.20 (1.21–4.01)
|
| Reasons
for house visit** |
Impaired
mobility |
317 (40.4) |
467 (59.6) |
1 |
240 (30.6) |
266 (33.9) |
278 (35.5) |
1 |
| Lack of
private or public transport |
25 (41.7) |
35 (58.3) |
1.05
(0.61–1.78) |
15 (25.0) |
30 (50.0) |
15 (25.0) |
0.76 (0.4–1.35) |
| Infectivity |
2 (33.3) |
4 (66.7) |
0.74
(0.10–3.80) |
0 (0.0) |
5 (83.3) |
1 (16.7) |
NA |
| Poor
general condition |
60 (38.7) |
95 (61.3) |
0.93
(0.65–1.32) |
60 (38.7) |
44 (28.4) |
51 (32.9) |
1.43
(1.00–2.04) |
| Patient’s
request |
17 (43.6) |
22 (56.4) |
1.14
(0.59–2.17) |
6 (15.4) |
7 (17.9) |
26 (66.7) |
0.41 (0.15–0.93)
|
| GP absent
from doctor’s office |
1 (33.3) |
2 (66.7) |
0.74
(0.03–7.72) |
0 (0.0) |
1 (33.3) |
2 (66.7) |
NA |
| Other
reason |
34 (37.0) |
58 (63.0) |
0.86
(0.55–1.34) |
39 (42.4) |
22 (23.9) |
31 (33.7) |
1.67 (1.07–2.58)
|
| Out-of-hours
house visits |
185 (43.4) |
241 (56.6) |
1.25
(0.98–1.60) |
200 (46.9) |
135 (31.7) |
91 (21.4) |
3.06 (2.36–3.97)
|
| Hospitalisations
during/after house visit |
16 (53.3) |
14 (46.7) |
1.74 (0.84–3.64) |
13 (43.3) |
13 (43.3) |
4 (13.4) |
1.68
(0.79–3.48) |
| GP-independent
hospitalisations within 24 hours after house visit |
7 (50.0) |
7 (50.0) |
1.51
(0.51–4.43) |
4 (28.6) |
5 (35.7) |
5 (35.7) |
0.86
(0.24–2.60) |
|
Patient characteristics
|
| Age
categories (years) |
≥90 |
151 (40.6 |
221 (59.4) |
1 |
90 (24.2) |
134 (36.0 |
148 (39.8) |
1 |
| 80–89 |
189 (39.2) |
293 (60.8) |
0.94
(0.72–1.24) |
147 (30.5) |
167 (34.6) |
168 (34.9) |
1.37 (1.01–1.87
)
|
| 70–79 |
59 (34.9) |
110 (65.1) |
0.79
(0.54–1.14) |
71 (42.0) |
44 (26.0) |
54 (32.0) |
2.27 (1.54–3.34
)
|
| 60–69 |
24 (47.1) |
27 (52.9) |
1.30
(0.72–2.34) |
29 (56.9) |
12 (23.5) |
10 (19.6) |
4.13 (2.27–7.62
)
|
| <60 |
33 (50.8) |
32 (49.2) |
1.51
(0.89–2.57) |
23 (35.4) |
18 (27.7) |
24 (36.9) |
1.72 (0.97–2.99) |
| Woman |
302 (40.6) |
441 (59.4) |
1.08
(0.84–1.38) |
229 (30.8) |
241 (32.4) |
273 (36.8) |
0.90
(0.69–1.17) |
| Single-handed
household |
101 (42.4) |
137 (57.6) |
1.13
(0.85–1.51) |
83 (34.9) |
89 (37.4) |
66 (27.7) |
1.21
(0.89–1.63) |
| Public or
private day care |
167 (48.1) |
180 (51.9) |
1.61 (1.25–2.09)
|
165 (47.6) |
101 (29.1) |
81 (23.3) |
2.78 (2.13–3.62)
|
| Patients’
conditions on doctor’s arrival** |
Chronically
ill patients |
265 (41.5) |
373 (58.5) |
1 |
186
(29.2) |
202
(31.7) |
250
(39.1) |
1 |
| Chronically
ill patients with acute disease |
120 (37.9) |
197 (62.1) |
0.86
(0.65–1.13) |
109
(34.4) |
112 (35.3 |
96 (30.3) |
1.27
(0.95–1.70) |
| Palliative
care patients |
21 (33.3) |
42 (66.7) |
0.70
(0.40–1.20) |
29 (46.0) |
16 (25.4) |
18 (28.6) |
2.07 (1.22–3.50)
|
| Recovering
patients (e.g., from surgery) |
7 (28.0) |
18 (72.0) |
0.55
(0.21–1.28) |
4 (16.0) |
16 (64.0) |
5 (20.0) |
0.46 (0.13–1.24) |
| Healthy
patients with acute disease |
28 (50.0) |
28 (50.0) |
1.41
(0.81–2.44) |
16 (28.6) |
17 (30.4) |
23 (41.0) |
0.97
(0.52–1.75) |
| Other
condition |
15 (37.5) |
25 (62.5) |
0.84
(0.43–1.61) |
16 (40.0) |
12 (30.0) |
12 (30.0) |
1.62
(0.83–3.10) |
| Number of
chronic conditions |
≥5 |
164
(37.7) |
271
(62.3) |
1 |
164 (37.7) |
147 (33.8) |
124 (28.5) |
1 |
| 2–4 |
251 (41.1 |
359
(58.9) |
1.16 (0.90–1.49) |
172 (28.2) |
194 (31.8) |
244 (40.0) |
0.65 (0.50–0.84)
|
| 1 |
27 (45.8) |
32 (54.2) |
1.39 (0.80–2.41) |
16 (27.1) |
22 (37.3) |
21 (35.6) |
0.61 (0.33–1.11) |
| 0 |
11 (55.0) |
9 (45.0) |
2.02 (0.82–5.11) |
1 (5.0) |
6 (30.0) |
13 (65.0) |
0.09 (0.00–0.43)
|
| Unknown |
3 (20.0) |
12 (80.0) |
0.41 (0.09–1.32) |
7 (46.7) |
6 (40.0) |
2 (13.3) |
1.45 (0.50–4.10) |
| Diagnostic
class or problem area** |
Musculoskeletal |
87 (41.6) |
122 (58.4) |
1 |
69 (33.0) |
73 (34.9) |
67 (32.1) |
1 |
| Respiratory |
54 (46.6) |
62 (53.4) |
1.22
(0.77–1.93) |
36 (31.0) |
40 (34.5) |
40 (34.5) |
0.91
(0.56–1.48) |
| Neurological |
42 (41.2) |
60 (58.8) |
0.98
(0.60–1.59) |
26 (25.5) |
28 (27.5) |
48 (47.0) |
0.69
(0.40–1.17) |
| Digestive |
25 (50.0) |
25 (50.0) |
1.40
(0.75–2.61) |
15 (30.0) |
22 (44.0) |
13 (26.0) |
0.87
(0.43–1.67) |
| Cardiovascular |
70 (40.7) |
102 (59.3) |
0.96
(0.64–1.45) |
47 (27.3) |
60 (34.9) |
65 (37.8) |
0.76
(0.49–1.18) |
| Endocrine,
metabolic and nutritional |
12 (50.0) |
12 (50.0) |
1.40
(0.60–3.30) |
11 (45.8) |
10 (41.7) |
3 (12.5) |
1.72
(0.72–4.04) |
| General |
32 (33.7) |
63 (66.3) |
0.71
(0.43–1.18) |
40 (42.1) |
30 (31.6) |
25 (26.3) |
1.48
(0.89–2.43) |
| Psychological |
34 (39.5) |
52 (60.5) |
0.92
(0.55–1.53) |
36 (41.9) |
24 (27.9) |
26 (30.2) |
1.46
(0.87–2.45) |
| Social
problems |
7 (46.7) |
8 (53.3) |
1.23
(0.42–3.54) |
5 (33.3) |
4 (26.7) |
6 (40.0) |
1.01
(0.31–2.97) |
| Other
diagnosis or problem |
42 (29.6) |
100 (70.4) |
0.59 (0.37–0.92)
|
32 (22.5) |
42 (29.6) |
68 (47.9) |
0.59 (0.36–0.96)
|
| No
obvious diagnosis or problem |
44 (45.4) |
53 (54.6) |
1.16
(0.72–1.89) |
19 (19.6) |
38 (39.2) |
40 (41.2) |
0.49 (0.27–0.87)
|
| Diagnosis
unclear |
7 (22.6) |
24 (77.4) |
0.41 (0.16–0.95)
|
24 (77.4) |
4 (12.9 |
3 (9.7) |
6.96 (3.00–18.21)
|
Compared
with long consultations, the odds of long journeys were reduced by 33% for
medium consultations (OR 0.67, 95% CI 0.50–0.90) and by 47% for short
consultations (OR 0.53, 95% CI 0.40–0.71). Compared with urban environments, the
odds of long journeys decreased by 65% (OR 0.35; 95% CI 0.24–0.52) and 64% (OR
0.36; 95% CI 0.24–0.53) in intermediate and rural regions, respectively. The
odds of long consultations were diminished by 73% in rural places (OR 0.27, 95%
CI 0.16–0.44), by 59% due to patients’ requests as a reason for home visit (OR
0.41, 95% CI 0.15–0.93) and by 91% in the case of patients lacking chronic
conditions (OR 0.09, 95% CI 0.00–0.43).
Home
visits classified as emergencies showed 1.2-fold increased odds of long
consultations (OR 2.20, 95% CI 1.21–4.01). Compared with patients older than 90
years, the odds of long consultations rose by 37% for patients in their 80s (OR
1.37, 95% CI 1.01–1.87), by 127% for patients in their 70s (OR 2.27, 95% CI
1.54–3.34) and by 313% in patients in their 60s (OR 4.13, 95% CI 2.27–7.62). In
the case of out-of-hours home visits, the odds of long consultations were
increased by 206% (OR 3.06, 95% CI 2.36–3.97). The involvement of private or
public day care enhanced the odds of long journeys by 61% (OR 1.61, 95% CI 1.25–2.09)
and of long consultations by 178% (OR 2.78, 95% CI 2.13–3.62).
No
major classes of healthcare problems affected the duration of home visits. Visits
not clustering into the main diagnostic classes (no or other diagnostic class
or problem area) diminished the odds of having long consultations by 41% (OR
0.59, 95% CI 0.36–0.96). On the other hand, situations with an unclear
diagnosis raised the odds almost seven-fold (OR 6.96, 95% CI 3.00–18.21).
Table 4 presents the adjusted ORs for age and sex.
Table 4Multivariate logistic regression adjusted for age and sex based on full (95 GPs, 1139 home visits) and confined (70 GPs, 842 home visits) datasets. 95% CIs not including zero are presented in bold.
|
Full
dataset, adjusted OR (95% CI)
|
Confined
dataset, adjusted OR (95% CI)
|
|
Long
journey (vs short)
|
Long
consultation (vs short/medium)
|
Long
journey (vs short)
|
Long
consultation (vs short/medium)
|
|
Main
variables
|
| Journey
duration |
Long:
>10 min |
– |
1 |
– |
1 |
| Short: ≤10 min |
– |
0.61 (0.47–0.78) |
– |
0.44 (0.33–0.58) |
| Consultation
duration |
Long:
>25 min |
1 |
– |
1 |
– |
| Medium:
16–25 min |
0.68 (0.50–0.91)
|
– |
0.49 (0.35–0.67)
|
– |
| Short: ≤15 min |
0.54 (0.40–0.72)
|
– |
0.38 (0.26–0.54)
|
– |
|
Visit characteristics
|
| Level of
urbanisation |
Urban |
1 |
1 |
1 |
1 |
| Intermediate |
0.32 (0.21–0.47
)
|
0.59 (0.40–0.86
)
|
0.19 (0.10–0.33
)
|
0.54 (0.34–0.84
)
|
| Rural |
0.36 (0.23–0.53
)
|
0.26 (0.15–0.42
)
|
0.54 (0.36–0.80
)
|
0.38 (0.25–0.58
)
|
| Urgency* |
Regular |
1 |
1 |
1 |
1 |
| Urgent |
0.84 (0.63–1.12) |
1.29 (0.96–1.73) |
0.93 (0.67–1.29) |
1.02 (0.73–1.40) |
| Emergency |
0.80 (0.42–1.47) |
2.06 (1.12–3.78
)
|
1.52 (0.78–2.96) |
2.44 (1.23–5.03
)
|
| Reasons
for house visit** |
Impaired
mobility |
1 |
1 |
1 |
1 |
| Lack of
private or public transport |
1.05 (0.61–1.78) |
0.77 (0.40–1.40) |
1.02 (0.52–1.97) |
1.06 (0.53–2.07) |
| Infectivity |
0.70 (0.10–3.73) |
NA |
1.14 (0.04 – 29.0) |
NA |
| Poor
general condition |
0.93 (0.65–1.32) |
1.48 (1.02–2.12
)
|
0.65 (0.43–0.99
)
|
1.16 (0.77–1.74) |
| Patient’s
request |
1.14 (0.59–2.17) |
0.39 (0.14–0.90
)
|
1.23 (0.60–2.49) |
0.30 (0.11–0.71
)
|
| GP absent
from doctor’s office |
0.73 (0.03–7.65) |
NA |
1.14 (0.05–29.09) |
NA |
| Other
reason |
0.78 (0.49–1.23) |
1.50 (0.95–2.35) |
0.55 (0.32–0.94
)
|
1.52 (0.92–2.53) |
| Out-of-hours
house visits |
1.24 (0.97–1.58) |
2.99 (2.31–3.89
)
|
0.96 (0.73–1.27) |
2.43 (1.83–3.23
)
|
| Hospitalisations
during/after house visit |
1.84 (0.88–3.86) |
1.81 (0.85–3.77) |
3.15 (1.31–8.35
)
|
1.15 (0.48–2.71) |
| GP-independent
hospitalisations within 24 hours after house visit |
1.54 (0.52–4.55) |
0.91 (0.25–2.74) |
1.82 (0.54–6.41) |
0.76 (0.20–2.56) |
|
Patient characteristics
|
| Age
categories (years) |
≥90 |
1 |
1 |
1 |
1 |
| 80–89 |
0.94 (0.72–1.25) |
1.39 (1.02–1.89
)
|
1.10 (0.80–1.52) |
1.32 (0.95–1.84) |
| 70–79 |
0.82 (0.55–1.20) |
2.22 (1.49–3.30
)
|
0.99 (0.63–1.54) |
2.05 (1.32–3.18
)
|
| 60–69 |
1.30 (0.72–2.35) |
4.11 (2.26–7.60
)
|
1.47 (0.78–2.77) |
3.28 (1.71–6.48
)
|
| <60 |
1.45 (0.82–2.55) |
1.74 (0.94–3.18) |
0.88 (0.41–1.82) |
1.57 (0.77–3.20) |
| Woman |
1.14 (0.88–1.48) |
1.01 (0.77–1.33) |
1.39 (1.03–1.88) |
1.03 (0.76–1.39) |
| Single-handed
household |
1.11 (0.83–1.49) |
1.17 (0.86–1.58) |
1.31 (0.94–1.84) |
1.16 (0.82–1.62) |
| Public or
private day care |
1.63 (1.26–2.11
)
|
2.78 (2.13–3.64
)
|
1.79 (1.34–2.39
)
|
2.44 (1.82–3.28
)
|
| Patients’
conditions on doctor’s arrival** |
Chronically
ill patients |
1 |
1 |
1 |
1 |
| Chronically
ill patients with acute disease |
0.86 (0.65–1.13) |
1.19 (0.89–1.60) |
1.07 (0.77–1.47) |
1.17 (0.85–1.62) |
| Palliative
care patients |
0.72 (0.41–1.23) |
2.14 (1.25–3.64
)
|
0.65 (0.33–1.21) |
1.92 (1.05–3.55
)
|
| Recovering
patients (e.g., from surgery) |
0.54 (0.21–1.26) |
0.44 (0.13–1.18) |
1.00 (0.38–2.53) |
0.47 (0.15–1.28) |
| Healthy
patients with acute disease |
1.26 (0.70–2.25) |
0.71 (0.35–1.36) |
1.53 (0.80–2.92) |
1.44 (0.75–2.79) |
| Other
condition |
0.83 (0.42–1.60) |
1.50 (0.76–2.90) |
0.86 (0.41–1.74) |
1.22 (0.60–2.44) |
| Number of
chronic conditions |
≥5 |
1 |
1 |
1 |
1 |
| 2–4 |
1.14 (0.89–1.47) |
0.66 (0.50–0.86)
|
1.15 (0.86–1.55) |
0.74 (0.55–0.99
)
|
| 1 |
1.43 (0.82–2.47) |
0.56 (0.29–1.03) |
2.25 (1.25–4.12
)
|
0.57 (0.30–1.04) |
| 0 |
1.98 (0.62–6.54) |
0.01 (0.00–0.08)
|
0.85 (0.04–8.99) |
0.05 (0.00–0.64
)
|
| Unknown |
0.41 (0.09–1.32) |
1.45 (0.49–4.18) |
0.58 (0.16–1.74) |
0.91 (0.31–2.64) |
| Diagnostic
class or problem area** |
Musculoskeletal |
1 |
1 |
1 |
1 |
| Respiratory |
1.18 (0.74–1.86) |
0.86 (0.52–1.40) |
0.88 (0.53–1.47) |
0.69 (0.40–1.16) |
| Neurological |
1.00 (0.62–1.62) |
0.71 (0.41–1.20) |
0.70 (0.39–1.26) |
0.67 (0.36–1.23) |
| Digestive |
1.44 (0.77–2.70) |
0.89 (0.44–1.71) |
2.09 (0.96–4.75) |
0.93 (0.42–1.99) |
| Cardiovascular |
0.98 (0.64–1.49) |
0.80 (0.51–1.26) |
0.88 (0.55–1.41) |
0.68 (0.42–1.09) |
| Endocrine,
metabolic and nutritional |
1.29 (0.54–3.06) |
1.61 (0.67–3.82) |
0.76 (0.24–2.31) |
0.87 (0.27–2.78) |
| General |
0.71 (0.42–1.17) |
1.46 (0.88–2.41) |
0.44 (0.24–0.78
)
|
1.09 (0.62–1.89) |
| Psychological |
0.86 (0.51–1.44) |
1.43 (0.85–2.41) |
0.68 (0.38–1.20) |
1.06 (0.59–1.87) |
| Social
problems |
1.24 (0.42–3.62) |
1.02 (0.31–3.02) |
1.35 (0.34–5.71) |
1.34 (0.32–5.88) |
| Other
diagnosis or problem |
0.57 (0.36–0.90) |
0.56 (0.34–0.91
)
|
0.42 (0.24–0.72
)
|
0.51 (0.29–0.87
)
|
| No
obvious diagnosis or problem |
1.21 (0.74–1.97) |
0.52 (0.29–0.92
)
|
0.99 (0.53–1.83) |
0.58 (0.30–1.12) |
| Diagnosis
unclear |
0.46 (0.17–1.07) |
7.64 (3.23–20.38
)
|
0.36 (0.13–0.86
)
|
6.97 (2.64–22.1
)
|
This
multivariable logistic regression yielded very similar results and showed a
significant trend for increasing odds of having a long consultation with rising
level of urabanisation. Moreover, sensitivity analysis run on the more confined
dataset lacking rarely and frequently reporting GPs, showed similar trends with
more pronounced outcomes (table 4 and supplementary tables 4 and 5 in the
appendix). Further adjustment of logistic regression for GPs’ working time and
practice type did not grossly affect the outcomes (supplementary table 6).
Discussion
This study provides insights into
the temporal aspects of home visits and identifies factors that influence both
journey and consultation duration. We now discuss the results in the context of
evidence derived from studies in the specific setting of home visits but often
have to resort to the office setting as studies on home visits are scarce. For
some parts, we found information from neither home nor office settings but
hypothesise what the underlying mechanisms might be.
Consultation duration during home visits
The mean consultation duration in
our study was 24 minutes, which agrees well with recently published results
from Switzerland [19]. Compared with Germany, consultations
in the context of home visits lasted about 9 minutes longer [11]. Since 73% of home visits were in
urban environments and consultation time was the longest in urban regions, this
variable may strongly influence our overall consultation duration.
The consultation duration can
potentially be explained by workload, as well as by medical and social issues. The
most apparent explanation might be that scheduling many home visits comes at a
price of shorter consultations. The German GPs mentioned above made about four
times more home visits per week than GPs in Switzerland [11]. Our data indicate that high
workload, as reflected by working full time and in single practice, results in a
shorter consultation time. From the medical point of view, the duration of
consultations in the office setting is affected by the patient’s acute condition
and comorbidities as well as by the type of tasks performed during the appointment
[14–16]. Most probably, other important
factors are on a system level, with different time constraints and
reimbursement rules for home visits across countries [16]. In our study, the majority of
homebound patients were suffering from multiple chronic conditions, which may
necessitate a prolonged consultation time to be properly addressed. Also,
physical examinations, laboratory tests or surgical procedures extend
consultation time [14]. This type of information cannot be
extracted from our dataset, but a recent study showed that manual or laboratory
tasks are performed in no more than 15% of home visits in Switzerland [19]. One may assume a similar proportion
to be found in home visits reported by Sentinella GPs in our study. This in
turn suggests that consultation time is mainly based on the conversation
between GPs and patients, and may also cover psychological and social issues,
which require more time to be discussed. Indeed, psychological problems have
been associated with long consultations in the office [16,
26].
Additionally, conditions of the
healthcare market may also influence the duration of home visits. Urban
environments were found to raise the odds for having long consultations. This
may be explained by differences in workload across urbanisation levels, i.e.,
the more patients are seen in the office, the fewer patients can be visited at
home. Urban GPs saw fewer patients than rural ones. However, the difference did
not reach statistical significance and seemed too small to fully explain the
differences in consultation length between levels of urbanisation, and
additional factors may play a role. For instance, heath problems may differ
across urbanisation levels. Also, patients living in urban areas may request
longer consultations than those in rural ones. Our finding is contrary to data
from Germany, where urban regions were reported to be associated with shorter home
visits [11]. In Germany, patients in urban
regions had fewer comorbidities than those in rural regions and thus might
require less time during the home visit.
In our study, long consultations
were also associated with long journeys. Journey duration and urbanisation
level may be interdependent since journey duration was highest in urban
regions. Furthermore, growing number of chronic conditions was found to raise the
odds of having a long consultation, which is most likely owing to multiple
health issues that need to be covered during home visit. Notably, the odds of
long consultations were strongly elevated in patients of middle age. This is
surprising for one would assume that more comorbidities with growing age result
in extended consultation times. One explanation might be that older patients
may suffer from different health problems than younger ones and thus require
less consultation time. Also, chronic conditions in older patients may be well
known to GP and thus require less time for management, whereas younger patients
may rather suffer from new health problems, potentially evoking fear and
sorrow, which necessitates longer consultations. Interestingly, age and
comorbidities did not influence consultation duration in the German study [11]. The reason for this remains
elusive.
Day care involvement was found to raise
the odds of a long consultation. As one possible explanation, patients in day
care usually show multiple chronic conditions, which itself is positively
associated with long consultations. Also, patients assisted by day care might become
highly dependent on home visits as the only way of receiving primary care. They
may receive fewer but longer consultations. Further, patients on day care may
be accompanied by nurses who may direct specific questions to GPs. Emergency
and out-of-hours appointments strongly favoured long consultations, too. This
may be explained by complex and unexpected cases encountered in emergency home
visits, which may require extended medical intervention and may eventually also
lead to hospitalisation. A recent study from Switzerland revealed that physical
examination, medication prescription and medical report preparation were more frequent
during emergency home visits [19]. Some of the out-of-hours home
visits would certainly have an emergency character and thus necessitate longer consultations.
GPs may also schedule complex patients with many comorbidities out-of-hours, to
be able to fully address all medical problems and cover psychological and
social aspects without time pressure.
Journey duration during home visits
The time spent on journeys to the
visit was slightly less than that reported in Germany (11.8 ± 7.2 minutes vs 13.0
± 14.3 minutes) [11]. It is known from previous studies
that distance influences the willingness to make home visits. A survey of GPs
in Ontario, Canada, revealed that 29% of doctors making home visits accepted a
journey duration of up to 15 minutes, whereas 61% were inclined to travel 15 to
29 minutes [8]. In Northern Ireland, so called
outside-area patients who live >5 km away from the doctor’s practice in
urban environments (or >11 km in rural ones), have a high probability to be
declined 24-hour cover by GPs [13]. In Switzerland, the distance
between patients and doctors are much shorter than in Canada, Northern Ireland –
or Norway, where home visits are offered for patients residing even 50 km away [12]. The average distance between
patients and primary care providers in Switzerland is 1.1 km [27]. Thus, distance itself probably has
a minor impact on the willingness to offer home visits.
Interestingly, travel was most time consuming
in urban areas. Time expenditure does not seem to be caused by the distance
itself, since the average distance between patient and point of primary care
equals 0.7 km in urban, 1.2 km in intermediate and 2.8 km in rural regions [27]. Likely, the mode of transport and
traffic volume might determine effective journey duration instead.
Frequency of home visits
The GPs in our study performed 3.4
home visits per week with an annual number of 104 visits per practice. This
agrees with data published earlier [18,
28]. From a European perspective, the
frequency of home visits in Switzerland is low [29]. In Germany, for instance, home
visits are four times more frequent than in Switzerland [11]. Advanced patient age and
multimorbidity, as well as female sex, have previously been associated with
higher chances of obtaining home visits [4, 11, 29–31]. None of these factors is likely to
explain the observed low home visit frequency, since the patient population
described in the present analysis resembles the one reported from Germany [11]. Additional factors, which are not
accessible through our analysis, may contribute. For instance, patients may be
more often accompanied by relatives to reach emergency departments or walk-in
practices in Switzerland. They may also prefer in-practice consultations over
home visits.
Female GPs, young GPs and group
practices have been correlated with a decreasing number of home visits [29,
30]. In line with these reports, our
results reveal that GPs who did not conduct home visits were rather female, of younger
age and worked more often in a group practice compared with their colleagues
conducting home visits.
Strengths and limitations
This study relied on a large
statistical sample. Representative numbers of GPs collaborated in the six
Sentinella regions, except for the underrepresented central and overrepresented
south-eastern region. Overall, 124 out of 168 GPs (74%) conducted home visits,
which is a little higher than the national average of 67% [27]. After excluding rarely visiting GPs,
there remain 95 GPs or 57% who performed home visits on a regular basis. Clearly,
women are underrepresented among the Sentinella GPs contributing to this study
(24% vs 46% on the national level) [32]. This may influence our results
because, according to the comparison between GPs performing and not performing home
visits, the proportion of women was higher among non-visiting doctors. Also, as
mentioned above, gender affects home visits [29,
30].
The robustness of our results is
supported by the sensitivity analysis comparing the original dataset with the confined
one, which omits rarely and frequently reporting GPs. Exclusion of these 25, representing 26% of the entire sample, did not
markedly influence our results.
Sentinella physicians are well
trained in data collection as they regularly participate in various Sentinella studies.
Nonetheless, reports are potentially subject to selection and recall bias. In
fact, detailed home visits were reported less frequently than home visits in
the basic dataset (2.8 ± 2.0 vs 3.6 ± 3.9 reports per week), most probably because
of time constraints. Also, time was estimated rather than measured since data entries
centred around common values of 5, 10, 15 etc. minutes.
Finally, our dataset does not
provide any information on patients’ social status, which was reported to
influence home visits [3,
33]. Thus, the influence of
socioeconomic level on our outcome cannot be measured and may confound our
results.
Implications
Despite making fewer home visits per
week on European average, Swiss GPs offer longer consultations to their
patients. The majority of home visits are routine appointments and an integral
part of GPs work. The forthcoming shortage of GPs and the aging population in
Switzerland will most certainly increase GPs’ time burden and negatively affect
home visits in the future. Increasing the number of GPs through improved
training, better work-life balance and higher financial attractiveness [34–36], as well as delegation of home
visits to advanced practice nurses [37,
38] or private home healthcare agencies
[39] are possible options to face the upcoming
challenges in primary care in Switzerland.
Conclusion
On average, GPs conduct rather few
but long home visits, especially for multimorbid patients. GPs working
part-time, in group practice or in urban regions devote more time to home
visits.
Availability
of data and materials
Datasets are available upon request
(stefan.essig[at]unilu.ch).
Acknowledgements
We would like to thank the physicians
of the Sentinella network who participated in this study. We also thank Julia
Fritz for help with QGIS.
Authors’ contributions: SE and CM developed the
questionnaire and designed the study. RDF analysed all data and drafted the
original and revised manuscript. RDF and SE interpreted the data. SE and CM
reviewed the manuscript. All authors read and approved the final version of the
manuscript.
Appendix: Supplementary tables
The appendix is available in the pdf
version of this article.
Stefan Essig
Centre of Primary and Community Care
Lucerne, University of Lucerne
Frohburgstrasse 3
CH-6002 Lucerne
stefan.essig[at]unilu.ch
References
1. van den Berg MJ, Cardol M, Bongers FJ, de Bakker DH. Changing patterns of home visiting in general practice: an analysis of electronic medical records. BMC Fam Pract. 2006 Oct;7(1):58. https://doi.org/10.1186/1471-2296-7-58
2. Snijder EA, Kersting M, Theile G, Kruschinski C, Koschak J, Hummers-Pradier E, et al. Hausbesuche: Versorgungsforschung mit hausärztlichen Routinedaten von 158.000 Patienten. Gesundheitswesen. 2007 Dec;69(12):679–85. https://doi.org/10.1055/s-2007-993181
3. Aylin P, Majeed FA, Cook DG. Home visiting by general practitioners in England and Wales. 1996;313:4. https://doi.org/10.1136/bmj.313.7051.207
4. Meyer GS, Gibbons RV. House calls to the elderly—a vanishing practice among physicians. N Engl J Med. 1997 Dec;337(25):1815–20. https://doi.org/10.1056/NEJM199712183372507
5. Joyce C, Piterman L. Trends in GP home visits. Aust Fam Physician. 2008 Dec;37(12):1039–42.
6. Hansen H, Pohontsch NJ, Bole L, Schäfer I, Scherer M. Regional variations of perceived problems in ambulatory care from the perspective of general practitioners and their patients - an exploratory focus group study in urban and rural regions of northern Germany. BMC Fam Pract. 2017 May;18(1):68. https://doi.org/10.1186/s12875-017-0637-x
7. Theile G, Kruschinski C, Buck M, Müller CA, Hummers-Pradier E. Home visits - central to primary care, tradition or an obligation? A qualitative study. BMC Fam Pract. 2011 Apr;12(1):24. https://doi.org/10.1186/1471-2296-12-24
8. Malik S, Goldman R, Kevork N, Wentlandt K, Husain A, Merrow N, et al. Engagement of Primary Care Physicians in Home Palliative Care. J Palliat Care. 2017 Jan;32(1):3–10. https://doi.org/10.1177/0825859717706791
9. Hammett T. What do Victoria family physicians think about housecalls? Can Fam Physician. 2013 Jan;59(1):e33–8.
10. Salisbury H. Helen Salisbury: why I resist giving up home visits. BMJ. 2019 Nov;367:l6618. https://doi.org/10.1136/bmj.l6618
11. Pochert M, Voigt K, Bortz M, Sattler A, Schübel J, Bergmann A. The workload for home visits by German family practitioners: an analysis of regional variation in a cross-sectional study. BMC Fam Pract. 2019 Jan;20(1):3. https://doi.org/10.1186/s12875-018-0891-6
12. Raknes G, Morken T, Hunskår S. Reiseavstand og bruk av legevakt. Tidsskr Nor Laegeforen. 2014;134(22):2151–5. https://doi.org/10.4045/tidsskr.14.0443
13. O’Reilly D, Steele K. The removal of patients who live outside the practice boundary: a study of outside-area removals in Northern Ireland in 2001-2002. Br J Gen Pract. 2005 May;55(514):384–6.
14. Blumenthal D, Causino N, Chang Y, Culpepper L, Marder W, Saglam D, et al. The Duration of Ambulatory Visits to Physicians. The Journal o f Family Practice. 1999;48:264–71.
15. Petek Šter M, Švab I, Živčec Kalan G. Factors related to consultation time: experience in Slovenia. Scand J Prim Health Care. 2008;26(1):29–34. https://doi.org/10.1080/02813430701760789
16. Deveugele M, Derese A, van den Brink-Muinen A, Bensing J, De Maeseneer J. Consultation length in general practice: cross sectional study in six European countries. BMJ. 2002 Aug;325(7362):472–472. https://doi.org/10.1136/bmj.325.7362.472
17. Barnett K, Mercer SW, Norbury M, Watt G, Wyke S, Guthrie B. Epidemiology of multimorbidity and implications for health care, research, and medical education: a cross-sectional study. Lancet. 2012 Jul;380(9836):37–43. https://doi.org/10.1016/S0140-6736(12)60240-2
18. Mueller Y, David S, Cohidon C, Locatelli I, Senn N. Home visits made by general practitioners in the canton of Vaud between 2006 and 2015. Swiss Med Wkly. 2019 Mar;149:w20037. https://doi.org/10.4414/smw.2019.20037
19. Lutula J, Taffé P, David S, Senn N, Mueller Y. Swiss family physicians and home visits: a 10-year retrospective analysis and typology based on billing data. Swiss Med Wkly. 2021 Feb;151(506):w20396. https://doi.org/10.4414/smw.2021.20396
20. Neuner-Jehle S, Graber SM, Keizer E, Huber C, Blozik E, Rosemann T, et al. Time trends in general practitioners’ home visits for older patients: a retrospective cross-sectional study from Switzerland. Swiss Med Wkly. 2021 Jul;151(2728):w20539. https://doi.org/10.4414/smw.2021.20539
21. Excoffier S, Herzig L, N’Goran AA, Déruaz-Luyet A, Haller DM. Prevalence of multimorbidity in general practice: a cross-sectional study within the Swiss Sentinel Surveillance System (Sentinella). BMJ Open. 2018 Mar;8(3):e019616. https://doi.org/10.1136/bmjopen-2017-019616
22. Meuli N, Jungo KT, Merlo C, Streit S, Essig S. Frequency of home visits where general practitioners are exposed to a problem different from that foreseen - a Swiss cross-sectional study. Swiss Med Wkly. 2021 Oct;151(3940):w30062. https://doi.org/10.4414/SMW.2021.w30062
23. Kohler F, Zecha L, Goebel V. Raumgliederungen der Schweiz Gemeindetypologie und Stadt/Land-Typologie 2012 https://www.bfs.admin.ch/bfs/de/home/statistiken/kataloge-datenbanken/publikationen.assetdetail.2543323.html; Accessed March 13, 2022. 2017.
24. Tarifsystem T. https://www.bag.admin.ch/bag/de/home/versicherungen/krankenversicherung/krankenversicherung-leistungen-tarife/Aerztliche-Leistungen-in-der-Krankenversicherung/Tarifsystem-Tarmed.html; Accessed December 21, 2021.
25. World Organization of National Colleges, Academies, and Academic Associations of General Practitioners/Family Physicians, editor. ICPC-2-R: international classification of primary care. Rev. 2nd ed. Oxford ; New York: Oxford University Press; 2005.
26. Andersson SO, Ferry S, Mattsson B. Factors associated with consultation length and characteristics of short and long consultations. Scand J Prim Health Care. 1993 Mar;11(1):61–7. https://doi.org/10.3109/02813439308994904
27. Clausen F, Klinke GP. Arztpraxen und ambulante Zentren 2017: Tätigkeit, Zugänglichkeit und räumliche Verteilung https://www.bfs.admin.ch/bfs/de/home/statistiken/gesundheit/gesundheitswesen/arztpraxen.assetdetail.10247283.html; Accessed December 14, 2021. 2019.
28. Cohidon C, Cornuz J, Senn N. Primary care in Switzerland: evolution of physicians’ profile and activities in twenty years (1993-2012). BMC Fam Pract. 2015 Aug;16(1):107. https://doi.org/10.1186/s12875-015-0321-y
29. Boerma WG, Groenewegen PP. GP home visiting in 18 European countries. Adding the role of health system features. Eur J Gen Pract. 2001;7(4):132–7. https://doi.org/10.3109/13814780109094331
30. Kersnik J. Observational study of home visits in Slovene general practice: patient characteristics, practice characteristics and health care utilization. Fam Pract. 2000 Oct;17(5):389–93. https://doi.org/10.1093/fampra/17.5.389
31. Sairenji T, Jetty A, Peterson LE. Shifting Patterns of Physician Home Visits. J Prim Care Community Health. 2016 Apr;7(2):71–5. https://doi.org/10.1177/2150131915616366
32. Bundesamt für Statistik. Strukturdaten der Praxen und ambulanten Zentren 2019. https://www.bfs.admin.ch/bfs/de/home/statistiken/gesundheit/gesundheitswesen/arztpraxen.assetdetail.18924749.html; Accessed December 14, 2021.
33. Almeida AP, Nunes BP, Duro SM, Facchini LA. Socioeconomic determinants of access to health services among older adults: a systematic review. Rev Saude Publica. 2017 May;51(0):50. https://doi.org/10.1590/s1518-8787.2017051006661
34. Tschudi P, Bally K, Zeller A. Wer will heute noch Hausarzt/ärztin werden…? Umfragen bei Medizinstudierenden und Jungärzten. Praxis (Bern). 2013;102(6):335–9. https://doi.org/10.1024/1661-8157/a001228
35. Cerny T, Rosemann T, Tandjung R, Chmiel C. Ursachen des Hausärztemangels – ein Vergleich zwischen Frankreich und der Schweiz. Praxis (Bern). 2016;105(11):619–36. https://doi.org/10.1024/1661-8157/a002362
36. Studerus L, Ahrens R, Häuptle C, Goeldlin A, Streit S. Optional part-time and longer GP training modules in GP practices associated with more trainees becoming GPs - a cohort study in Switzerland. BMC Fam Pract. 2018 Jan;19(1):5. https://doi.org/10.1186/s12875-017-0706-1
37. Kambli K, Flach D, Schwendimann R, Cignacco E. Health Care Provision in a Swiss Urban Walk-In-Clinic. Is Advanced Nursing Practice a Solution for a New Model in Primary Care? / Gesundheitsversorgung in einer städtischen Walk-In-Praxis in der Schweiz. Ist Advanced Nursing Practice ein neues Modell in der Grundversorgung? International Journal of Health Professions. 2015;2(1):64–72. https://doi.org/10.1515/ijhp-2015-0006
38. Gysin S, Sottas B, Odermatt M, Essig S. Advanced practice nurses’ and general practitioners’ first experiences with introducing the advanced practice nurse role to Swiss primary care: a qualitative study. BMC Fam Pract. 2019 Nov;20(1):163. https://doi.org/10.1186/s12875-019-1055-z
39. Fortin Ensign S, Baca-Motes K, Steinhubl SR, Topol EJ. Characteristics of the modern-day physician house call. Medicine (Baltimore). 2019 Feb;98(8):e14671. https://doi.org/10.1097/MD.0000000000014671