Applicability of T cell receptor repertoire sequencing analysis to unbalanced clinical samples – comparing the T cell receptor repertoire of GATA2 deficient patients and healthy controls
DOI: https://doi.org/10.57187/SMW.2023.40046
Valentin
von
Niederhäusern, Marie
Ghraichy, Johannes
Trück
Division
of Immunology and Children’s Research Center, University Children’s Hospital,
University of Zurich (UZH), Zurich, Switzerland
Summary
T cell
receptor repertoire sequencing (TCRseq) has become one of the major omic tools
to study the immune system in health and disease. Multiple commercial solutions
are currently available, greatly facilitating the implementation of this
complex method into translational studies. However, the flexibility of these
methods to react to suboptimal sample material is still limited. In a clinical
research context, limited sample availability and/or unbalanced sample material
can negatively impact the feasibility and quality of such analyses. We sequenced
the T cell receptor repertoires of three healthy controls and four patients
with GATA2 deficiency using a commercially available TCRseq kit and thereby (1)
assessed the impact of suboptimal sample quality and (2) implemented a subsampling
strategy to react to biased sample input quantity. Applying these strategies, we
did not find significant differences in the global T cell receptor repertoire
characteristics such as V and J gene usage, CDR3 junction length and repertoire
diversity of GATA2-deficient patients compared with healthy control samples. Our
results prove the adaptability of this TCRseq protocol to the analysis of
unbalanced sample material and provide encouraging evidence for use of this
method in future studies despite suboptimal patient samples.
Abbreviations
- CDR3
-
complementarity-determining region 3
- PBMCs
-
peripheral blood mononuclear cells
- PCA
-
principal component analysis
- PCR
-
polymerase chain reaction
- TCR
-
T cell receptor
- TCRseq
-
T cell receptor repertoire sequencing
- TRA
-
T cell receptor alpha
- TRB
-
T cell receptor beta
Introduction
It is the immense diversity in T-cell
receptors (TCRs) that allows T cells to recognise a plethora of different
antigens [1]. This diversity is generated during somatic rearrangements of
various V, D and J genes during a process called V(D)J recombination and is
further increased by addition or deletion of random nucleotides at the
recombinational junctions [2]. The totality of an individual’s T cell receptors
is referred to as the TCR repertoire. As this can be a highly dynamic reflection
of an individual’s immune status and history, in recent years TCR repertoire
analysis by high-throughput sequencing has become a valuable tool in assessing
the immune system in health and disease. Methodological advancements, optimisation
of sequence library preparation protocols and development of powerful
bioinformatic analysis tools have led to an increasing number of seminal
studies relying on technologies dissecting the molecular composition of
circulating B and T cells. Especially in a clinical context, TCRseq has been
used to study immune responses during infection [3], autoimmune disease [4] and
cancer [5], and other studies have analysed the effects of interventions such
as vaccination [6] or immunotherapy [7]. Recognising the enormous potential of
TCRseq methods, several commercial solutions are now available that allow faster
and easier implementation in a clinical setting (benchmarked in [8]). Different
commercial solutions use individual preparation protocols, each with certain
advantages and limitations, making it crucial to choose a suitable protocol for
any given research question. Additional difficulties can arise in the clinical
research setting due to heterogeneous sample quantity and quality or diverging
sample pre-processing when using rare or biobanked patient material. When
sampling cannot be performed systematically, for example in particularly
vulnerable patients or in a setup without a central sampling strategy, uniform
sample quantity can become unachievable. Varying input material has a major
impact on T cell receptor repertoire characteristics, particularly on
repertoire diversity measures [8].
We have implemented a TCRseq protocol based
on the commercially available Takara SMARTer Human TCR a/b Profiling Kit (v2) and
describe efforts to deal with unbalanced sample material. We included peripheral
blood samples of three healthy controls and four patients with confirmed GATA2
deficiency. GATA2 deficiency is a rare inborn error of immunity caused by
monoallelic mutations in GATA2 and is characterised by immunodeficiency with
susceptibility to infection, risk of myelodysplasia, and lymphatic or vascular
complications [9, 10]. Numbers of circulating monocytes, natural killer cells,
dendritic cells and B cells are profoundly reduced in GATA2 deficiency, whereas
total T cell numbers are not significantly affected [11]. Within the T cell
compartment of GATA2 patients, there is an increasingly cytotoxic phenotype,
leading to an inverted CD4:CD8 ratio, and a shift from naïve to terminal
effector CD8 cells [12]. Whether these changes are reflected in the T cell
receptor repertoires has not been studied yet.
Here we show the applicability of the
Takara TCRseq protocol to suboptimal samples with lower than recommended input
RNA quality (RNA integrity number <8). Furthermore, we successfully applied
the method on samples collected in heparin tubes that are not approved for use
because of possible inhibitory effects of heparin on reverse transcriptases. The
potential bias introduced by uneven RNA input quantity was reduced by applying
a subsampling strategy on the collapsed sequence level. Our results show that
with the careful adaptation of data preprocessing, this TCRseq protocol can be used
for the analysis of suboptimal and unbalanced sample material but still emphasise
the importance of careful experimental planning. We used this optimised dataset
to investigate the TCR repertoires of GATA2 patients in comparison with healthy
control samples. Despite severely disturbed immunophenotypes and the known risk
of opportunistic infections, no significant difference in global repertoire
characteristics such as V and J gene usage, junction length or repertoire
diversity were found between GATA2-deficient patients and controls.
Materials and methods
Patient sample collection, preprocessing and
RNA extraction
This study was reviewed and approved by
Zurich ethics committee (KEK-ZH 2015-0555). Informed written consent was
obtained from all participants and peripheral blood samples were collected by venepuncture
from three healthy controls and four patients with GATA2 deficiency. Table 1
summarises information about participants and samples collected. Peripheral
blood mononuclear cells (PBMCs) were isolated by centrifugation of blood diluted
with phosphate-buffered saline over Ficoll-Paque (Sigma-Aldrich) and
cryopreserved in freezing medium (90% fetal bovine serum, 10% dimethyl sulfoxide).
After thawing, a minimum of 0.45 million PBMCs were lysed in RLT buffer
(Qiagen), snap frozen on dry ice and RNA was extracted using the RNeasy Mini
Kit (Qiagen). RNA quality was assessed on an Agilent
2100 Bioanalyzer using the RNA 6000 Pico Kit according to manufacturer standard
protocol and RNA integrity numbers
are listed in table 1. RNA quality assessment for two samples failed.
Table 1Patient characteristics, sample
handling and library preparation specificities.
|
|
Sex
|
Age (y)
|
Anticoagulant
|
PBMC cell number (Mio)
|
RNA quality (RNA integrity number)
|
RNA input (ng)
|
PCR2 cycles
|
| Pat1 |
F |
8.1 |
Heparin |
3.64 |
8.6 |
300 |
18 |
| Pat2 |
M |
21 |
Heparin |
13.5 |
6.8 |
300 |
18 |
| Pat3 |
F |
24.1 |
Heparin |
1.6 |
8 |
300 |
18 |
| Pat4 |
F |
14.8 |
na |
0.45 |
na |
100 |
18 |
| Ctrl1 |
M |
44 |
EDTA |
3 |
8.7 |
100 |
16 |
| Ctrl2 |
M |
8 |
EDTA |
3 |
6.6 |
100 |
18 |
| Ctrl3 |
F |
43 |
EDTA |
3 |
na |
100 |
18 |
T cell receptor library preparation
For library preparation, the SMARTer human
TCR a/b Profiling Kit v2 (Takara Bio) was used with the following specifications.
RNA quality was below the suggested minimum requirement of RNA integrity
numbers ≥8 for some of the samples and RNA input quantity for reverse
transcription varied between 100 ng and 300 ng (table 1). The number of cycles
for second PCR was 18 for all except for control C1 with only 16 cycles. A mixture
of TRA and TRB reverse primers was used to amplify both T cell receptor subunit
chains according to the manufacturer’s instructions. Clean-up and validation were
performed by running the libraries on an agarose gel and subsequently purifying
the corresponding size band using the MinElute gel extraction kit (Qiagen).
Amplicon DNA concentrations were measured on a Qubit fluorometer and normalised
at the moment of pooling. Using the multiplexing capabilities of this approach,
all seven samples were pooled and run on the Illumina MiSeq platform with 2 × 300
bp paired-end chemistry.
Data processing and subsampling
Raw sequencing data was first processed
through the Cogent NGS Immune Profiler software using standard settings. This
resulted in an unbalanced dataset that was subsequently used for all
proportional analyses and is subsequently referred to as the immune profiler
dataset. To mitigate bias introduced through unequal RNA input, we included a
subsampling step in the data processing. Higher RNA input amounts led to lower
repertoire coverage and thus a lower oversequencing threshold (reads per unique
molecular identifier). We therefore integrated an additional subsampling step on
the level of collapsed reads prior to clonotyping in MIXCR. To do so, oversequencing
threshold in MIGEC was manually set to 1, allowing all reads at this initial
stage to be kept. Subsampling was performed by sample and clonal chain. A cut-off
threshold of 2 was selected for the sample with the lowest read number (Ctrl3,
TRA, R1) to remove low-coverage, low-fidelity singletons while keeping the most
possible data. This led to 13,139 collapsed reads for this particular sample.
All other samples were then subsampled to this same number of collapsed reads,
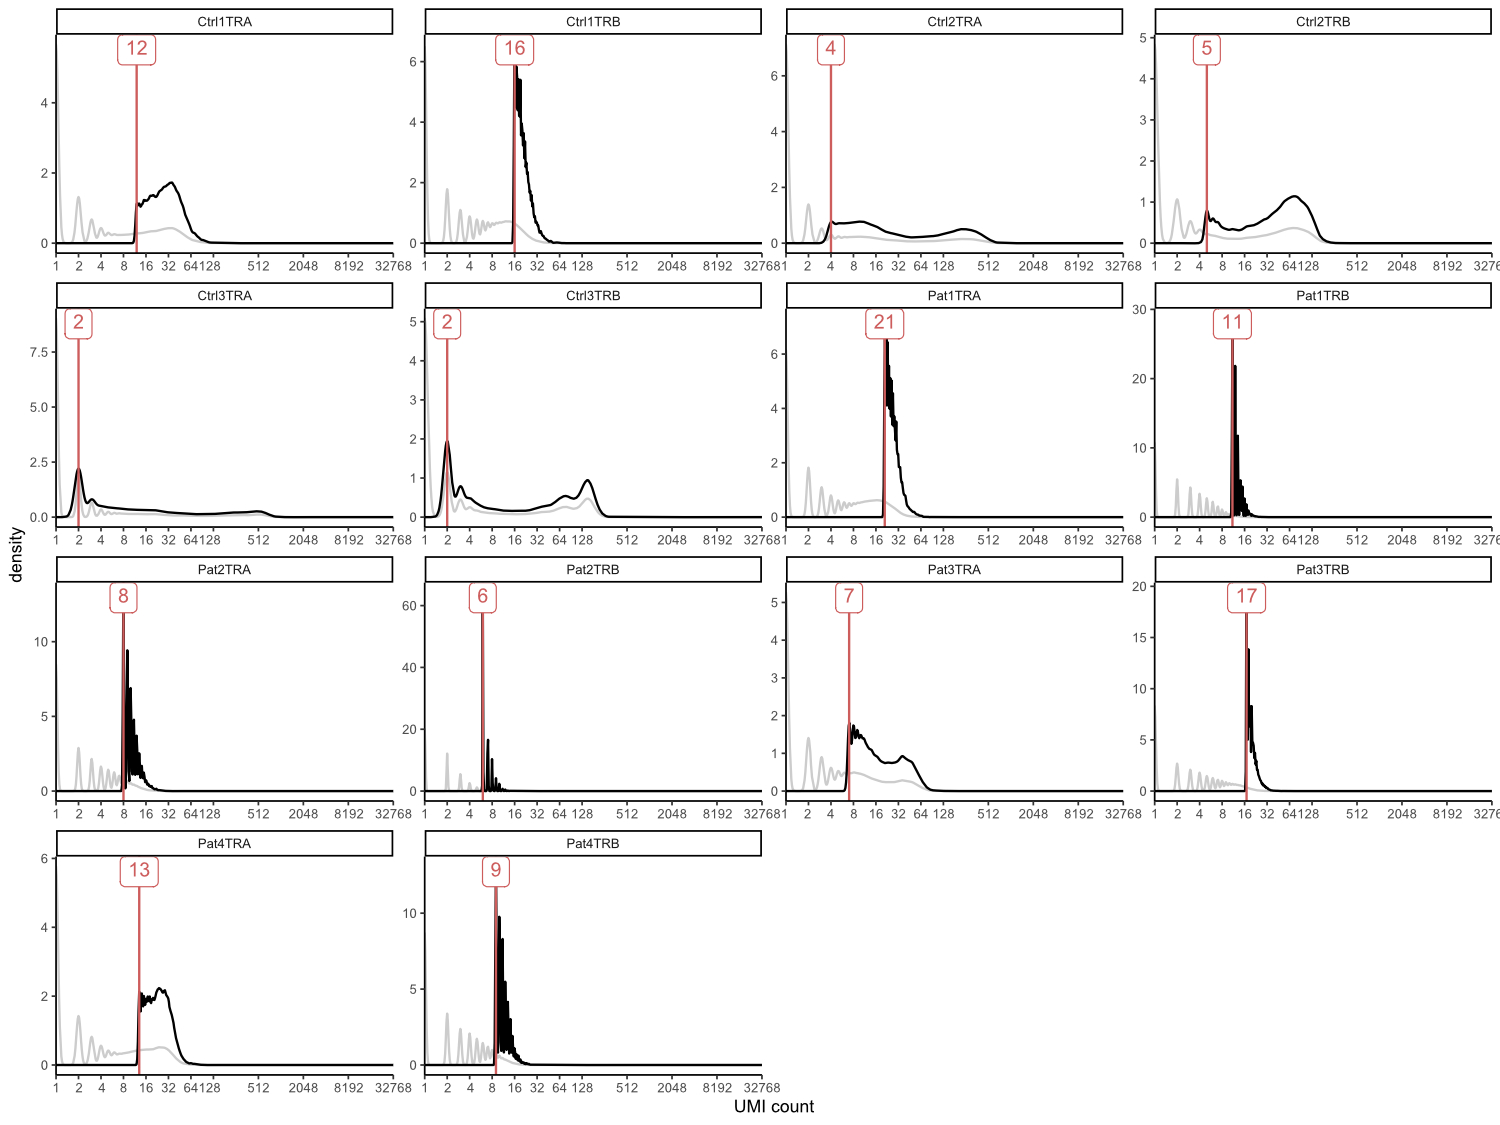
starting from highest sequencing depth, retaining the best quality reads. Resulting
unique molecular identifier coverage distributions and cut-off thresholds are
shown in supplementary figure S1 (in the appendix). Subsampled reads were then run
through MIXCR for sequence assembly and clonotyping and resulting sequence
numbers are shown in table 2. Junction length and gene proportion analyses were
performed on the immune profiler dataset whereas repertoire diversity, which is
more sensitive to input bias, was calculated on the subsampled dataset.
Table 2T cell receptor sequencing dataset
run through standard Cogent NGS Immune Profiler pipeline compared with our
in-house subsampling strategy.
|
|
Immune profiler dataset
a,b
|
Subsampled dataset
a
|
|
SAMPLE
|
Chain
|
Total reads
|
Collapsed sequences
c
|
Clonotype count
|
Collapsed sequences
c
|
Clonotype count
|
| Pat1 |
TRA |
1,266,143 |
48,952 |
33,976 |
8426 |
6891 |
| TRB |
2,517,718 |
460,159 |
231,205 |
9379 |
8335 |
| Pat2 |
TRA |
434,841 |
35,507 |
26,186 |
8812 |
7244 |
| TRB |
1,460,174 |
425,316 |
250,809 |
8682 |
7517 |
| Pat3 |
TRA |
431,580 |
14,106 |
9413 |
8677 |
5956 |
| TRB |
2,171,371 |
157,592 |
63,917 |
8464 |
6952 |
| Pat4 |
TRA |
558,372 |
19,412 |
9140 |
8803 |
4914 |
| TRB |
701,046 |
76,773 |
29,211 |
9937 |
5899 |
| Ctrl1 |
TRA |
577,265 |
14,057 |
7791 |
8500 |
4574 |
| TRB |
863,327 |
51,205 |
19,005 |
8315 |
4762 |
| Ctrl2 |
TRA |
1,811,898 |
6154 |
4457 |
8290 |
3860 |
| TRB |
936,385 |
11,194 |
7815 |
8754 |
4986 |
| Ctrl3 |
TRA |
1,640,612 |
4323 |
2742 |
8913 |
2665 |
| TRB |
977,467 |
7933 |
4226 |
9536 |
3317 |
Principal component analysis (PCA), repertoire
diversity and statistical analysis
Non-productive sequences containing stop
codons or out-of-frame rearrangements were removed for repertoire analysis (7.6%
and 15% of all clonotypes in the immune profiler dataset and the subsampled
dataset, respectively). As repertoire diversity readout, the Shannon diversity
index and Rényi diversity profiles were calculated based on the clonal fraction
of sequences using the vegan R package [13]. PCA was performed with the prcomp
function, inputting V and J gene proportions of both combined clonal chains
respectively. PCA plots were created using the factoextra R package [14].
Statistical analysis and plotting were performed in the R environment [15]
using ggplot and cowplot packages [16, 17]. For pairwise comparisons between
groups, a Wilcoxon test was performed.
Data availability
Raw sequence data used for analysis in
this study are available at the NCBI Sequencing Read Archive (www.ncbi.nlm.nih.gov/sra) under BioProject number PRJNA821039.
Results
Sequence numbers
T cell receptor repertoire sequencing of
all seven samples yielded a total of 16.35 million raw reads with 41.1% being
assigned to the alpha chain of the T cell receptor (TRA). Quality filtering and
unique molecular identifier-based consensus building using the standard Cogent
Immune Profiler pipeline followed by removal of non-productive sequences resulted
in 1.33 million collapsed reads used for clonotyping. TRA reads generally had
higher sequencing depth than TRB and were therefore more extensively collapsed,
amounting to a low proportion of 10.7% of collapsed reads compared with 89.3% for
TRB. Clonotyping after removal of non-productive sequences resulted in 699,893 unique
clonotypes in the immune profiler dataset and 77,872 clonotypes in the
subsampled dataset. Subsampling by clonal chain normalised the dataset with 46.4%
of remaining clonotypes being assigned to TRA. The number of sequences by
sample and chain at every step in the two datasets are outlined in table 2.
Global TCR repertoire characteristics and
diversity are similar in GATA2-deficient patients and healthy controls
Using the immune profiler dataset, we
calculated V and J gene usage and CDR3 junction length distribution for
GATA2-deficient patients and healthy controls. Abnormal T cell receptor
complementarity-determining region 3 (CDR3) region lengths have previously been
described in immunodeficient patients. One study detected shorter junctions in severe
combined immunodeficiency and ataxia telangiectasia patients and longer
junctions in patients with ICF syndrome (Immunodeficiency, Centromere
instability and Facial anomalies syndrome) [18]. In this work, distribution of
CDR3 junction length or mean junction length from both chains were not
significantly different between GATA2 deficient patients compared with healthy
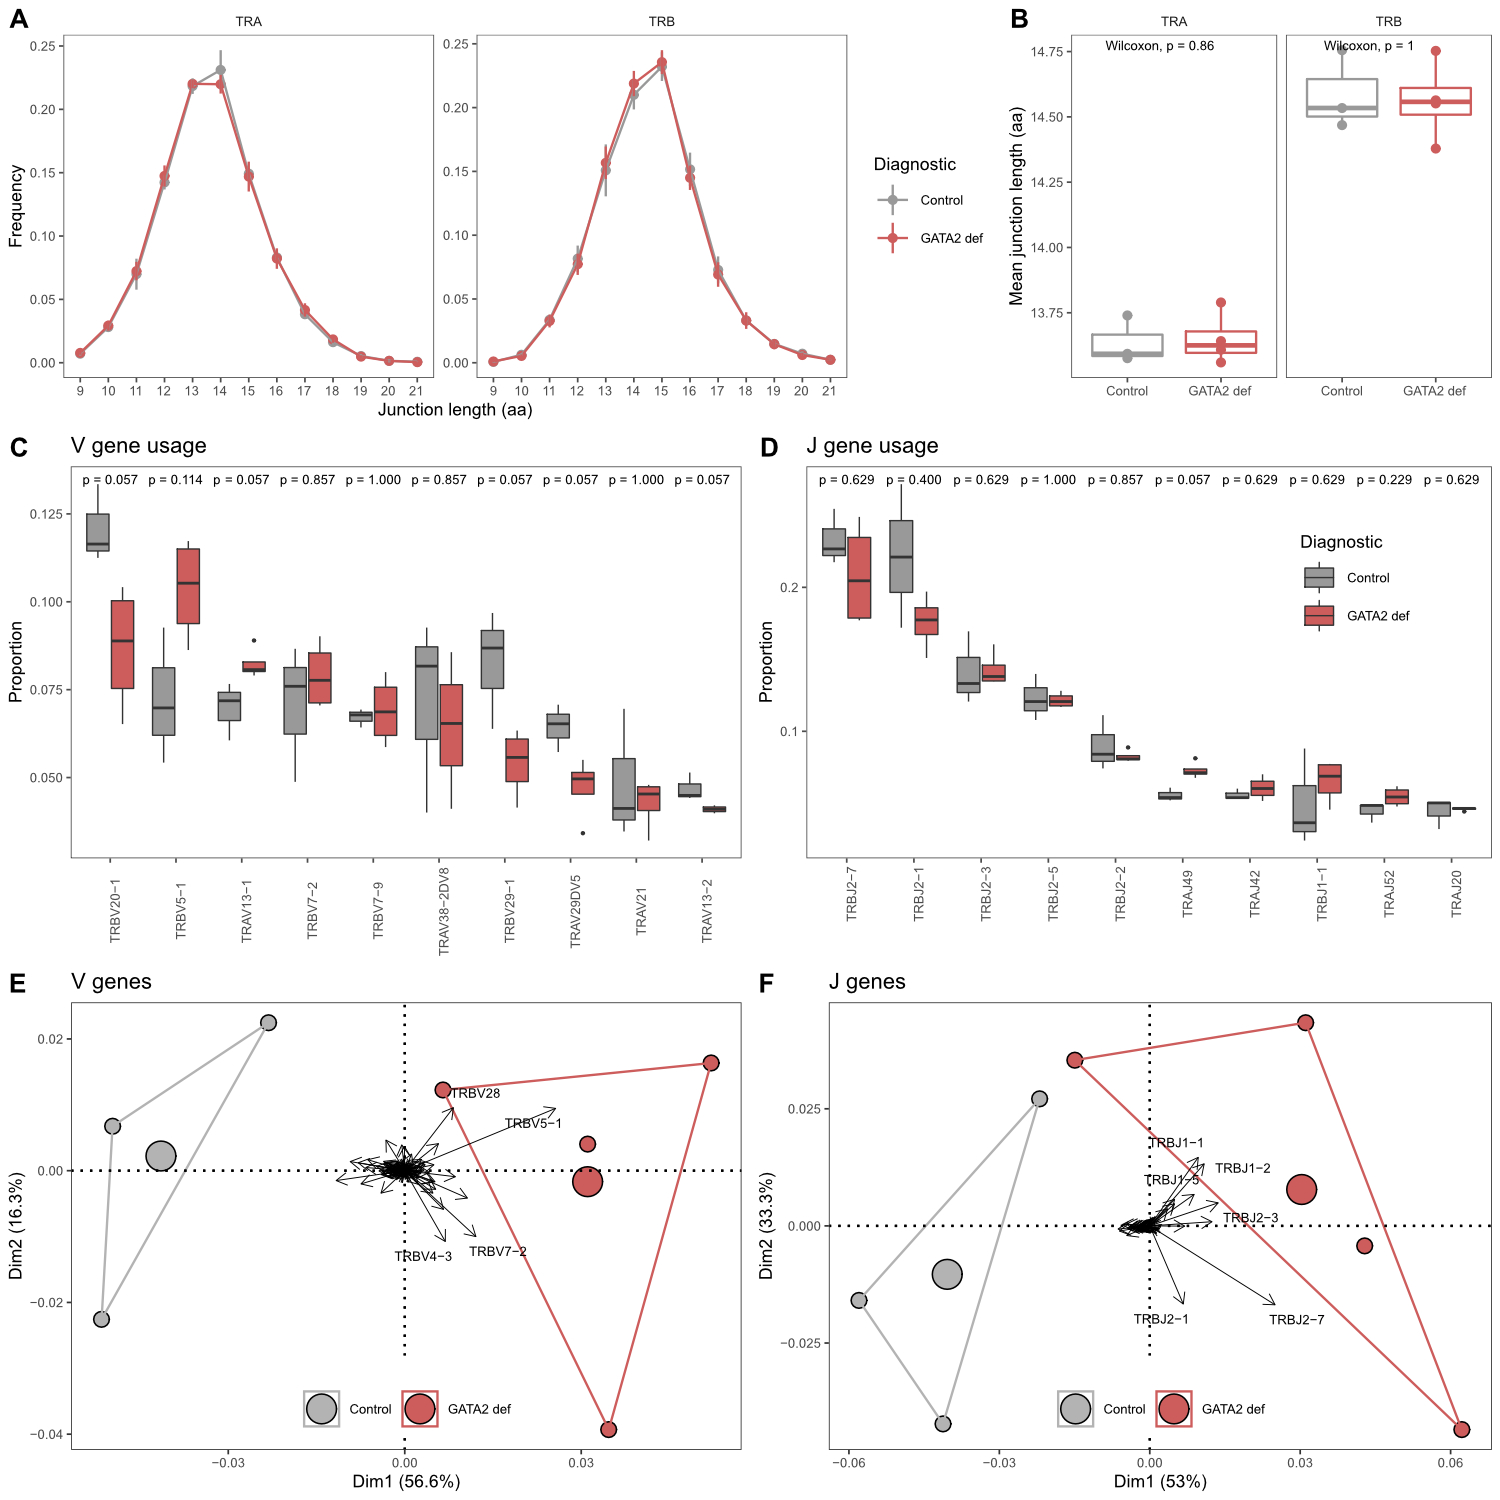
controls (fig. 1A and 1B). While some V and J genes were used differently
between patients and controls, none of these differences were statistically significant.
The frequencies of the 10 most used V and J genes are shown in figures 1C and
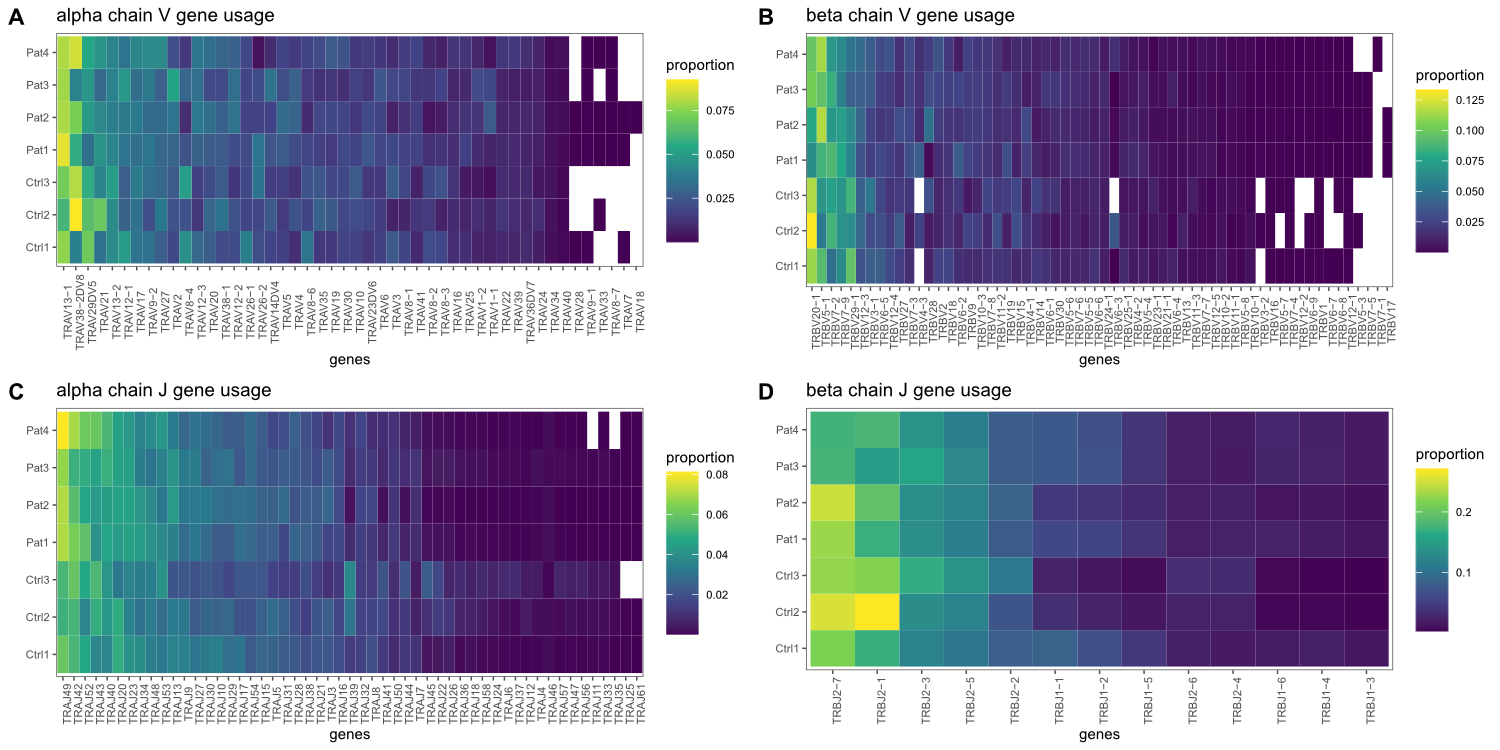
1D, respectively. Detailed gene usage frequencies of all detected genes are
shown in supplementary figure S2 (appendix). However, principal component analysis
of frequencies of all V and J genes clearly separated the patient from the control
group (Fig. 1E and 1F).

Figure 1 Comparison of TCR
repertoire characteristics in GATA2 patients and healthy controls. (A) CDR3
junction length (amino acids) distributions in both clonal chains. (B)
Comparison of mean CDR3 junction length. (C) Comparison of V gene and (D) J
gene usage. Shown are the ten most frequently used genes respectively. Pairwise
comparisons performed using the Wilcoxon test. Group size: GATA2 def = 4,
Control = 3. (E) Principal component analysis by diagnosis including usage of
all V genes and (F) J genes. Areas are the convex hulls of the diagnostic group
and the largest point of one colour represents the centre of that hull. Arrows
show contributions of individual input variables, only strongest contributors
are labelled.
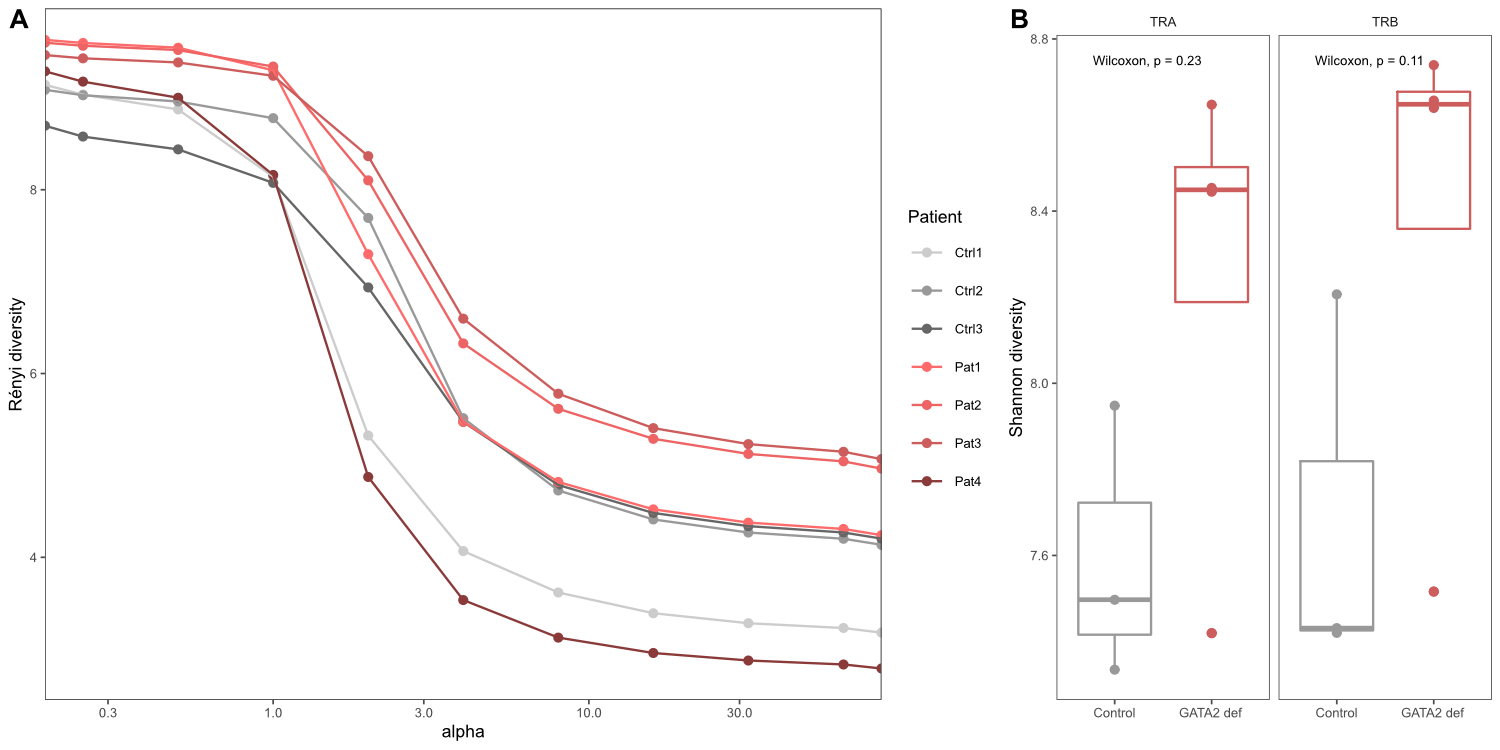
Repertoire diversity based on the subsampled dataset was
similar for GATA2 patients and healthy controls (fig. 2). In this small dataset,
the patient repertoires are characterised by a slightly higher richness (Rényi
order a = 0) but clones are less evenly distributed and thus overall
diversity is comparable between patients and healthy controls at a >0 (fig.
2A). Shannon entropy (a = 1) in fig. 2B represents an example of a diversity index that
takes into account richness and evenness of the underlying data and shows no
significant difference between the two groups.

Figure 2 Repertoire
diversity analysis. Diversity indices calculated on the clonal relative
frequencies of sequences in the subsampled dataset. (A) Rényi diversity
profiles where a = 0 reflects clonal richness, a = 1 corresponds to the Shannon
index and a = 2 represents the Simpson index. (B) Shannon
diversity index for both clonal chains separately.
Discussion
In a translational research setting, in
which patient sample availability, collection and handling are often dictated
by clinical, rather than research protocols, it is important to react with
flexibility and adapt research protocols accordingly. In this proof-of-concept
approach, we were able to apply an established commercial TCR repertoire
sequencing strategy to sample material with variable RNA quality and quantity. Despite
lower than recommended RNA quality and variable RNA quantity, we were able to develop
a wet laboratory and bioinformatics workflow that sufficiently reduced bias to
provide clinically meaningful results. Our analysis is limited by a low number
of samples, especially for partially degraded RNA – and we did not include any
substantially degraded material. Varying input quantity can critically impact
on TCR repertoire metrics, especially diversity measures. Normalisation of the
input is therefore crucial. Here, we describe a solution – to subsample an
unbalanced dataset to equal numbers of collapsed sequences with the additional benefit
of only keeping high quality, i.e., sufficiently covered, sequences. This
approach allowed us to examine the TCR repertoire characteristics in
GATA2-deficient patients.
Despite known disturbance of the T cell
compartment by more conventional measures of immunophenotyping, an in-depth
analysis of TCR sequences of both the alpha and beta chains showed no major
differences between GATA2 patients and healthy controls. Previous studies
already provide evidence that T cell quantity is preserved in GATA2 patients,
but their phenotypic composition is profoundly disturbed. Reduced CD4+ helper
function and an expansion of terminally differentiated effector CD8+ cells are
characteristic for the disease [10]. TCR repertoires of CD8+ cells have been
shown to be different from CD4+ cells mainly in respect to their V gene usage. In
a study using multiplex PCR and genomic DNA as starting material, this
difference is mostly characterised by overexpression of TRBV7–9 and reduced
expression of TRBV18 [19] in CD8+ compared with CD4+ cells. However, in our
data from total T cells, we did not detect this shift towards a more CD8-driven
V gene usage in GATA2 patients. Importantly, only one of the four patients analysed
had an inverted CD4:CD8 ratio of 0.7 at the time of sample collection, whereas
the other patients had a normal CD4:CD8 ratio of between 1.2 and 1.3. No usage
of a single V or J gene was significantly different between patients and
controls, likely due to the small sample size. However, combination of gene
usage frequencies allowed stratification between groups in a principal
component analysis.
CDR3 length distribution in patients was not
different from healthy controls, indicating a mostly functional V(D)J
recombination machinery and selection mechanism in GATA2 patients. A diverse repertoire
is considered crucial to adequately respond to a vast number of pathogens and
restrictions in diversity have been associated with decreased immunocompetence
[20]. In GATA2 patients, TCR repertoire diversity appears largely normal, suggesting
an overall preserved thymic function without indication of substantial clonal
expansion.
In summary, our results prove the
applicability of high-throughput T cell receptor sequencing to challenging human
samples with the prospect to use this approach in a translational setting in
future studies. Our limited data does not show intrinsic disturbances of the
global T cell compartment in GATA2 deficiency. Other defects including NK and
dendritic cells might be more central in driving the clinically significant immunodeficiency.
Our findings may have implications for clinical management, for example by
questioning the need for routinely providing T-cell deficiency related
antimicrobial prophylaxis.
Johannes Trück, MD, DPhil
University Children’s Hospital Zurich
Division of Immunology
Steinwiesstrasse 75
CH-8032 Zurich
Johannes.Trueck[at]kispi.uzh.ch
References
1. Rosati E, Dowds CM, Liaskou E, Henriksen EK, Karlsen TH, Franke A. Overview of methodologies for T-cell receptor repertoire analysis. BMC Biotechnol. 2017 Jul;17(1):61. https://doi.org/10.1186/s12896-017-0379-9
2. Laydon DJ, Bangham CRM, Asquith B. Estimating T-cell repertoire diversity: Limitations of classical estimators and a new approach. Philos Trans R Soc B Biol Sci. 2015;370(1675). doi:https://doi.org/10.1098/rstb.2014.0291
3. Howson LJ, Napolitani G, Shepherd D, Ghadbane H, Kurupati P, Preciado-Llanes L, et al. MAIT cell clonal expansion and TCR repertoire shaping in human volunteers challenged with Salmonella Paratyphi A. Nat Commun. 2018 Jan;9(1):253. https://doi.org/10.1038/s41467-017-02540-x
4. Amoriello R, Mariottini A, Ballerini C. Immunosenescence and Autoimmunity: Exploiting the T-Cell Receptor Repertoire to Investigate the Impact of Aging on Multiple Sclerosis. Front Immunol. 2021 Dec;12:799380. https://doi.org/10.3389/fimmu.2021.799380
5. Schrama D, Ritter C, Becker JC. T cell receptor repertoire usage in cancer as a surrogate marker for immune responses. Semin Immunopathol. 2017 Apr;39(3):255–68. https://doi.org/10.1007/s00281-016-0614-9
6. Pogorelyy MV, Minervina AA, Touzel MP, Sycheva AL, Komech EA, Kovalenko EI, et al. Precise tracking of vaccine-responding T cell clones reveals convergent and personalized response in identical twins. Proc Natl Acad Sci USA. 2018 Dec;115(50):12704–9. https://doi.org/10.1073/pnas.1809642115
7. Hogan SA, Courtier A, Cheng PF, Jaberg-Bentele NF, Goldinger SM, Manuel M, et al. Peripheral blood TCR repertoire profiling may facilitate patient stratification for immunotherapy against melanoma. Cancer Immunol Res. 2019 Jan;7(1):77–85. https://doi.org/10.1158/2326-6066.CIR-18-0136
8. Barennes P, Quiniou V, Shugay M, Egorov ES, Davydov AN, Chudakov DM, et al. Benchmarking of T cell receptor repertoire profiling methods reveals large systematic biases. Nat Biotechnol. 2021 Feb;39(2):236–45. https://doi.org/10.1038/s41587-020-0656-3
9. Spinner MA, Sanchez LA, Hsu AP, Shaw PA, Zerbe CS, Calvo KR, et al. GATA2 deficiency: a protean disorder of hematopoiesis, lymphatics, and immunity. Blood. 2014 Feb;123(6):809–21. https://doi.org/10.1182/blood-2013-07-515528
10. Collin M, Dickinson R, Bigley V. Haematopoietic and immune defects associated with GATA2 mutation. Br J Haematol. 2015 Apr;169(2):173–87. https://doi.org/10.1111/bjh.13317
11. Dickinson RE, Milne P, Jardine L, Zandi S, Swierczek SI, McGovern N, et al. The evolution of cellular deficiency in GATA2 mutation. Blood. 2014 Feb;123(6):863–74. https://doi.org/10.1182/blood-2013-07-517151
12. Ganapathi KA, Townsley DM, Hsu AP, Arthur DC, Zerbe CS, Cuellar-Rodriguez J, et al. GATA2 deficiency-associated bone marrow disorder differs from idiopathic aplastic anemia. Blood. 2015 Jan;125(1):56–70. https://doi.org/10.1182/blood-2014-06-580340
13. Oksanen J, Blanchet FG, Friendly M, et al. vegan: Community Ecology Package. Published online 2020. https://cran.r-project.org/package=vegan
14. Kassambara A, Mundt F. factoextra: Extract and Visualize the Results of Multivariate Data Analyses. Published online 2020. http://www.sthda.com/english/rpkgs/factoextra
15. R Core Team. R: A Language and Environment for Statistical Computing. Published online 2020. https://www.r-project.org/
16. Wickham H. ggplot2: Elegant Graphics for Data Analysis. Published online 2016. https://ggplot2.tidyverse.org
17. Wilke CO. cowplot: Streamlined Plot Theme and Plot Annotations for ggplot2. https://wilkelab.org/cowplot/
18. Fang M, Su Z, Abolhassani H, Zhang W, Jiang C, Cheng B, et al. T Cell Repertoire Abnormality in Immunodeficiency Patients with DNA Repair and Methylation Defects. J Clin Immunol. 2022 Feb;42(2):375–93. https://doi.org/10.1007/s10875-021-01178-1
19. Emerson R, Sherwood A, Desmarais C, Malhotra S, Phippard D, Robins H. Estimating the ratio of CD4+ to CD8+ T cells using high-throughput sequence data. J Immunol Methods. 2013 May;391(1-2):14–21. https://doi.org/10.1016/j.jim.2013.02.002
20. Naylor K, Li G, Vallejo AN, Lee WW, Koetz K, Bryl E, et al. The influence of age on T cell generation and TCR diversity. J Immunol. 2005 Jun;174(11):7446–52. https://doi.org/10.4049/jimmunol.174.11.7446
Appendix:
Supplementary figures

Figure S1 Unique
molecular identifier coverage plots showing subsampling impact. Coverage of
total reads is shown in grey, coverage after subsampling in black, resulting thresholds
to subsample to equal number of 13,139 sequences are indicated in red. Ctrl3_TRA
was used as reference because of the lowest number of initial reads and
threshold for this sample was set to 2 in order to remove singletons.

Figure S2 V and J gene
usage frequencies.


