Evaluation of type 2 diabetes care management in nine primary care practices before and after implementation of the Criteria of Good Disease Management of Diabetes established by the Swiss Society of Endocrinology and Diabetology
DOI: https://doi.org/10.4414/SMW.2022.w30197
Emanuel
Christa, Astrid
Czockbc, Frida
Renströmd, Tamara
Ammeterb, Fahim
Ebrahimie, Stefan
Zechmannafg, Alexander
Kutzh, Peter
Diemi, Christian
Häuptlej, Michael
Brändledj
a Division of Endocrinology, Diabetology and Metabolism, University Hospital of Basel, Switzerland
b QualiCCare Association, Baden, Switzerland
c Swiss Society of Endocrinology and Diabetology, Baden, Switzerland
d Division of Internal Medicine and Endocrinology, Cantonal Hospital St. Gallen, Switzerland
e Clarunis, University Centre for Gastrointestinal Diseases, University Hospital of Basel, Switzerland.
f Division of Endocrinology, Diabetology and Metabolism, University Hospital of Zurich, Switzerland
g Institute of Primary Care, University and University Hospital of Zurich, Zürich, Switzerland
h Medical University Clinic, Internal Medicine, Cantonal Hospital Aarau, Switzerland
i Practice of Endocrinology and Diabetology, Bern, Switzerland
j Institute of Primary Healthcare, Cantonal Hospital St.Gallen, Switzerland
Summary
AIMS OF THE STUDY: Little is known about the quality of diabetes management of patients with type 2 diabetes mellitus (T2DM) in Swiss primary care. Based on the recommendations of the National Council Quality Assurance Programme, an interprofessional working group of the Swiss Society of Endocrinology and Diabetology (SSED) established population-based national criteria for good disease management of T2DM in primary health care (the diabetes score). The objective of this study was to assess whether the implementation of these criteria improve diabetes management in primary care.
METHODS: The diabetes score comprises eight criteria including three biometric measurements, two lifestyle-specific items and screening of three diabetes-associated complications. Practices can evaluate adherence to the criteria based on a point system, with the recommended aim to achieve ≥70/100 points. Group practices and single practices were included in this study and started implementing the SSED criteria in January 2018. The resulting score was compared with data retrospectively obtained for 2017. The primary endpoint was the overall change in Diabetes Score between 2017 and 2018 at each practice, further stratified by practice type. The absolute effect on individual diabetes score criteria was assessed by pooling all patient-level data.
RESULTS: Nine practices (six single and three group) participated in the study. In 2017 and 2018, the primary care practices treated 727 and 704 patients with T2DM, respectively, of whom 676 were treated both years. Around half of the patients were cared for in group practices and half in single practices. Between 2017 and 2018 the median (interquartile range) diabetes score improved from 40 (35, 65) to 55 (45, 70; p = 0.078). One practice (single) obtained a score ≥70 in 2017, three practices (all single) achieved this target in 2018. Pooling patient-level data, we observed a significant absolute improvement in the following criteria: number of regular diabetes check ups, body mass index, glycated haemoglobin, blood pressure, low density lipoprotein cholesterol and screenings for diabetes-associated complications (all p <0.05). However, the extent of the improvements were often insufficient to reach the prefixed targets of the diabetes score criteria on the practice level.
CONCLUSION: Overall, the implementation of the SSED criteria in the current setting led to a modest, nonsignificant improvement of the diabetes score. Only three (all single practices) out of the nine practices reached the recommended 70-point target, indicating that further strategies are needed to improve diabetes care in primary care practice.
Trial registration: ClinicalTrials.gov (ID NCT04216875).
Introduction
Global estimates indicate that over 420 million people have type 2 diabetes mellitus (T2DM), 5 million deaths per year are attributable to T2DM and the related overall health expenditure is estimated to more than USD 670 billion [1]. With prevalence increasing, it is projected that within the next 20 years the number of patients with diabetes aged 20–79 years will rise to 640 million and more than one in three western adults will have diabetes by 2050 [1, 2]. Diabetes mellitus is associated with a number of serious complications and it is recognised as a leading cause of mortality, especially due to cardiovascular disease [3]. Against this background, associated medical costs and impaired productivity of people with T2DM result in a tremendous economic burden [4].
Given the burden of disease, quality of care is a major outcome of interest. In Switzerland – as in most other countries – private primary care physicians, reimbursed by compulsory health insurance, usually treat patients with T2DM. Based on the guidelines by the American Diabetes Association (ADA) and the European Association for the Study of Diabetes (EASD), quality of care in Switzerland has mainly been assessed using cross-sectional or retrospective data with conflicting results. Although target glycated haemoglobin (HbA1c) [5, 6] has been shown to be achieved in a majority of patients, results indicate that study participants tend to have better glycaemic control that the overall background population [7], and regional differences in diabetes control and management has been reported [8]. However, lifestyle counselling (diet, physical exercise and smoking cessation), regular screening for diabetes-associated complications (retinopathy, nephropathy and diabetic foot syndrome) and monitoring of cardiovascular risk factors (low-density lipoprotein [LDL]-cholesterol and hypertension) have been shown to be performed only in 20–50% of the patients across Switzerland [5, 6, 9, 10]. Based on these findings, the average quality of care in Switzerland is not sufficient to prevent or delay diabetes-related complications [3]. On a patient level, tertiary education and higher socioeconomic status seems to favourably influence the quality of diabetes self-management and thereby care [11, 12]. On the level of diabetes care providers, data indicate that presence and adherence to treatment guidelines may reduce hospitalisation and mortality rates [13].
So far, different interventions in the primary care setting, such as provision of feedback, education, reminders or even financial incentives, have been used to try to improve the care provided for patients with diabetes mellitus [14, 15]. Of these, audit, feedback on performance, clinical decision support systems, multiprofessional teams and patient education seemed to be successful strategies to improve quality of diabetes care [14]. In contrast, financial incentives did not seem to influence quality of care [15]. However, we have to acknowledge that the study design of interventions to optimise quality of care are heterogeneous and implemented in different clinical settings, and various outcomes have been used as proxy of quality of care, such as HbA1c levels and cardiovascular risk factors [14, 16, 17], leading to lack of generalisability of the results [13]. Moreover, the definition of quality of care in diabetes management is not well defined and varies widely between different countries, as it is highly dependent on the local healthcare systems.
We therefore aimed at investigating the implementation of the 2017 "Criteria of Good Disease Management Diabetes in Primary Care” . The recommendations were initially established in 2013 and updated in 2017 based on the current guidelines and the recommendations of the US National Council Quality Assurance Program (NCQA) (http://www.ncqa.org/Programs/Recognition/ DiabetesRecognitionProgramDRP.aspx) and were adapted for Switzerland by the working group Disease Management Diabetes (DMD) of the Swiss Society of Endocrinology and Diabetology (SSED; www.sgedssed.ch), including diabetologists, endocrinologists, nutritionists, diabetic nurses and general practitioners. The recommendations cover eight criteria for good diabetes management (three biometric measurements, two lifestyle-specific items and screening for three diabetes-associated complications) and has been approved by the executive committee of the SSED. Adherence to the criteria is evaluated using a point system, the diabetes score. Based on the data from the French-speaking Swiss canton of Vaud [6] and results from unpublished pilot projects, the DMD working group considered a score of ≥70 out of 100 per practice (i.e., per patient population with diabetes per practice) as a realistic and adequate target to guarantee an appropriate quality of diabetes management in Switzerland. The main hypothesis was that the implementation of the diabetes score would improve quality of care in primary cares settings in Switzerland.
Methods
Study design and endpoints
The primary endpoint was the overall change in population-based quality of care of patients with T2DM at each practice, as reflected by the obtained diabetes score per practice before and after the implementation of the SSED criteria for good disease management of diabetes in primary care, further stratified by single practices and group practices.
Post-hoc analyses included patient-level changes in individual diabetes score criteria, including overall changes in continuous traits such as HbA1c, LDL-cholesterol levels, and systolic and diastolic blood pressure. In addition, changes in prescription of oral antidiabetic drugs, insulin, antihypertensive drugs and statins were also documented.
Setting
This was a structured assessment of the diabetes care provided to patients with T2DM based on the diabetes score before and after the implementation of the SSED criteria for good disease management of diabetes in nine primary care practices in the German-speaking part of Switzerland.
The Primary Healthcare Institute of St Gallen organised and coordinated the selection of the primary care practices. The selection included individually owned single and group primary care practices. An overview of the recruitment process is available in supplementary figure 1 in the appendix. The aim was to include a similar number of patients in single and group practices. Each practice was compensated for the additional time and workload dedicated to the study with CHF 50.- per included patient.
Participants and data sources
Patients with diabetes were defined as all patients with an HbA1c >6.4% and/or documented prescription of an antidiabetic drug and/or insulin therapy. Patients with a follow-up of <9 months (e.g., due to death, care by another healthcare provider such as a diabetes specialist, or relocation), type 1 diabetes or who were unwilling to have their data used in this study were excluded. The practices were instructed to ask all patients who attended the practice for permission to use their data.
For each practice, the pre-specified data needed to evaluate fulfilment of the individual diabetes score criteria (see table 1 for details), as well as information about diabetes-related medication (prescription of oral antidiabetic drugs, insulin, antihypertensive drugs and statins) were retrospectively collected for patients treated in 2017 – as documented in the patient records at each practice – and prospectively collected during 2018 (starting in January 2018 until the end of the year). Both retrospective and prospective data were entered into the electronic software application Emminens (see below for details).
Table 1The scoring system of the criteria for good disease management of diabetes. This score includes eight criteria for good diabetes disease management (three measurements and five diabetes-specific counselling or clinical assessments). The score is based on the diabetes recognition programme from the USA adapted for Switzerland. It was established by a working group of the Swiss Society of Endocrinology and Diabetology in collaboration with the Swiss Association of General Internal Medicine. The table lists the eight criteria of good diabetes care management and the scoring system to be used for evaluation on an individual practice level. The points allocated to each criteria are received when the patient-population aim is fulfilled. The goal is to achieve ≥70/100 points. The table is a modification of the 2017 publication of the criteria.
|
Criteria
|
Intervention
|
Aim (on a yearly basis)
|
Points
|
| Regular visits |
General diabetes control |
>80% of patients with ≥3 visits |
10 |
| Lifestyle measures |
a) BMI >25 kg/m2: physical exercise and nutrition counselling |
>80% of patients have BMI ≤25 kg/m2 or if BMI >25 kg/m2 received counselling ≥1/year |
5 |
| b) Nicotin abuse: smoking cessation counselling |
>80% of patients none smokers or if active smokers received counselling ≥1/year |
5 |
| Glycemic control |
HbA1c measurement (DCCT traceable) |
Annual mean, min. 2 measurements*: |
|
| ≥85% of patients <9.0% |
12 |
| ≥60% of patients <8.0% |
+8 |
| ≥40% of patients <7.0% |
+5 |
| Blood pressure |
Blood pressure measurement (mmHg) |
Annual mean, min. 2 measurements*: ≥65% of patients <140/90 mmHg |
15 |
| LDL-C if <75 years of age |
LDL-C measurement |
Annual mean*: ≥63% of patients <2.6 mmol/L |
10 |
| Nephropathy screening |
Measurement of serum creatinine + microalbuminuria |
≥80% of patients screened |
10 |
| Retinopathy screening |
Ophthalmological consultation |
≥80% of patients examined min.every second year |
10 |
| Foot examination |
Pulses (Arteria dorsalis pedis, Arteria tibialis posterior), mono-filament, and vibration sensation |
≥80% of patients examined |
10 |
The study was conducted according to Good Clinical Practice and was approved by the Ethics Committee of Eastern Switzerland (EKOS 2017-01340). Written informed consent of the patients was obtained. The study protocol is registered and available on ClinicalTrials.gov (ID NCT04216875).
Diabetes management tool Emminens
A cloud-based electronic diabetes management tool Emminens® specifically developed by eQuality® for Roche Diabetes Care, Rotkreuz, Switzerland, was provided to the practices free of charge. The Emminens tool was designed to collect the patient-level data required to assess the fulfilment of the eight diabetes score criteria at each practice and additional medical variables of interest. Based on the patient-level data entered, the overall score for the practice as well as the points achieved for each individual criterion along with descriptive statistics on the medical parameters were automatically provided.
At each practice, data from 2017 were entered retrospectively in the Emminens tool based on the medical records of all consenting patients with diabetes that visited the practice. In 2018, data were prospectively recorded in the Emminens tool. Usually, one designated and trained person (medical assistant) per practice was responsible for data entry. The staff at participating practices attended a mandatory two-hour course about T2DM management in general, the criteria for good disease management of diabetes in particular, and the use of the Emminens tool. Administrative personnel from the Emminens tool were available for technical and data validation questions throughout the study period.
As post-hoc feedback, the monitoring tool Emminens was evaluated by the practice staff with regard to practicability.
Statistical analysis
The raw, anonymised data entered into the Emminens tool at each practice were used for the current study, and implausible data entries for continuous variables were identified in an initial data-cleaning step prior to analysis.. For each patient, missing information on any of the eight diabetes score criteria was treated as failure to fulfil the specific target criterion. Data from patients with only one measurement of HbA1c and blood pressure in 2017 and/or 2018 were included in the analysis. Descriptive statistics are presented as mean ± standard deviations (SDs) and median and interquartile range (IQR) for continuous variables. Dichotomous variables are reported as proportions. Paired t-tests were used to determine changes related to the diabetes ccore between 2017 and 2018. Student’s t-test was used to determine changes in pooled continuous variables between 2017 and 2018, and chi-square tests were used for dichotomous variables. A p-value of <0.05 was considered statistically significant. All analyses were performed using SAS version 9.4 (SAS Institute Cary, NC).
Results
Available data in primary care practices
Nine practices (six single and three group practices) were included in the analysis. In 2017 and 2018, the practices treated a total of 727 and 704 patients with T2DM who were included in the study, of whom 676 were treated both years. In total, 351 and 345 patients were treated at single practices (range 46–81 and 44–74 patients per practice and year) and 376 and 359 patients at group practices (range 42–285 and 42–274 patients per practice and year).
Clinical characteristics
The clinical characteristics of the patients overall and stratified by practice type are summarised in tables 2 and 3.
The demographic and clinical characteristics of patients treated in single and group practices in 2017 were not significantly different (table 2) with the exception of higher systolic blood pressure in the patients treated in group practices (p <0.0001). Patients in group practices more often received OADs (p <0.00001) and antihypertensive therapy (p = 0.0017) compared with patients in single practices.
Table 2Clinical characteristics before and after the implementation of the diabetes score overall and stratified by practice type.
|
Clinical parameter
|
All patients
|
Patients in single practice
|
Patients in group practice
|
|
2017, N
tot
= 727
|
2018, N
tot
= 704
|
2017, N
tot
= 351
|
2018, N
tot
= 345
|
2017, N
tot
= 376
|
2018, N
tot
=359
|
| n |
Mean ± SD or % |
n |
Mean ± SD or % |
n |
Mean ± SD or % |
n |
Mean ± SD or % |
n |
Mean ± SD or % |
n |
Mean ± SD or % |
| Age (years) |
640 |
67.9 ± 11.6 |
649 |
68.7 ± 11.6 |
282 |
67.5 ± 12.1 |
293 |
68.2 ± 12.2 |
358 |
68.2 ± 11.1 |
356 |
69.0 ± 11.0 |
| Females, % |
244 |
41.9 |
242 |
40.9 |
91 |
39.4 |
93 |
38.4 |
153 |
43.5 |
149 |
42.7 |
| BMI, kg/m2
|
521 |
30.6 ± 6.1 |
605 |
30.4 ± 5.8 |
291 |
30.4 ± 5.8 |
283 |
30.5 ± 5.7 |
230 |
30.8 ± 6.5 |
322 |
30.3 ± 5.9 |
| HbA1C, % |
683 |
7.1 ± 1.1 |
699 |
7.0 ± 0.9***
|
348 |
7.1 ± 1.2 |
345 |
6.9 ± 0.9**
|
335 |
7.1 ± 1.0 |
354 |
7.0 ± 1.0 |
| Systolic BP, mm Hg |
638 |
139.4 ± 14.7 |
675 |
137.5 ± 15.0*
|
330 |
135.2 ± 12.7 |
327 |
133.3 ± 12.7 |
308 |
143.9 ± 15.4 |
348 |
141.5 ± 15.9 |
| Diastolic BP, mm Hg |
638 |
81.5 ± 8.6 |
675 |
81.0 ± 9.9 |
330 |
81.6 ± 7.6 |
327 |
80.7 ± 8.2 |
308 |
81.5 ± 9.6 |
348 |
81.4 ± 11.3 |
| LDL-cholesterol, mmol/l |
433 |
2.7 ± 1.0 |
572 |
2.5 ± 1.0****
|
203 |
2.8 ± 1.1 |
271 |
2.5 ± 1.0***
|
230 |
2.7 ± 0.9 |
301 |
2.4 ± 0.9***
|
Diabetes score overall and stratified by practice type (primary and secondary endpoint)
Figure 1 shows the diabetes score per practice before and after the implementation of the Diabetes Score criteria. Overall the median (IQR) score improved from 40 (35, 65) to 55 (45, 70) (p = 0.078) after the implementation of the diabetes score criteria, with a mean increase of 11.7 points (95% confidence interval [CI] –1.6 to 25.0). The diabetes score increased in six practices (four single and two group practices) and decreased in three practices (two single and one group practice; fig. 2). In 2017 only one practice (single) reached the recommended 70 points, which increased to three practices (all single) in 2018. The LDL-cholesterol criterion excluded, missing information for the seven remaining criteria was present in 3.5 ± 1.9% and 6.5 ± 3.1% of the patients in 2017 and 2018, respectively, and were treated as failure to fulfil the criterion target. The proportion of patients without an available LDL-cholesterol measurement was 30.8% in 2017 and decreased to 11.4% in 2018. More detailed information is available in supplementary table S1 in the appendix.
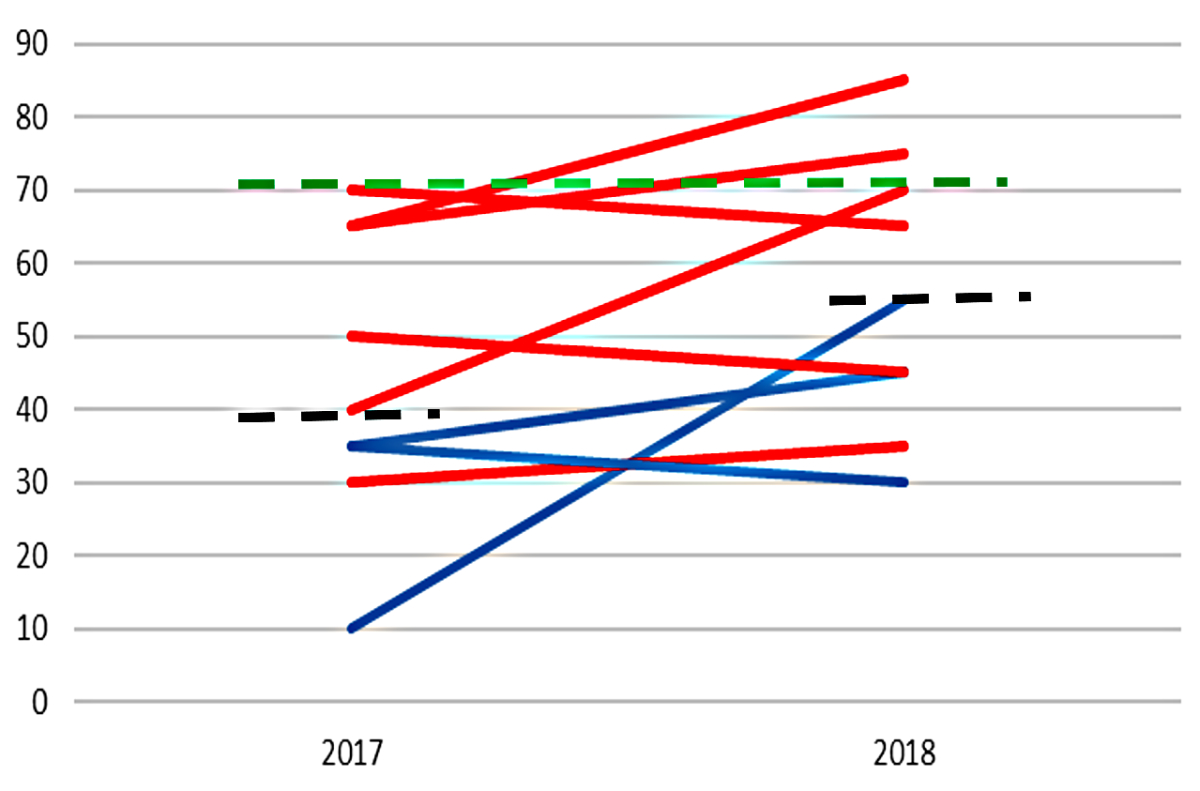
Figure 1 The diabetes score per practice before (2017) and after (2018) the criteria for good disease management of diabetes were implemented. Blue lines: group practices; red lines: single practices; black dashed line: median score; green dashed line: the recommended minimum diabetes score (70/100) suggested by the working group of the Swiss Society of Endocrinology and Diabetology. In six health facilities the score improved and in three practices the score decreased slightly. Between 2017 and 2018 the median diabetes score improved from 40 (IQR 35, 65) to 55 (45, 70; p = 0.078).
There was a tendency for a lower score among group practices than in single practices in both 2017, 35 (10, 35) points vs 57.5 (40, 65) points, = 0.05, and in 2018, 45 (30, 55) points vs 67.5 (45, 75) points, p = 0.16. Among the single practices the average increase in the score was 9.2 points (95% CI –5.5 to 23.8, p = 0.17), and among group practices was 16.7 points (95% CI –47.1 to 80.4, p = 0.38).
Although the criteria of the diabetes score were considered adequate and useful by the staff at all of the participating practices, the software provided was regarded as insufficient with respect to direct data extraction. The main reason being that the software-tool (“Emminens®” by eQuality®) could not be linked to the electronic health record system at each practice.
Changes in individual diabetes score criteria
The proportion of patients who reached the individual diabetes score criteria when all patient-level data were pooled are summarised in figure 2. In 2017, lifestyle-related targets concerning weight management, smoking, and HbA1c were fulfilled by the 727 patients. The proportion that reached the set targets regarding the remaining five criteria (annual diabetes visits, blood pressure, LDL-cholesterol levels, and regular screening of diabetes-associated complications, i.e., retinopathy, nephropathy and diabetic foot syndrome) were not fulfilled.
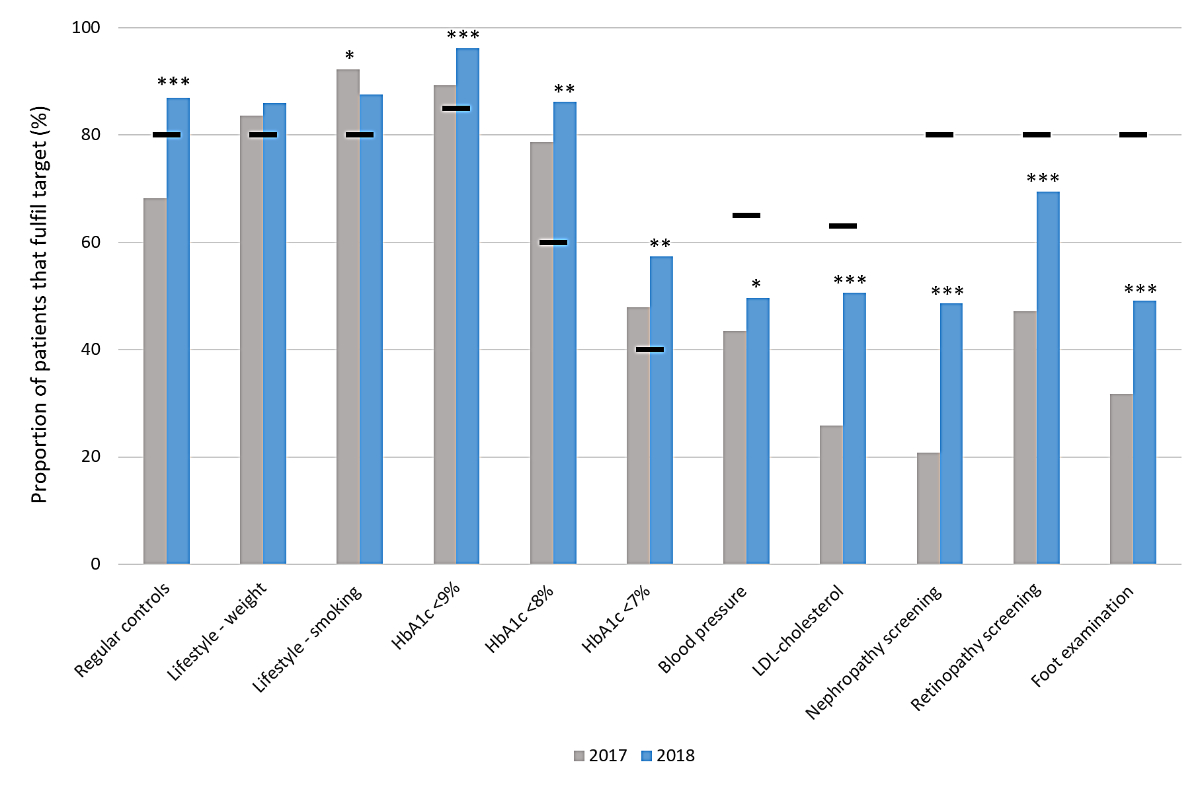
Figure 2 Proportion of patients in pooled analysis whofulfilled the individual diabetes score criteria before and after the criteria for good disease management of diabetes were implemented at the primary care practice. Grey bar: patient data during 2017 (Ntot = 727). Blue bar: patient data during 2018 (Ntot = 704). Black horizontal lines indicate minimum target value. Regular checks, three or more visits per year; lifestyle – weight, physical activity and weight counselling or body mass index <25 kg/m2; lifestyle – smoking, smoking cessation counselling or non-smoker; glycared haemoglobin (HbA1c) targets, annual average; blood pressure, annual average <140/90 mm Hg; low-density lipoprotein (LDL)-cholesterol, annual average <2.6 mmol/l among patients <75 years of age (Ntot2017 = 440, Ntot2018 = 437); nephropathy screening, assessment of serum creatinine and microalbuminuria; eye examination, minimum biannually by ophthalmologist; foot examination, foot pulse and monofilament / vibration sensation assessed. Missing information is treated as failure to reach target throughout the criteria and treatment indicators. Differences in frequencies between 2017 and 2018 assessed by chi-square test * p <0.05; ** p <0.001; *** p <0.00001.
In 2018, a significant absolute improvement in the overall proportion of patients that fulfilled the targets for annual diabetes visits, blood pressure, LDL-cholesterol levels and screening for diabetes-associated complications was observed, but the only additional diabetes score criteria that reached target was annual diabetes visits. The proportion of patients who fulfilled the lifestyle-related criteria concerning weight management and smoking, and the HbA1c criteria in 2018 remained above target.
The overall change in continuous clinical variables in pooled analyses including all patients with available data in 2017 and 2018, respectively, are summarised in table 2. Overall, statistically significant decreases in HbA1c, systolic blood pressure and LDL-cholesterol levels were observed (all p <0.05). In stratified analyses, a statistically significant reduction in HbA1c was shown only in single practices whereas no difference in systolic blood pressure was observed, and the reduction in LDL-cholesterol levels was seen in both single and group practices. Any significant improvements of continuous variables in 2018 as compared with 2017 were corroborated in paired analysis among patients with data available both years (n = 676) (supplementary table S2). In the paired analysis, a statistically significant reduction in systolic blood pressure was observed in both types of practice (133.1 ± 12.9 mm Hg vs 135.2 ± 12.2 mm Hg, p <0.005, and 141.7 ± 15.5 mm Hg vs 143.8 ± 15.6 mm Hg, p <0.05, respectively). In addition, a slight reduction in BMI was observed, primarily driven by the results in group practices (30.4 ± 6.2 kg/m2 vs 30.7 ± 6.2 kg/m2, p <0.01).
Table 3 summarises the medical therapy prescribed and tobacco abuse in 2017 and 2018 in pooled analysis including all patients with data available in 2017 and 2018, respectively. Although not statistically significant, there was a tendency for an increase in insulin therapy in 2018, whereas prescription of oral antidiabetic drugs remained unchanged. Overall, the use of antihypertensive medication and tobacco abuse remained stable and the prescription of statins increased in 2018, albeit not statistically significantly. Limiting the analysis to patients with data available for both years, a statistically significant increase in insulin therapy in 2018 was observed (24.6% vs 21.8%, p <0.01; supplementary table S3).
Table 3Therapy modalities and nicotine abuse before and after the implementation of the Diabetes Score overall and stratified by practice type.
|
All patients
|
Patients in single practice
|
Patients in group practice
|
|
2017, N = 727 |
2018, N = 704 |
2017, N = 351 |
2018, N = 345 |
2017, N = 376 |
2018, N=359 |
| n (ntot) |
% |
n (ntot) |
% |
n (ntot) |
% |
n (ntot) |
% |
n (ntot) |
% |
n (ntot) |
% |
| OAD |
579 (693) |
83.5 |
558 (677) |
82.4 |
264 (348) |
75.9 |
247 (325) |
76.0 |
315 (345) |
91.3 |
311 (352) |
88.4 |
| Insulin |
150 (692) |
21.7 |
161 (679) |
23.7 |
77 (350) |
22.0 |
79 (327) |
24.2 |
73 (342) |
21.3 |
82 (352) |
23.3 |
| Anti-HT drugs |
548 (688) |
79.7 |
542 (677) |
80.1 |
259 (346) |
74.9 |
255 (327) |
78.0 |
289 (342) |
84.5 |
287 (350) |
82.0 |
| Statins |
323 (692) |
46.7 |
345 (678) |
50.9 |
168 (348) |
48.3 |
176 (327) |
53.8 |
155 (344) |
45.1 |
169 (351) |
48.1 |
| Nicotine abuse |
137 (712) |
19.2 |
122 (635) |
19.2 |
58 (344) |
16.9 |
45 (284) |
15.8 |
79 (368) |
21.5 |
77 (351) |
21.9 |
Discussion
The main findings of this study can be summarised as follows. First, the quality of diabetes care per practice – as assessed by the diabetes score criteria – was low in 2017. Second, no significant increase in the overall diabetes score was observed after its implementation in 2018. Third, when all the patients were pooled, an increase in the proportion of patients that fulfil individual diabetes score criteria was observed in 2018. Fourth, group practices tended to obtain a lower score as compared with single practices in the year prior to the implementation of the diabetes score, and single practices showed a greater improvement of the diabetes score in 2018.
The retrospectively assessed score in 2017 was overall low, indicating insufficient quality of care for patients with diabetes in the assessed practices. Only one practice out of nine achieved the recommended score of ≥70 out of 100 points. Besides the lack of regular visits, control of cardiovascular risk factors was not achieved in a sufficient number of patients. In addition, screening for diabetes-related complications was low and not consistently performed in all patients with diabetes. The finding of insufficient evaluation and control of cardiovascular risk factors in patients with diabetes is consistent with previous findings [18, 17]. Similarly, the lack of consistent assessment of diabetic-related complications has been previously observed in Switzerland [19].
Despite an observed increase in the diabetes score in 2018, indicating an improved quality of care, this did not reach statistical significance. The modest improvement of the diabetes score was mainly due to practices fulfilling the minimum requirement of three annual diabetes check-ups and to a greater extent fulfilling regular screening for diabetes-associated complications (retinopathy, nephropathy, diabetic foot syndrome). However, a failure to fulfil the latter remained the major reason why practices did not reach the recommended 70-point target. This target was considered as realistic and adequate by the SSED working group based on a small study in the French part of Switzerland [6] and unpublished results from a pilot study. In our study, the recommended score was reached in only one practice in 2017 and in three practices in 2018. Although HbA1c evaluation and recommended targets were similar in the current and French-speaking regions, a lower percentage of patients were assessed for diabetes-related complications in the current study as compared with a study by Peytremann-Bridevaux et al. [6]. Similarly, the proportions of patients in the pooled analysis that fulfilled the blood pressure and LDL-cholesterol targets in 2017 were ~45% and ~25%, respectively (fig. 3), significantly lower than reported in the study by Peytremann-Bridevaux et al. [6]. These observed differences affirm the results of an earlier study, which suggested that the quality of diabetes care may be regionally different in Switzerland [8,9]
The proportion of patients in 2018 that fulfilled individual Diabetes Score criteria significantly improved in pooled analysis, notably the number of regular visits, and HbA1c, blood pressure, and LDL-cholesterol targets and the percentage of patients with regular assessments of diabetes-associated complications. Although the changes were statistically significant, they were small in some variables (e.g., blood pressure) and the clinical relevance is unclear. However, the observed absolute changes in cardiovascular risk factors such as LDL-cholesterol levels, may well have a clinical impact [20]. There are no Swiss data relating quality of care using the diabetes score to outcomes such as morbidity and mortality. However, there are Swiss data based on health claims indicating that adherence to four performance measures, namely HbA1c and LDL-cholesterol levels, and screening for retinopathy and nephropathy (all included in the current diabetes score), resulted in a lower hospitalisation rate [13, 10].
The documented modalities of therapy in the current study are consistent with previous reports with around ~80% of patients receiving oral antidiabetic drugs, ~20% additionally insulin, ~80% antihypertensive therapy and only ~50% statins [9, 17, 18]. In 2018 only minor changes were documented with regard to antidiabetic therapy (a decreased percentage of patients with oral antidiabetic drugs and an increased proportion on insulin therapy). In addition, a small increase in the prescription of antihypertensive therapy and a clear increase in the prescription of statins was observed in 2018, the latter in line with the observed overall reduction in average LDL-cholesterol levels. Interestingly, ~19% of patients were active tobacco users in 2017 without any overall significant change observed with the implementation of the diabetes score in 2018.
In the current study around half of the patients were cared for in six single practices and the remaining patients in three group practices. With the exception of slightly more tobacco abuse and higher systolic blood pressure in the group practice patients, the remaining variables were similar in both practice settings. There was a tendency for a lower score in group than in single practices in 2017. The implementation of the diabetes score resulted in an improved score in one group practice (33%), in contrast to four single practice (67%). Although these results have to be interpreted carefully and cannot be generalised, they indicate that the organisational structure (besides the genuine motivation of the practice’s staff and the characteristics of the patients) may influence the quality of care [14].
This study has limitations and strengths. First, the non-randomised inclusion of the practices could make the study prone to selection bias towards motivated primary care physicians. However, demographics, therapy modalities including management of cardiovascular risk factors were similar or worse compared with some of the previous reports of Swiss health institutions, indicating that this has likely not significantly impacted the current results [6, 8, 9]. Second, the missing data for each criterion were consistently evaluated as failure to fulfil the criterion, thereby analysing the results in a conservative way. Third, the lack of a control group is a limitation as we cannot ascertain that the observed changes to the overall diabetes score, or the individual score criteria are causally related to the implementation of the Criteria of Good Disease Management of Diabetes at the different practices. Fourth, these data are obtained from a catchment area in the German-speaking eastern part of Switzerland and cannot be generalised to Switzerland as a whole, in particular since there are some data suggesting regional differences in T2DM management in Switzerland [8]. Strengths of this study are the implementation of a diabetes score, which is based on guidelines but adapted to the Swiss health system and elaborated on by the two relevant medical societies, i.e., the SSED and the Swiss Society of General Internal Medicine (SSGIM), and the feasibility of its application into several group and single practices in Switzerland.
In conclusion, the results of this study suggest that a structured approach to diabetes care, including a broadly supported diabetes score system, is only partially helpful in improving the quality of care for patients with T2DM in Switzerland. There is still significant room and need for improvement. Whether additional tools such as regular feedback on performance, audits, interprofessional collaboration, clinical decision support systems and, most importantly, patient empowerment could further improve the management, remains to be established.
Acknowledgements
We thank all the patients and the participating practices with their medical staff. Without their dedication such a project would not have been possible.
Prof. Emanuel Christ, MD, PhD
Division of Endocrinology, Diabetology and Metabolism
University Hospital of Basel
CH-4031 Basel
emanuel.christ[at]usb.ch
References
1.
Ogurtsova K
,
da Rocha Fernandes JD
,
Huang Y
,
Linnenkamp U
,
Guariguata L
,
Cho NH
, et al.
IDF Diabetes Atlas: global estimates for the prevalence of diabetes for 2015 and 2040. Diabetes Res Clin Pract. 2017 Jun;128:40–50. https://doi.org/10.1016/j.diabres.2017.03.024
2.
Narayan KM
,
Boyle JP
,
Geiss LS
,
Saaddine JB
,
Thompson TJ
. Impact of recent increase in incidence on future diabetes burden: U.S., 2005-2050. Diabetes Care. 2006 Sep;29(9):2114–6. https://doi.org/10.2337/dc06-1136
3.
Go AS
,
Mozaffarian D
,
Roger VL
,
Benjamin EJ
,
Berry JD
,
Blaha MJ
, et al.
Heart Disease and Stroke Statistics - 2014 Update: A report from the American Heart Association. Circulation. 2014 Jan;129(3). https://doi.org/10.1161/01.cir.0000441139.02102.80
4.
Einarson TR
,
Acs A
,
Ludwig C
,
Panton UH
. Economic Burden of Cardiovascular Disease in Type 2 Diabetes: A Systematic Review. Value Health. 2018 Jul;21(7):881–90. https://doi.org/10.1016/j.jval.2017.12.019
5.
Schimke KE
,
Renström F
,
Meier S
,
Stettler C
,
Brändle M
; SwissDiab Study Group
. Compliance with guidelines for disease management in diabetes: results from the SwissDiab Registry. BMJ Open Diabetes Res Care. 2018 Feb;6(1):e000454. https://doi.org/10.1136/bmjdrc-2017-000454
6.
Peytremann-Bridevaux I
,
Bordet J
,
Burnand B
. Diabetes care in Switzerland: good, but perfectible: a population-based cross-sectional survey. BMC Health Serv Res. 2013 Jun;13(1):232. https://doi.org/10.1186/1472-6963-13-232
7.
Eichmüller T
,
Renström F
,
Schimke K
,
Brändle M
. Representativeness of the Swiss Diabetes Registry - a single centre analysis. Swiss Med Wkly. 2021 Jul;151(27–28):w20525. https://doi.org/10.4414/smw.2021.20525
8.
Gerber PA
,
Spirk D
,
Brändle M
,
Thoenes M
,
Lehmann R
,
Keller U
. Regional differences of glycaemic control in patients with type 2 diabetes mellitus in Switzerland: a national cross-sectional survey. Swiss Med Wkly. 2011 Jul;141(JULY):w13218. https://doi.org/10.4414/smw.2011.13218
9.
Burgmann K
,
Fatio S
,
Jordi B
,
Rutishauser J
. Medical care of type 2 diabetes mellitus in light of international and national recommendations: a retrospective analysis. Swiss Med Wkly. 2013 Oct;143:w13871. https://doi.org/10.4414/smw.2013.13871
10.
Huber CA
,
Scherer M
,
Rapold R
,
Blozik E
; Swiss Quality Indicator for Primary Care (SQIPRICA) Working Group members were
. Evidence-based quality indicators for primary healthcare in association with the risk of hospitalisation: a population-based cohort study in Switzerland. BMJ Open. 2020 Apr;10(4):e032700. https://doi.org/10.1136/bmjopen-2019-032700
11.
Zuercher E
,
Diatta ID
,
Burnand B
,
Peytremann-Bridevaux I
. Health literacy and quality of care of patients with diabetes: A cross-sectional analysis. Prim Care Diabetes. 2017 Jun;11(3):233–40. https://doi.org/10.1016/j.pcd.2017.02.003
12.
Canedo JR
,
Miller ST
,
Schlundt D
,
Fadden MK
,
Sanderson M
. Racial/Ethnic Disparities in Diabetes Quality of Care: the Role of Healthcare Access and Socioeconomic Status. J Racial Ethn Health Disparities. 2018 Feb;5(1):7–14. [cited 2021 Jul 7] Available from: https://pubmed.ncbi.nlm.nih.gov/28078660/ https://doi.org/10.1007/s40615-016-0335-8
13.
Huber CA
,
Brändle M
,
Rapold R
,
Reich O
,
Rosemann T
. A set of four simple performance measures reflecting adherence to guidelines predicts hospitalization: a claims-based cohort study of patients with diabetes [Internet]. Patient Prefer Adherence. 2016 Mar;10:223–31. [cited 2021 Jul 7] Available from: http://www.ncbi.nlm.nih.gov/pubmed/27042016 https://doi.org/10.2147/PPA.S99895
14.
Seitz P
,
Rosemann T
,
Gensichen J
,
Huber CA
. Interventions in primary care to improve cardiovascular risk factors and glycated haemoglobin (HbA1c) levels in patients with diabetes: a systematic review. Diabetes Obes Metab. 2011 Jun;13(6):479–89. https://doi.org/10.1111/j.1463-1326.2010.01347.x
15.
Meier R
,
Chmiel C
,
Valeri F
,
Muheim L
,
Senn O
,
Rosemann T
. The Effect of Financial Incentives on Quality Measures in the Treatment of Diabetes Mellitus: a Randomized Controlled Trial. J Gen Intern Med. 2021.
16.
Falck L
,
Zoller M
,
Rosemann T
,
Martínez-González NA
,
Chmiel C
. Toward standardized monitoring of patients with chronic diseases in primary care using electronic medical records: systematic review. JMIR Med Inform. 2019 May;7(2):e10879. https://doi.org/10.2196/10879
17.
Meier R
,
Rachamin Y
,
Rosemann T
,
Markun S
. The Impact of the 2019 European Guideline for Cardiovascular Risk Management: A Cross-Sectional Study in General Practice [Internet]. J Clin Med. 2020 Jul;9(7):E2140. [cited 2021 Jul 6] Available from: http://www.ncbi.nlm.nih.gov/pubmed/32645925 https://doi.org/10.3390/jcm9072140
18.
Rachamin Y
,
Markun S
,
Grischott T
,
Rosemann T
,
Meier R
. Guideline Concordance of Statin Treatment Decisions: A Retrospective Cohort Study. J Clin Med. 2020 Nov;9(11):3719. https://doi.org/10.3390/jcm9113719
19.
Sahli R
,
Jungi M
,
Christ E
. Goeldlin A. ««Chronic Care Management»-Programm in der hausärztlichen Praxis». Swiss Med Forum. 2019;19:113–6.
20.
Adler A
,
Agodoa L
,
Algra A
,
Asselbergs FW
,
Beckett NS
,
Berge E
, et al.; Blood Pressure Lowering Treatment Trialists’ Collaboration
. Pharmacological blood pressure lowering for primary and secondary prevention of cardiovascular disease across different levels of blood pressure: an individual participant-level data meta-analysis. Lancet. 2021 May;397(10285):1625–36. https://doi.org/10.1016/S0140-6736(21)00590-0
Appendix: Supplementary material
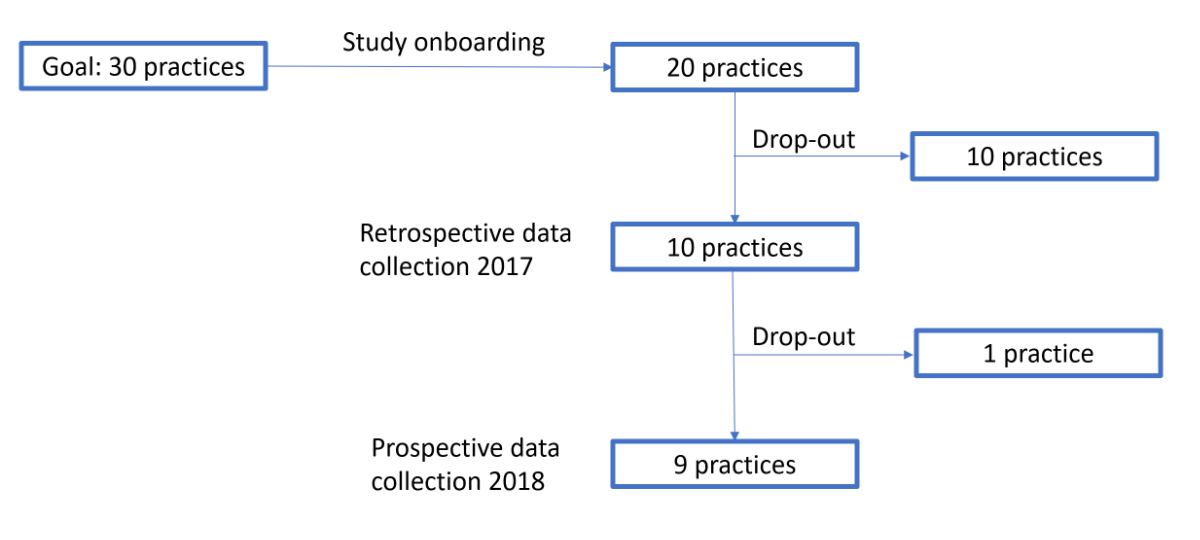
Figure S1 Flow-chart showing the recruitment process of general primary care practices.
Table S1Number of patients with missing information related to the eight criteria included in the diabetes score.
|
2017 (Ntot = 727) |
2018 (Ntot = 704) |
| Criteria |
n |
% |
n |
% |
| Regular controls |
42 |
6.0 |
0 |
0 |
| Lifestyle counselling |
Exercise |
14 |
1.9 |
61 |
8.7 |
| Weight |
14 |
1.9 |
67 |
9.5 |
| Smoking |
15 |
2.1 |
69 |
9.8 |
| HbA1c |
44 |
6.1 |
5 |
0.7 |
| Blood pressure |
39 |
5.4 |
43 |
6.1 |
| LDL-cholesterol |
224 |
30.8 |
80 |
11.4 |
| Nephropathy screening |
Serum creatinine |
34 |
4.7 |
20 |
2.8 |
| Albuminuria |
36 |
5.0 |
25 |
3.6 |
| Retinopathy screening |
9 |
1.2 |
61 |
8.7 |
| Foot examination |
Foot pulse assessment |
10 |
1.4 |
54 |
7.7 |
| Monofilament/vibration sensation |
18 |
2.5 |
56 |
8.0 |
Table S2Clinical variables limited to patients with data in both 2017 and 2018, further stratified by practice type.
| Clinical parameter |
All patients Ntot = 676 |
Patients in single practice Ntot = 328 |
Patients in group practice Ntot = 348 |
| n |
2017 |
2018 |
n |
2017 |
2018 |
n |
2017 |
2018 |
| Age (years) |
621 |
67.9 ± 11.6 |
68.9 ± 11.6 |
276 |
67.6 ± 12.1 |
68.6 ± 12.1 |
345 |
68.1 ± 11.1 |
69.1 ± 11.1 |
| Females, % |
2321
|
41.1 |
– |
882
|
38.9 |
– |
1443
|
42.5 |
– |
| BMI, kg/m2
|
435 |
30.7 ± 5.9 |
30.6 ± 6.0* |
224 |
30.8 ± 5.5 |
30.7 ± 5.7 |
211 |
30.7 ± 6.2 |
30.4 ± 6.2** |
| HbA1C, % |
637 |
7.1 ± 1.0 |
7.0 ± 0.9*** |
326 |
7.1 ± 1.1 |
6.9 ± 0.8*** |
311 |
7.1 ± 0.9 |
7.0 ± 1.0 |
| Systolic BP, mmHg |
583 |
139.4 ± 14.6 |
137.2 ± 14.8*** |
300 |
135.2 ± 12.2 |
133.1 ± 12.9*** |
283 |
143.8 ± 15.6 |
141.7 ± 15.5* |
| Diastolic BP, mmHg |
583 |
81.4 ± 8.5 |
80.7 ± 9.8* |
300 |
81.6 ± 7.4 |
80.4 ± 8.3*
|
283 |
81.2 ± 9.5 |
81.0 ± 11.1 |
| LDL-cholesterol, mmol/L |
353 |
2.7 ± 1.0 |
2.4 ± 0.9**** |
160 |
2.8 ± 1.2 |
2.4 ± 0.9****
|
193 |
2.6 ± 0.9 |
2.3 ± 0.8**** |
Table S3Therapy modalities and nicotine abuse limited to patients with data in both 2017 and 2018, further stratified by practice type.
|
All patients Ntot = 676 |
Patients in single practice Ntot = 328 |
Patients in group practiceNtot=348 |
|
2017
|
2018
|
2017
|
2018
|
2017
|
2018
|
| n (ntot) |
% |
n (ntot) |
% |
n (ntot) |
% |
n (ntot) |
% |
n (ntot) |
% |
n (ntot) |
% |
| OAD
|
529 (622) |
85.1 |
522 (622) |
83.9 |
236 (305) |
77.4 |
233 (305) |
76.4 |
293 (317) |
92.4 |
289 (317) |
91.2 |
| Insulin
|
136 (623) |
21.8 |
153 (623) |
24.6**
|
70 (309) |
22.7 |
78 (309) |
25.2*
|
66 (314) |
21.0 |
75 (314) |
23.9 |
| Anti-HT drugs
|
499 (619) |
80.6 |
497 (619) |
80.3 |
232 (305) |
76.1 |
238 (305) |
78.0 |
267 (314) |
85.0 |
259 (314) |
82.5 |
| Statins
|
303 (621) |
48.8 |
315 (621) |
50.7 |
158 (307) |
51.5 |
165 (307) |
53.8 |
145 (314) |
46.2 |
150 (314) |
47.8 |
| Nicotine abuse |
120 (595) |
20.2 |
118 (595) |
19.8 |
46 (262) |
17.6 |
44 (262) |
16.8 |
74 (333) |
22.2 |
74 (333) |
22.2 |