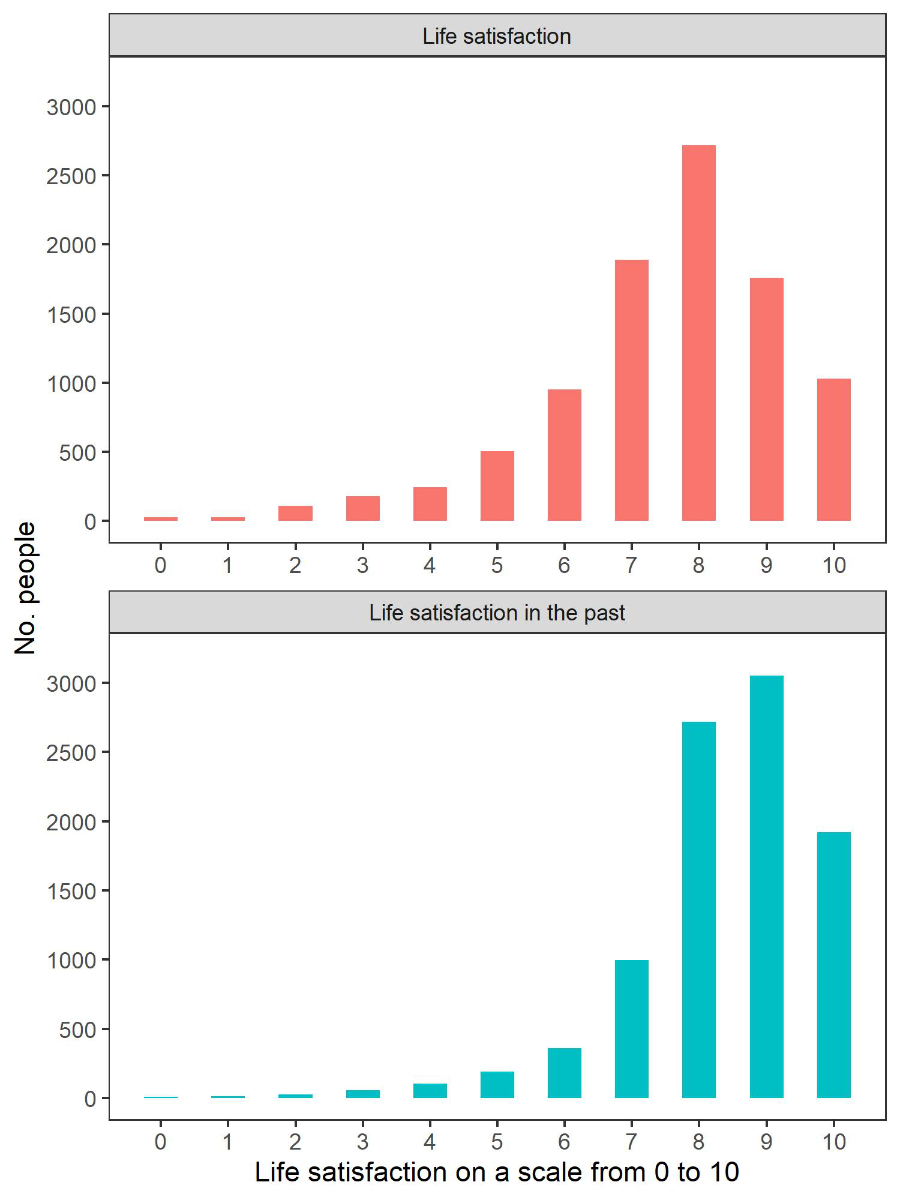
Figure 1 Histogram of life satisfaction in the study population (N=9444).
DOI: https://doi.org/10.4414/SMW.2022.w30204
What is the public health that we have been striving to protect during the COVID-19 pandemic? The World Health Organization (WHO) declared long ago that “health is a state of complete physical, mental and social well-being and not merely the absence of disease or infirmity”. Efforts to prevent SARS-CoV-2 infections must therefore be partnered with efforts to maintain people’s mental health and social well-being. The COVID-19 pandemic, including the epidemic itself and its containment measures, may have long-term significant consequences on mental health and well-being [1–3]. Acknowledging the importance of monitoring the citizens’ well-being in assessment of long-term consequences of the COVID-19 pandemic, we initiated the COVCO-Basel cohort (population-based SARS-CoV-2 Cohort Basel-Landschaft and Basel-Stadt) [4]. It follows more than 10,000 residents of a random sample of the general adult population of the Swiss cantons Basel-Stadt and Basel-Landschaft to investigate their lifestyle, interactions with their living environment, mental health and well-being during (and after) the pandemic.
Subjective well-being has been associated with better overall health and increased life expectancy [5, 6]. Individual well-being is an important target to monitor, as an intermediate outcome, and as a goal in itself [7]. Individuals with high well-being show better productivity and creativity [8, 9], contributing to better functioning of a society. The proper functioning of a society serves as the foundation to successfully overcome challenges such as the COVID-19 pandemic.
The well-being of an individual is significantly influenced by the surrounding environmental conditions and circumstances [10]. Previous research reported beneficial effects of residential green on general health and well-being [11–13], with proposed pathways including improved air quality, physical activity, social cohesion, or coping with stress [14–17]. Especially during mentally and physically challenging times, the immediate greenspace environment can help mitigate the negative impacts by providing a recreational, freely accessible environmental resource that enables recovery from stressors, debilitation, fatigue, and social isolation [18, 19]. This study is the first attempt to investigate the residential greenness effects on subjective well-being during the COVID-19 pandemic, from a population-based sample in Switzerland.
The primary objective of this study was to assess whether residential greenness is associated with subjective well-being during the COVID-19 pandemic in the Basel region of Switzerland. We assessed a priori selected covariates to check if they modulate the greenness effects. As secondary objectives, we assessed if the greenness effects can be attributed to specific types of greenspace or accessibility to greenspace. By investigating the effect modulation and by differentiating various greenspace metrics, we hope to shed light on the mechanism behind the residential greenness effects on subjective well-being.
In this cross-sectional analysis, we analysed the baseline information from COVCO-Basel. COVCO-Basel is a digital cohort in North-Western Switzerland, specifically initiated to investigate the long-term impact of the COVID-19 containment measures on broad domains of health and well-being. A sub-cohort of COVCO-Basel also participated in the Corona Immunitas programme launched as a seroprevalence survey to assess the extent, nature, and duration of immunity against SARS-CoV-2 at the cantonal and the national level in Switzerland [20]. Any person aged 18 years or older residing in Basel-Stadt or Basel-Landschaft for at least 5 years was eligible. Random samples of eligible residents of the same size for both cantons (Basel-Stadt and Basel-Landschaft) and age strata (18–49, 50–65, 65+ years) were provided by the Federal Statistical Office. They are randomly assigned to two arms, i.e. a seroprevalence arm and a questionnaire-only based arm. Invitations were sent in waves, separately for the two arms. In the seroprevalence arm, 2,457 out of the 15,981 people who received the invitation participated at baseline. In the digital cohort arm, 10,111 out of the 96,867 invited participated at baseline. Out of the 9,629 digital cohort participants entering the cohort between July 2020 and March 2021, we analysed 9,444 participants with non-missing information on residential address, life satisfaction, and all covariates listed below. The COVCO-Basel study population is comparable to the total population in the two cantons in terms of available sociodemographic factors including gender and marital status, although women are overrepresented in age group <65 years and underrepresented in age group 65+ years. Foreigners are underrepresented as expected given that the questionnaires are only provided in German. The final report of the study including a detailed protocol (in German) is publicly available online [4].
The study protocol was approved by the regional ethics committee (Ethikkommission Nordwest- und Zentralschweiz 2020–00927) and all participants provided informed consent prior to enrolment to the study.
Self-reported life satisfaction can accurately summarise subjective well-being [21, 22]. Life satisfaction was assessed by the question “Overall, how satisfied are you with life as a whole these days?” on a scale from 0 (not satisfied at all) to 10 (completely satisfied) at the time point of recruitment [23]. At the same time, life satisfaction prior to COVID-19 was retrospectively assessed by the question “Overall, how satisfied were you with life as a whole before COVID-19?” on the same 0–10 scale.
Three commonly accepted methods to evaluate greenspace exposure were applied to the participants.
NDVI is a satellite-based measure of general greenness, regardless of type or size of greenspace. It estimates the density of green, based on the difference between visible (VIS) and near-infrared (NIR) light reflected by vegetation [NDVI = (NIR – VIS)/(NIR + VIS)] [24]. NDVI values are from −1 to 1, where: <0.1 represents barren areas, sand or snow; 0.2–0.3 represents shrub and grassland; and values >0.3 indicate increasing intensity of green. For this analysis, we used an existing 30×30 m NDVI dataset constructed for Switzerland by Vienneau and her colleagues [25]. NDVI was derived from cloud- and snow-free satellite images collected during summer in 2014 (30×30 m resolution Landsat 8 scenes, from 08 June to 19 July 2014), and combined in a mosaic to obtain full coverage of Switzerland. The exposure modelling methods, including the exact Landsat 8 scenes comprising the mosaic, are described in full previously [25]. Mean NDVI within 100 m, 300 m, 500 m, and 1000 m “circular buffers” around participants’ geocoded home address were calculated on the basis of this 30×30 m dataset for Switzerland.
Proportion of area covered by either forest, urban parks, or agricultural area was computed within 100 m, 300 m, 500 m, and 1000 m circular buffers around participants’ home address. We used the data on the land use from SwissTLM Regio (https://www.swisstopo.admin.ch/de/geodata/landscape/tlmregio.html) and the boundaries from SwissBOUNDARIES3D (https://www.swisstopo.admin.ch/de/geodata/landscape/boundaries3d.html).
As a better indicator of proximity to greenspace, we computed shortest route considering the road network, rather than Euclidian distance. Shortest route to either forest, urban parks, or agricultural area was computed for each participant’s home address, based on the road network data from SwissTLM Regio (https://www.swisstopo.admin.ch/de/geodata/landscape/tlmregio.html).
Given the high correlations between buffers, we applied the following approach to select the optimal buffer size for analysis. Beta regression of life satisfaction on the NDVI of each buffer, adjusted for life satisfaction in the past, age, sex, household income, financial worries, canton, degree of urbanisation, and month of entry, were compared. The 300 m buffer had the smallest Akaike information criterion (AIC) value and was thus selected. We used the same 300 m buffer for the land use variables.
Covariates were selected according to a hypothesised framework by which greenspace may impact on life satisfaction (figure S1).
Self-reported age in years was classified into four categories, 18–29, 30–49, 50–65, and 65+ years. The recruitment was stratified by 18–49, 50–65, and 65+ years and we further stratified to have a better representation of participants below age 30. Gender (male/female/other) was self-reported. Non-binary gender group (other) was excluded due to its very small sample size. Self-reported household income was classified into three categories, below 6,000, 6,000–15,000, and 15,000+ CHF/month. Financial worries were determined by a question “How often do you worry about being able to meet normal monthly living expenses?” on a scale 0 (worry all the time) to 10 (do not ever worry) and classified into terciles. Canton of residence distinguished Basel-Stadt and Basel-Landschaft. Degree of urbanisation assessed by DEGURBA index (https://www.bfs.admin.ch/bfs/de/home/statistiken/kataloge-datenbanken/karten.assetdetail.13787277.html; https://ec.europa.eu/eurostat/web/degree-of-urbanisation/background) was classified into three levels, below 300, 300–1,500, and 1,500+ inhabitants/km2. The month of entry was recorded as the time point of baseline questionnaire and dichotomised as T1 (July to October 2020) and T2 (November 2020 to March 2021). T2 was the period of more stringent COVID-19 containment measures.
Given the limited range of the life satisfaction measured on a scale from 0 to 10, we decided to apply Beta regression with logit link. For Beta regression, the life satisfaction was first divided by 10 and then regressed on greenspace after adjustment for life satisfaction in the past, age, sex, household income, financial worries, canton, degree of urbanisation, and month of entry.
The regression analysis was conducted in three steps:
Step 1. Life satisfaction was regressed on NDVI only, to examine the association of general greenness with life satisfaction. We tested both main association and moderations. For moderations, we assessed a priori selected covariates, i.e., age, sex, household income, financial worries, canton, and month of entry, applying likelihood ratio test. The main association and moderations were declared statistically significant if the p-value was below 0.05.
Step 2. In case of significant main association or moderations from Step 1, life satisfaction was regressed on the three land use variables instead of NDVI, to see if, and to which extent, any specific greenspace can explain the NDVI effect.
Step 3. In case of significant main association or moderations from Step 1, life satisfaction was regressed on the three route variables additionally adjusted for NDVI, to see if accessibility to specific types of greenspace matters, given the same amount of greenness.
As a sensitivity analysis, we repeated the final models with ordered probit regression that better accommodates discrete nature of the life satisfaction.
All statistical analyses were conducted using R 4.0 [26]. We used the “betareg” function from the “betareg” package for Beta regression and the “polr” function from the “MASS” package for ordered probit regression. R code to produce the findings of this study is available at a public github repository (https://github.com/AyoungJEONG/COVCO-greenspace).
Study population characteristics are summarised in table 1. About half of the participants lived in the canton of Basel-Landschaft which consists of periurban as well as rural areas. Basel-Stadt is a predominantly urban. Less than one third of participants reported a household income in the lowest category. About two thirds of participants entered the study after November 2020. Figures 1 and 2 visualise the distribution of life satisfaction and greenspace among the study population, respectively. The pairwise correlation between greenspace variables is visualised in figure S2. NDVI was positively correlated with the percentage of forest as well as agricultural area in a buffer of 300 m, and with proximity to nearest park. It was inversely correlated with percentage of park in a buffer of 300 m, and with proximity to agricultural and forest greenspace.
Table 1Baseline characteristics of COVCO-Basel participants.
| Total | ||
| N | 9,444 (100%) | |
| Age [years] | 55.5 (15.1) | |
| Sex | Female | 5,072 (53.7%) |
| Male | 4,372 (46.3%) | |
| Household income | <6,000 CHF/month | 2,789 (29.5%) |
| 6,000–15,000 CHF/month | 5,369 (56.9%) | |
| 15,000+ CHF/month | 1,286 (13.6%) | |
| Financial worries* | 0 | 283 (3.0%) |
| 1 | 129 (1.4%) | |
| 2 | 213 (2.3%) | |
| 3 | 216 (2.3%) | |
| 4 | 204 (2.2%) | |
| 5 | 390 (4.1%) | |
| 6 | 369 (3.9%) | |
| 7 | 655 (6.9%) | |
| 8 | 1,341 (14.2%) | |
| 9 | 1,991 (21.1%) | |
| 10 | 3,653 (38.7%) | |
| Canton | Basel-Stadt | 4,770 (50.5%) |
| Basel-Landschaft | 4,674 (49.5%) | |
| Degree of urbanization | <300 inhabitants/km2 | 458 (4.8%) |
| 300–1,500 inhabitants/km2 | 1,734 (18.4%) | |
| 1,500+ inhabitants/km2 | 7,252 (76.8%) | |
| Month of entry | Jul 2020 – Oct 2020 | 3,112 (33.0%) |
| Nov 2020 – Mar 2021 | 6,332 (67.0%) | |
Data presented as mean (standard deviation) or count (percentage).
* 0–10 scale from the question “How often do you worry about being able to meet normal monthly living expenses?”, where 0 means “worry all the time” and 10 “do not ever worry”.
Figure 1 Histogram of life satisfaction in the study population (N=9444).
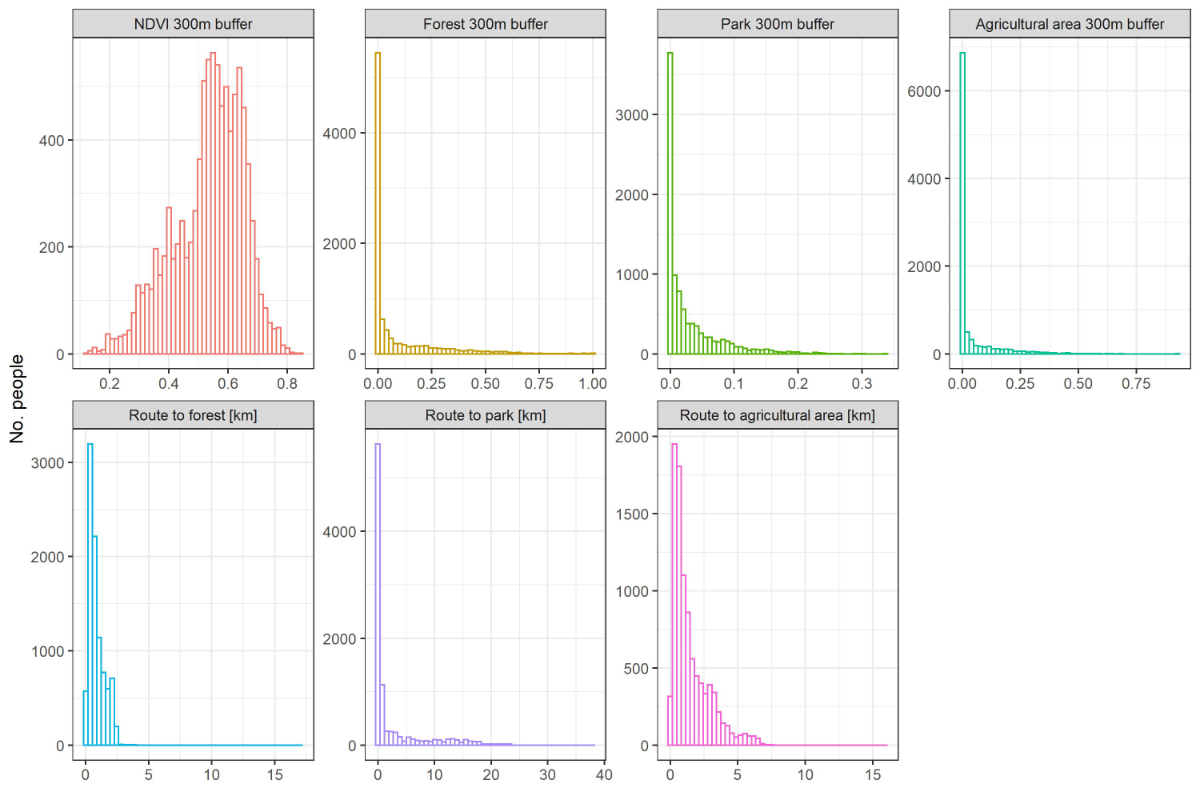
Figure 2 Histogram of greenspace variables in the study population (N=9444).
We did not observe main association of NDVI on life satisfaction (table S1). However, we observed moderations by age, household income, and financial worries (likelihood ratio test p-values were 0.016, 0.0049, and 0.014, respectively). NDVI showed negative association with life satisfaction in the youngest age group (18–29 years) but not in the older groups (figure 3 and table 2), and positive association with life satisfaction in the participants with high household income (15,000 CHF per month or higher) but not in those with lower household income (figure 4 and table 3).
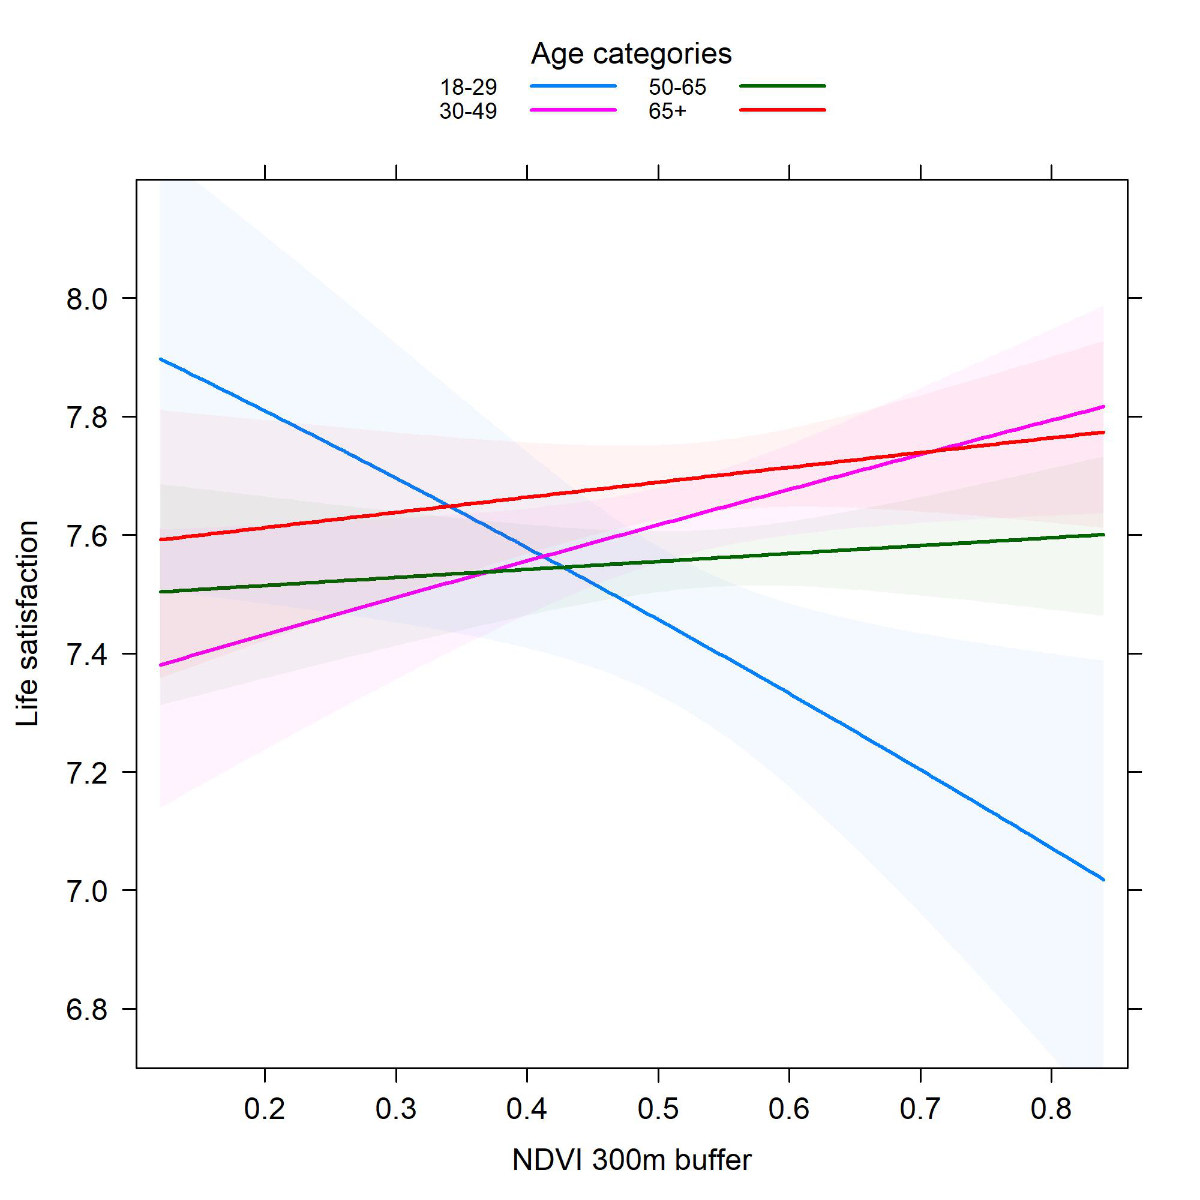
Figure 3 NDVI association with life satisfaction by age categories, adjusted for life satisfaction in the past, sex, household income, financial worries, canton, degree of urbanisation, and month of entry.
Table 2Moderation by age categories (likelihood ratio test p-value = 0.016). Results from Beta regression of life satisfaction on NDVI by age categories, adjusted for life satisfaction in the past, sex, household income, financial worries, canton, degree of urbanisation, and month of entry.
| Coefficient | Standard error | p-value | |
| ndvi_buff300 | –0.632 | 0.264 | 0.017 |
| ndvi_buff300:agecat30-49 | 0.955 | 0.295 | 0.001 |
| ndvi_buff300:agecat50-65 | 0.703 | 0.280 | 0.012 |
| ndvi_buff300:agecat65+ | 0.770 | 0.293 | 0.009 |
| agecat30-49 | –0.394 | 0.156 | 0.012 |
| agecat50-65 | –0.301 | 0.150 | 0.044 |
| agecat65+ | –0.262 | 0.157 | 0.094 |
| satisf_past_prop | 3.822 | 0.063 | 0.000 |
| sexMale | 0.080 | 0.017 | 1.84E-06 |
| hh_income6000-15000 | –0.022 | 0.019 | 0.266 |
| hh_income15000+ | –0.019 | 0.028 | 0.495 |
| finwor_3catMiddle | 0.177 | 0.021 | 4.39E-17 |
| finwor_3catLow | 0.355 | 0.022 | 1.60E-59 |
| kantonBL | –0.005 | 0.021 | 0.818 |
| urbanity300-1500 | 0.019 | 0.025 | 0.440 |
| urbanity<300 | 0.059 | 0.041 | 0.154 |
| mon_entry_2catT2 | –0.174 | 0.018 | 2.42E-23 |
satisf_now_prop ~ ndvi_buff300 * agecat + satisf_past_prop + sex + hh_income + finwor_3cat + kanton + urbanity + mon_entry_2cat
satisf_now_prop: life satisfaction scaled to (0,1)
ndvi_buff300: mean NDVI within 300 m circular buffer
agecat: age categorised into 18–29 years, 30–49 years, 50–65 years, and 65+ years
satisf_past_prop: life satisfaction in the past scaled to (0,1)
sex: female vs male
hh_income: household income categorised into <6,000, 6,000–15,000, or 15,000+ CHF/month
finwor_3cat: terciles of financial worries on a scale from 0 to 10
kanton: Basel-Stadt (BS) vs Basel-Landschaft (BL)
urbanity: degree of urbanisation categorised into <300, 300–1,500, 1,500+ inhabitants/km2
mon_entry_2cat: month of entry from July to October 2020 vs from November 2020 to March 2021
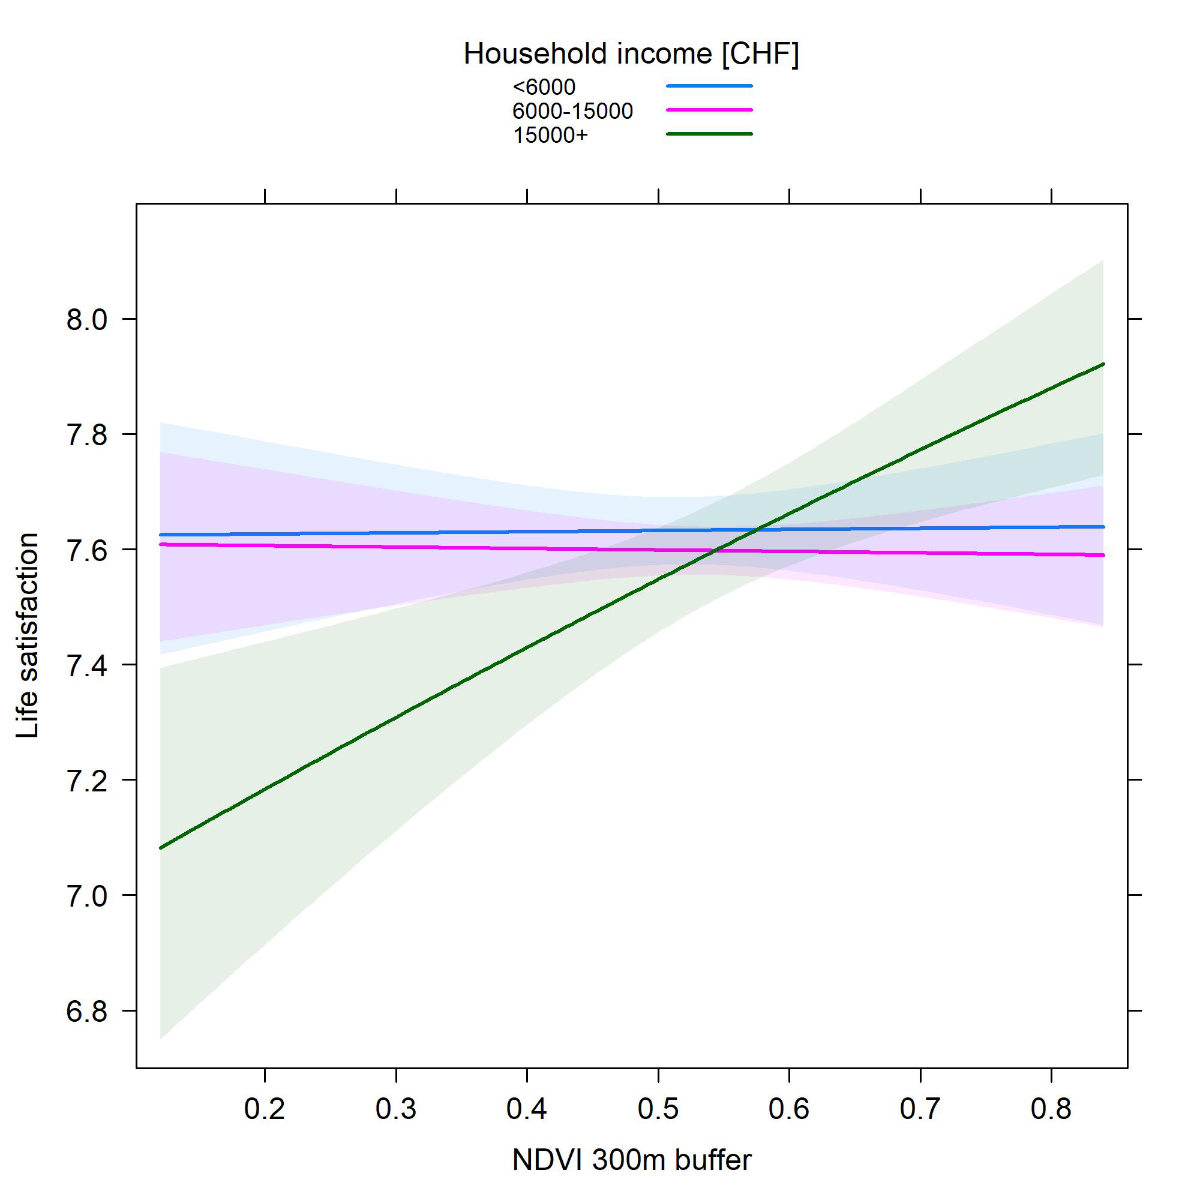
Figure 4 NDVI association with life satisfaction by household income, adjusted for life satisfaction in the past, age categories, sex, financial worries, canton, degree of urbanisation, and month of entry.
Table 3Moderation by household income (likelihood ratio test p-value = 0.0049). Results from Beta regression of life satisfaction on NDVI by household income, adjusted for life satisfaction in the past, age categories, sex, financial worries, canton, degree of urbanisation, and month of entry.
| Coefficient | Standard error | p-value | |
| ndvi_buff300 | 0.011 | 0.133 | 0.936 |
| ndvi_buff300:hh_income6000-15000 | –0.024 | 0.155 | 0.877 |
| ndvi_buff300:hh_income15000+ | 0.600 | 0.212 | 0.005 |
| hh_income6000-15000 | –0.006 | 0.084 | 0.943 |
| hh_income15000+ | –0.345 | 0.117 | 0.003 |
| satisf_past_prop | 3.825 | 0.063 | 0.000 |
| agecat30-49 | 0.098 | 0.037 | 0.007 |
| agecat50-65 | 0.061 | 0.035 | 0.083 |
| agecat65+ | 0.138 | 0.036 | 1.59E-04 |
| sexMale | 0.079 | 0.017 | 2.27E-06 |
| finwor_3catMiddle | 0.179 | 0.021 | 2.65E-17 |
| finwor_3catLow | 0.354 | 0.022 | 2.19E-59 |
| kantonBL | –0.003 | 0.021 | 0.877 |
| urbanity300-1500 | 0.020 | 0.025 | 0.408 |
| urbanity<300 | 0.067 | 0.041 | 0.108 |
| mon_entry_2catT2 | –0.175 | 0.018 | 1.56E-23 |
satisf_now_prop ~ ndvi_buff300 * hh_income + satisf_past_prop + agecat + sex + finwor_3cat + kanton + urbanity + mon_entry_2cat
satisf_now_prop: life satisfaction scaled to (0,1)
ndvi_buff300: mean NDVI within 300 m circular buffer
hh_income: household income categorised into <6,000, 6,000–15,000, or 15,000+ CHF/month
satisf_past_prop: life satisfaction in the past scaled to (0,1)
agecat: age categorised into 18–29 years, 30–49 years, 50–65 years, and 65+ years
sex: female vs male
finwor_3cat: terciles of financial worries on a scale from 0 to 10
kanton: Basel-Stadt (BS) vs Basel-Landschaft (BL)
urbanity: degree of urbanisation categorised into <300, 300–1,500, 1,500+ inhabitants/km2
mon_entry_2cat: month of entry from July to October 2020 vs from November 2020 to March 2021
This NDVI effect in the high household income group corresponds to a life satisfaction increase by 0.2 points for NDVI increase from 1st to 3rd quartile. NDVI was negatively associated with life satisfaction in the most financially worried, while positively associated with life satisfaction in the least financially worried (figure 5 and table 4). When NDVI increased from 1st to 3rd quartile, life satisfaction increased by 0.08 in the least financially worried, while it decreased by 0.06 in the most financially worried.
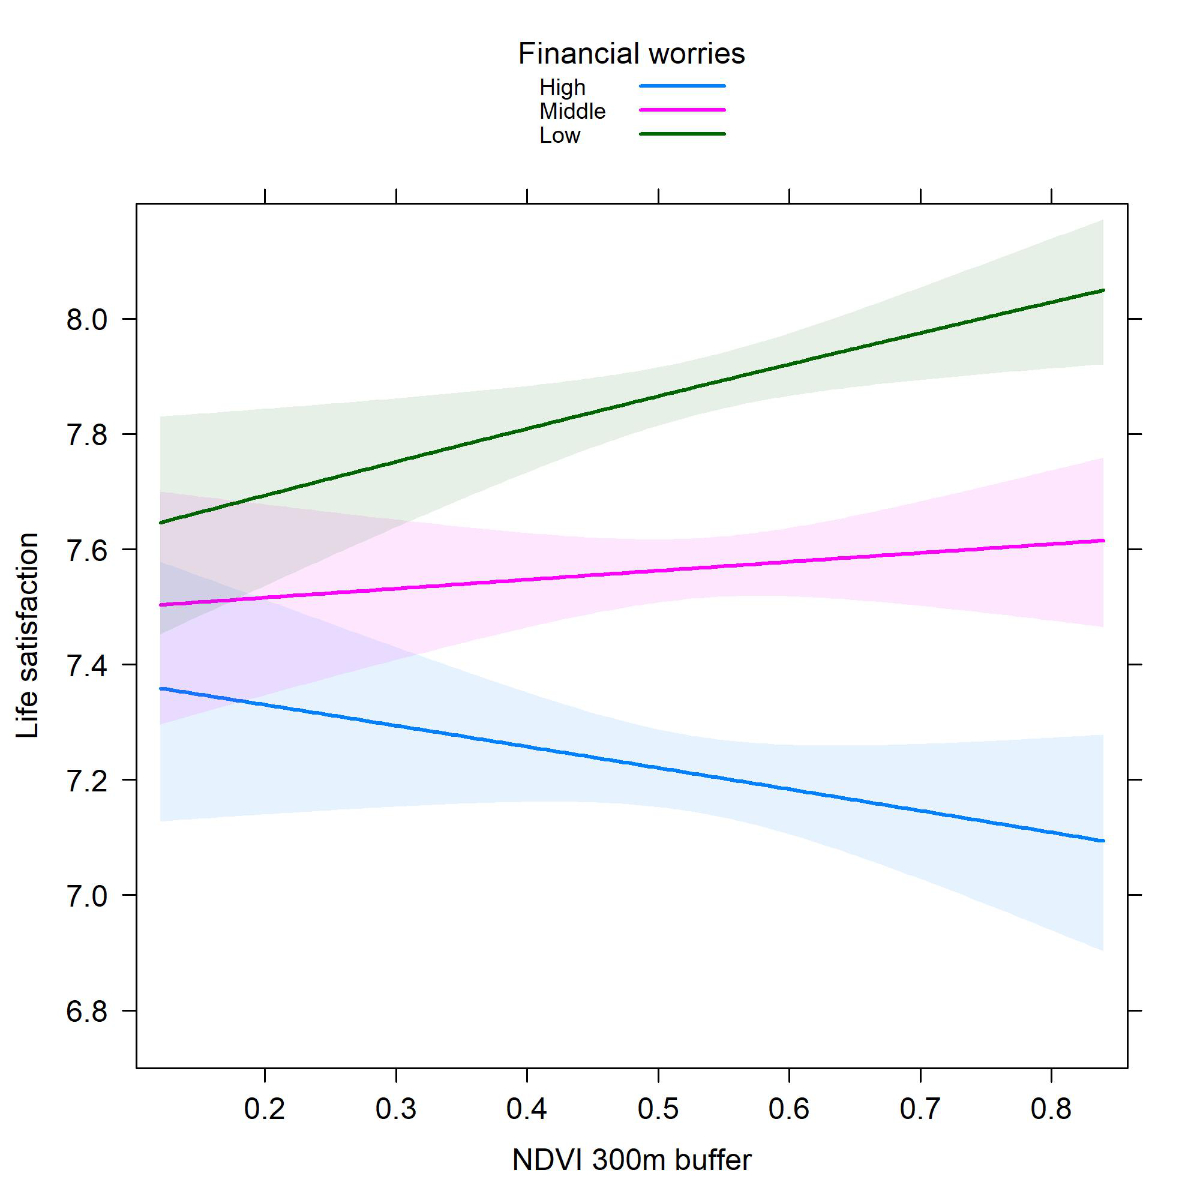
Figure 5 NDVI association with life satisfaction by financial worries, adjusted for life satisfaction in the past, age categories, sex, household income, canton, degree of urbanisation, and month of entry.
Table 4Moderation by financial worries (likelihood ratio test p-value = 0.014). Results from Beta regression of life satisfaction on NDVI by financial worries, adjusted for life satisfaction in the past, age categories, sex, household income, canton, degree of urbanisation, and month of entry.
| Coefficient | Standard error | p-value | |
| ndvi_buff300 | –0.180 | 0.136 | 0.186 |
| ndvi_buff300:finwor_3catMiddle | 0.261 | 0.172 | 0.129 |
| ndvi_buff300:finwor_3catLow | 0.502 | 0.170 | 0.003 |
| finwor_3catMiddle | 0.042 | 0.094 | 0.651 |
| finwor_3catLow | 0.089 | 0.093 | 0.336 |
| satisf_past_prop | 3.824 | 0.063 | 0.000 |
| agecat30-49 | 0.096 | 0.037 | 0.009 |
| agecat50-65 | 0.057 | 0.035 | 0.102 |
| agecat65+ | 0.133 | 0.036 | 2.68E-04 |
| sexMale | 0.079 | 0.017 | 2.24E-06 |
| hh_income6000-15000 | –0.020 | 0.019 | 0.314 |
| hh_income15000+ | –0.018 | 0.028 | 0.524 |
| kantonBL | –0.004 | 0.021 | 0.862 |
| urbanity300–1500 | 0.018 | 0.025 | 0.467 |
| urbanity<300 | 0.060 | 0.041 | 0.149 |
| mon_entry_2catT2 | –0.175 | 0.018 | 1.70E–23 |
satisf_now_prop ~ ndvi_buff300 * finwor_3cat + satisf_past_prop + agecat + sex + hh_income + kanton + urbanity + mon_entry_2cat
satisf_now_prop: life satisfaction scaled to (0,1)
ndvi_buff300: mean NDVI within 300 m circular buffer
finwor_3cat: terciles of financial worries on a scale from 0 to 10
satisf_past_prop: life satisfaction in the past scaled to (0,1)
agecat: age categorised into 18–29 years, 30–49 years, 50–65 years, and 65+ years
sex: female vs male
hh_income: household income categorised into <6,000, 6,000–15,000, or 15,000+ CHF/month
kanton: Basel-Stadt (BS) vs Basel-Landschaft (BL)
urbanity: degree of urbanisation categorised into <300, 300–1,500, 1,500+ inhabitants/km2
mon_entry_2cat: month of entry from July to October 2020 vs from November 2020 to March 2021
When we regressed life satisfaction on the three land use variables instead of NDVI, we observed neither main association nor moderations (likelihood ratio test p-values for interaction with age, household income, and financial worries were 0.62, 0.43, and 0.38, respectively; figures S3–S5 and table S2).
When we regressed life satisfaction on proximity to greenspace, the interactions with age and household income remained significant (likelihood ratio test p-values were 0.0062 and 0.0024, respectively), while the interaction with financial worries disappeared (likelihood ratio test p-value was 0.30). Increased route to forest, but not to park or to agricultural area, was associated with higher life satisfaction in the youngest age group (figure S6 and table S3a). Increased route to all three greenspaces was associated with lower life satisfaction in the participants with high household income, in line with the NDVI effects (figure S7 and table S3b). Increased route to forest, but not to park or to agricultural area, was associated with lower life satisfaction in the least financially worried but with wide confidence interval (figure S8 and table S3c).
Ordered probit regression resulted in similar results as Beta regression (tables S4–S7).
In this cross-sectional study of Basel dwellers, we observed that during the COVID-19 pandemic the residential greenness affects life satisfaction differently, depending on their age, household income, and financial worries. Living in a greener area does not benefit all dwellers in Basel and its region equally, with those with high household income and not financially worried having the largest benefit. For the young adults and the financially worried, higher greenness was in fact associated with lower life satisfaction.
Multiple studies demonstrated mental health benefits of greenspace use in the COVID-19 context. In a survey in the UK, higher NDVI indicating a greener and potentially more pleasant living area was associated with better mental well-being, and increased time spent in nature was associated with less perceived stress [27]. In an online survey in South Korea, albeit not population-representative like COVCO-Basel, decreased use of greenspace during the pandemic was associated with higher risk of major depression [28]. Another online survey in Tokyo showed beneficial effects of greenspace on mental health outcomes including life satisfaction [29]. In an online survey for college students in the USA, reduced use of public parks was associated with higher emotional stress, while national/state park availability per capita was associated with lower emotional stress [30]. The South Korean study [28] examined moderation by education, urbanicity, or perceived safety level in neighbourhood with no significant finding, while the other studies [27, 29, 30] did not assess moderation.
In this current study, the life satisfaction of young adults (age group 18–29 years) was negatively associated with residential greenness. This may indicate that younger people perceive greenness or use greenspace differently than older people. Indeed, we observed that the life satisfaction of young adults was negatively associated with proximity to forest, but not to park or to agricultural area, suggesting that greenspace usage varies by age groups. Younger people may feel rather isolated in rural area, which is greener but farther away from inner city’s facilities. Younger people may use greenspace more for socializing purposes, and therefore be more affected by the containment measures that prevent using the greenspace in their neighbourhood in the way they used to. Age-specific patterns of greenspace use have been observed in other studies. A nation-wide study in Denmark reported that reasons to visit greenspaces differed by gender and age [31]. Stress reduction and social interaction were important reasons for younger age group to visit greenspaces but not for people over 65 years. A survey on the visitors of small public urban greenspaces [32] showed that older people visited the greenspaces for rest and restitution while younger people for socialising. In a COVID-19 survey in Belgium, younger people reported higher intention to increase greenspace visits in future compared to older people [33]. This finding warrants follow-up analyses to better understand what factors are essential to the well-being of young adults.
Socio-economic position (SEP)-dependent greenness effects were also observed for mortality in the Swiss National Cohort study conducted before the COVID-19 pandemic [25]. Given that the positive associations of proximity to greenspace with life satisfaction in the high-income group was consistent across different types of greenspace, we believe the differential usage alone cannot explain the SEP-dependent greenness effects on life satisfaction. Subjects with increased emotional or mental stress may have less resources and/or less opportunities to access the restorative potential of greenspace compared to less stressed subjects. In a recent ecological momentary assessment of university students, stress and negative affect was bi-directionally associated with less physical activity [34]. Physical activity has been shown either to mediate [35] or to moderate [36] the greenness effects on psychological well-being. Persons with higher household income are also more likely to have jobs that allow for home office. Working at home would allow them to more actively benefit from greenspace in their neighbourhood. A recent cross-sectional study in the British adults, manual workers visited green space less than non-manual workers when the movement restriction was enforced as a COVID-19 containment measure [37].
NDVI effects cannot be attributed to any specific type of greenspace analysed in this study, i.e. forest, park, and agricultural area. Basel dwellers may benefit from other types of greenspace such as private gardens, sports fields, street trees, etc., which the land use data used in this study do not delineate. The majority of the participants in a UK survey reported increased time spent in nature as a result of COVID-19 pandemic, mainly in private gardens [27]. In a survey in Tokyo, green views from windows showed greater effects on mental health outcomes than greenspace use, suggesting that the benefits of nature exposure need not act through direct experience [29].
In this study we produced the first evidence on the association between residential greenness and life satisfaction during the COVID-19 pandemic, from a population-based sample of Swiss adults. By investigating the effect moderation for a priori selected variables, we demonstrated the differential benefits of residential greenness by sociodemographic characteristics.
This study is by design cross-sectional and does not provide causal evidence. Although we adjusted the regression models for a number of covariates, our findings may still be biased by unobserved confounders. There could be many other built environment-related characteristics that may correlate with greenness as well as associated with subjective well-being. However, as we objectively assessed the explanatory variables, our findings in this study are unlikely biased by reverse causation. Nevertheless, as our primary interest is in the effect of residential greenspace on promoting life satisfaction, we cannot exclude the alternative explanation that a high income goes along with better life satisfaction and choosing green neighbourhoods for residence. The low participation rate in the study limits the generalisability of the results and could have introduced selection bias. Bias could have resulted from restricting analysis to the study sample without missing information on the variables considered. Finally, the current study is focused on a widely used single question for life satisfaction as an endpoint. This limits its comparability with studies that use more detailed instruments.
Given the generally high level of greenspace in Swiss urban and periurban space compared to other cities in Europe or elsewhere and given the wide heterogeneity of greenspace distribution and population characteristics, our findings from Basel dwellers may not be generalised to other settings. Future research is warranted to investigate how people use and interact with the various greenspace, and if use pattern and life stress modulate the greenspace effects on well-being.
The effect of residential greenness on life satisfaction during the COVID-19 pandemic varies by sociodemographic characteristics. People of high SEP benefit most from living in a green environment. The association between residential greenness and life satisfaction cannot be attributed to specific types of greenspace. Deeper understanding of the mechanism behind the association between greenspace and well-being is required for urban engineering to improve the urban dwellers’ well-being in different age and social strata.
The data that support the findings of this study are available upon reasonable request from the corresponding author, Ayoung Jeong, and the principal investigator of the COVCO-Basel cohort, Nicole Probst-Hensch.
We like to thank Thomas Vermes, Ekin Tertemiz, Emmanuel Schaffner for their contribution to the data management of the digital cohort. We thank the research staff and field workers for the coordination of data collection: Melissa Witzig, Alexia Schmitt, Tamara Wirth, Susanna Nussbaumer, Cornelia Devonas, Maria Vitale, Cynthia Vecchio-Lopez, Astrid Siegfried, Thea Wülser, Kristina Hoffmann, Julia Bähler, Luisa Waschkowski, Katrina Obas, Nadia Hedrich and Nicolas Moesli. We thank the Swiss Federal Statistical Office for providing the randomised list of participants for the main population-based portion of our study. We thank the Corona Immunitas programme and SSPH+ for the collaboration. Study data were collected and managed using REDCap electronic data capture tools hosted at Swiss Tropical and Public Health Institute.
Author contributions: Ayoung Jeong: Conceptualisation, Methodology, Formal analysis, Data curation, Writing – original draft, Writing – review & editing. Fiona Galliker: Conceptualisation, Methodology, Formal analysis, Data curation, Writing – original draft, Writing – review & editing. Medea Imboden: Investigation, Writing – review & editing, Project administration. Dirk Keidel: Investigation, Data curation, Writing – review & editing, Project administration. Kees de Hoogh: Conceptualisation, Methodology, Investigation, Data curation, Writing – review & editing. Danielle Vienneau: Investigation, Data curation, Writing – review & editing. Michael Siegrist: Conceptualisation, Methodology, Writing – review & editing. Luca Crivelli: Investigation, Writing – review & editing. Gianfranco Lovison: Methodology, Writing – review & editing. Nicole Probst-Hensch: Conceptualisation, Methodology, Writing – original draft, Writing – review & editing, Project administration, Funding acquisition.
All authors have completed and submitted the International Committee of Medical Journal Editors form for disclosure of potential conflicts of interest. No potential conflict of interest was disclosed.
COVCO-Basel was funded by the Health Departments of Basel-Stadt and Basel-Landschaft. The Corona Immunitas programme was funded by several sources (for full funding details see [20]) that includes, but is not limited to, SSPH+ and Swiss Federal Office of Public Health.
1. Fancourt D , Steptoe A , Bu F . Trajectories of anxiety and depressive symptoms during enforced isolation due to COVID-19 in England: a longitudinal observational study. Lancet Psychiatry. 2021 Feb;8(2):141–9. https://doi.org/10.1016/S2215-0366(20)30482-X
2. Möhring, K. , et al. , The COVID-19 pandemic and subjective well-being: longitudinal evidence on satisfaction with work and family. European Societies, 2021. 23(sup1): p. S601-S617.
3. Talevi D , Socci V , Carai M , Carnaghi G , Faleri S , Trebbi E , et al. Mental health outcomes of the CoViD-19 pandemic. Riv Psichiatr. 2020 May-Jun;55(3):137–44.
4. Keidel D , et al. COVCO-Basel Wissenschaftlicher Schlussbericht. URL: https://www.swisstph.ch/fileadmin/user_upload/CoVCoBasel_Schlussbericht_20211028.pdf. 2021.
5. Diener E , Chan MY . Happy people live longer: subjective well‐being contributes to health and longevity. Appl Psychol Health Well-Being. 2011;3(1):1–43. https://doi.org/10.1111/j.1758-0854.2010.01045.x
6. Veenhoven R . Healthy happiness: effects of happiness on physical health and the consequences for preventive health care. J Happiness Stud. 2008;9(3):449–69. https://doi.org/10.1007/s10902-006-9042-1
7. Huppert, U. , Measurement really matters. Measuring wellbeing series; discussion paper, 2017. 2.
8. DiMaria CH , Peroni C , Sarracino F . Happiness Matters: Productivity Gains from Subjective Well-Being. J Happiness Stud. 2020;21(1):139–60. https://doi.org/10.1007/s10902-019-00074-1
9. Jalali Z , Heidari A . The relationship between happiness, subjective well-being, creativity and job performance of primary school teachers in Ramhormoz city. Int Educ Stud. 2016;9(6):45–52. https://doi.org/10.5539/ies.v9n6p45
10. Knight SJ , Howley P . Can clean air make you happy? Examining the effect of nitrogen dioxide (NO2) on life satisfaction. 2017, HEDG, c/o Department of Economics, University of York.
11. Dadvand P , Bartoll X , Basagaña X , Dalmau-Bueno A , Martinez D , Ambros A , et al. Green spaces and General Health: roles of mental health status, social support, and physical activity. Environ Int. 2016 May;91:161–7. https://doi.org/10.1016/j.envint.2016.02.029
12. Hart EA , Lakerveld J , McKee M , Oppert JM , Rutter H , Charreire H , et al. Contextual correlates of happiness in European adults. PLoS One. 2018 Jan;13(1):e0190387. https://doi.org/10.1371/journal.pone.0190387
13. Jimenez MP , DeVille NV , Elliott EG , Schiff JE , Wilt GE , Hart JE , et al. Associations between Nature Exposure and Health: A Review of the Evidence. Int J Environ Res Public Health. 2021 Apr;18(9):4790. https://doi.org/10.3390/ijerph18094790
14. D’Alessandro D , Buffoli M , Capasso L , Fara GM , Rebecchi A , Capolongo S ; Hygiene on Built EnvironmentWorking Group on Healthy Buildings of the Italian Society of Hygiene, Preventive Medicine and Public Health (SItI) . Green areas and public health: improving wellbeing and physical activity in the urban context. Epidemiol Prev. 2015 Jul-Aug;39(4 Suppl 1):8–13.
15. de Vries S , van Dillen SM , Groenewegen PP , Spreeuwenberg P . Streetscape greenery and health: stress, social cohesion and physical activity as mediators. Soc Sci Med. 2013 Oct;94:26–33. https://doi.org/10.1016/j.socscimed.2013.06.030
16. Hartig T , Mitchell R , de Vries S , Frumkin H . Nature and health. Annu Rev Public Health. 2014;35(1):207–28. https://doi.org/10.1146/annurev-publhealth-032013-182443
17. Honold, J. , et al. , Restoration in urban spaces: Nature views from home, greenways, and public parks. 2016. 48(6): p. 796-825.
18. Jenkins A . Biotic systems as a critical urban infrastructure during crisis: learning from the COVID-19 pandemic. Cities Health. 2020;•••:1–3. https://doi.org/10.1080/23748834.2020.1789821
19. Venter ZS , Barton DN , Gundersen V , Figari H , Nowell M . Urban nature in a time of crisis: recreational use of green space increases during the COVID-19 outbreak in Oslo, Norway. Environ Res Lett. 2020;15(10):104075. https://doi.org/10.1088/1748-9326/abb396
20. West EA , Anker D , Amati R , Richard A , Wisniak A , Butty A , et al.; Corona Immunitas Research Group . Corona Immunitas: study protocol of a nationwide program of SARS-CoV-2 seroprevalence and seroepidemiologic studies in Switzerland. Int J Public Health. 2020 Dec;65(9):1529–48. https://doi.org/10.1007/s00038-020-01494-0
21. Layard R . Economics. Measuring subjective well-being. Science. 2010 Jan;327(5965):534–5. https://doi.org/10.1126/science.1186315
22. VanderWeele TJ , Trudel-Fitzgerald C , Allin P , Farrelly C , Fletcher G , Frederick DE , et al. Current recommendations on the selection of measures for well-being. Prev Med. 2020 Feb;133:106004. https://doi.org/10.1016/j.ypmed.2020.106004
23. VanderWeele TJ . On the promotion of human flourishing. Proc Natl Acad Sci USA. 2017 Aug;114(31):8148–56. https://doi.org/10.1073/pnas.1702996114
24. Weier J , Herring D . Measuring Vegetation (NDVI & EVI). URL: https://earthobservatory.nasa.gov/features/MeasuringVegetation. 2000.
25. Vienneau D , de Hoogh K , Faeh D , Kaufmann M , Wunderli JM , Röösli M ; SNC Study Group . More than clean air and tranquillity: residential green is independently associated with decreasing mortality. Environ Int. 2017 Nov;108:176–84. https://doi.org/10.1016/j.envint.2017.08.012
26. Team RC . R: A language and environment for statistical computing. R Foundation for Statistical Computing, Vienna, Austria. URL https://www.R-project.org/. 2020.
27. Robinson JM , Brindley P , Cameron R , MacCarthy D , Jorgensen A . Nature’s Role in Supporting Health during the COVID-19 Pandemic: A Geospatial and Socioecological Study. Int J Environ Res Public Health. 2021 Feb;18(5):2227. https://doi.org/10.3390/ijerph18052227
28. Heo S , Desai MU , Lowe SR , Bell ML . Impact of Changed Use of Greenspace during COVID-19 Pandemic on Depression and Anxiety. Int J Environ Res Public Health. 2021 May;18(11):5842. https://doi.org/10.3390/ijerph18115842
29. Soga M , Evans MJ , Tsuchiya K , Fukano Y . A room with a green view: the importance of nearby nature for mental health during the COVID-19 pandemic. Ecol Appl. 2021 Mar;31(2):e2248. https://doi.org/10.1002/eap.2248
30. Larson LR , Mullenbach LE , Browning MH , Rigolon A , Thomsen J , Metcalf EC , et al. Greenspace and park use associated with less emotional distress among college students in the United States during the COVID-19 pandemic. Environ Res. 2022 Mar;204(Pt D):112367. https://doi.org/10.1016/j.envres.2021.112367
31. Schipperijn J , Ekholm O , Stigsdotter UK , Toftager M , Bentsen P , Kamper-Jørgensen F , et al. Factors influencing the use of green space: results from a Danish national representative survey. Landsc Urban Plan. 2010;95(3):130–7. https://doi.org/10.1016/j.landurbplan.2009.12.010
32. Peschardt KK , Schipperijn J , Stigsdotter UK . Use of Small Public Urban Green Spaces (SPUGS). Urban For Urban Green. 2012;11(3):235–44. https://doi.org/10.1016/j.ufug.2012.04.002
33. da Schio N , Phillips A , Fransen K , Wolff M , Haase D , Ostoić SK , et al. The impact of the COVID-19 pandemic on the use of and attitudes towards urban forests and green spaces: exploring the instigators of change in Belgium. Urban For Urban Green. 2021;65:127305. https://doi.org/10.1016/j.ufug.2021.127305
34. Schultchen D , Reichenberger J , Mittl T , Weh TR , Smyth JM , Blechert J , et al. Bidirectional relationship of stress and affect with physical activity and healthy eating. Br J Health Psychol. 2019 May;24(2):315–33. https://doi.org/10.1111/bjhp.12355
35. Liu Y , Wang R , Xiao Y , Huang B , Chen H , Li Z . Exploring the linkage between greenness exposure and depression among Chinese people: mediating roles of physical activity, stress and social cohesion and moderating role of urbanicity. Health Place. 2019 Jul;58:102168. https://doi.org/10.1016/j.healthplace.2019.102168
36. Hansmann R , Hug SM , Seeland K . Restoration and stress relief through physical activities in forests and parks. Urban For Urban Green. 2007;6(4):213–25. https://doi.org/10.1016/j.ufug.2007.08.004
37. Burnett H , Olsen JR , Nicholls N , Mitchell R . Change in time spent visiting and experiences of green space following restrictions on movement during the COVID-19 pandemic: a nationally representative cross-sectional study of UK adults. BMJ Open. 2021 Mar;11(3):e044067. https://doi.org/10.1136/bmjopen-2020-044067
The appendix is available in the pdf version of the article.