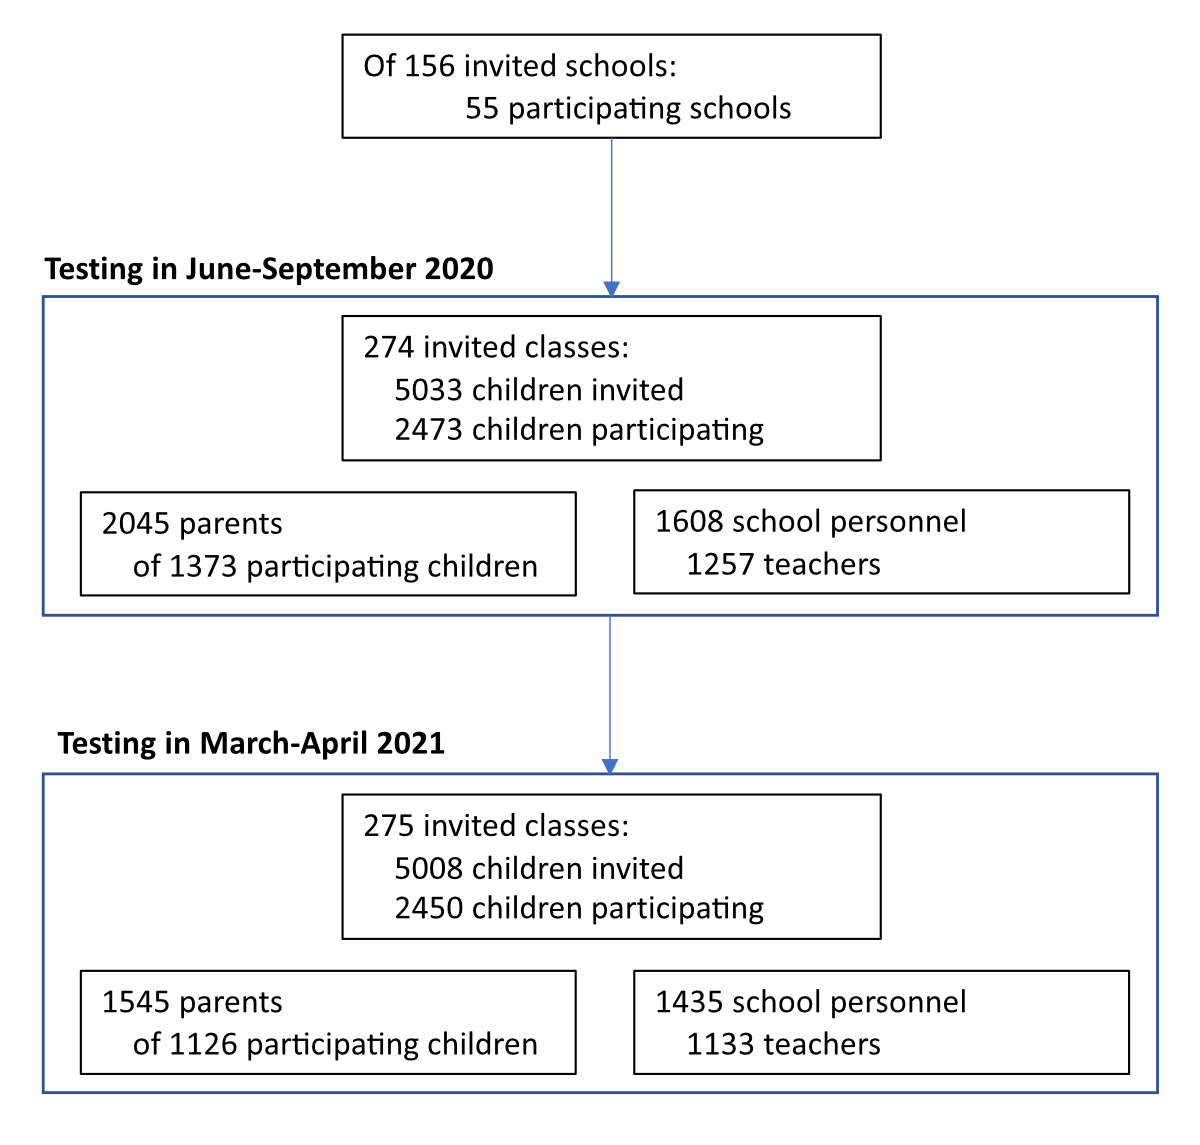
Figure 1 Flowchart of study participants.
DOI: https://doi.org/10.4414/SMW.2022.w30193
The spread of severe acute respiratory syndrome coronavirus 2 (SARS-CoV-2) in schools has been variable across regions and at different time points [1–4]. Despite accumulating evidence that children experience milder symptoms [5, 6] and no greater incidence or SARS-CoV-2 infections than adults [7, 8], the evidence of how SARS-CoV-2 infection spread between family and school members remains limited.
In response to the COVID-19 pandemic, many countries worldwide suspended in-person attendance of schools in 2020–2021 for significant periods [9, 10]. In contrast, despite the high incidence of SARS-CoV-2, children in Switzerland attended school in person continuously in 2020–2021 except for 6 weeks in March-May 2020, which coincided with national lockdown measures. After the summer break of 2020, preventive measures (e.g., distancing rules in classrooms and teachers’ rooms, no mixing of classes, reduction of large group activities, a requirement to keep children at home when ill, contact tracing systems) were retained in all schools in the school year 2020/2021. In autumn 2020, as the incidence of SARS-CoV-2 infections was rising, mandatory masking was implemented for adults in all schools (October 2020), children in secondary schools (November 2020) and older children in primary schools (approximately from age 10; January 2021). Preventive measures in the public and workplace were often broader. For example, masking in public transport, shops and public buildings was gradually implemented in August-October 2020, home office work was recommended when possible from November 2020 (obligatory from January 2021), and the number of persons in public or private events and meetings was gradually restricted to 5 persons in January 2021. With the easing incidence of SARS-CoV-2 infections, these measures were again relaxed from April 2021.
Few studies have directly examined the incidence or seroprevalence of SARS-CoV-2 infections in children, parents and teachers from the same school communities [11, 12]. Existing studies have mostly analysed diagnosed SARS-CoV-2 infections or those identified by screening of contacts, thus likely missing asymptomatic and mild infections. This study aimed to describe SARS-CoV-2 seroprevalence within Swiss cantonal districts and school communities in children, parents and school personnel in June-September 2020 and March-April 2021.
Ciao Corona is a cohort study of 2,500 children, 2,000 parents of the participating children, and 1,600 school personnel from 55 randomly selected schools from all districts of the canton of Zürich, Switzerland, described in detail earlier [13, 14]. Within participating schools, children from randomly selected classes, all school personnel and parents of participating children were invited. The target number of enrolled schools per district was proportional to the total district population size. The study was approved by the Ethics Committee of the Canton of Zürich, Switzerland (2020-01336). Participants (or their parents) provided written informed consent.
Serology was measured in June-September 2020 (children: June-July; adults: August-September) and March-April 2021 in venous blood with the SenASTrIS test (Sensitive Anti-SARS-CoV-2 Spike Trimer Immunoglobulin Serological, sensitivity 98.3%, specificity 98.4%, as determined in population-based samples) [15, 16]. We excluded vaccinated adults (n = 123) and those eligible for vaccination but with unclear vaccination status (n = 215) from the main analysis of March-April 2021 results. In case siblings (two or three children) of the same family were attending the randomly invited classes within schools and were tested, each child was treated as independent.
We collected sociodemographic information of the participants with online questionnaires on enrolment in the study. For teaching school personnel of the participating classes, we collected the number of teaching hours and the duration of teaching to identify main class teachers (defined as teaching the tested class ≥14 hours per week for ≥6 months in 2020/2021).
Descriptive results of the cohorts and individuals are presented for June-September 2020 and March-April 2021, whereas results in schools, classes and families focus on March-April 2021 because seroprevalence was low and thus the proportion of false-positive values among the unadjusted individual serological results was comparatively high in June-September 2020.
We adjusted population seroprevalence estimates for test accuracy using parametric bootstrapping sampling [17], using the function adjPrevSensSpecCI from the R package bootComb [18]. The function takes the sensitivity and specificity of the serological test, as well as their confidence intervals, and the number of tested and seropositive participants as inputs to estimate the adjusted seroprevalence. We also present seroprevalence stratified by sex and school level. (In cases of parents with children from or teachers present in multiple school levels, their data were included for each relevant school level). To compare the proportions of seropositive children and teachers in classes, and children and parents in families, we used unadjusted serological test results because adjustment for false negative and positive values is only possible on a population level. We used multivariable logistic regression models to predict individual unadjusted serological results of children, parents and class teachers and thus estimate the predictive value of sex, age, school level and cumulative incidence of diagnosed SARS-CoV-2 infections in the district.
Data analysis was performed with R version 4.0.3 [19]. There were no missing data for the main presented variables (serology, age, sex, and school, class and family information).
We further explored the variability of seroprevalence within and across cantonal districts and school communities in March-April 2021. We defined a school community as a single school or a pair of a primary and a secondary school serving the same area. We compared the seroprevalence of the tested children, parents and teachers with the total per capita cumulative incidence of diagnosed SARS-CoV-2 infections within the cantonal districts and school communities to compare the seroprevalence in the three participating cohorts to the overall number of detected cases in the area. Official statistics on confirmed SARS-CoV-2 infections in the canton of Zürich [20] were used to calculate cumulative incidence in the total population of the districts or postal codes constituting tested school communities. To obtain the estimated cumulative incidence in school communities, the constituent postal codes were weighted by the number of tested children from the school community residing in them.
In June-September 2020, 2,473 children, 1,608 school personnel and 2,045 parents participated in the study. In March-April 2021, 2,450 children, 1,435 school personnel and 1,545 parents participated. Figure 1 shows the flowchart of study participants. We present the age, sex and serological status of participants (including the raw proportions of seropositive participants) in table 1.
Figure 1 Flowchart of study participants.
Table 1Characteristics of the children, school personnel and parent participant cohorts in June-September 2020 and March-April 2021.
| June-September 2020 | March-April 2021 | |
| Children | 2473 | 2450 |
| n (%) seropositive | 144 (6%) | 469 (19%) |
| Age (median [range]) | 1 [6–16] | 12 [7–17] |
| Sex (female (%)) | 1270 (51%) | 1279 (52%) |
| School personnel | 1608 | 1435 |
| n (%) seropositive | 98 (6%) | 258 (18%) |
| Age (median [range]) | 45 [15–76] | 44 [15–77] |
| Sex (female (%)) | 1214 (75%) | 1084 (76%) |
| Parents | 2045 | 1545 |
| n (%) seropositive | 148 (7%) | 347 (22%) |
| Age (median [range]) | 45 [25–69] | 46 [29–72] |
| Sex (female (%)) | 1132 (55%) | 888 (57%) |
In June–September 2020, the adjusted seroprevalence was 4.4% (95% confidence interval 2.1–6.2%) among children, 4.6% (2.3–6.7%) among school personnel and 5.8% (3.5–7.8%) among parents. In March–April 2021, the seroprevalence was 18.1% (15.7–20.7%) among children, 16.9% (14.1–19.8%) among school personnel and 20.9% (18.0–23.9%) among parents. The seroprevalence was slightly lower (15.0% in school personnel and 19.3% in parents) when incorporating adjusted results from vaccinated and potentially vaccinated adults (appendix).
The relationship between the seroprevalence of children, school personnel and parent cohorts within districts and school communities was not consistent in March-April 2021 (figure 2), with large variation in cohort estimates also across districts and school communities.
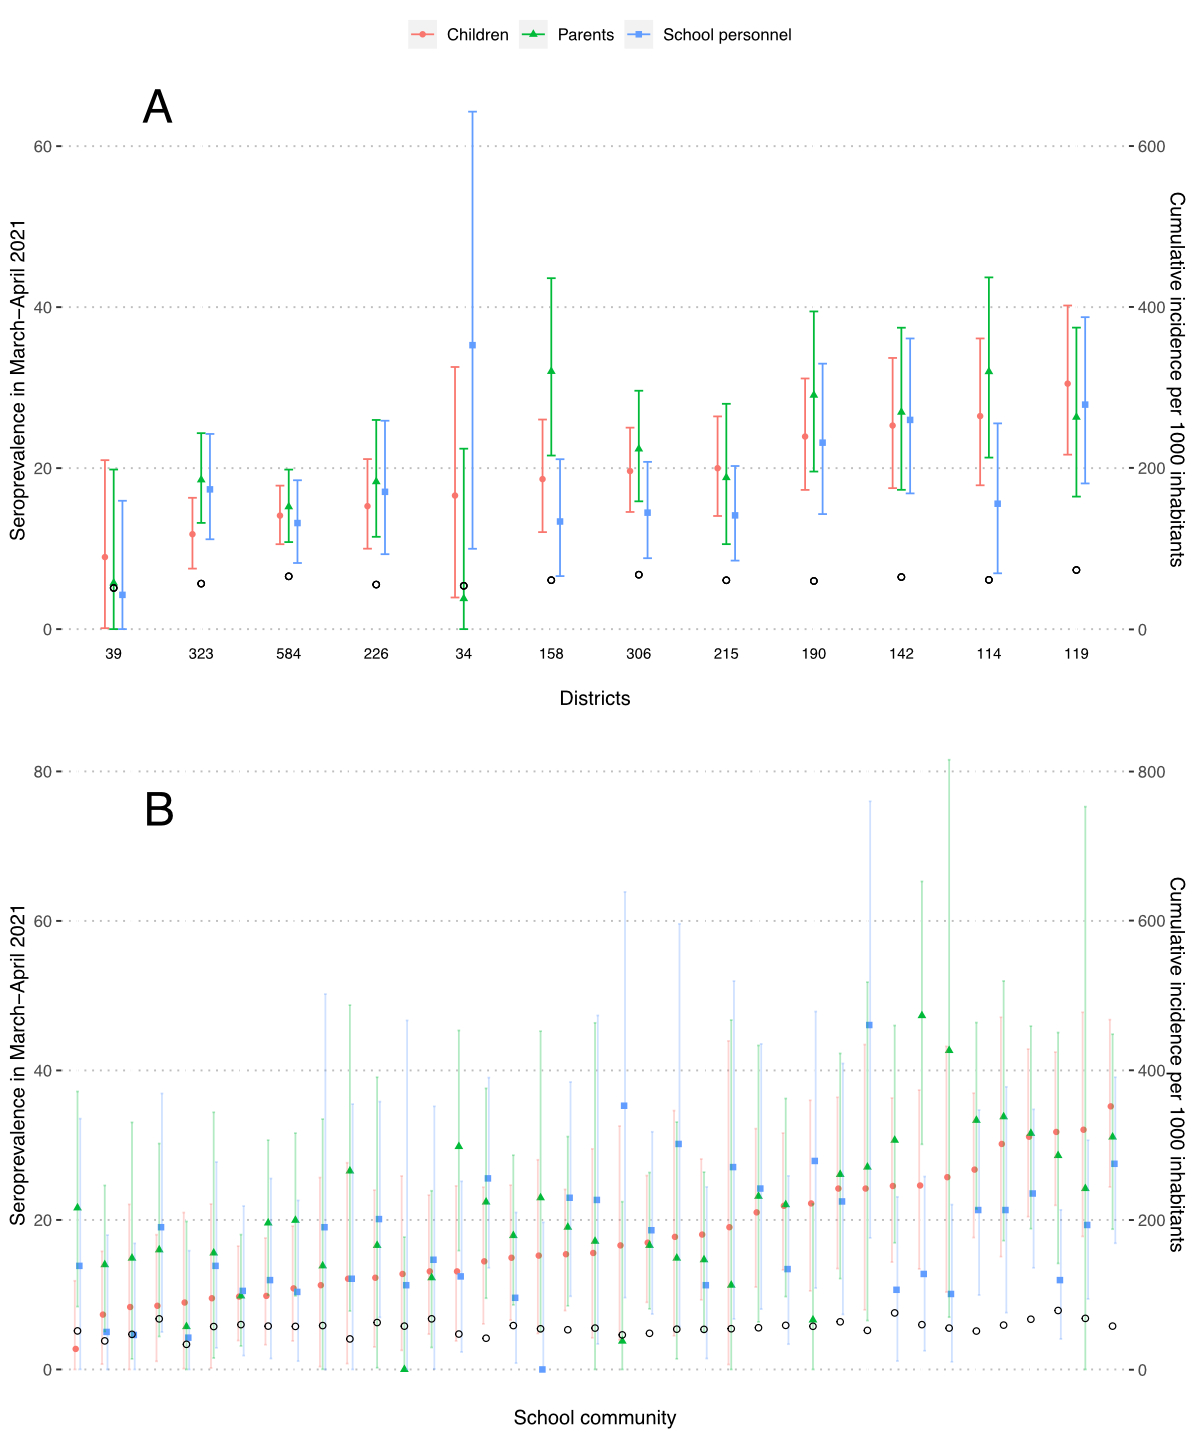
Figure 2 Seroprevalence (%) in children, parents and school personnel and cumulative incidence of the population in the canton of Zürich, Switzerland, in March-April 2021.
A – within cantonal districts, B – within school communities
Empty black circles represent the cumulative incidence of laboratory-confirmed SARS-CoV-2 infections among inhabitants of the district by the middle of the testing period. At the bottom of figure 1A are the numbers of children tested within the district. Districts and school communities are ordered by increasing seroprevalence in children.
The median difference between parents’ and children’s seroprevalence in districts was 2.2% (interquartile range [IQR] 1.7% to 5.2%), and the median difference between school personnel and children was –1.8% (IQR –5.2% to 1.0%). The median difference between parents’ and children’s seroprevalence in school communities was 2.9% (IQR –1.8% to 7.1%), and between school personnel and children, it was –0.5% (IQR –7.2% to 7.3%). The distributions were similar when analysing children (n = 577) and parents (n = 1016) only from families in which both parents were tested (appendix, figure S3).
The variation in seroprevalence of SARS-CoV-2 was more pronounced than the variation in cumulative incidence. The median ratio of children’s seroprevalence to per capita diagnosed SARS-CoV-2 cases in district inhabitants was 3.1 (range 1.8 to 4.3, IQR 2.6 to 3.9).
We observed no sex differences in the seroprevalence within cohorts in March-April 2021 (table 2).
Table 2Seroprevalence with 95% confidence interval in children, parents and school personnel based on sex and school level in March-April 2021.
| n | Children | n | Parents a | n | School personnel b | ||
| Seroprevalence | Seroprevalence | Seroprevalence | |||||
| Sex | Female | 1279 | 18.2% (15.3–21.3) | 888 | 21.5% (18.1–25.1) | 1084 | 16.7% (13.9–20.1) |
| Male | 1165 | 18.1% (15.1–21.2) | 645 | 20.2% (16.4–24.1) | 347 | 17.1% (12.5–22.0) | |
| School level | Lower | 768 | 18.1% (14.7–21.7) | 669 | 22.6% (18.8–26.7) | 216 | 21.3% (15.3–27.9) |
| Middle | 845 | 20.3% (16.9–23.9) | 599 | 23.4% (19.4–27.7) | 181 | 17.2% (11.2–24.0) | |
| Upper | 837 | 16.0% (12.7–19.3) | 392 | 17.8% (13.4–22.6) | 227 | 18.4% (12.8–24.5) | |
a Parents with tested children in several school levels are included in all relevant groups.
b Only teachers of the tested classes are included in the estimates stratified by school level. Teachers in several school levels are included in all relevant groups. Seroprevalence in other school personnel was 15.6% (12.4–18.9) [n = 864].
Children and parents with children in the upper school level had lower seroprevalence. No substantial difference existed in the seroprevalence of children with tested and non-tested parents (18.5% vs 17.9%). Among school personnel, teachers and canteen personnel were seropositive most frequently (17.8%, n = 1133, and 17.2%, n = 88), followed by cleaning personnel (15.3%, n = 67) and school administration (11.5%, n = 126). In a multivariable logistic regression model, children at the middle school level (vs upper school level; odds ratio [OR] with 95% confidence interval 1.29 [1.01–1.65]) and residing in districts with a higher cumulative incidence of confirmed SARS-CoV-2 infections (OR with 95% confidence interval 1.03 (1.01–1.05) for an additional infection per 1,000 district inhabitants) were more likely to test seropositive. No significant predictors were observed for parents’ and class teachers’ serological results; full results of the models are provided in the appendix (Table S3).
Potentially due to overall low seroprevalence in June-September 2020, we observed no significant sex differences in any of the three cohorts and no differences between the school levels in parents and school personnel (appendix, table S4). Children in the lower school level had slightly lower seroprevalence, although the absolute differences were small (2.9% in lower vs 5.2% in middle and 4.7% in upper school levels).
In March-April 2021, children from 275 classes (median 5 classes per school) were tested. In 134 classes, at least 4 children, at least 25% of the children and at least one main teacher were tested. Among these, classes with seropositive main teachers had a higher proportion of seropositive children (figure 3A). For 1,126 (46%) children, at least one parent was tested; two parents were tested for 577 (24%) children. Children with two seropositive parents were the most likely to be seropositive, followed by children with a single seropositive parent (figure 3B).
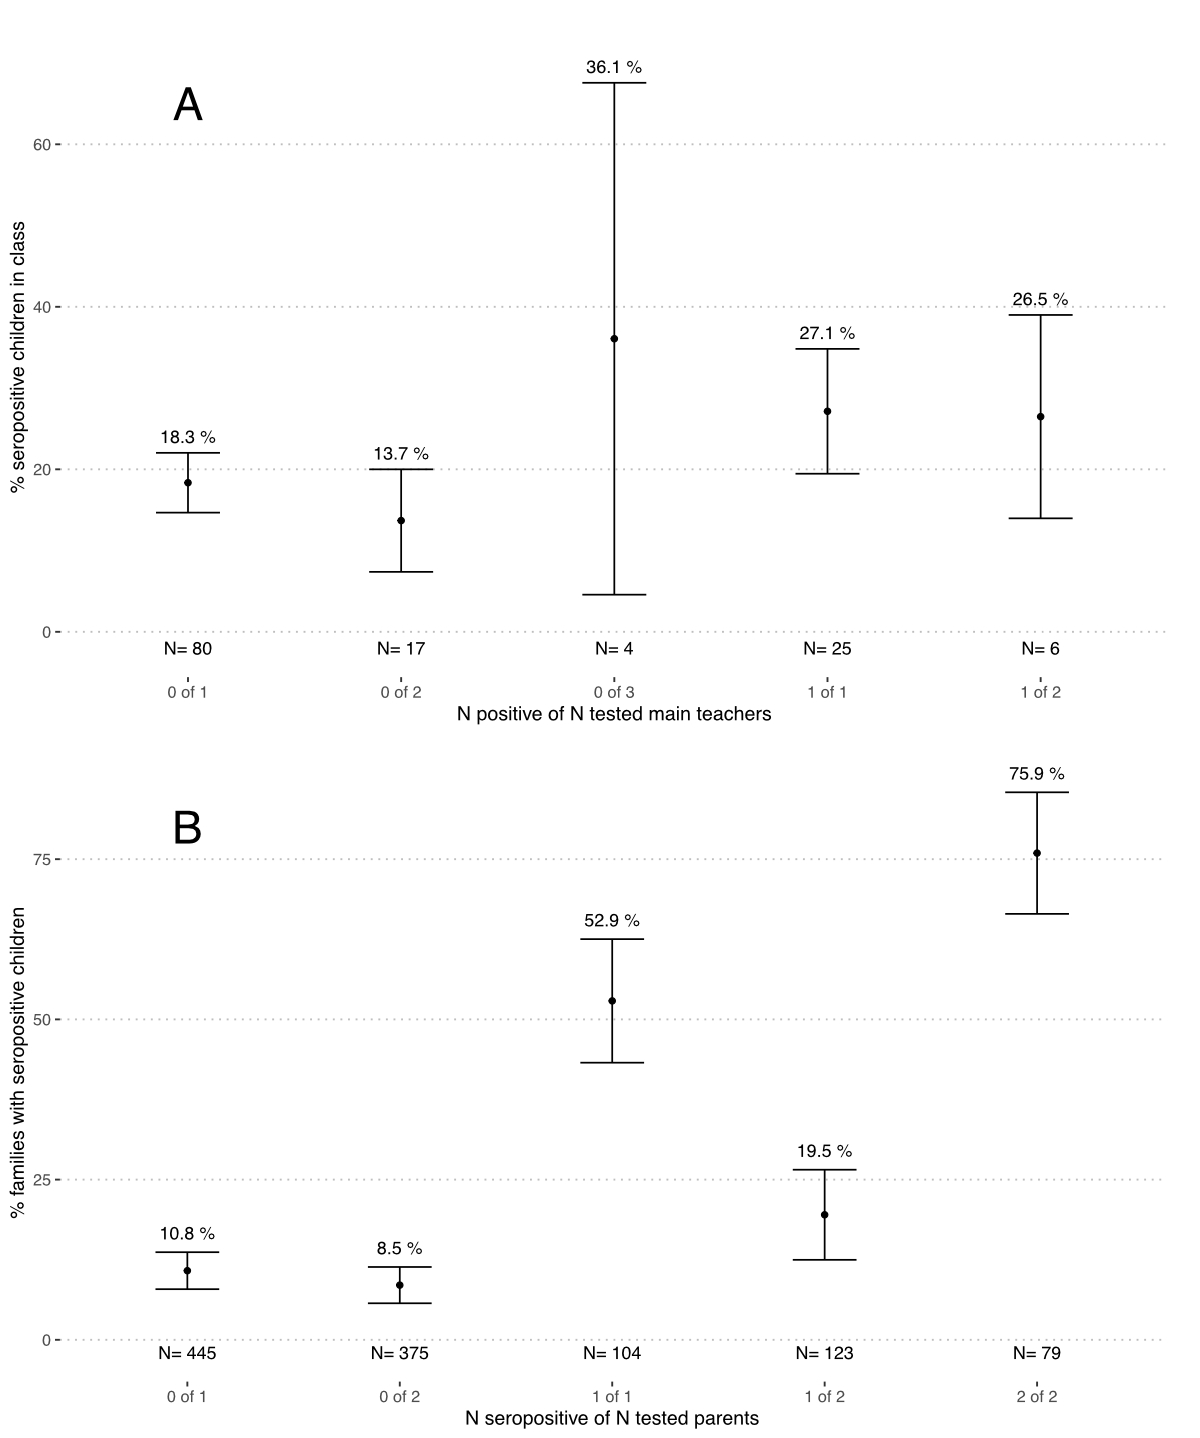
Figure 3 Proportion of seropositive children in classes and families depending on the number of tested and seropositive main teachers and parents in March-April 2021.
A – Classes with at least one main teacher and 4 children tested. Numbers (N) below graphs correspond to the numbers of classes in the category.
B – Families with at least one child and one parent tested. Numbers (N) below graphs correspond to the numbers of families in the category.
Note: The name of the category, written in grey below the number of classes or families tested, tells how many teachers (parents) were tested in a class (family) from the total tested within that class (family). E.g., “0 of 1” signifies classes where a single main teacher was tested, with the test result seronegative. We do not show two classes with 3 main teachers tested because confidence intervals could not be estimated for single data points.
The seroprevalence of SARS-CoV-2 in June-September 2020 was low in children, parents and school personnel. The seroprevalence increased significantly by March-April 2021 in all three cohorts, with slightly higher seroprevalence in parents and children than in school personnel. The pattern of seroprevalence in the cohorts varied considerably within and between districts and school communities. We observed a two-fold variation in the ratio of seropositive children to the cumulative incidence of confirmed SARS-CoV-2 infections in districts. This highlights the drawbacks of relying on the PCR-confirmed SARS-CoV-2 infections to estimate the spread of SARS-CoV-2 – and further stresses the importance of representative population-based seroprevalence studies.
Children and parents had lower seroprevalence in families with children in the upper school level than in those with children in lower or middle school levels. In contrast, the seroprevalence of teachers in higher and middle school levels was similar, and it was slightly higher in the lower school level (table 2). All school personnel and children in the upper school level were consistently wearing masks from November 2020. In contrast, masks were not implemented in the lower school level and only for a few months in middle school level children [21]. As a result, masks could have contributed to preventing infection spread and thus lower seroprevalence of children in higher grades and, in turn, in their parents.
On the class level, the seroprevalence of children within classes in which a main teacher tested seropositive was on average higher compared to the classes with a seronegative teacher. However, the difference in the proportion of seropositive children in such classes was not large (27% vs 18%). In contrast, the differences in proportions of seropositive children in families with 0, 1 and 2 seropositive parents were much larger (9% vs 20% vs 76%). The higher "parent-child" than "teacher-child" concordance likely reflects the type and duration of contact in families and classrooms. This finding is consistent with studies relying on contact tracing information and reporting higher secondary attack rates in families than in schools [4, 22, 23]. A lack of clear strong association between children’s and teachers’ serological status within classes would be expected if the majority of infections in the classrooms – in both children and their teachers – were sporadic, independent of each other and not a result of class outbreaks. Previous results of our study suggested that the majority of SARS-CoV-2 infections in school children were indeed not part of class clusters [14, 21]. However, this association is likely to change as more-transmissible SARS-CoV-2 variants become prevalent.
This study presents unique combined results of children, their parents and teachers from the same school communities and districts and adds to our understanding of infection chains in schools and families, which are often undetected. However, it has several limitations. First, although the schools and classes were randomly sampled to be invited, children participating within classes (approximately 50%) might have been somewhat (self) selected. Similarly, participating parents and teachers might have been somewhat different from those who chose not to participate. For example, parents were more likely to attend testing in March-April 2021 if their child reported symptoms in 2020–2021 (at least one parent of 52% asymptomatic and 67% symptomatic children participated), although participation was reassuringly not different in the parents of seropositive and seronegative children. Potential selection bias, the partly non-nested structure of cohorts (in cases of parents with several tested children and teachers present in multiple classes), and the inability to adjust for false positive and negative individual serological results also precluded elaborate modelling of associations between serological results of the three cohorts, beyond simple logistic regression models of each cohort separately. Second, although serological tests have the advantage of capturing all previous rather than only the actual or diagnosed SARS-CoV-2 infections, temporal and directional associations cannot be deduced. A positive serological test result could reflect infection of up to a year ago, although antibodies are subject to some waning [24]. Thus, for example, we could not deduce whether a parent or a child was infected first in the family. Finally, the study was conducted when the delta and omicron variants of SARS-CoV-2 were not yet prevalent in Switzerland. Due to their higher infectiousness, the associations of seroprevalence within families and classes might be different beyond the timeframe of this study.
In conclusion, we observed similar seroprevalence in children and parents, and somewhat lower seroprevalence in school personnel, in March-April 2021 in Zürich, Switzerland, and striking variation in seroprevalence between districts and school communities. Children’s seroprevalence was higher in classes with infected main teachers and in families with one or two infected parents. The trends in class and school community seroprevalence should be interpreted in the context of SARS-CoV-2 infection spread in the community more generally.
Data is still being collected for the longitudinal cohort study Ciao Corona. On study completion in 2023, deidentified and potentially aggregated participant data, together with required data dictionaries, will be available on reasonable request by email to the corresponding author. The purpose and methods of data analysis will be evaluated by the study team first to ensure that it complies with the ethics approval.
We would like to thank all participating children, parents and school personnel. We would like to thank Priska Ammann for organising the March-April 2021 testing round of the study and Ruedi Jung for providing summary information on school and public preventive measures in Switzerland.
This study is part of Corona Immunitas research network, coordinated by the Swiss School of Public Health (SSPH+), and funded by fundraising of SSPH+ that includes funds of the Swiss Federal Office of Public Health and private funders (ethical guidelines for funding stated by SSPH+ will be respected), by funds of the Cantons of Switzerland (Vaud, Zürich and Basel) and by institutional funds of the Universities. Additional funding specific to this study is available from the University of Zürich Foundation.
All authors have completed and submitted the International Committee of Medical Journal Editors form for disclosure of potential conflicts of interest. No potential conflict of interest was disclosed.
1. Ismail SA , Saliba V , Lopez Bernal J , Ramsay ME , Ladhani SN . SARS-CoV-2 infection and transmission in educational settings: a prospective, cross-sectional analysis of infection clusters and outbreaks in England [Internet]. Lancet Infect Dis. 2021 Mar;21(3):344–53. Available from: https://www.thelancet.com/journals/laninf/article/PIIS1473-3099(20)30882-3/fulltext https://doi.org/10.1016/S1473-3099(20)30882-3
2. Viner RM , Russell SJ , Croker H , Packer J , Ward J , Stansfield C , et al. School closure and management practices during coronavirus outbreaks including COVID-19: a rapid systematic review [Internet]. Vol. 4, The Lancet Child and Adolescent Health. Elsevier B.V.; 2020. p. 397–404. Available from: https://www.thelancet.com/journals/lanchi/article/PIIS2352-4642(20)30095-X/fulltext
3. Armann JP , Kirsten C , Galow L , Kahre E , Haag L , Dalpke A , et al. SARS-CoV-2 transmissions in students and teachers: seroprevalence follow-up study in a German secondary school in November and December 2020 [Internet]. BMJ Paediatr Open. 2021 Mar;5(1):e001036. Available from: https://bmjopen.bmj.com/content/11/6/e049876 https://doi.org/10.1136/bmjpo-2021-001036
4. Zimmerman KO , Akinboyo IC , Brookhart MA , Boutzoukas AE , McGann KA , Smith MJ , et al.; ABC SCIENCE COLLABORATIVE . Incidence and Secondary Transmission of SARS-CoV-2 Infections in Schools [Internet]. Pediatrics. 2021 Apr;147(4):e2020048090. Available from: https://publications.aap.org/pediatrics/article/147/4/e2020048090/180871/Incidence-and-Secondary-Transmission-of-SARS-CoV-2 https://doi.org/10.1542/peds.2020-048090
5. Liguoro I , Pilotto C , Bonanni M , Ferrari ME , Pusiol A , Nocerino A , et al. SARS-COV-2 infection in children and newborns: a systematic review [Internet]. Eur J Pediatr. 2020 Jul;179(7):1029–46. [cited 2022 Apr 7] Available from: https://link.springer.com/article/10.1007/s00431-020-03684-7 https://doi.org/10.1007/s00431-020-03684-7
6. Chung E , Chow EJ , Wilcox NC , Burstein R , Brandstetter E , Han PD , et al. Comparison of Symptoms and RNA Levels in Children and Adults With SARS-CoV-2 Infection in the Community Setting [Internet]. JAMA Pediatr. 2021 Oct;175(10):e212025–212025. [cited 2022 Apr 7] Available from: https://jamanetwork.com/journals/jamapediatrics/fullarticle/2780963 https://doi.org/10.1001/jamapediatrics.2021.2025
7. Viner RM , Mytton OT , Bonell C , Melendez-Torres GJ , Ward J , Hudson L , et al. Susceptibility to SARS-CoV-2 Infection Among Children and Adolescents Compared With Adults. JAMA Pediatr [Internet]. 2020 Sep 25 [cited 2020 Oct 4]; Available from: https://jamanetwork.com/journals/jamapediatrics/fullarticle/2771181
8. Davies NG , Klepac P , Liu Y , Prem K , Jit M , Eggo RM ; CMMID COVID-19 working group . Age-dependent effects in the transmission and control of COVID-19 epidemics [Internet]. Nat Med. 2020 Aug;26(8):1205–11. [cited 2021 Jul 6] https://doi.org/10.1038/s41591-020-0962-9
9. Roser M , Ritchie H , Ortiz-Ospina E , Hasell J . Coronavirus Pandemic (COVID-19) [Internet]. Published online at OurWorldInData.org. 2020 [cited 2021 Jul 1]. Available from: https://ourworldindata.org/coronavirus
10. UNESCO . School closures caused by Coronavirus (Covid-19) [Internet]. 2020 [cited 2020 Dec 19]. Available from: https://en.unesco.org/covid19/educationresponse
11. Theuring S , Thielecke M , van Loon W , Hommes F , Hülso C , von der Haar A , et al.; BECOSS Study Group . SARS-CoV-2 infection and transmission in school settings during the second COVID-19 wave: a cross-sectional study, Berlin, Germany, November 2020 [Internet]. Euro Surveill. 2021 Aug;26(34): Available from: https://pubmed.ncbi.nlm.nih.gov/34448448/ https://doi.org/10.2807/1560-7917.ES.2021.26.34.2100184
12. Meuris C , Kremer C , Geerinck A , Locquet M , Bruyère O , Defêche J , et al. Transmission of SARS-CoV-2 After COVID-19 Screening and Mitigation Measures for Primary School Children Attending School in Liège, Belgium [Internet]. JAMA Netw Open. 2021 Oct;4(10):e2128757. Available from: https://jamanetwork.com/journals/jamanetworkopen/fullarticle/2784812 https://doi.org/10.1001/jamanetworkopen.2021.28757
13. Ulyte A , Radtke T , Abela IA , Haile SR , Braun J , Jung R , et al. Seroprevalence and immunity of SARS-CoV-2 infection in children and adolescents in schools in Switzerland: design for a longitudinal, school-based prospective cohort study [Internet]. Int J Public Health. 2020 Dec;65(9):1549–57. Available from: https://pubmed.ncbi.nlm.nih.gov/33063141/ https://doi.org/10.1007/s00038-020-01495-z
14. Ulyte A , Radtke T , Abela IA , Haile SR , Berger C , Huber M , et al. Clustering and longitudinal change in SARS-CoV-2 seroprevalence in school children in the canton of Zurich, Switzerland: prospective cohort study of 55 schools [Internet]. BMJ. 2021 Mar;372:n616. https://doi.org/10.1136/bmj.n616
15. Fenwick C , Croxatto A , Coste AT , Pojer F , André C , Pellaton C , et al. Changes in SARS-CoV-2 Spike versus Nucleoprotein Antibody Responses Impact the Estimates of Infections in Population-Based Seroprevalence Studies. J Virol [Internet]. 2020; Available from: https://journals.asm.org/doi/10.1128/JVI.01828-20
16. Puhan MA , Chiolero A , Fehr J , Cullati S . Overcoming spectrum bias for accurate SARS-CoV-2 seroprevalence estimates [Internet]. Vol. 373, The BMJ. BMJ Publishing Group; 2021. Available from: https://www.bmj.com/content/372/bmj.n561/rr
17. Rogan WJ , Gladen B . Estimating prevalence from the results of a screening test [Internet]. Am J Epidemiol. 1978 Jan;107(1):71–6. Available from: https://pubmed.ncbi.nlm.nih.gov/623091/ https://doi.org/10.1093/oxfordjournals.aje.a112510
18. Henrion MY . bootComb—an R package to derive confidence intervals for combinations of independent parameter estimates [Internet]. Int J Epidemiol. 2021 Aug;50(4):1071–6. Available from: https://academic.oup.com/ije/article/50/4/1071/6278063 https://doi.org/10.1093/ije/dyab049
19. R Core Team . R: A language and environment for statistical computing. R Foundation for Statistical Computing, Vienna, Austria. [Internet]. 2020 [cited 2020 Dec 17]. Available from: https://www.r-project.org/
20. Canton of Zurich . Numbers and Facts on COVID-19 [Kanton Zürich. Zahlen & Fakten zu COVID-19] [Internet]. [cited 2021 Jul 14]. Available from: https://www.zh.ch/de/gesundheit/coronavirus/zahlen-fakten-covid-19.html?keyword=covid19#/home
21. Ulyte A , Radtke T , Abela IA , Haile SR , Ammann P , Berger C , et al. Evolution of SARS-CoV-2 seroprevalence and clusters in school children from June 2020 to April 2021: prospective cohort study Ciao Corona [Internet]. Swiss Med Wkly. 2021 Nov;151(45–46):w30092. Available from: https://smw.ch/article/doi/smw.2021.w30092
22. Madewell ZJ , Yang Y , Longini IM Jr , Halloran ME , Dean NE . Household Transmission of SARS-CoV-2: A Systematic Review and Meta-analysis [Internet]. JAMA Netw Open. 2020 Dec;3(12):e2031756. [cited 2020 Dec 23] Available from: https://jamanetwork.com/journals/jamanetworkopen/fullarticle/2774102 https://doi.org/10.1001/jamanetworkopen.2020.31756
23. Macartney K , Quinn HE , Pillsbury AJ , Koirala A , Deng L , Winkler N , et al. Transmission of SARS-CoV-2 in Australian educational settings: a prospective cohort study. Lancet Child Adolesc Heal [Internet]. 2020 Aug [cited 2020 Aug 30];4(11):807–16. Available from: www.thelancet.com/child-adolescent
24. Dan JM , Mateus J , Kato Y , Hastie KM , Yu ED , Faliti CE , et al. Immunological memory to SARS-CoV-2 assessed for up to 8 months after infection. Science (80-) [Internet]. 2021 Feb 5;371(6529). Available from: https://doi.org/https://doi.org/10.1126/science.abf4063
This appendix incorporates in the analysis of the participant cohorts also the results of vaccinated and potentially vaccinated parents and school personnel.
By April 2021 in Switzerland, persons over 50 years as well as some high-risk populations were eligible for SARS-CoV-2 vaccination. At the time of testing in 2021, approximately 8% of parents and 3% of school personnel were vaccinated against SARS-CoV-2. In interpreting their serological results, we considered self-reported vaccination status and detection of IgG against SARS-CoV-2 antigen N (N-IgG).
Participating adults negative for S-IgG and IgA were considered seronegative. Adults positive for S-IgG or IgA and positive for N-IgG were considered seropositive due to infection regardless of vaccination status. Vaccinated adults positive for S-IgG or IgA and negative for N-IgG were considered seropositive due to vaccination only, and further analysed as seronegative. We removed participants with both uncertain vaccination information and negative N-IgG from analysis (3 school personnel and 7 parents). In this appendix, we further refer to as “seropositive” only persons with positive serology due to SARS-CoV-2 infection.
Table S1 describes the characteristics of the participants.
Table S1Characteristics of the children, school personnel and parent participant cohorts.
| March-April 2021 | |
| Children | 2450 |
| N seropositive | 496 |
| Age (median [range]) | 12 [7–17] |
| Sex (female (%)) | 1279 (52%) |
| School personnel | 1604 |
| N seropositive | 259 |
| Age (median [range]) | 45 [15–77] |
| Sex (female (%)) | 1215 (76%) |
| Parents | 1714 |
| N seropositive | 347 |
| Age (median [range]) | 46 [29–71] |
| Sex (female (%)) | 992 (58%) |
In March-April 2021, the adjusted seroprevalence was 18.1% (15.7–20.7%) among children, 15.0% (12.4–17.7%) among school personnel, and 19.3% (16.6–22.1%) among parents. The adjusted seroprevalence in the cantonal districts is shown in figure S1A, along with the cumulative incidence of confirmed SARS-CoV-2 infections. The relationship between the seroprevalence of the three cohorts within districts and school communities was not consistent.
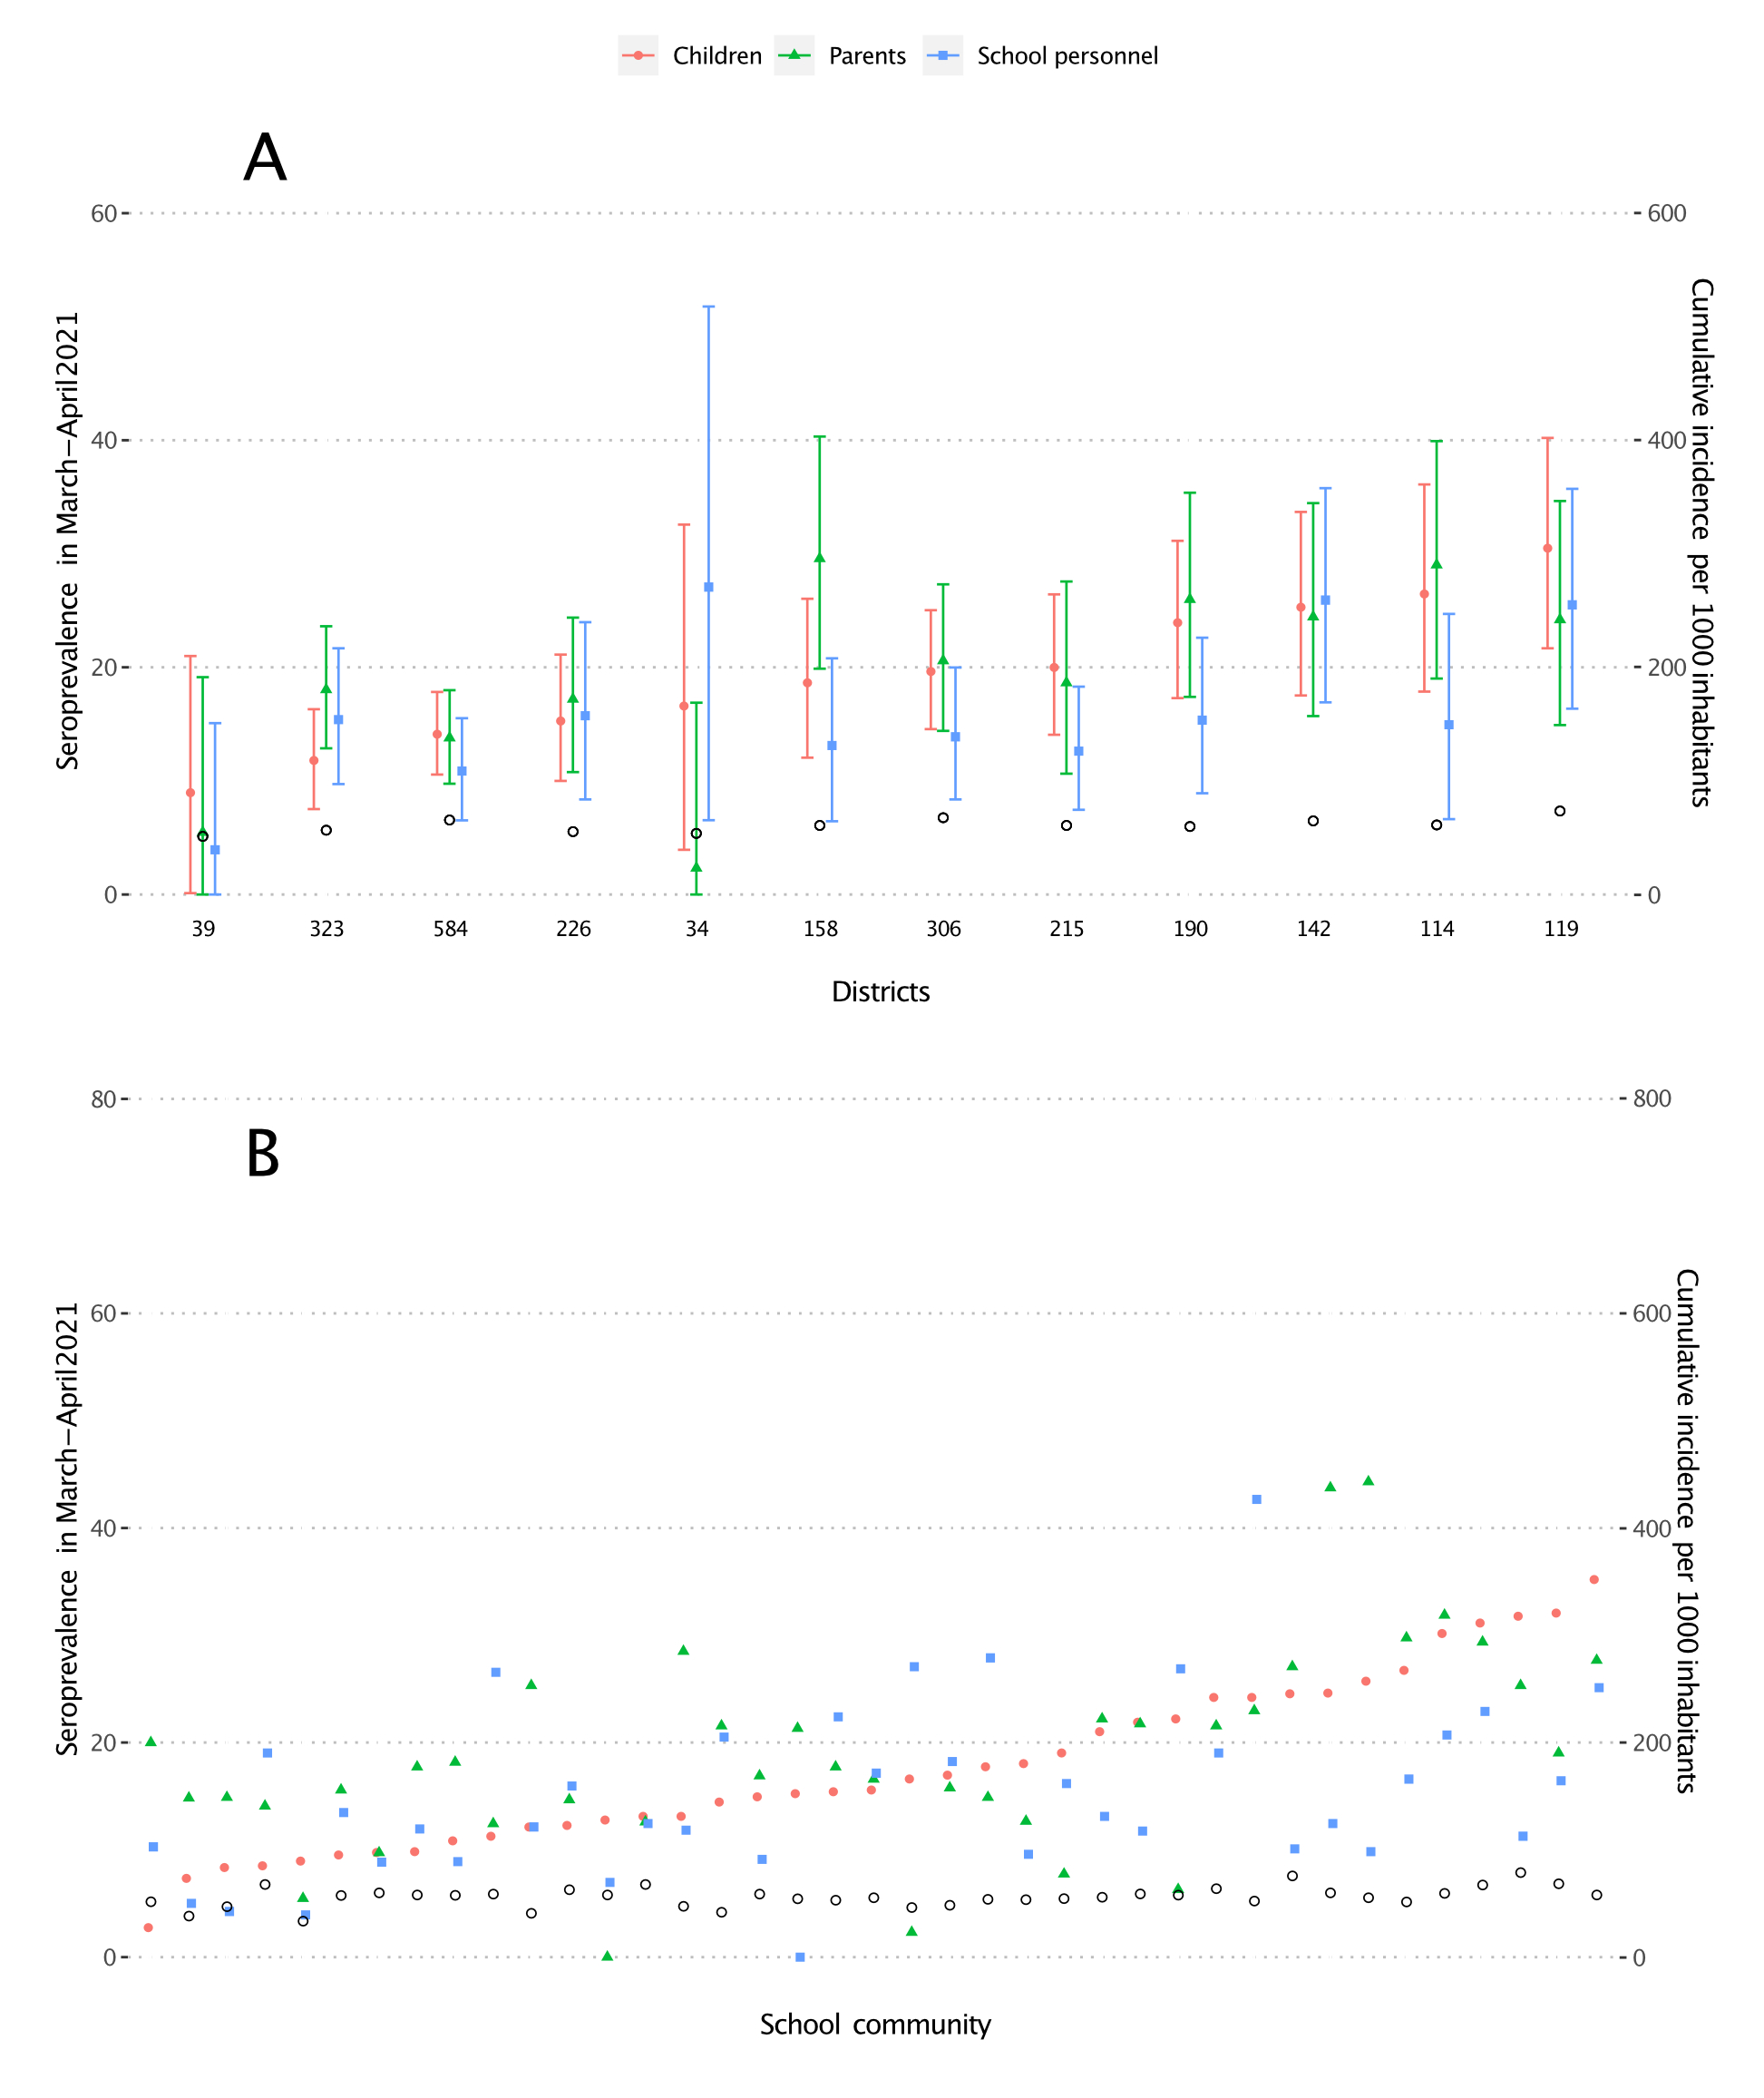
Figure S1 Seroprevalence in children, parents and school personnel and cumulative incidence of the population in the canton of Zurich, Switzerland, in March-April 2021.
A – within the cantonal districts, B – within school communities
Empty black circles represent cumulative incidence of laboratory-confirmed SARS-CoV-2 infections among inhabitants of a district. At the bottom of figure 1A are numbers of children tested within the district. Districts and school communities are ranked by increasing seroprevalence in children.
Median difference between parent and children seroprevalence in districts was 0% (interquartile range (IQR) –1.9% to 1.7%), and between school personnel and children –5.0% (IQR –6.2% to 0.5%).
Median difference between parent and children seroprevalence in school communities was 1.1% (IQR –2.7% to 6.3%), and between school personnel and children –2.3% (IQR –8.9% to 3.8%).
No sex differences were observed in the seroprevalence within cohorts (table S2). There were no differences in seroprevalence of children with tested and non-tested parents (18.5% vs 17.8%). Teachers and canteen personnel were seropositive most frequently (16.1%, n = 1247, and 15.4%, n = 97), followed by cleaning personnel (11.9%, n = 84) and school administration (9.2%, n = 152). Children and parents with children in upper school level had lower seroprevalence.
Table S2Seroprevalence with 95% confidence interval [number of participants] in children, parents and school personnel based on sex and school level in March-April 2021.
| n | Children | n | Parents a | n | School personnel b | ||
| Seroprevalence | Seroprevalence | Seroprevalence | |||||
| Sex | Female | 1279 | 18.2% (15.3–21.3) | 992 | 19.8% (16.6–23.2) | 1215 | 14.9% (12.1–17.8) |
| Male | 1165 | 18.1% (15.1–21.2) | 708 | 18.7% (15.1–22.4) | 385 | 15.5% (11.2–20.1) | |
| School level | Lower | 768 | 18.1% (14.7–21.7) | 711 | 21.0% (17.4–24.9) | 240 | 19.0% (13.5–25.1) |
| Middle | 845 | 20.3% (16.9–23.9) | 660 | 21.5% (17.7–25.5) | 193 | 16.0% (10.2–22.4) | |
| Upper | 837 | 16.0% (12.7–19.3) | 448 | 15.9% (11.8–20.2) | 245 | 17.3% (12.0–23.1) | |
a Parents with tested children in several school levels are included in all relevant groups.
b Only class teachers are included in the estimates stratified by school level. Teachers in several school levels are included in all relevant groups. Seroprevalence in non-teaching school personnel was 13.5% (10.5–16.5) [n = 983].
In 141 classes, at least 4 children and at least 25% of the class children as well as at least one main teacher were tested. Classes with seropositive main teachers had higher proportion of seropositive children (figure S2A). At least one parent was tested for 1202 (49%) of the tested children, and two parents for 674 (28%) of the tested children. Children with two seropositive parents were the most likely to be seropositive, followed by children with a single seropositive parent (figure S2B).
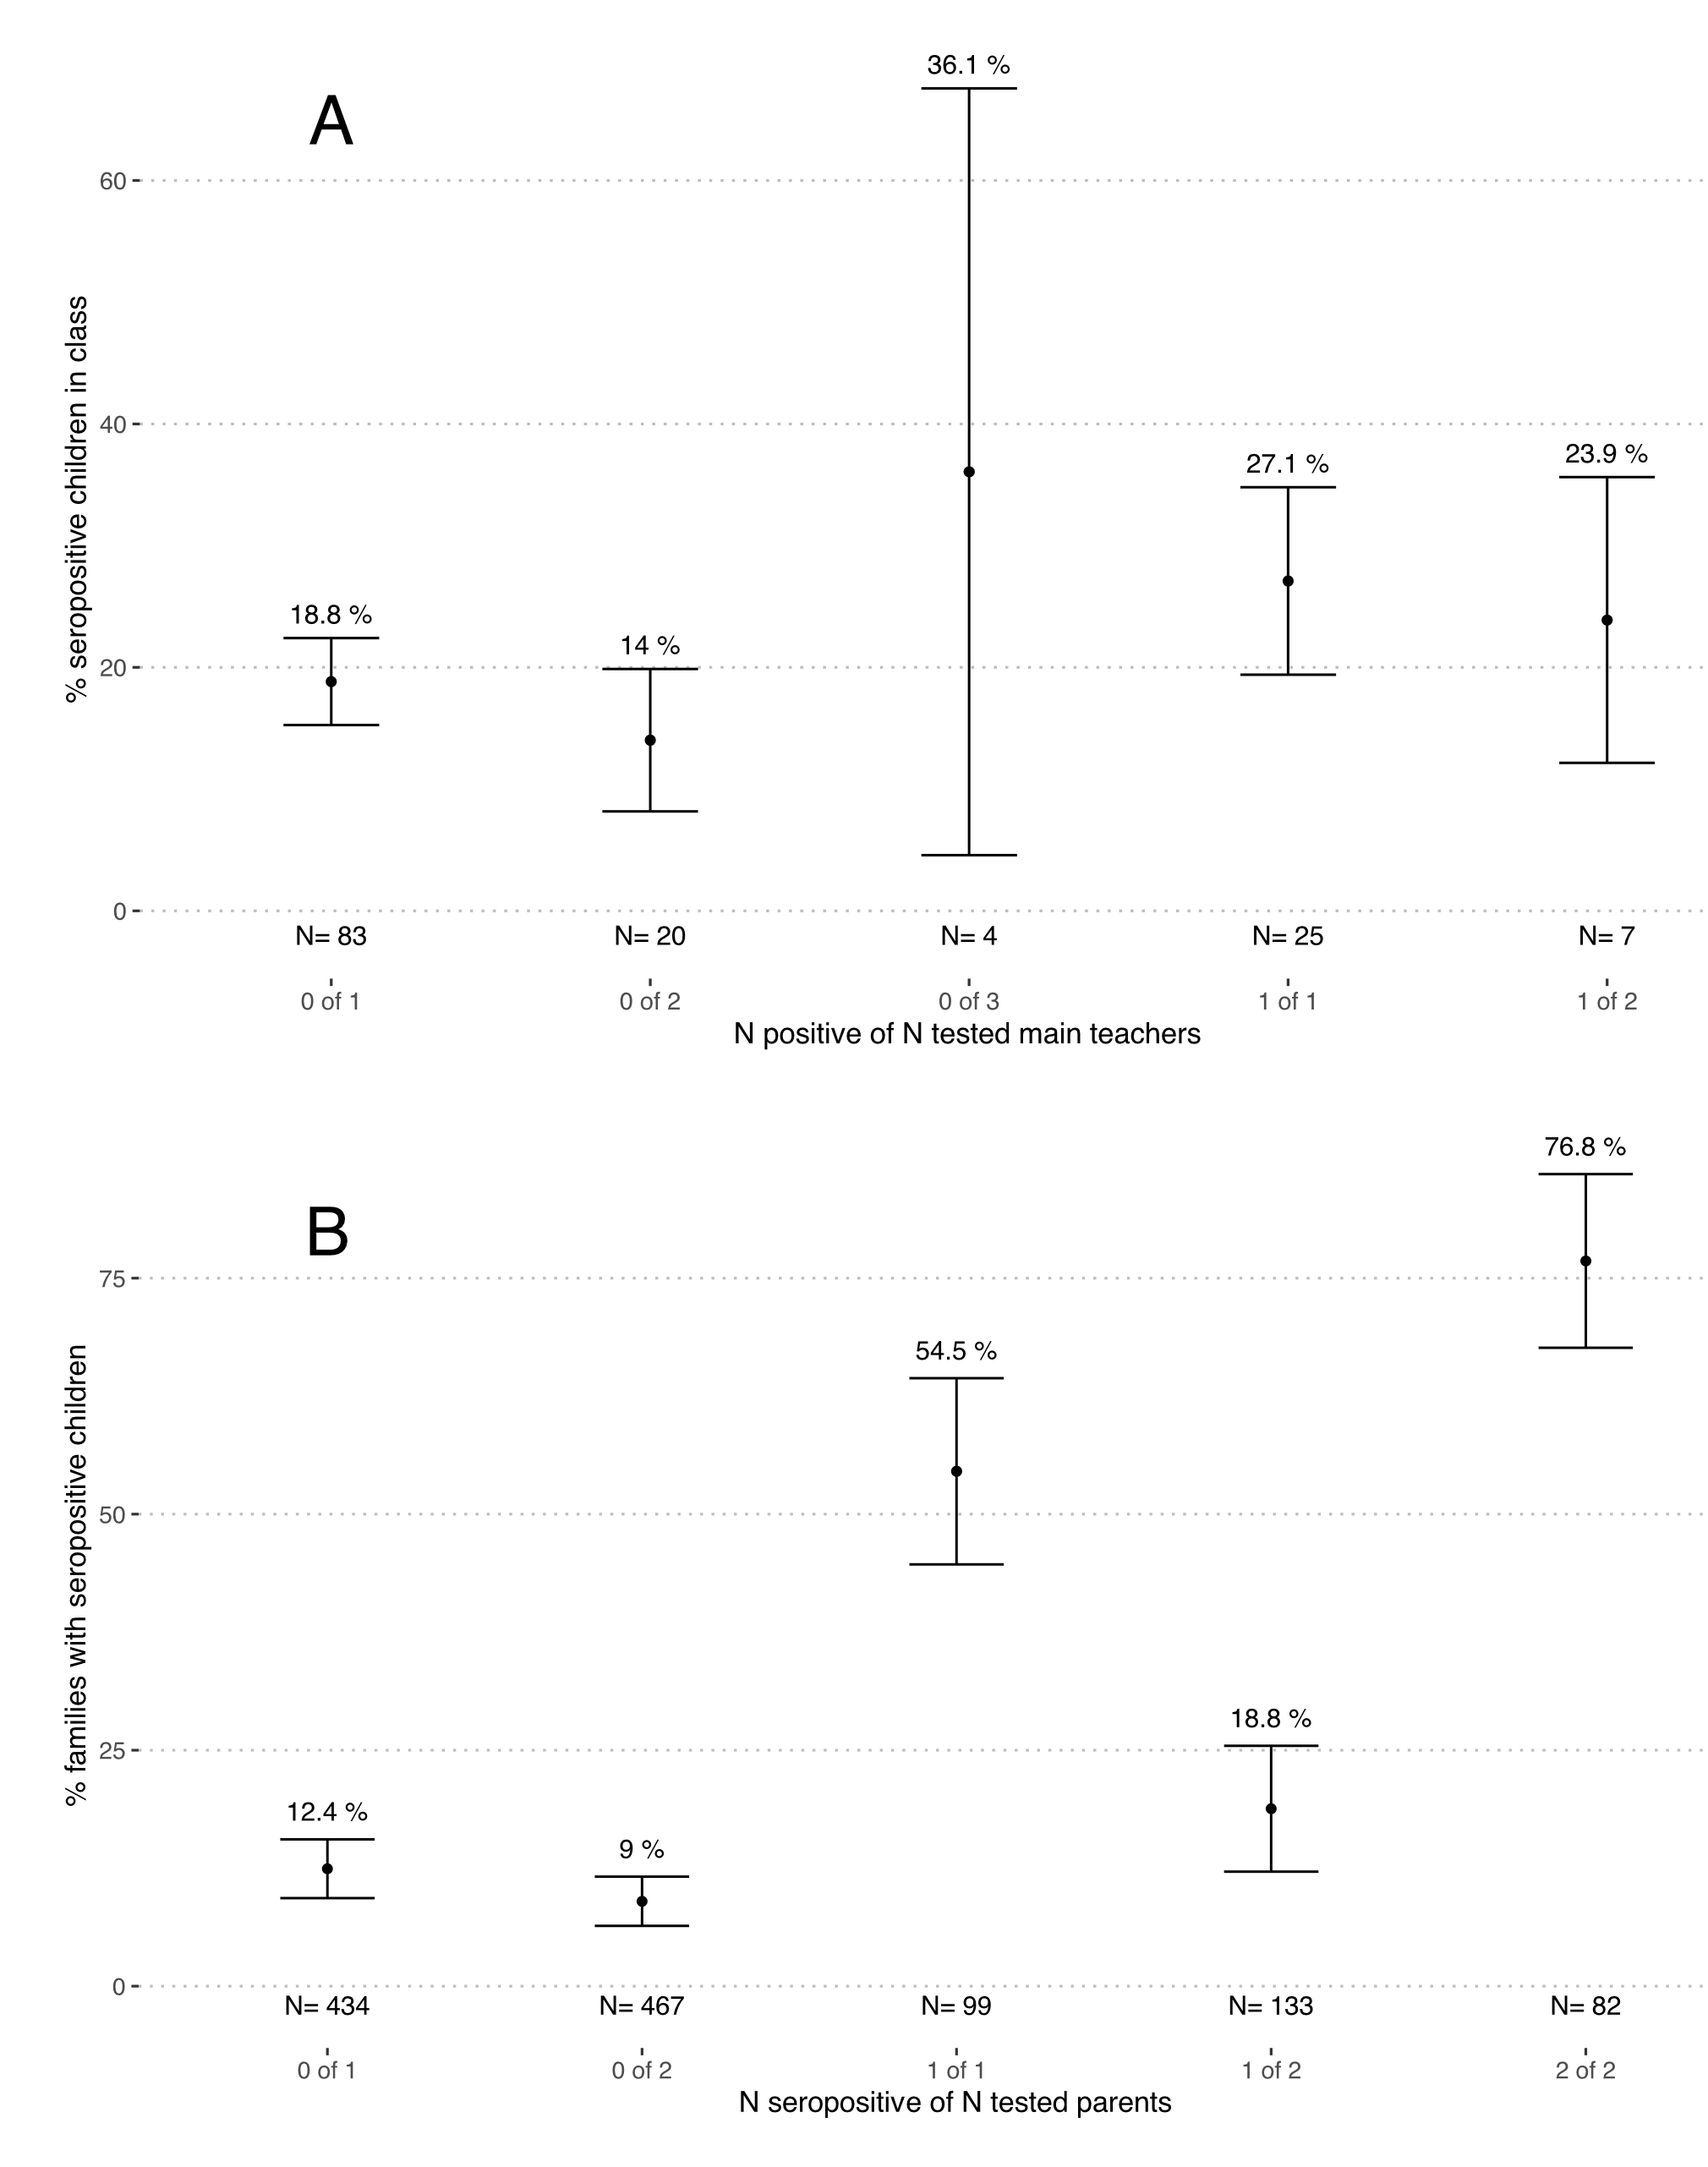
Figure S2 Proportion of seropositive children in classes and families depending on the number of tested and seropositive main teachers and parents in March-April 2021.
A – classes with at least one main teacher and 4 children tested. Numbers (N) below graphs correspond to the numbers of classes in the category.
B – families with at least one child and one parent tested. Numbers (N) below graphs correspond to the numbers of families in the category.
Note: the name of the category, written in grey below the number of classes or families tested,written in grey below the number of classes or families tested, tells how many teachers (parents) were tested in a class (family) from the total tested within that class (family). E.g., “0 of 1” signifies classes where a single main teacher was tested, with test result seronegative. We do not show two classes with 3 main teachers tested, as confidence intervals could not be estimated for single data points.
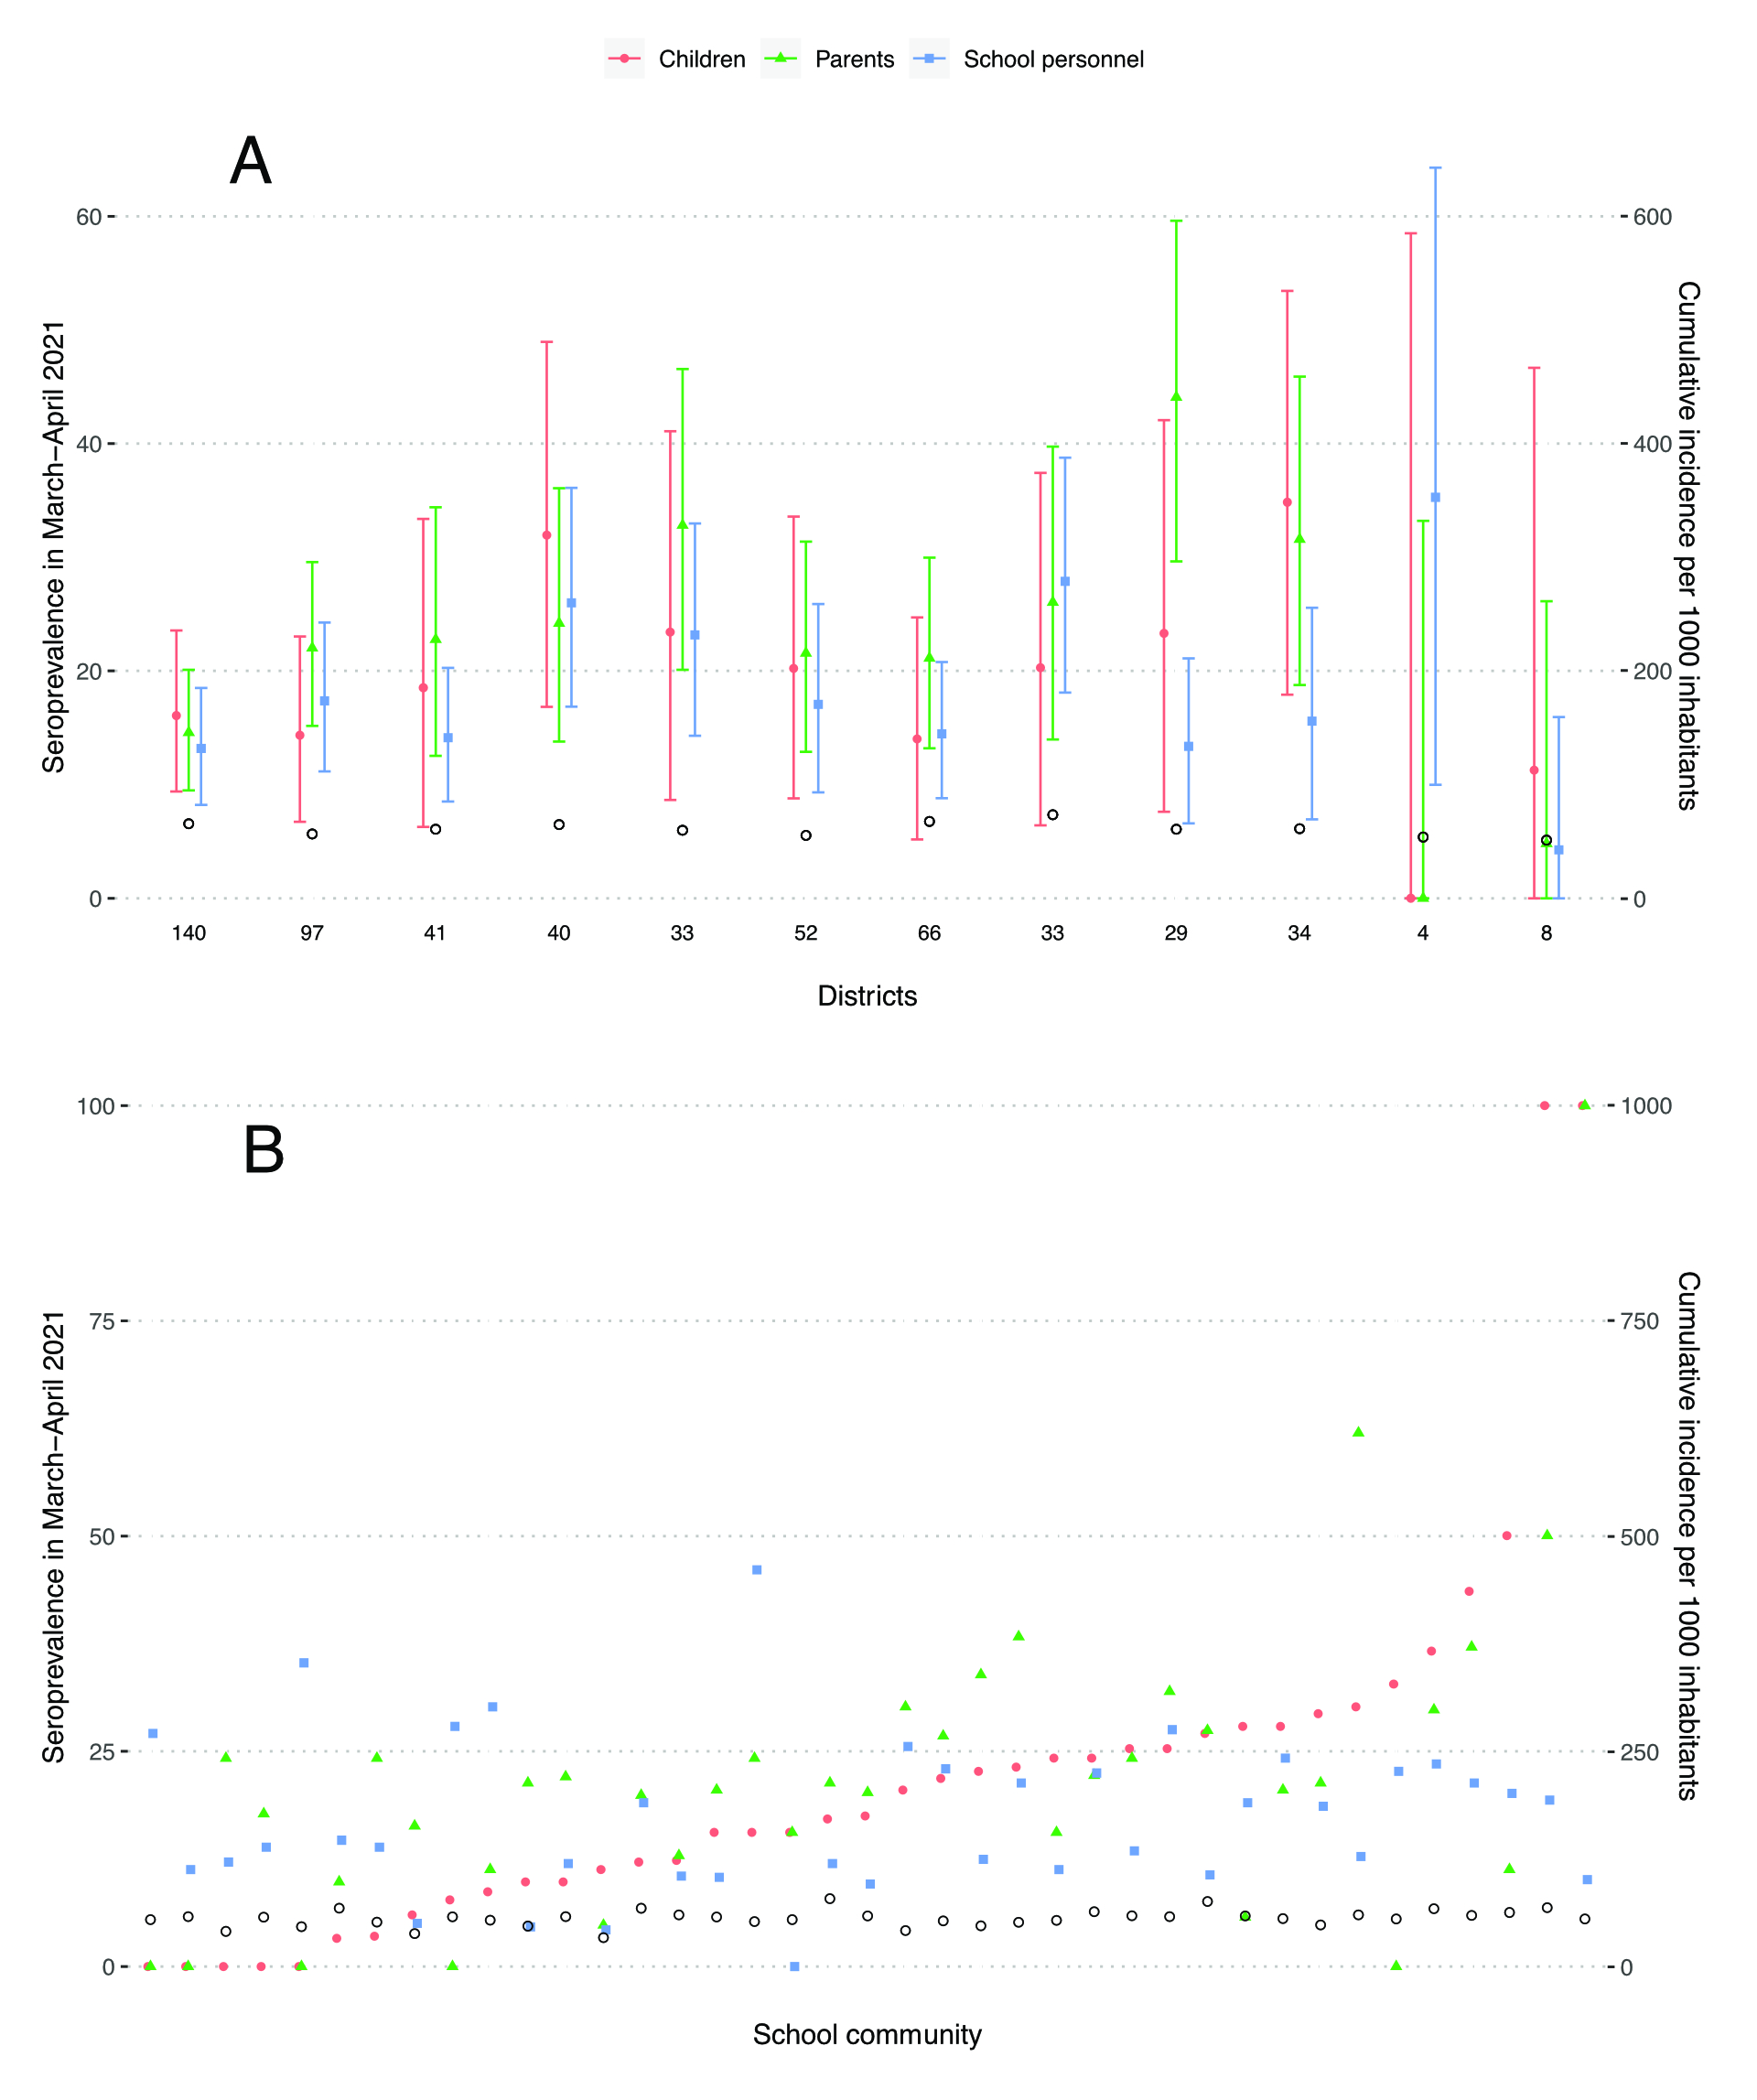
Figure S3 Seroprevalence in children, parents and school personnel and cumulative incidence of the population in the canton of Zurich, Switzerland, in March-April 2021. Only children and parents from families in which both parents were tested are included.
A – within the cantonal districts, B – within school communities
Empty black circles represent cumulative incidence of laboratory-confirmed SARS-CoV-2 infections among inhabitants of the district. At the bottom of figure 1A are numbers of children tested within the district. Districts and school communities are ordered by increasing seroprevalence in children.
Median difference between parent and children seroprevalence in districts was 2.8% (interquartile range (IQR) –1.9% to 7.3%), and between school personnel and children –3.0% (IQR –6.2% to 1.1%).
Median difference between parent and children seroprevalence in school communities was 0.6% (interquartile range (IQR) –6.4% to 9.1%), and between school personnel and children –3.7% (IQR –11.3% to 8.6%).
Table S3Multivariable logistic regression models for individual children, parents’ and class teachers’ serological results in March-April 2021.
| Children | Parents | Class teachers | ||
| n | 2450 | 1384 | 520 | |
| Odds ratio (95% confidence interval) | ||||
| Sex (female vs male) | 1.01 (0.82–1.23) | 1.08 (0.82–1.43) | 0.99 (0.60–1.68) | |
| Age (years)a | – | 1.01 (0.98–1.04) | 1.00 (0.99–1.02) | |
| School level | Upper | Reference | Reference | Reference |
| Middle | 1.29 (1.01–1.65) | 1.24 (0.88–1.75) | 0.91 (0.51–1.58) | |
| Lower | 1.15 (0.89–1.49) | 1.24 (0.87–1.78) | 1.25 (0.75–2.11) | |
| District cumulative incidence of diagnosed SARS-CoV-2 infections, per 1000 inhabitants | 1.03 (1.01–1.05) | 1.01 (0.99–1.04) | 1.01 (0.97–1.05) | |
a Age is not included in the model of children’s result, as it is highly correlated with school level.
Parents and class teachers assigned to multiple school levels are excluded from the models.
Table S4Seroprevalence with 95% confidence interval in children, parents and school personnel based on sex and school level in June-September 2020.
| n | Children | n | Parents a | n | School personnel b | ||
| Seroprevalence | Seroprevalence | Seroprevalence | |||||
| Sex | Female | 1270 | 4.9% (2.5–7.1%) | 1132 | 6.1% (3.5–8.5%) | 1214 | 4.3% (1.9–6.5%) |
| Male | 1197 | 3.8% (1.4–5.9%) | 902 | 5.6% (2.9–8.0%) | 389 | 5.5% (2.2–8.9%) | |
| School levelc | Primary school | 1563 | 4.2% (1.8–6.2%) | 1629 | 6.5% (4.0–8.6%) | 989 | 4.2% (1.7–6.5%) |
| Lower | 700 | 2.9% (0.5–5.2%) | 793 | 5.9% (3.2–8.6%) | |||
| Middle | 863 | 5.2% (2.5–7.6%) | 836 | 7.0% (4.2–9.6%) | |||
| Secondary school: upper | 910 | 4.7% (2.1–7.1%) | 646 | 4.9% (2.1–7.6%) | 620 | 5.4% (2.5–8.1%) | |
a Parents with tested children in several school levels are included in all relevant groups.
b Teaching personnel both in primary and secondary schools are included in both groups.
c Primary school includes lower and middle school levels; secondary school includes upper school level. For school personnel, school level information within primary school (lower or middle school level) was not available for June-September 2020 testing round.