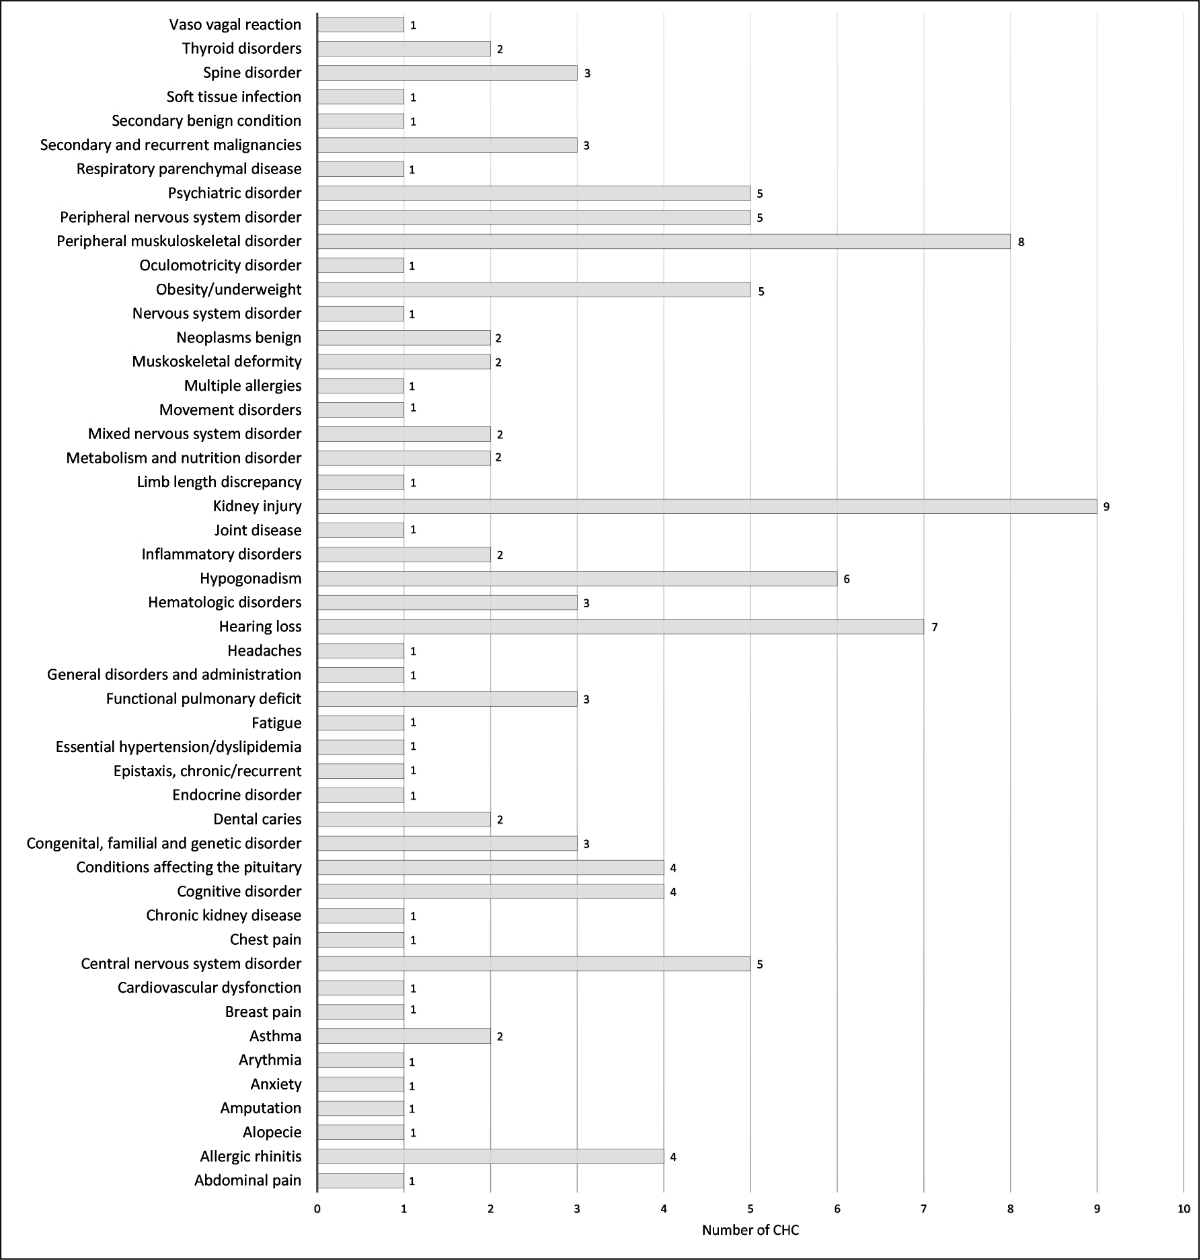
Figure 1 Total number of chronic health conditions detected for each specific condition (n = 118).
DOI: https://doi.org/10.4414/SMW.2022.w30153
The improved management of paediatric cancer and advancements in oncological treatments has led to the five-year survival rate currently standing at over 85% [1–3]. These statistics are largely explained by the advancement in therapeutic and care management compared with the 1960s when less than one third of children with cancer diseases survived 5 years after diagnosis [4, 5]. Due to this higher survival rate, the number of childhood cancer survivors reaching adulthood is increasing. In Switzerland, almost 5,000 survivors are currently included in the Swiss Childhood Cancer Registry (personal communication, September 2020).
However, about two thirds of these childhood cancer survivors will experience long-term complications from their cancer treatments, and one third of these complications will be considered severe [6, 7]. Furthermore, the paediatric cancer survivor population has an eleven times higher mortality compared to the general population for at least 30 years after diagnosis [8, 9]. More specifically, Schindler et al. have identified cardiovascular, respiratory diseases, and secondary tumours as the three major contributors to this late mortality [9], while Bhakta et al. noted that cardiovascular, endocrine, and musculoskeletal diseases were the three major providers of excess morbidity in this population [10]. The rate and pattern of this excess of morbidity and mortality were highly associated to primary diagnosis and cancer treatments as recently reviewed by Erdmann et al. [11]. These latest findings underline the importance of setting up a system of long-term, multidisciplinary, structured and adapted medical follow-up to provide an early detection and management of later toxicities [12].
In this context, the University Hospitals of Geneva (HUG) set up a structured and multidisciplinary long-term follow-up (LTFU) program for childhood cancer survivors in 2015. This program aims to include all patients who had been treated by chemotherapy and/or radiotherapy as soon as the oncological follow-up is completed, generally starting from the fifth or sixth year after the end of treatment. This starts in paediatrics and is then continues in adult oncology service from the age of 21 years. The proposed follow-up consists of an annual consultation and the creation of a specific plan adapted to each patient according to their medical history. The risk-based surveillance is determined for each patient, depending on primary diagnosis, complications presented, and treatments received in accordance with the Children’s Oncology Group Long-Term Follow-Up guidelines [13]. Patients who have benefited from an allogenic hematopoietic stem cell transplant had specific follow-up carried out by the hematopoietic transplant team and were therefore not included in this LTFU program.
This study had two components. The first part, the “LTFU outcome study”, was a quantitative analysis of this cohort of patients to give an overview of the follow-up procedures as well as the chronic health conditions (CHCs) presented, regardless of their origin, whether or not related to the oncological disease and its treatments. Then we conducted a “satisfaction survey” which evaluated the patients and/or the parents’ satisfaction with the LTFU program.
The LTFU study is a monocentric retrospective study. All patients who were followed for one cancer during childhood and who had data at least 5 years after treatment initiation and who were included in the LTFU program were eligible. Then, all patients and parents of minors were invited to complete the satisfaction survey. Written consent was required for participation in the LTFU program, but no further written consent was required to participate to the satisfaction survey, which remained anonymous. The study was approved by the Cantonal Research Ethics Committee of Geneva (2019-00211).
Demographic and medical data were extracted from each patient's computerized medical records. Intensity of treatment (ITR) was rated according to the ITR-3 scale, level 1 being the least intensive treatment and level 4 the most intensive one [14]. The data collected regarding the chronic health conditions and the follow-up in place were those obtained during last LTFU consultation. General health status and daily activities were assessed by the physician in charge of the patient and used the Karnofsky (>16 years) and Lansky (<16 years) scales [15, 16].
Chronic health conditions have been classified using the National Cancer Institute Common Terminology Criteria for Adverse Events (CTCAE) version 5.0 classification [17]: mild (grade 1), moderate (grade 2), severe or disabling (grade 3), life-threatening (grade 4), or death (grade 5). The grades for each chronic health condition were assigned by the physician in charge of patient follow-up. This is the same doctor for all patients included in our study. To better describe the chronic health conditions defined by organ damage (organ system), these were grouped into 48 different condition-specific categories according to the study by Bhakta et al. [10].
Three satisfaction questionnaires (available in the PDF version of this article), with identical question content, were adapted to the addressees: (1) parents of a minor patient, (2) minor patient (12–17 years old) and (3) adult patient (18 years old and over). For patients under 12 years of age, only the parents received a questionnaire, whereas for patients between 12 and 17 years of age, 2 questionnaires were sent (one for the parents and one for the patient). All questionnaires were completed anonymously.
Descriptive statistics were presented by their mean ±standard deviation (SD), median, and interquartile range for continuous variables, and by their frequencies and relative percentages for categorical variables. We compared the characteristics between participants and non-participants using either Chi-2 or Fischer’s exact tests for categorical variables and Student or Mann-Whitney tests for continuous variables. When we made comparisons of >2 groups, we used the appropriate tests, i.e. ANOVA or Kruskal-Wallis for continuous variables, and Chi-2 or Fischer’s exact tests for categorical variables. In the satisfaction survey, we explored if there were some differences between groups of respondents and self-assessment of health status and psychological health by using ordinal logistic regression models. Health status and psychological health were reported on an ordinary scale going from 1 (“I do not know”) to 6 (“excellent”) and we reported associations by odds ratios assorted by their 95% confidence intervals (95% CI), and p-values. All statistical analyses were performed using STATA 16.0 IC software (STATA Corp., College Station, TX, USA). All p-values <0.05 (two-sided) were considered as significant.
Since the creation of the LTFU program in 2015, we observed no deaths. Of 83 eligible patients, 51 (61.4%) accepted to participate in current study. Participant characteristics are presented in table 1 and supplementary table S1. The median age was 17.7 years (range: 10–35) years and 62.8% were male; these characteristics did not differ from those of non-participants. Treatment exposure is detailed in supplementary table S2. The period of diagnosis was from 01 November 1986 to 31 August 2014. Mean delay since end of treatment was 9.8 years (range: 4.5–31). Overall, 49 patients were treated in the Pediatric Onco-Hematology Unit of the HUG and 2 patients received treatment abroad.
Table 1Demographics of the participants in the LTFU outcome study.
| Participants (n = 51) | ||
| Sex | Male (%) | 32 (62.8%) |
| Female (%) | 19 (37.3%) | |
| Age at Censor | Mean (SD; median, interquartile range) | 17.4 (5.1; 17.7, 14.0–20.9) |
| Age at diagnosis (years) | Mean (SD) | 5.9 (4.0) |
| Median (interquartile range) | 5.0 (0.3–15.9) | |
| Years of survival after diagnosis | 4.5 to 10 years | 24 (47.1%) |
| 10 to 15 years | 14 (27.5%) | |
| 15 to 20 years | 10 (19.6%) | |
| 20 to 25 years | 2 (3.9%) | |
| 25 to 30 years | 0 (0%) | |
| ≥ 30 years | 1 (2.0%) | |
| Treatment era of the primary diagnosis | Before 1990 | 1 (2.0%) |
| 1991–2000 | 5 (9.8%) | |
| 2001–2010 | 32 (62.8%) | |
| 2011–2015 | 13 (25.5%) | |
| Primary cancer diagnosis | Leukaemia | 17 (33.3%) |
| Lymphoma | 9 (17.7%) | |
| Neuroblastoma | 6 (11.8%) | |
| Nephroblastoma | 6 (11.8%) | |
| Sarcoma | 5 (9.8%) | |
| CNS tumour | 6 (11.8%) | |
| Germ cell tumour | 1 (2.0%) | |
| Langerhans cell histiocytosis | 1 (2.0%) | |
| Extension (all diagnoses except leukaemia; n = 34) | Localized | 26 (76.5%) |
| Metastatic | 8 (23.5%) | |
| CNS stage (leukaemia; n = 17) | CNS 1 | 8 (47.1%) |
| CNS 2 | 8 (47.1%) | |
| CNS 3 | 1 (5.9%) | |
| Recurrence and secondary tumour | Recurrence* | 5 (9.8%) |
| Secondary tumour** | 2 (3.9%) | |
| Neither | 44 (86.3%) | |
* Two patients with optic pathway gliomas, 1 with gonadal yolk sac tumour and 1 with Hodgkin lymphoma had one recurrence; one patient with osteosarcoma had 3 recurrences.
** One Ewing sarcoma after osteosarcoma and one aneurysmal bone cyst after rhabdomyosarcoma.
Fifty (98%) participants had frequency of one visit per year. Only one patient was followed up once every 2 years on his/her request. The organ monitoring varied depending on the treatment received (supplementary table S3). For example, 92.2% of patients had endocrine and 80.4% had cardiac monitoring. Concerning the type of specific follow-up plan, 51 (100%) patients had at least one specialist consultation (other than the LTFU consultation), 39 (76.5%) had regular echocardiography, 22 (43.1%) had a radiological exam, 11 (21.6%) had a regular audiogram and 8 (15.7%) performed pulmonary functions. Moreover, 32 (62.7%) patients had additional types of follow-ups. In total, one patient had on average of 5.3 total specialist consultations and/or screening tests (SD 2.5, median 5, range 1 to 12). More specifically, patients had an average of 2.8 specialist consultations (SD 1.5, median 2, range 1 to 7). The types of follow-ups were different according to the ITR and primary diagnosis (supplementary figures S1 and S2). Mean number of total specialist consultations and/or screening tests differed significantly by diagnosis (p <0.03). The highest average was 8.0 (SD: 2.5), found in patients diagnosed with sarcoma. For other diagnoses, we found an average of 7.5 (SD: 3.5) for neuroblastoma; 6.0 for germ cell tumour; 5.8 (SD: 2.1) for CNS tumour; 5.2 (SD: 1.9) for lymphoma; 5.2 (SD: 1.7) for nephroblastoma and 3.9 (SD: 1.8) for leukaemia. The only patient diagnosed with Langerhans cell histiocytosis had 3 specialist consultations and/or screening tests. Mean number of specialist consultation and/or screening tests did not differ significantly by ITR (p = 0.14), although there was a trend towards an increase in the number of consultations and/or screening tests between ITR 1–2 and ITR 3–4 (ITR 1: 5.2 [SD: 1.7]; ITR 2: 4.6 [SD: 2.2]; ITR 3: 6.1 [SD: 2.7]; ITR 4: 7 [SD: 3.1]).
At last consultation, 16 (31.4%) patients had at least one somatic complaint and 7 (13.7%) had at least one psychological complaint. Regarding performance evaluation, 46 (90.2%) patients presented a 100% evaluation on the Karnofsky or Lansky scale, 1 (2.0%) at 90%, 2 (4.0%) at 80% and 2 (4.0%) at 70%. Additionally, 18 (35.3%) patients received one or more oral medication.
In this study population (n = 51), the prevalence of any chronic health condition was 82.3%, with 43.1% having 1 or 2 CHCs, and 39.2% having 3 or more CHCs. Cumulative incidence of Grade 1–4 CHCs was 118 for the 51 participants, with a mean of 2.3 (SD 1.9, median 2, range: 0 to 7) disorders per patient. Of 118 CHCs, grades 1 and 2 represented 86.4% (grade 1: 39.8%; grade 2: 46.6%) and more severe grades 3 and 4 CHCs represented 13.6% (grade 3: 12.7%; grade 4: 0.9%). The prevalence of having one or more CHCs of grade 3 or 4 was 25.5 %. The most frequently affected systems were neurological system (14.4%), musculoskeletal system (13.6%), endocrine system (9.3%) and renal system (9.3%) (table 2). The mean numbers of CHCs differed significantly by diagnosis (p <0.004). The extremes were represented by an average of 4.2 (SD: 1.6, median: 5) CHCs for patients diagnosed with sarcoma versus 1 CHC for the patient diagnosed with Langerhans cell histiocytosis. For the other diagnostics, the average number of CHCs were the following: leukaemia 1.1 (SD: 1.3, median: 1); lymphoma 2.0 (SD: 2.1, median: 1); neuroblastoma 3.3 (SD: 1.4, median: 3); nephroblastoma 2.3 (SD: 1.0, median: 2); germ cell tumour 3 (median: 3); CNS tumour 3.8 (SD: 2.2, median 4). The mean number of CHCs presented was not significantly different between the exposed vs non exposed groups with relation to alkylating agents, anthracycline, and radiation. There was a trend for an increasing mean number of CHCs between the ITR 1–2 (mean 1.9; SD: 1.6) and ITR 3–4 (mean 3.0; SD: 2.1) groups (p = 0.051).
Table 2Number of chronic health conditions by organ system according to the CTCAE grade scale.
| Organ system | Grade 1 | Grade 2 | Grade 3 | Grade 4 | Total (%) |
| Auditory system | 3 | 2 | 2 | 0 | 7 (5.9) |
| Cardiovascular system | 2 | 1 | 0 | 0 | 3 (2.5) |
| Congenital, familial and genetic system | 0 | 1 | 0 | 0 | 1 (0.8) |
| Endocrine system | 2 | 7 | 2 | 0 | 11 (9.3) |
| Gastrointestinal system | 1 | 4 | 0 | 0 | 5 (4.2) |
| General disorder | 2 | 0 | 0 | 0 | 2 (1.7) |
| Haematology system | 2 | 1 | 0 | 0 | 3 (2.5) |
| Immunology and infection system | 0 | 1 | 0 | 0 | 1 (0.8) |
| Musculoskeletal system | 8 | 6 | 2 | 0 | 16 (13.6) |
| Neurology system | 10 | 3 | 3 | 1 | 17 (14.4) |
| Others | 6 | 8 | 3 | 0 | 17 (14.4) |
| Psychiatric disorder | 0 | 3 | 0 | 0 | 3 (2.5) |
| Renal system | 10 | 1 | 0 | 0 | 11 (9.3) |
| Reproductive system | 1 | 5 | 0 | 0 | 6 (5.1) |
| Respiratory system | 0 | 8 | 1 | 0 | 9 (7.6) |
| Second neoplasm | 0 | 3 | 2 | 0 | 5 (4.2) |
| Skin | 0 | 1 | 0 | 0 | 1 (0.8) |
| Total | 47 | 55 | 15 | 1 | 118 (100) |
To have a better clinical description, chronic health conditions were grouped into condition-specific categories. The numbers of each specific condition are presented in figure 1. Their respective breakdown into grades 1–4 CTCAE is detailed in supplementary table S4. Of the 118 reported chronic health conditions, the most frequent specific conditions are kidney injury (7.6%), peripheral musculoskeletal disorder (6.8%), hearing loss (5.9%) and hypogonadism (5.1%). The chronic health condition specific conditions differed according to the diagnosis, for example 67% of patients cured of a neuroblastoma had hearing loss, 50% of patients with nephroblastoma had kidney injury, 60% of patients with sarcoma had peripheral musculoskeletal disorder and 83% of patients with CNS tumour had a CNS disorder (supplementary figures S3–S10).
Figure 1 Total number of chronic health conditions detected for each specific condition (n = 118).
Out of 118 questionnaires sent to 83 patients, we received in return a total of 82 (69.5%): 32 out of 35 (91.4%) from adult patients, 19 out of 35 (54.3%) from patients aged between 12 and 17 years, 19 out of 35 (54.3%) from parents of patients aged between 12 and 17 years, and 12 out of 13 (92.3%) from parents of patients under 12 years. There was no significant difference between responding patients (n = 51) and non-participants (n = 32) in terms of gender, nor in terms of age groups (data not shown).
Overall health and psychological state of the patients were rated by patients or their parents as good, very good or excellent, at respectively >95% and >90% (figure 2). Overall, self-assessment of health status and psychological state did not differ significantly among the groups of respondents (patients over the age of majority/children, parents <12 years/12–17 years) after adjustment for the duration of the off-treatment period (p = 0.084 and p = 0.110 respectively). The number of years since the end of treatment was significantly associated with the self-assessment of the psychological state of patients: patients reported an improvement of their psychological state over the years (p = 0.017); but not with a better self-assessment of their health status (supplementary tables S5 and S6).

Figure 2 Perception of patient health and psychological status by the patient and/or by parents.
Figure 3 shows the level of satisfaction with different aspects of the LTFU program. The level of satisfaction was rated good to excellent for more than 90% of the participants for all the different aspects. Overall, all patients ranked their general satisfaction level regarding the LTFU program as good, very good or excellent (figure 4).
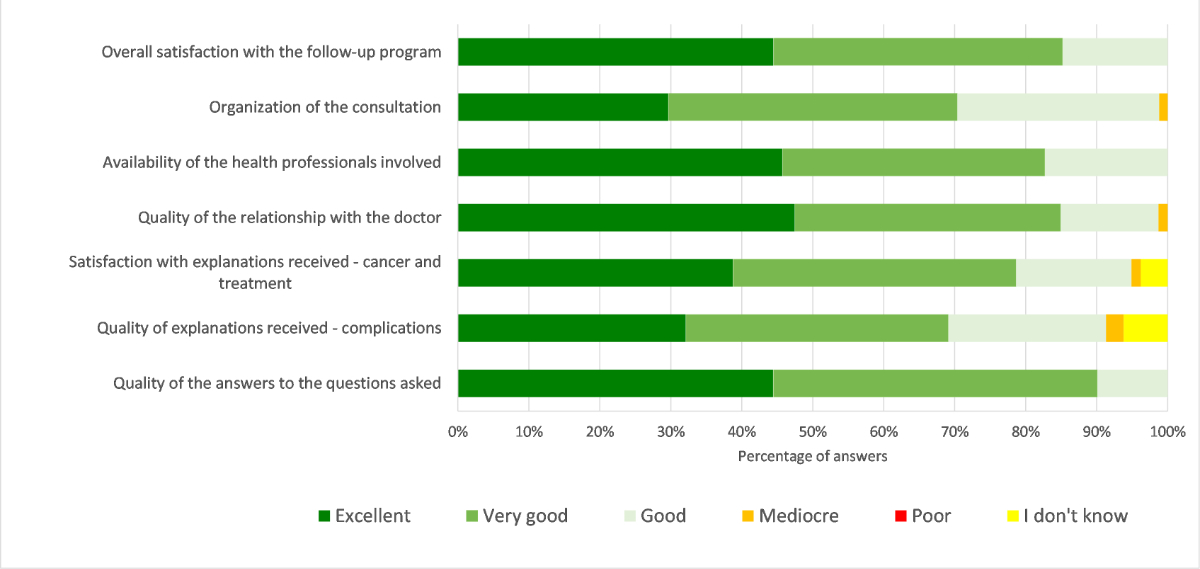
Figure 3 Degree of satisfaction of the LTFU program. Evaluation of the degree of satisfaction concerning the LTFU program.
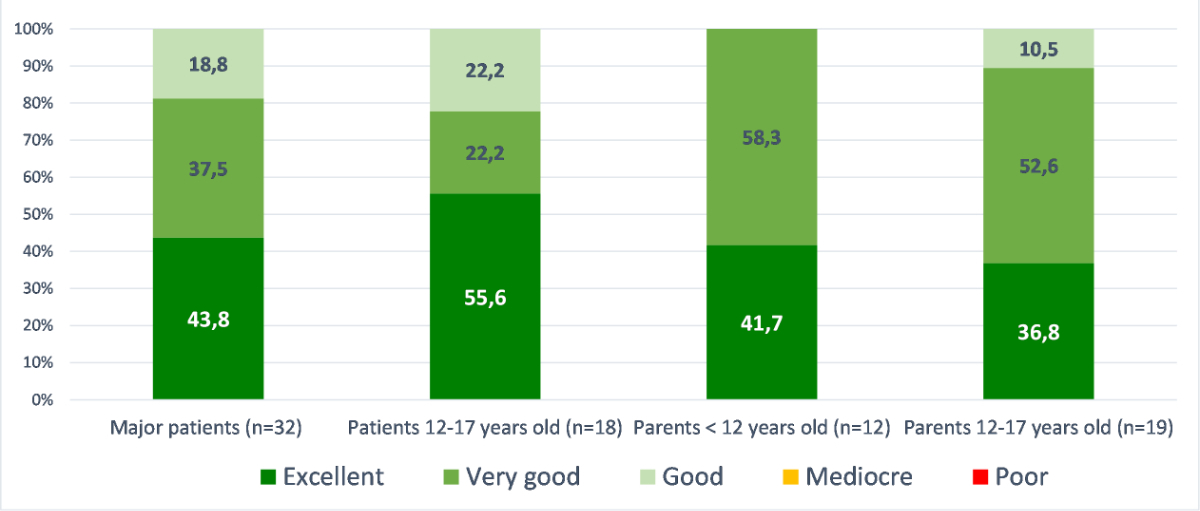
Figure 4 Degree of satisfaction of the LTFU program; evaluation of the satisfaction level concerning the LTFU program by group (major patients [n = 32]; patients 12–17 years old [n = 18]; parents <12 years old [n = 12]; parents 12–17 years [n = 19]).
Amongst respondents, 97.6% of patients and/or parents found it is very reassuring (70.4%) or reassuring (27.2%) to benefit from this type of follow-up (2.5% did not know), with no significant difference among the groups of respondents (p = 0.103). Moreover, 87.6% of patients considered that these controls did not generate any stress at all (53.8%) or not particularly (33.8%), while 10% found that it generated quite (5.0%) or a little (5.0%) stress (2.5% did not know), without significant difference among the groups (p = 0.160).
A majority of patients and/or parents were satisfied with the frequency of follow-up as once per year (82.5% yes, 15% no and 2.5% don't know). In cases who reported some dissatisfaction, 12–17 year old patients would opt more for a follow-up every 2 years while parents of children would opt more for a closer follow-up (two or more times per year), however the difference between the groups was not significant (p = 0.078). Regarding the hospital setting, 91.3% of patients and/or parents were satisfied that the consultation took place there (1 patient would like a follow-up in a non-hospital setting and 6 responded ‘do not know’). When asked for how many years the patients and/or parents plan to continue this follow-up, only 21.3% answered for a lifetime (13.8% for 10–20 years, 13.8% for 6–10 years, 8.8% for 1–5 years and 42.5% do not know). The difference was significant among the 4 groups (p = 0.011). In particular, the parents of children <12 years of age were most likely (63.6%) to desire lifetime follow-up (vs. 21.9% of adult patients, 11.1% of 12–17 years old patients and 5.3% of parents of children aged 12–17 years).
A very large majority of patients and/or parents (96.7%) would have recommended the LTFU program.
Since the 1970s, advances in oncological treatments and in the management of paediatric cancer patients have led to an increase survival rate, especially in developed countries. Nevertheless, this improved survival comes at the expense of later toxicities. The latter trend to increase with age depends on the primary tumour and its treatment.
This study, to our knowledge, is the first in Switzerland to describe this population with reference to high risk of complications, the type of follow-up implemented and the prevalence of chronic health conditions, whether or not they were treatment related. As the LTFU program has only been in place since 2015, the duration of monitoring is therefore short, and the patients are young. Since 2015, no patient in this cohort has died. However, the causes of later mortality of survivors have already been studied; notably in Switzerland, Schindler et al. reported that survivors of childhood cancer have 11 times higher mortality than expected for at least 30 years after diagnosis, mainly due to respiratory and cardiovascular diseases and secondary tumours [9].
Several studies have been carried out concerning the long-term complications in this population, often reporting results from very large cohort of childhood cancer [10, 18, 19]. Bhakta et al., described the cumulative burden of curative cancer therapy in the St Jude Lifetime Cohort (SJLIFE) including 5,522 childhood cancer survivors (median age: 33.8 years) who survived at least 10 years by grading chronic health conditions with the CTCAE classification [10]. They reported a higher cumulative prevalence of chronic health conditions in the survivor population with an average of 7 additional chronic health conditions (2 of which are graded between 3 and 5) per individual compared to the general population at age of 45 years. At this age, the surviving population thus presented twice the burden of disease compared with the general population, a difference certainly attributable to the late effects of oncological treatments. Specifically, the surviving population at age 50 had an average of 17.1 chronic health conditions, of which 4.7 are graded 3 to 5. In particular, the major contributors to this excess of complications were secondary tumours, spinal disorders and lung diseases. In their study, CNS tumour was associated with the highest cumulative burden of chronic health conditions (24.2), while germ cell tumour was associated with the lowest rate (14.0) [10]. Similarly, Hudson et al. found a very high prevalence of chronic health conditions in their childhood cancer survivor cohort (median age: 32 years), with 95.5% of patients having 1 or more CHC at age 45, of which 80.5% were serious or life-threatening conditions [20]. Recently, Suh et al. compared results of survivors aged less than 15 years at diagnosis to early-adolescent and young adult (AYA) survivors and siblings. While both groups of survivors show higher risk of CHC and mortality compared to siblings, a greater incidence of any grade CHC (grade 1–5) and severe CHC (grade 3–5) by age 45 years were found in childhood survivors compared to AYA survivors (87.1% [95% CI 84.0–90.0] vs 73.0% [70.1–75.6] and 56.3% [52.0–60.3] vs 39.4% [36.9–42.0], respectively) [19]. The early mortality was also found higher in younger patients at diagnosis (SMR 6.8 [95% CI 6.2–7.4] vs 4.8 [4.4–5.1]). These results which confirm findings of other previous studies suggest that younger patients are more vulnerable to the treatment toxicity.
In our study, the distribution of diagnoses is quite similar to that of the St Jude Lifetime cohort studied by Bhakta and Hudson [10, 20]. However, our population is younger compared to both studies. On average, our patients have been followed for 9.8 years since the end of treatment. In contrast, the average follow-up is 25.6 years in the study of Hudson et al. [20]. These remarks limit the comparison of the cumulative incidence of chronic health conditions obtained, the number of CHC increasing with age [9]. Nevertheless, we obtained a higher cumulative incidence of any CHC in comparison to the study of Philips et al. who reported a prevalence of all grades chronic health conditions of 66% in survivors currently aged 5–19 years [21], and a prevalence of having any grade 3–4 CHC similar to the one reported by Gibson et al. (approximately 22% after 15 years) [22].
The chronic health conditions found in this study partly overlap with those reported in the SJLIFE cohort which mainly belong to the cardiovascular, endocrine, neurological, musculoskeletal, and respiratory categories [10]. Interestingly, we found that only 2.5% of the chronic health conditions were cardiovascular, whereas they are most common, with an incidence at age 50 years of 93.2%, in the study by Bhakta et al. [10]. This difference is mainly explained by the difference in age and by the short follow-up of our population, compared to the number of years required for a cardiovascular disorder to be expressed. Almost 10% of the specific conditions detected are endocrine in nature and 5% are hypogonadism. The issue of hypogonadism is important to note because it often impacts the future quality of life [23] and should prompt practitioners to discuss fertility preservation options prior to gonadotoxic oncologic treatment. Radiotherapy is largely recognized as the cause of many late complications. Certainly because of the small number of patients and short follow-up period, we do not find a significant difference in mean number of chronic health conditions between exposed and unexposed groups. The three diagnoses associated with the highest mean number of chronic health conditions are sarcomas, CNS tumour, and neuroblastoma, which are among the diseases that are most followed. We also note a clear trend towards an increase in the number of CHC with the increase of treatment intensity. Finally, our data demonstrates the heterogeneity of the paediatric cancer survivor population in terms of the complications presented and the different follow-ups required. This is in line with the findings of Bhakta et al., which underline the complexity of the management of these patients [10].
The results of the survey show that a large majority of patients and/or their parents rate their health and mental state as excellent and very good. Michel et al. also reports that the majority of childhood cancer survivors in Switzerland describe a low rate of psychological distress, but nevertheless reports that 25% (compared to 10% in the general population) suffer from psychological distress to a higher degree [24]. They conclude that survivors either have a very low degree of psychological distress or, in contrast, a very high degree [24]. Interestingly, in our cohort, we found a tendency to report better health status and psychological state over the years.
All respondents are generally very satisfied with the LTFU program. One important finding is that this regular screening does not cause stress and is even perceived as reassuring. It should be noted that only one out five patients plan to maintain this follow-up for life, while almost half of all patients declare that they do not know how long to continue the screening. A very large number of participants rate the quality of communication about complications of treatment as excellent or very good. This finding underlines the importance of communication between the medical team, in particular the oncologist, and the patient, especially when explaining the delay in the onset of certain complications and justifying regular follow-ups for life.
Our study had several limitations. First, we deplored a small number of patients in comparison to other studies. Moreover, we did not have sufficient delay since the implementation of the LTFU program is more recent than the programs assessed in previous studies. This probably implies a lack of foresight about the potential complications that arise after some time and an underestimation of the future prevalence of chronic health conditions. Second, the chronic health conditions selected for our study are only those presented at the time of last consultation, so we are not protected against a lack of report that is common in most observational retrospective studies. Finally, our study did not include a control group, thus preventing us from comparing the rate of chronic complications with that of the general paediatric population, limiting the evaluation of the actual proportion attributable to late effects of oncological treatment. Repeating this study in the same population in a few years would allow analysis of the kinetics of chronic health conditions occurrence over time.
In conclusion, the large number of chronic health conditions already found in our cohort and the results reported in the literature showing an increase in the incidence of chronic health conditions over time encourage the maintenance of a structured follow-up as currently implemented by the HUG. Hospital follow-up by a dedicated oncologist seems to be the best option for early detection of late side effects, due to the specificity of the treatment, and given that almost two thirds of general practitioners say they are poorly informed about late complications related to oncological treatment [25]. Furthermore, the study by Christen et al. on the Swiss survivor cohort also found a significant preference for follow-up by an oncologist rather than a general practitioner [26]. LTFU program appears to be suitable for the vast majority of patients and their relatives. This acceptance is fundamental for the adherence to lifelong medical check-ups, although currently a minority of patients plan to maintain this follow-up throughout their lives. This is a possible message to insist on for treating oncologists, regularly reminding their patients of the sometimes very late onset of complications and the benefit to their health of early treatment.
Raw data were generated at the University Hospitals of Geneva. Derived data supporting the findings of this study are available from the corresponding author (FGP) on request.
The authors would like to thank everyone who contributed to the completion of this study, in particular the patients and their families who agreed to participate. They are also particularly grateful to the Fondation Dubois-Ferrière Dinu Lippatti, the Fondation Privée des HUG and the Ligue Genevoise contre le Cancer for their financial support.
The LTFU program is funded by the Fondation Dubois-Ferrière Dinu Lippatti, the Fondation Privée des HUG and by the Ligue Genevoise contre le Cancer. This research was undertaken as the Master thesis of the University of Geneva (S. Babecoff and F. Mermillod).
All authors have completed and submitted the International Committee of Medical Journal Editors form for disclosure of potential conflicts of interest. No potential conflict of interest was disclosed.
1. Gatta G , Zigon G , Capocaccia R , Coebergh JW , Desandes E , Kaatsch P , et al.; EUROCARE Working Group . Survival of European children and young adults with cancer diagnosed 1995-2002. Eur J Cancer. 2009 Apr;45(6):992–1005. https://doi.org/10.1016/j.ejca.2008.11.042
2. Siegel R , Naishadham D , Jemal A . Cancer statistics, 2013. CA Cancer J Clin. 2013 Jan;63(1):11–30. https://doi.org/10.3322/caac.21166
3. Swiss Childhood Cancer Registry [Internet]. Bern: Swiss Childhood Cancer Registry; 2019 [cited 2020 July 13]. Availbale from https://www.kinderkrebsregister.ch/wp-content/uploads/sites/2/2019/09/FINAL-Annual-Report_2017_2018_with-CC-license.pdf
4. Bleyer A , O’Leary M , Barr R , et al. Cancer epidemiology in older adolescents and young adults 15 to 29 years of age, including SEER incidence and survival: 1975-2000. Bethesda, MD: National Cancer Institute, 2006.
5. Ries LG , Pollack ES , Young JL Jr . Cancer patient survival: Surveillance, Epidemiology, and End Results Program, 1973-79. J Natl Cancer Inst. 1983 Apr;70(4):693–707.
6. Oeffinger KC , Robison LL . Childhood cancer survivors, late effects, and a new model for understanding survivorship. JAMA. 2007 Jun;297(24):2762–4. https://doi.org/10.1001/jama.297.24.2762
7. Diller L , Chow EJ , Gurney JG , Hudson MM , Kadin-Lottick NS , Kawashima TI , et al. Chronic disease in the Childhood Cancer Survivor Study cohort: a review of published findings. J Clin Oncol. 2009 May;27(14):2339–55. https://doi.org/10.1200/JCO.2008.21.1953
8. Mertens AC , Liu Q , Neglia JP , Wasilewski K , Leisenring W , Armstrong GT , et al. Cause-specific late mortality among 5-year survivors of childhood cancer: the Childhood Cancer Survivor Study. J Natl Cancer Inst. 2008 Oct;100(19):1368–79. https://doi.org/10.1093/jnci/djn310
9. Schindler M , Spycher BD , Ammann RA , Ansari M , Michel G , Kuehni CE ; Swiss Paediatric Oncology Group (SPOG) . Cause-specific long-term mortality in survivors of childhood cancer in Switzerland: A population-based study. Int J Cancer. 2016 Jul;139(2):322–33. https://doi.org/10.1002/ijc.30080
10. Bhakta N , Liu Q , Ness KK , Baassiri M , Eissa H , Yeo F , et al. The cumulative burden of surviving childhood cancer: an initial report from the St Jude Lifetime Cohort Study (SJLIFE). Lancet. 2017 Dec;390(10112):2569–82. https://doi.org/10.1016/S0140-6736(17)31610-0
11. Erdmann F , Frederiksen LE , Bonaventure A , Mader L , Hasle H , Robison LL , et al. Childhood cancer: Survival, treatment modalities, late effects and improvements over time. Cancer Epidemiol. 2021 Apr;71 Pt B:101733. https://doi.org/10.1016/j.canep.2020.101733
12. F. Gumy-Pause*, E.M. Tinner*, M. Diezi, E. Bergsträsser, H. Hengartner, B. Eisenreich, P. Brazzola, N. von der Weid, Z. Tomášiková, K. Scheinemann, Long-term follow-up after childhood cancer in Switzerland: a position statement from the pediatric Swiss LTFU working group. Bulletin suisse du cancer (2019) 39 : 212-215.
13. Children’s Oncology Group . Long-Term Follow-Up Guidelines for Survivors of Childhood, Adolescent and Young Adult Cancer Version 4.0 [Internet]. Seattle: Children’s Oncology Group; 2013 [updated 2013 October; cited 2020 July 18]. Available from: http://www.survivorshipguidelines.org/pdf/COG%20LTFU%20Guidelines%20Archive/Version%204.0/COG_LTFU_Guidelines_v4%20(secured).pdf
14. Kazak AE , Hocking MC , Ittenbach RF , Meadows AT , Hobbie W , DeRosa BW , et al. A revision of the intensity of treatment rating scale: classifying the intensity of pediatric cancer treatment. Pediatr Blood Cancer. 2012 Jul;59(1):96–9. https://doi.org/10.1002/pbc.23320
15. Lansky SB , List MA , Lansky LL , Ritter-Sterr C , Miller DR . The measurement of performance in childhood cancer patients. Cancer. 1987 Oct;60(7):1651–6. https://doi.org/10.1002/1097-0142(19871001)60:7<1651::AID-CNCR2820600738>3.0.CO;2-J
16. Karnofsky DA , Burchenal JH . The clinical evaluation of chemotherapeutics in cancer. In: MacLoed CM, ed. Evaluation of Chemotherapeutic Agents. New York: Columbia University Press; 1949: p. 191-205.
17. National Cancer Institute . Division of Cancer Treatment & Diagnosis. Cancer Therapy Evaluation Program [Internet]. Bethesda: National Cancer Institute; 2020 [updated 2020 March 27; cited 2020 July 17]. Available from: https://ctep.cancer.gov/protocolDevelopment/electronic_applications/ctc.htm
18. Oeffinger KC , Hudson MM , Landier W . Survivorship: childhood cancer survivors. Prim Care. 2009 Dec;36(4):743–80. https://doi.org/10.1016/j.pop.2009.07.007
19. Suh E , Stratton KL , Leisenring WM , Nathan PC , Ford JS , Freyer DR , et al. Late mortality and chronic health conditions in long-term survivors of early-adolescent and young adult cancers: a retrospective cohort analysis from the Childhood Cancer Survivor Study. Lancet Oncol. 2020 Mar;21(3):421–35. https://doi.org/10.1016/S1470-2045(19)30800-9
20. Hudson MM , Ness KK , Gurney JG , Mulrooney DA , Chemaitilly W , Krull KR , et al. Clinical ascertainment of health outcomes among adults treated for childhood cancer. JAMA. 2013 Jun;309(22):2371–81. https://doi.org/10.1001/jama.2013.6296
21. Phillips SM , Padgett LS , Leisenring WM , Stratton KK , Bishop K , Krull KR , et al. Survivors of childhood cancer in the United States: prevalence and burden of morbidity. Cancer Epidemiol Biomarkers Prev. 2015 Apr;24(4):653–63. https://doi.org/10.1158/1055-9965.EPI-14-1418
22. Gibson TM , Mostoufi-Moab S , Stratton KL , Leisenring WM , Barnea D , Chow EJ , et al. Temporal patterns in the risk of chronic health conditions in survivors of childhood cancer diagnosed 1970-99: a report from the Childhood Cancer Survivor Study cohort. Lancet Oncol. 2018 Dec;19(12):1590–601. https://doi.org/10.1016/S1470-2045(18)30537-0
23. Ussher JM , Perz J . Infertility-related distress following cancer for women and men: A mixed method study. Psychooncology. 2019 Mar;28(3):607–14. https://doi.org/10.1002/pon.4990
24. Michel G , Rebholz CE , von der Weid NX , Bergstraesser E , Kuehni CE . Psychological distress in adult survivors of childhood cancer: the Swiss Childhood Cancer Survivor study. J Clin Oncol. 2010 Apr;28(10):1740–8. https://doi.org/10.1200/JCO.2009.23.4534
25. Berger C , Casagranda L , Faure-Conter C , Freycon C , Isfan F , Robles A , et al. Long-Term Follow-up Consultation After Childhood Cancer in the Rhône-Alpes Region of France: Feedback From Adult Survivors and Their General Practitioners. J Adolesc Young Adult Oncol. 2017 Dec;6(4):524–34. https://doi.org/10.1089/jayao.2017.0019
26. Christen S , Vetsch J , Mader L , Dehler S , Korol D , Kuehni C , et al. Preferences for the organization of long-term follow-up in adolescent and young adult cancer survivors. Support Care Cancer. 2016 Aug;24(8):3425–36. https://doi.org/10.1007/s00520-016-3157-7
Table S1Mean follow-up time since diagnosis for each disease group.
| Mean follow-up time in years (±SD, median) | |
| Leukaemia (n = 17) | 8.9 (±3.4, 8) |
| Lymphoma (n = 9) | 8.7 (±3.6, 7) |
| Neuroblastoma (n = 6) | 15.0 (±8.9, 12) |
| Nephroblastoma (n = 6) | 11.5 (±4.4, 10.5) |
| Sarcoma (n = 5) | 8.6 (±4.2, 8) |
| CNS tumour (n = 6) | 8.8 (±5.3, 7) |
| Germ cell tumour (n = 1) | 9.0 |
| Langerhans cell histiocytosis (n = 1) | 5.0 |
Table S2Treatment exposures of the participants in the LTFU outcome study.
| Participants (n = 51) | ||
| Treatments | Chemotherapy only | 22 (43.1%) |
| Chemotherapy and radiation | 9 (17.7%) | |
| Chemotherapy and surgery | 12 (23.5%) | |
| Chemotherapy, radiation, and surgery | 8 (15.7%) | |
| Radiation only | 0 (0%) | |
| Surgery only | 0 (0%) | |
| Radiation and surgery | 0 (0%) | |
| Intensity of treatment rating | 1 | 6 (11.8%) |
| 2 | 25 (49.0%) | |
| 3 | 14 (27.5%) | |
| 4 | 6 (11.8%) | |
| Anthracycline dose (mg/m2) | None | 12 (23.5%) |
| 1–249 mg/m2 | 27 (52.9%) | |
| ≥250 mg/m2 | 12 (23.5%) | |
| Alkylating agents (cyclophosphamide equivalent dose [mg/m2]) | No | 15 (29.4%) |
| <5’000 mg/m2 | 21 (41.2%) | |
| 5’000–10’000 mg/m2 | 5 (9.8%) | |
| >10’000 mg/m2 | 10 (19.6%) | |
| Platinum agents | No | 33 (64.7%) |
| Yes | 18 (35.3%) | |
| Bleomycin | No | 47 (92.2%) |
| Yes | 4 (7.8%) | |
| Cytarabine | No | 28 (54.9%) |
| Yes | 23 (45.1%) | |
| Antimetabolites | No | 34 (66.7%) |
| Yes | 17 (33.3%) | |
| Other chemotherapeutical treatment | No | 25 (49.0%) |
| Yes | 26 (51.0%) | |
| Radiation | No | 34 (66.7%) |
| Yes | 17 (33.3%) | |
| – conventional | 15 (29.4%) | |
| – proton therapy | 2 (3.9%) | |
| Surgery (tumoral resection) | No | 31 (60.8%) |
| Yes | 20 (39.2%) | |
| Autologous transplantation | No | 46 (90.2%) |
| Yes | 5 (9.8%) | |
| Immunotherapy | No | 49 (96.1%) |
| Yes | 2 (3.9%) | |
| Steroids | No | 27 (52.9%) |
| Yes | 24 (47.1%) | |
| Methotrexate | No | 28 (54.9%) |
| Yes | 23 (45.1%) | |
| Epipodophyllotoxins | No | 25 (49.0%) |
| Yes | 26 (51.0%) | |
| Plants alkaloids | No | 8 (15.7%) |
| Yes | 43 (84.3%) | |
Table S3Specific follow-up.
| Participants (n = 51) | |
| Endocrinological | 47 (92.2%) |
| Cardiological | 41 (80.4%) |
| Nephrological | 14 (27.5%) |
| Otolaryngological | 12 (23.5%) |
| Orthopaedical | 12 (23.5%) |
| Psychological | 11 (21.6%) |
| Pneumological | 11 (21.6%) |
| Dermatological | 9 (17.6%) |
| Ophthalmological | 6 (11.8%) |
| Neurological | 5 (9.8%) |
| Oncological | 5 (9.8%) |
| Dental | 4 (7.8%) |
| Gastroenterological | 4 (7.8%) |
| Maxillofacial | 3 (5.9%) |
| Gynaecological | 2 (3.9%) |
| Allergological | 1 (1.9%) |
| Haematological | 1 (1.9%) |
Table S4Number of each type of chronic health condition specific condition according to the CTCAE grade scale.
| Chronic health condition | CTCAE Grade Scale | ||||
| 1 | 2 | 3 | 4 | Total (%) | |
| Abdominal pain | 1 | 0 | 0 | 0 | 1 (0.9) |
| Allergic rhinitis | 0 | 4 | 0 | 0 | 4 (3.4) |
| Alopecia | 0 | 1 | 0 | 0 | 1 (0.9) |
| Amputation | 0 | 0 | 1 | 0 | 1 (0.9) |
| Anxiety | 0 | 1 | 0 | 0 | 1 (0.9) |
| Arrythmia | 1 | 0 | 0 | 0 | 1 (0.9) |
| Asthma | 0 | 2 | 0 | 0 | 2 (1.7) |
| Breast pain | 1 | 0 | 0 | 0 | 1 (0.9) |
| Cardiovascular dysfunction | 1 | 0 | 0 | 0 | 1 (0.9) |
| Central nervous system disorder | 3 | 0 | 1 | 1 | 5 (4.2) |
| Chest pain | 1 | 0 | 0 | 0 | 1 (0.9) |
| Chronic kidney disease | 1 | 0 | 0 | 0 | 1 (0.9) |
| Cognitive disorder | 1 | 2 | 1 | 0 | 4 (3.4) |
| Conditions affecting the pituitary | 0 | 4 | 0 | 0 | 4 (3.4) |
| Congenital, familial and genetic disorder | 1 | 1 | 1 | 0 | 3 (2.5) |
| Dental caries | 0 | 2 | 0 | 0 | 2 (1.7) |
| Endocrine disorder | 1 | 0 | 0 | 0 | 1 (0.9) |
| Epistaxis, chronic/recurrent | 0 | 1 | 0 | 0 | 1 (0.9) |
| Essential hypertension/dyslipidaemia | 0 | 1 | 0 | 0 | 1 (0.9) |
| Fatigue | 1 | 0 | 0 | 0 | 1 (0.9) |
| Functional pulmonary deficit | 0 | 2 | 1 | 0 | 3 (2.5) |
| General disorders and administration | 1 | 0 | 0 | 0 | 1 (0.9) |
| Headaches | 0 | 1 | 0 | 0 | 1 (0.9) |
| Hearing loss | 3 | 2 | 2 | 0 | 7 (5.9) |
| Hematologic disorders | 2 | 1 | 0 | 0 | 3 (2.5) |
| Hypogonadism | 1 | 5 | 0 | 0 | 6 (5.1) |
| Inflammatory disorders | 0 | 2 | 0 | 0 | 2 (1.7) |
| Joint disease | 0 | 0 | 1 | 0 | 1 (0.9) |
| Kidney injury | 9 | 0 | 0 | 0 | 9 (7.6) |
| Limb length discrepancy | 1 | 0 | 0 | 0 | 1 (0.9) |
| Metabolism and nutrition disorder | 0 | 2 | 0 | 0 | 2 (1.7) |
| Mixed nervous system disorder | 2 | 0 | 0 | 0 | 2 (1.7) |
| Movement disorders | 1 | 0 | 0 | 0 | 1 (0.9) |
| Multiple allergies | 0 | 0 | 1 | 0 | 1 (0.9) |
| Musculoskeletal deformity | 1 | 1 | 0 | 0 | 2 (1.7) |
| Neoplasms benign | 0 | 2 | 0 | 0 | 2 (1.7) |
| Nervous system disorder | 0 | 1 | 0 | 0 | 1 (0.9) |
| Obesity/underweight | 1 | 2 | 2 | 0 | 5 (4.2) |
| Oculomotricity disorder | 0 | 0 | 1 | 0 | 1 (0.9) |
| Peripheral musculoskeletal disorder | 3 | 5 | 0 | 0 | 8 (6.8) |
| Peripheral nervous system disorder | 3 | 2 | 0 | 0 | 5 (4.2) |
| Psychiatric disorder | 2 | 3 | 0 | 0 | 5 (4.2) |
| Respiratory parenchymal disease | 0 | 1 | 0 | 0 | 1 (0.9) |
| Secondary and recurrent malignancies | 0 | 1 | 2 | 0 | 3 (2.5) |
| Secondary benign condition | 0 | 1 | 0 | 0 | 1 (0.9) |
| Soft tissue infection | 0 | 1 | 0 | 0 | 1 (0.9) |
| Spine disorder | 3 | 0 | 0 | 0 | 3 (2.5) |
| Thyroid disorders | 1 | 1 | 0 | 0 | 2 (1.7) |
| Vaso vagal reaction | 0 | 0 | 1 | 0 | 1 (0.9) |
| Total | 47 | 55 | 15 | 1 | 118 (100%) |
Table S5Self-assessment of health status.
| Variables | Odds ratio | IC 95% | P Value | |
| Group of participants (p = 0.084) | Major patients | 1.0 | – | – |
| Minor patients | 2.3 | 0.7–7.0 | 0.160 | |
| Parents of <12 year olds | 3.6 | 0.9–14.3 | 0.070 | |
| Parents of 12–17 year olds | 3.8 | 1.2–11.8 | 0.021 | |
| Number of years since the EOT (p = 0.132) | 5 years | 1.0 | – | – |
| 6–10 years | 2.9 | 1.0–8.4 | 0.053 | |
| 11–15 years | 1.1 | 0.3–3.4 | 0.902 | |
| 16 years and more | 3.3 | 0.7–16.3 | 0.140 |
EOT: End of treatment
Table S6Psychological self-assessment.
| Variables | Odds ratio | IC 95% | Valeur p | |
| Group of participants (p = 0.110) | Major Patients | 1.0 | – | – |
| Minor Patients | 4.0 | 1.3–12.7 | 0.020 | |
| Parents of <12 year olds | 0.6 | 0.2–2.1 | 0.395 | |
| Parents of 12–17 year olds | 2.2 | 0.8–6.3 | 0.152 | |
| Number of years since the EOT (p = 0.026) | 5 years | 1.0 | – | – |
| 6–10 years | 3.7 | 1.3–10.9 | 0.017 | |
| 11–15 years | 1.5 | 0.5–4.9 | 0.484 | |
| 16 years and more | 1.8 | 0.4–7.2 | 0.418 |
EOT: End of treatment

Figure S1 Types of follow-up according to the ITR.
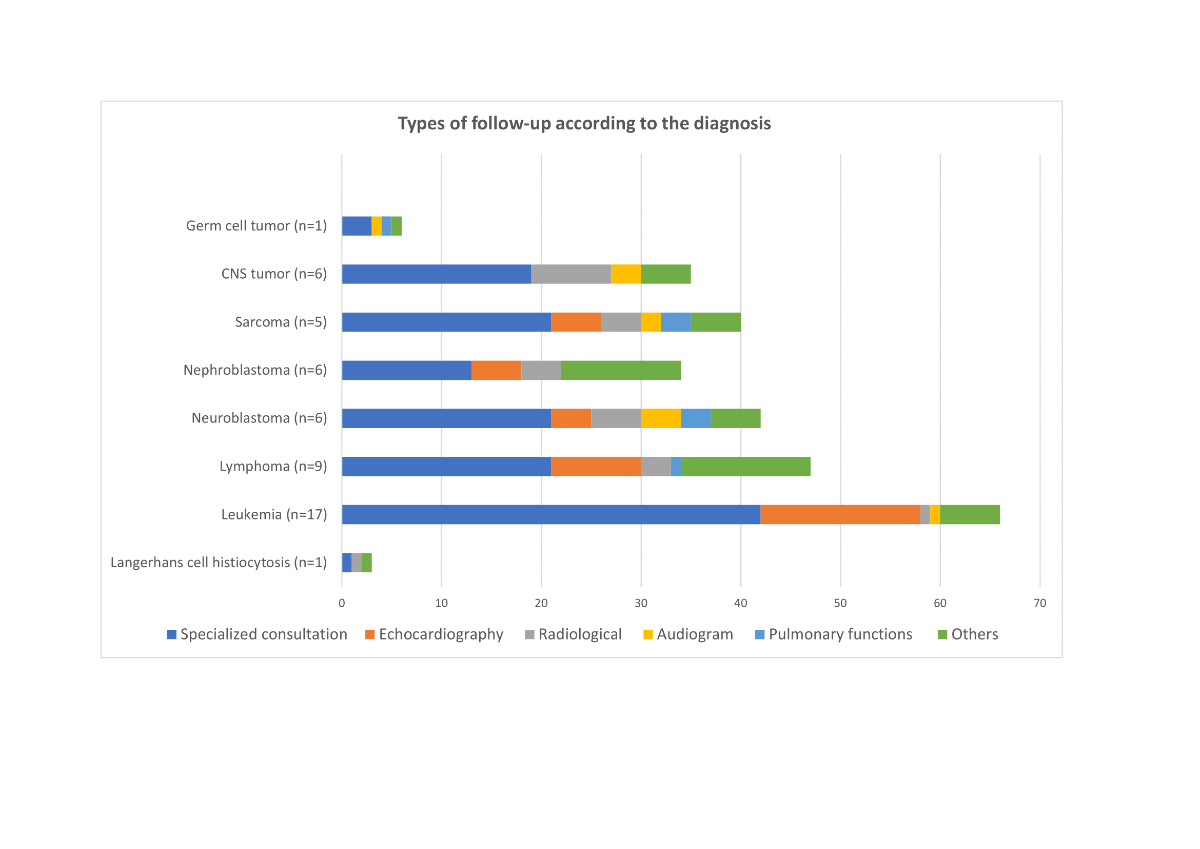
Figure S2 Types of follow-up according to the diagnosis.

Figure S3 Distribution of chronic health conditions for each diagnosis; Langerhans cell histiocytosis.

Figure S4 Distribution of chronic health conditions for each diagnosis; leukemia.
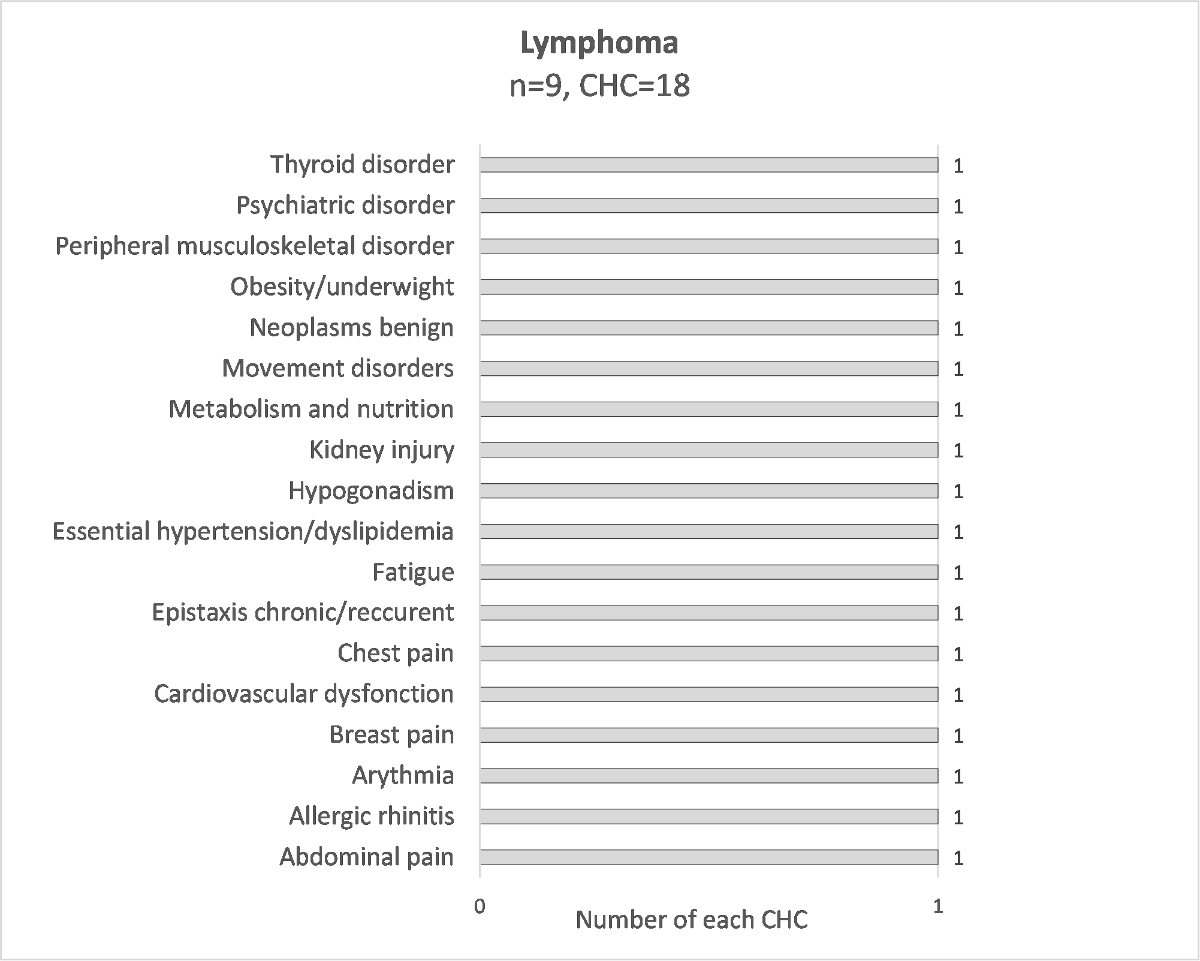
Figure S5 Distribution of chronic health conditions for each diagnosis; lymphoma.

Figure S6 Distribution of chronic health conditions for each diagnosis; neuroblastoma.

Figure S7 Distribution of chronic health conditions for each diagnosis; nephroblastoma.

Figure S8 Distribution of chronic health conditions for each diagnosis; sarcoma.
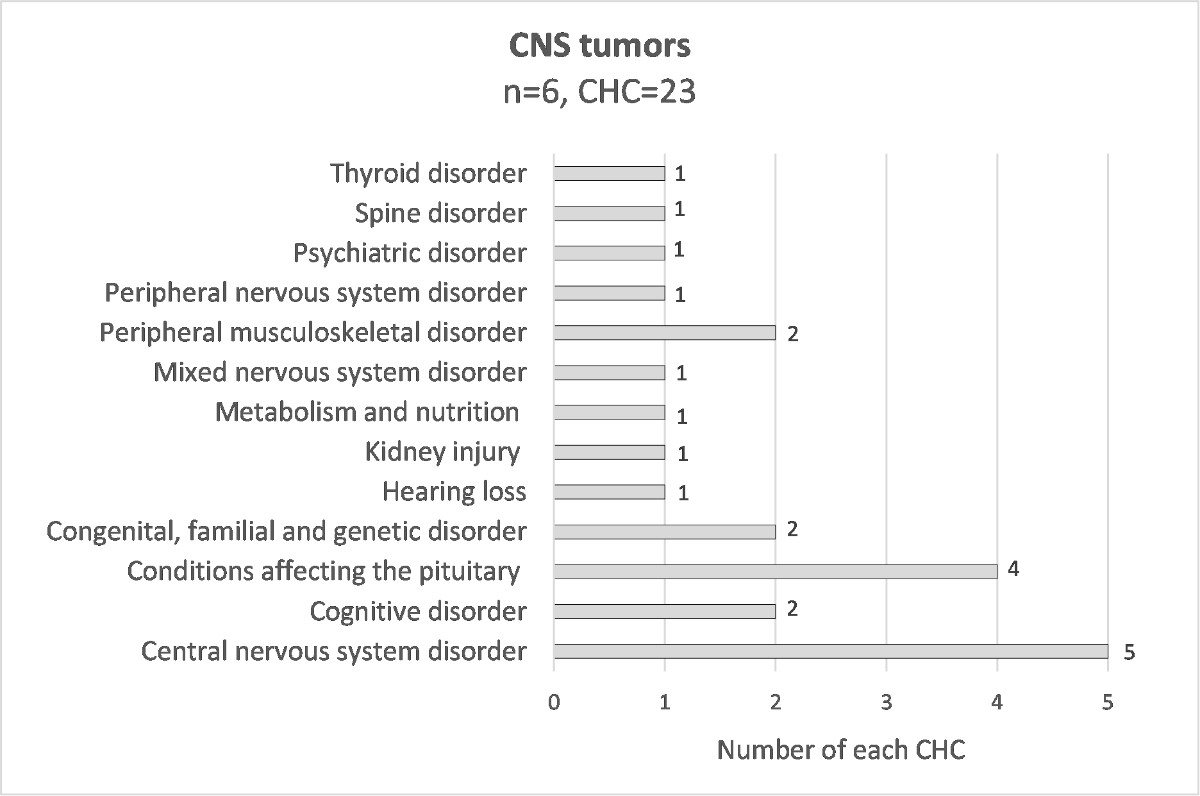
Figure S9 Distribution of chronic health conditions for each diagnosis; CNS tumor.
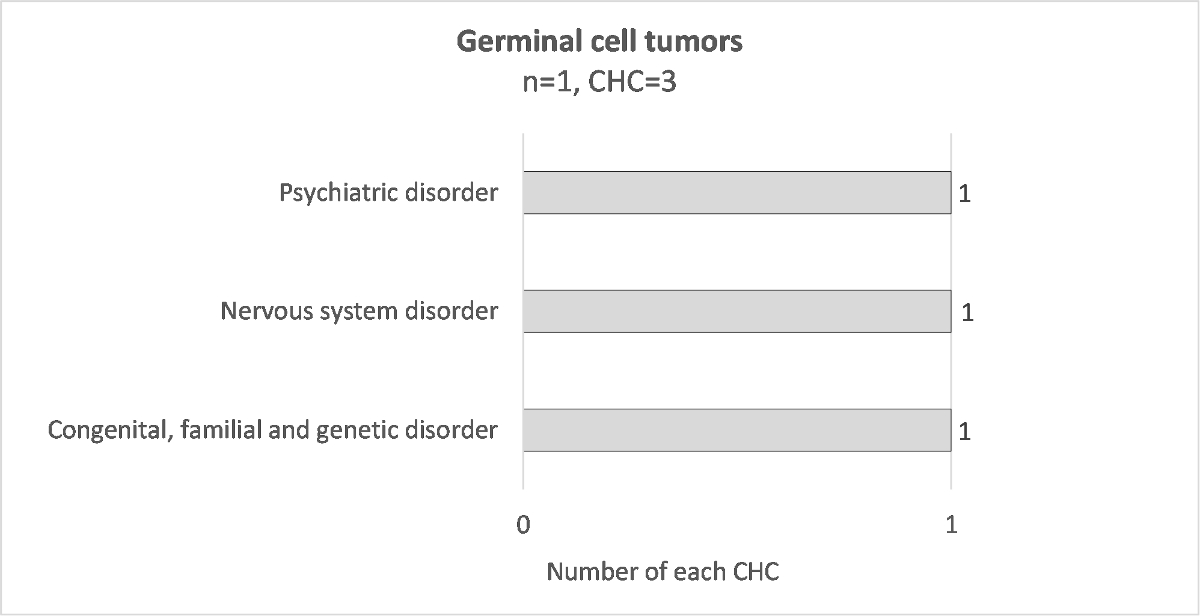
Figure S10 Distribution of chronic health conditions for each diagnosis; germinal cell tumor.
The questionnaires are available in the PDF version of the article.