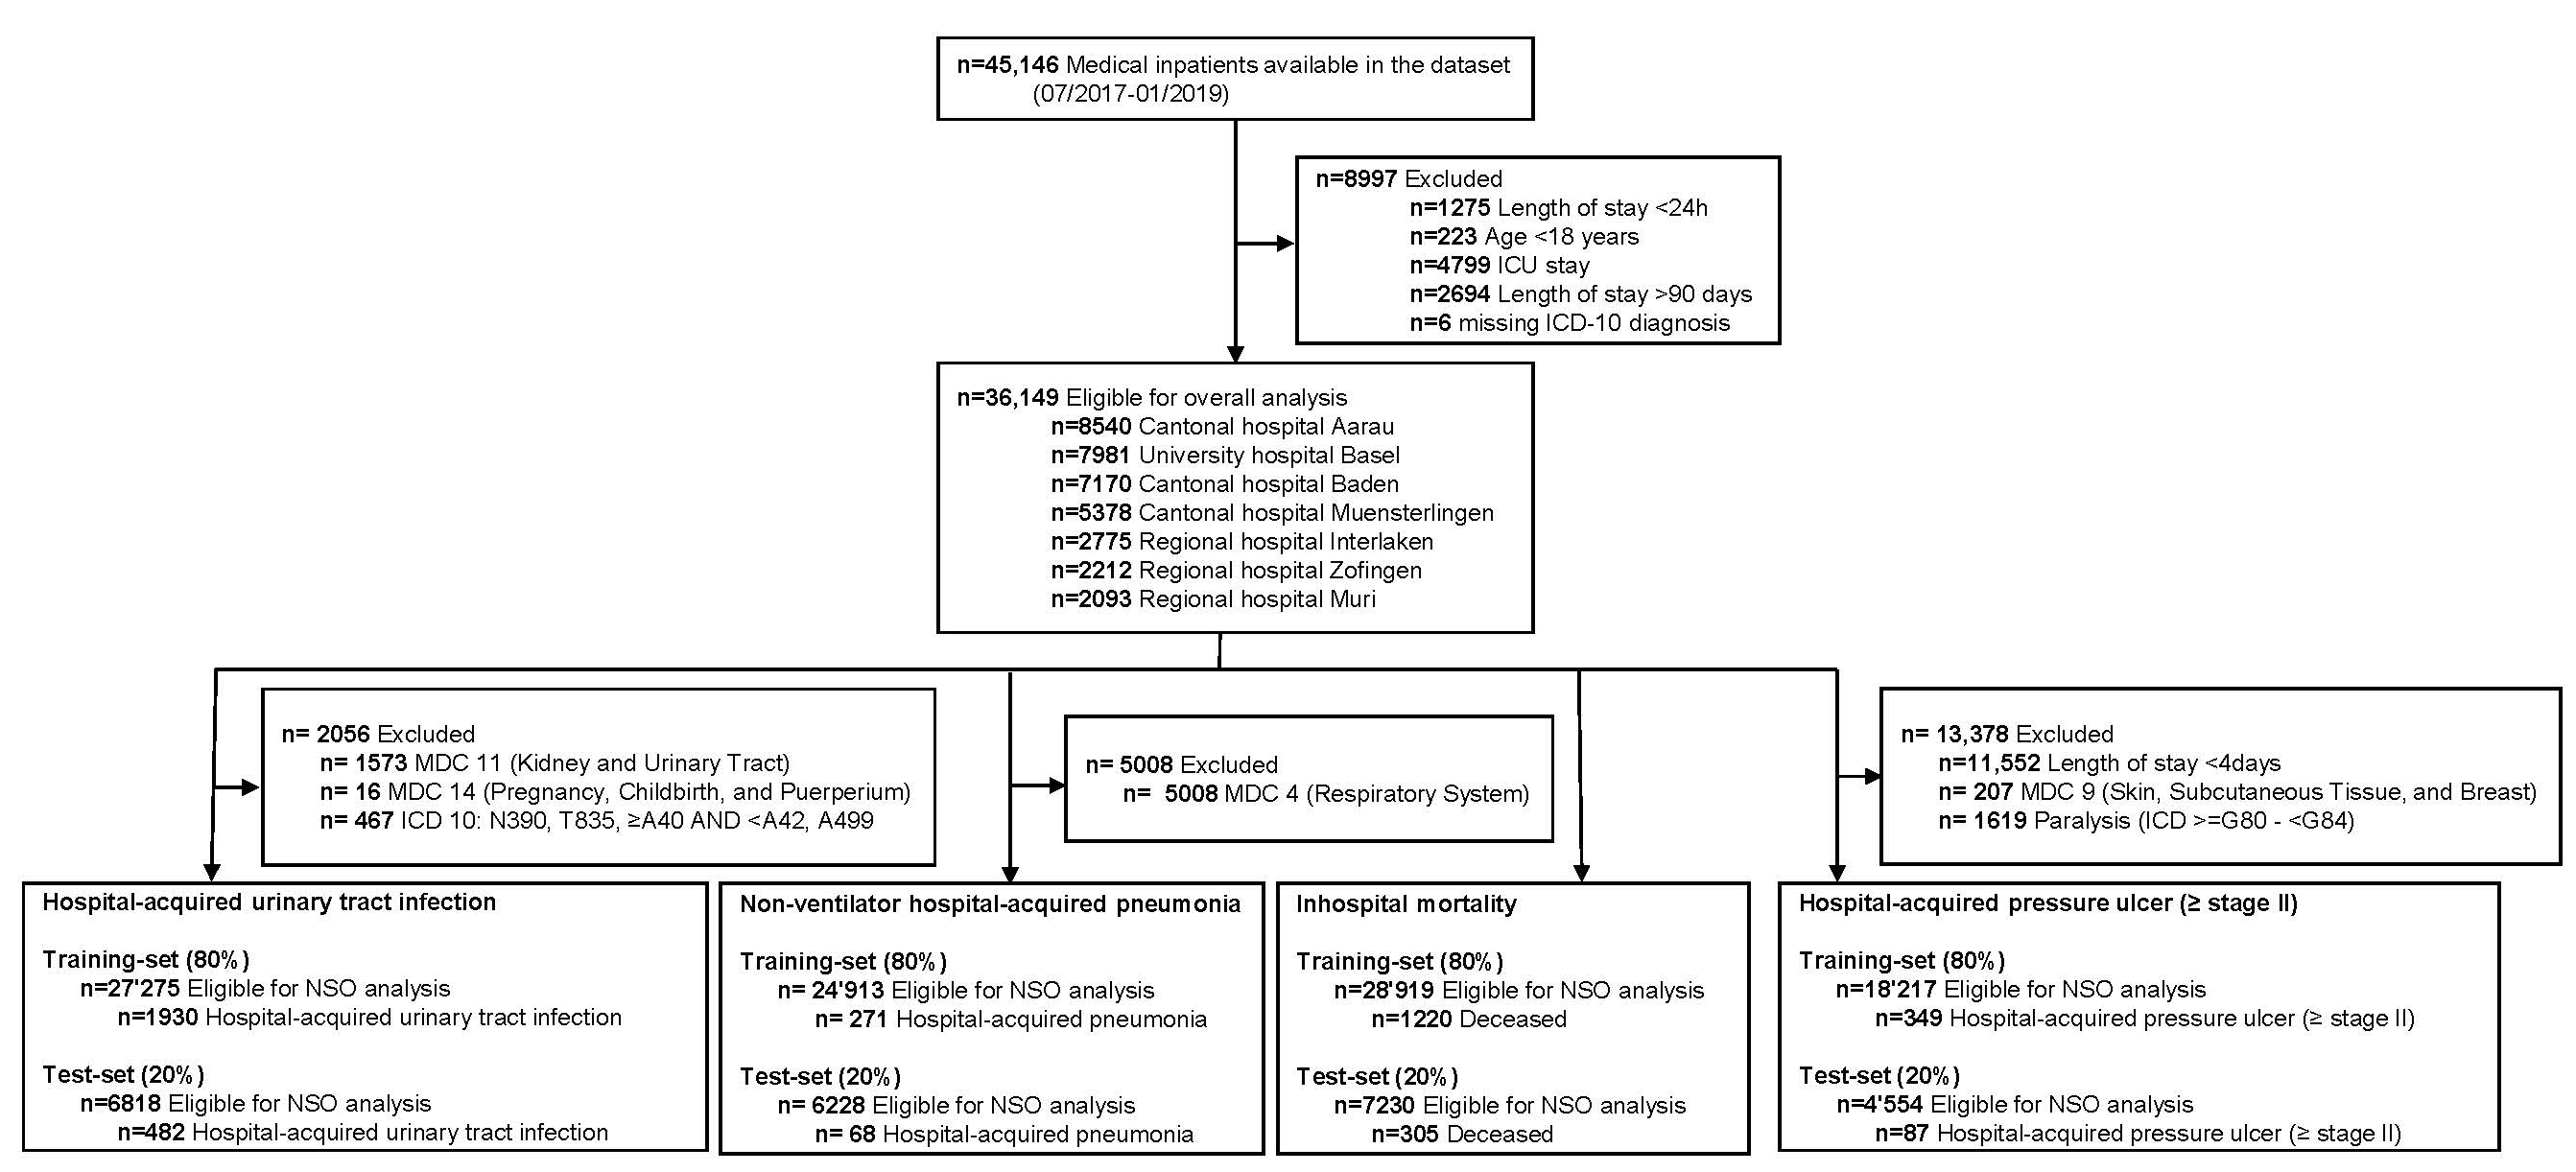
Figure 1 Flow chart of study patients.
DOI: https://doi.org/10.4414/SMW.2022.w30152
The relationship between higher levels of qualified nursing staff (registered nurses vs. non-registered nurses) and patient outcomes has been established.The relationship between higher levels of qualified nursing staff (registered nurses vs. non-registered nurses) and patient outcomes has been established [1–5]. Higher nurse staffing is, for example, associated with a lower incidence of hospital-acquired pressure ulcers, hospital-acquired pneumonia, and in-hospital mortality in medical inpatients [6, 7]. These outcomes, which are influenced by nursing care, are generally understood as nursing-sensitive outcomes (NSO). NSOs have been defined as outcomes “that are relevant, based on nurses’ scope and domain of practice, and for which there is empirical evidence linking nursing inputs and interventions to the outcomes’’ [8, 9].
NSOs may help to establish an outcome-related measure of quality of care [10–13]. In some countries, there are mandatory sets of NSOs already established in clinical routines that help to measure and compare the quality of nursing care [11, 12, 14–16]. However, there is no international consensus on NSO sets for quality of care assessment. Definitions and measurement methods vary considerably within international healthcare systems, and thus do not allow comparison of NSOs. In general, administrative coding data is used to measure NOSs because of its availability and standardized definition within a healthcare system. Yet not all countries have standardized reporting of NSOs. In Switzerland, for example, only the ‘Swiss National Association for Quality Development in Hospitals and Clinics’ (ANQ) reports annually on aspects of quality of acute care by means of a cross-sectional survey. The ANQ methodology has important weaknesses. First, the yearly data acquisition for ANQ analyses requires large staff resources. Second, data are collected on one day per year for point prevalence, which results in low incidence rates. This does not allow trends to be assessed in order to analyse the power of NSO.
Here, the frequency of NSOs from uniformly defined administrative data could be a useful and cost-effective complement. In addition to the availability of data and a clear definition, a suitable adjustment procedure is needed to facilitate comparisons between different hospitals or wards with heterogeneous patient populations.
The primary aim of this study was to identify predictors for four common NSOs of acute medical care of adult patients based on administrative data for the development and cross-validation of an NSO-related prediction model. The secondary aim of this study was to establish a set of benchmarksbetween seven Swiss hospitals using the four pre-specified NSOs. There is broad consensus that analyses and comparisons of NSO should occur at the ward level so that specific quality improvement actions can be taken [17]. Therefore, in addition to the overall hospital view presented here, which provides an impression of the overall comparison between medical departments, the proposed procedure will also be applicable at the ward level. This may allow comparisons within a department.
This was a secondary data analysis of a prospective cohort study (In-HospiTOOL study) [18]. The “In-HospiTOOL” study was a quasi-experimental investigator-initiated, multicenter comparative effectiveness trial investigating the impact of an interprofessional discharge planning tool on length of hospital stay and other outcomes. The study established a representative benchmarking database to promote the measurement of quality of care across different sized Swiss hospitals.
We included all consecutively admitted adult (≥18 years) emergency patients from July 2017 to January 2019. Patients had to be hospitalized on a medical ward in one of the following seven secondary and tertiary care hospitals: Cantonal Hospital Aarau, Cantonal Hospital Baden, Cantonal Hospital Muensterlingen, Hospital Muri, Hospital Zofingen, Hospital Interlaken, and University Hospital Basel. We excluded patients with a length of hospital stay shorter than 24 hours or longer than 90 days and patients who have been treated in the intensive care unit (ICU) as part of their hospitalisation because the NSOs under study have not been developed for use in these patient populations.
We conducted a literature review to identify covariates that may affect the occurrence of an NSO. Based on previous studies, we used a basic set of adjustment variables for all models: age, gender, Charlson Comorbidity Index [19], length of hospital stay, Major Diagnostic Category (MDC) according to Diagnosis Related Groups (DRG), and type of hospital [20, 21]. Further covariates related to individual NSOs are described in table 1. Data availability was a limiting factor in the selection of covariates.
Table 1 Nursing-sensitive outcomes of interest.
| Nursing-sensitive outcome | ICD-10 codes or definition | References | Adjustment variables* |
| Hospital-acquired pressure ulcer (≥ stage II) | L89 | [12, 20, 24–29] | In-hospital death [57]; presence of diabetes / peripheral vascular disease [58]; presence of a stage I pressure ulcer / urinary tract infection [59] |
| Hospital-acquired urinary tract infection | T83.5 | [1, 20, 27, 30–33] | Presence of diabetes [60, 61] |
| Non-ventilator hospital-acquired pneumonia | U69.0 | [1, 2, 20, 27, 34–38] | Living situation before hospital admission; Readmission [62, 63] |
| In-hospital mortality | Variable 1.5.V03: discharge location: death [64] | [3, 5, 27, 39–42] | MDC "Myeloproliferative Diseases & Disorders" [65] |
*In addition to the basic set of adjustment variables for all models (age; gender; Charlson Comorbidity Index; length of hospital stay; Major Diagnostic Category according to DRG; type of hospital)
An NSO was defined as "a variable patient or family caregiver state, behavior, or perception responsive to nursing intervention… [that] can be measured and compared to a baseline over time" [22]. They are deemed scientifically acceptable if there is sufficient evidence of the link between process measures and patient outcomes and if they are attributable to nursing [23]. Therefore, we have included NSOs for which the relationship between patient outcomes and nursing staff variables was found to be statistically significant in the literature and for which a data basis is available in the administrative data. Based on these criteria we analysed four NSOs:
We used administrative data provided by the coding department as well as data from the electronic patient record of each of the participating hospitals between July 1, 2017, and January 31, 2019, as part of the In-HospiTOOL study. The datasets were linked at the case number level and data consistency between the different datasets was checked to ensure data quality. The administrative data comprises a set of uniform, clearly defined variables created by the Swiss Federal Statistical Office, that are therefore comparable among hospitals [43]. The diagnosis coding takes place after the hospitalisation has been completed, based on the discharge reports and the electronic patient record. To enable the coding of an outcome, the prerequisite had to be fulfilled that the outcome had been correctly recorded by a nurse or physician in the electronic patient chart or diagnosis list as part of the routine processes during hospitalisation. A single patient may have more than one hospital admission within the study period. Information on status of readmission to the same hospital according to the definition of Swiss-DRG, i.e. within 18 days after hospital discharge, was available for each hospitalisation. Length of hospital stay was calculated based on Swiss-DRG definition by day of admission and each subsequent day without the day of discharge.
We stratified sociodemographic characteristics and covariates by the four NSOs. Discrete variables were expressed as frequency (percentage) and continuous variables as medians and interquartile ranges (IQR). We used International Classification of Diseases (ICD) 10 codes to create variables to indicate whether patients experienced a NSO during their hospital stay using algorithms previously developed by Needleman, Buerhaus [44] and used in similar research projects [20, 27]. For example, a hospital-acquired pressure ulcer (≥ stage II) was identified for any patient who had a secondary diagnosis code of L89 (inclusion criteria – see table 1) unless they had a length of stay <4 days, a major diagnostic category of 9 or a diagnosis code between G80-G83. These exclusion criteria are described in figure 1 (second level). The Charlson Comorbidity Index was calculated using the Stata command "charlson" [45].
To assess associations between predictors, covariates and NSOs, we performed logistic regression models. The area under the receiver operating characteristic curve (AUC) was used as a measure of discrimination. To ensure higher generalisability of the results and to avoid overfitting, we used a split dataset approach by performing a random 80:20 split of the data into a training set and a test set, respectively, while maintaining the proportion of outcomes within each of the two samples. The model fit by decile (estimated and observed probabilities) was plotted for each model (see figures A-1–A-4 in the appendix). We used likelihood-ratio tests (LR) to compare models with all predefined covariates with restricted models. For the benchmark comparison, data from a single hospital were compared with those of the remaining six hospitals. For this purpose, we used logistic regression models and reported the crude and adjusted odds ratios as measures of association. We considered a two-tailed P-value at a 5% alpha level for statistical significance. Statistical analyses were performed using Stata 15.1 (StataCorp, College Station, TX, USA). All results are presented in an anonymous form to avoid identification of an individual hospital.
All patients were informed by a flyer about their study participation after admission. As a quality improvement and control study, the institutional review board (IRB) of Northwestern Switzerland approved the study and waived the need for individual informed consent by formulating a declaration of no objection (AG/SO 2009/074 and EKNZ BASEC PB_2017–00449).
Of 45,146 hospitalisations, we excluded 8,997 with a length of hospital stay <24 h or >90 days, age <18 years, ICU stay or due to missing ICD-10 diagnosis resulting in 36,149 hospitalisations for the final analysis (see figure 1). There were no other missing data besides the ones mentioned. The median age of the overall population was 73 years (IQR 59–82); 51.9% were male and 80.3% were Swiss residents. The most common reasons for hospital admission regarding MDC were diseases of the circulatory system (n = 8873, 24.5%) and diseases of the respiratory system (n = 5008, 13.9%). Within this sample, 436 patients experienced a hospital-acquired pressure ulcer (≥ stage 2), 2,412 experienced a hospital-acquired urinary tract infection, 339 had a non-ventilator hospital-acquired pneumonia, and 1,525 died in the hospital. Further baseline characteristics are shown in table 2.
Table 2Baseline characteristics of the study sample.
| Overall n = 36'149 | Hospital-acquired pressure ulcer (≥ stage II) n = 436 | Hospital-acquired urinary tract infection n = 2412 | Non-ventilator hospital-acquired pneumonia n = 339 | In-hospital mortality n = 1525 | |
| Incidence rate (%) | 12.4% | 1.9% | 7.1% | 1.1% | 4.2% |
| Socio-demographics | |||||
| Age, median (IQR) | 73.0 (59.0, 82.0) | 80.0 (71.0, 87.0) | 80.0 (72.0, 86.0) | 78.0 (68.0, 85.0) | 80.0 (69.0, 87.0) |
| Male gender (%) | 18'764 (51.9%) | 211 (48.4%) | 762 (31.6%) | 207 (61.1%) | 827 (54.2%) |
| Swiss resident (%) | 29'039 (80.3%) | 380 (87.2%) | 2072 (86.0%) | 290 (85.5%) | 1309 (85.8%) |
| Private insurance (%) | 7690 (21.3%) | 114 (26.2%) | 549 (22.8%) | 62 (18.3%) | 319 (20.6%) |
| Year of admission | |||||
| 2017 | 10'531 (29.1%) | 140 (32.1%) | 743 (30.8%) | 99 (29.2%) | 461 (30.2%) |
| 2018 | 23'933 (66.2%) | 277 (63.5%) | 1572 (65.2%) | 224 (66.1%) | 974 (63.9%) |
| 2019 | 1685 (4.7%) | 19 (4.4%) | 97 (4.0%) | 16 (4.7%) | 90 (5.9%) |
| Morbidity | |||||
| Major diagnostic category (ICD-10) | |||||
| I – Certain infectious and parasitic diseases | 2694 (7.5%) | 46 (10.6%) | 232 (9.6%) | 29 (8.6%) | 143 (9.4%) |
| II –Neoplasms | 3255 (9.0%) | 72 (16.5%) | 282 (11.7%) | 89 (26.3%) | 593 (38.9%) |
| VI –Diseases of the nervous system | 2848 (7.9%) | 26 (6.0%) | 212 (8.8%) | 21 (6.2%) | 22 (1.4%) |
| IX – Diseases of the circulatory system | 8873 (24.5%) | 74 (17.0%) | 630 (26.1%) | 97 (28.6%) | 383 (25.1%) |
| X – Diseases of the respiratory system | 5008 (13.9%) | 70 (16.1%) | 279 (11.6%) | – | 156 (10.2%) |
| XI – Diseases of the digestive system | 3175 (8.8%) | 26 (6.0%) | 189 (7.8%) | 24 (7.1%) | 70 (4.6%) |
| XVIII – Symptoms, signs and abnormal clinical and laboratory findings, not elsewhere classified | 2142 (5.9%) | 9 (2.1%) | 99 (4.1%) | 9 (2.7%) | 32 (2.1%) |
| Others | 8151 (22.5%) | 113 (25.9%) | 489 (20.3%) | 70 (20.7%) | 126 (8.3%) |
| Comorbidities | |||||
| Hypertension | 18241 (50.5%) | 242 (55.5%) | 1481 (61.4%) | 202 (59.6%) | 623 (40.9%) |
| Obesity | 1213 (3.4%) | 11 (2.5%) | 100 (4.1%) | 4 (1.2%) | 22 (1.4%) |
| Type 2 diabetes mellitus | 6212 (17.2%) | 119 (27.3%) | 510 (21.1%) | 64 (18.9%) | 234 (15.3%) |
| Type 1 diabetes mellitus | 155 (0.4%) | 3 (0.7%) | 11 (0.5%) | 1 (0.3%) | 2 (0.1%) |
| Dyslipidaemia | 6138 (17.0%) | 49 (11.2%) | 360 (14.9%) | 29 (8.6%) | 101 (6.6%) |
| Coronary artery disease | 7386 (20.4%) | 92 (21.1%) | 481 (19.9%) | 81 (23.9%) | 251 (16.5%) |
| Myocardial infarction | 400 (1.1%) | 9 (2.1%) | 40 (1.7%) | 7 (2.1%) | 49 (3.2%) |
| Congestive heart failure | 4458 (12.3%) | 81 (18.6%) | 446 (18.5%) | 87 (25.7%) | 349 (22.9%) |
| Atrial fibrillation | 6722 (18.6%) | 125 (28.7%) | 638 (26.5%) | 99 (29.2%) | 361 (23.7%) |
| Peripheral arterial disease | 1736 (4.8%) | 55 (12.6%) | 149 (6.2%) | 17 (5.0%) | 77 (5.0%) |
| Obstructive sleep apnoea syndrome | 948 (2.6%) | 8 (1.8%) | 59 (2.4%) | 7 (2.1%) | 21 (1.4%) |
| Cerebrovascular diseases | 2501 (6.9%) | 22 (5.0%) | 234 (9.7%) | 37 (10.9%) | 107 (7.0%) |
| Stroke | 220 (0.6%) | 2 (0.5%) | 32 (1.3%) | 7 (2.1%) | 24 (1.6%) |
| Chronic obstructive pulmonary disease | 2208 (6.1%) | 32 (7.3%) | 135 (5.6%) | 47 (13.9%) | 113 (7.4%) |
| Gastrointestinal disorder | 7550 (20.9%) | 119 (27.3%) | 594 (24.6%) | 98 (28.9%) | 385 (25.2%) |
| Solid tumours | 3642 (10.1%) | 80 (18.3%) | 293 (12.1%) | 75 (22.1%) | 542 (35.5%) |
| Haematological malignancies | 563 (1.6%) | 12 (2.8%) | 30 (1.2%) | 7 (2.1%) | 25 (1.6%) |
| Musculoskeletal disorder | 7046 (19.5%) | 116 (26.6%) | 631 (26.2%) | 95 (28.0%) | 196 (12.9%) |
| Mental disorder | 9154 (25.3%) | 166 (38.1%) | 850 (35.2%) | 121 (35.7%) | 309 (20.3%) |
| Alcohol addiction | 1887 (5.2%) | 21 (4.8%) | 98 (4.1%) | 26 (7.7%) | 44 (2.9%) |
| Charlson Comorbidity Index, mean (SD) | 2.3 (2.6) | 3.6 (3.0) | 3.0 (2.7) | 3.6 (3.1) | 4.7 (3.5) |
| Living situation | |||||
| Before admission | |||||
| At home (%) | 29874 (82.6%) | 229 (52.5%) | 1605 (66.5%) | 279 (62.4%) | 1067 (70.0%) |
| After discharge | |||||
| At home (%) | 25294 (70.0%) | 119 (27.3%) | 1136 (47.1%) | 137 (30.6%) | 0 (0%) |
| Clinical outcomes | |||||
| Length of hospital stay, median (IQR) | 5.0 (3.0, 9.0) | 11.0 (7.0, 17.0) | 9.0 (5.0, 13.0) | 12.0 (8.0, 19.0) | 5.0 (2.0, 10.0) |
| In-hospital mortality | 1525 (4.2%) | 74 (17.0%) | 148 (6.1%) | 67 (15.0%) | 1525 (100.0%) |
| Readmission* | 962 (2.7%) | 18 (4.1%) | 92 (3.8%) | 36 (8.1%) | 0 (0%) |
*as defined by SwissDRG (within 18 days after discharge)
Figure 1 Flow chart of study patients.
Most predefined covariates showed a significant association with the corresponding NSO (Table 3). In-hospital death (OR 3.75 [95% CI: 2.80–5.00]), peripheral vascular disease present (OR 1.59 [95% CI: 1.22–2.07]), and present pressure ulcer stage I (OR 7.00 [95% CI: 4.90–9.90]) were strongest associated with the NSO hospital-acquired pressure ulcer (≥ stage II). Gender, MDC and type of hospital did not show any significant association with hospital-acquired pressure ulcer (≥ stage II) and have been removed from the model, based on an LR test (p = 0.17). The development of a hospital-acquired urinary tract infection was most strongly associated with gender (OR for male gender 0.41 [95% CI: 0.37–0.45]) and paraplegia presence (OR 3.10 [95% CI: 2.08–4.62]). Change in Charlson Comorbidity Index, and type of hospital did not show any significant association with hospital-acquired urinary tract infections and have been removed from the model, based on an LR test (p = 0.09). With regards to the NSO of hospital-acquired pneumonia (for non-ventilator patients), we found the strongest association with gender (OR for male gender 1.53 [95% CI: 1.22–1.92]), the living situation before hospital admission (OR 0.43 [95% CI: 0.34–0.55]) and rehospitalisation (OR 2.34 [95% CI: 1.44–3.82]). MDC did not show any significant association with the NSO and has been removed from the model, based on an LR test (p = 0.11). Concerning the NSO of in-hospital mortality, we found the strongest association with the MDC "myeloproliferative Disease & Disorders" (OR 3.90 [95% CI: 3.26–4.67]) and the living situation before hospital admission (OR 0.58 [95% CI: 0.51–0.67]). Gender did not show any significant association with the NSO and has been removed from the model, based on an LR test (p = 0.05).
All final models showed a good AUC in both the training set (AUC range: 0.75–0.84) and the test set (AUC range: 0.77–0.81), respectively. We did not observe a decrease in discrimination between the training and test sets (p >0.05) (table 3).
Table 3Adjustment model per nursing-sensitive outcome.
| Outcome | Covariates | Odds ratio (95% CI)*** | AUC (95% CI) training set*** | AUC (95% CI) test set*** | P value** | % Correctly classified |
| Hospital-acquired pressure ulcer (stage II or greater) | Age | 1.02 (1.02–1.03) | 0.78 (0.76–0.81) | 0.77 (0.72–0.82) | 0.82 | 98% |
| Charlson Comorbidity Index | 1.04 (1.00–1.08) | |||||
| Diabetes present | 1.40 (1.12–1.75) | |||||
| Gender* | 0.87 (0.71–1.06) | |||||
| In-hospital death | 3.75 (2.80–5.00) | |||||
| Length of stay | 1.06 (1.05–1.07) | |||||
| Major Diagnostic Category* | 1.01 (0.99–1.04) | |||||
| Peripheral vascular disease present | 1.59 (1.22–2.07) | |||||
| Pressure ulcer stage I present | 7.00 (4.90–9.90) | |||||
| Urinary tract infection | 1.50 (1.15–1.96) | |||||
| Type of hospital* | 1.12 (0.97–1.29) | |||||
| Hospital-acquired urinary tract infection | Age | 1.04 (1.04–1.05) | 0.76 (0.75–0.77) | 0.75 (0.72–0.77) | 0.63 | 93% |
| Charlson Comorbidity Index* | 1.01 (0.99–1.03) | |||||
| Diabetes present | 1.18 (1.06–1.33) | |||||
| Gender | 0.41 (0.37–0.45) | |||||
| Length of stay | 1.07 (1.06–1.07) | |||||
| Major Diagnostic Category | 0.96 (0.95–0.97) | |||||
| Paraplegia present | 3.10 (2.08–4.62) | |||||
| Type of hospital* | 1.06 (0.99–1.13) | |||||
| In-hospital mortality | Age | 1.05 (1.04-1.05) | 0.81 (0.80–0.83) | 0.81 (0.78–0.83) | 0.58 | 99% |
| Charlson Comorbidity Index | 1.14 (1.11–1.16) | |||||
| Gender* | 1.08 (0.97–1.20) | |||||
| Length of stay | 0.97 (0.97–0.98) | |||||
| Major Diagnostic Category "Myeloproliferative Diseases & Disorders" | 3.90 (3.26–4.67) | |||||
| Major Diagnostic Category | 0.95 (0.93–0.97) | |||||
| Living situation before hospital admission | 0.58 (0.51–0.67) | |||||
| Type of hospital | 0.76 (0.71–0.82) | |||||
| (Non-ventilator)hospital-acquired pneumonia | Age | 1.03 (1.02–1.04) | 0.84 (0.82–0.87) | 0.81 (0.76–0.86) | 0.18 | 99% |
| Charlson Comorbidity Index | 1.09 (1.05–1.12) | |||||
| Gender | 1.53 (1.22–1.92) | |||||
| Length of stay | 1.09 (1.08–1.10) | |||||
| Living situation before hospital admission | 0.43 (0.34–0.55) | |||||
| Major Diagnostic Category* | 0.98 (0.95–1.01) | |||||
| Rehospitalisation | 2.34 (1.44–3.82) | |||||
| Type of hospital | 1.36 (1.13–1.62) |
*Removed from the final training & test sets based on the results of a LR test
** Association between training and test sets
*** Excluding the variables that have been removed after the LR test
While the prevalence of hospital-acquired pressure ulcer (≥ stage II) was lower in hospital A and higher in hospital F, there were no differences among the remaining hospitals. Hospitals C and D showed a higher prevalence of hospital-acquired urinary tract infection, while hospitals B, F, and G showed a lower prevalence and two hospitals (A and E) showed no difference compared to the other hospitals included. When comparing with the six remaining hospitals, in-hospital mortality was lower in hospitals B, E, F and G and higher in hospitals A and C, respectively. Prevalence of hospital-acquired pneumonia was lower in hospitals A, E, F and G, but higher in hospital C (figure 2).
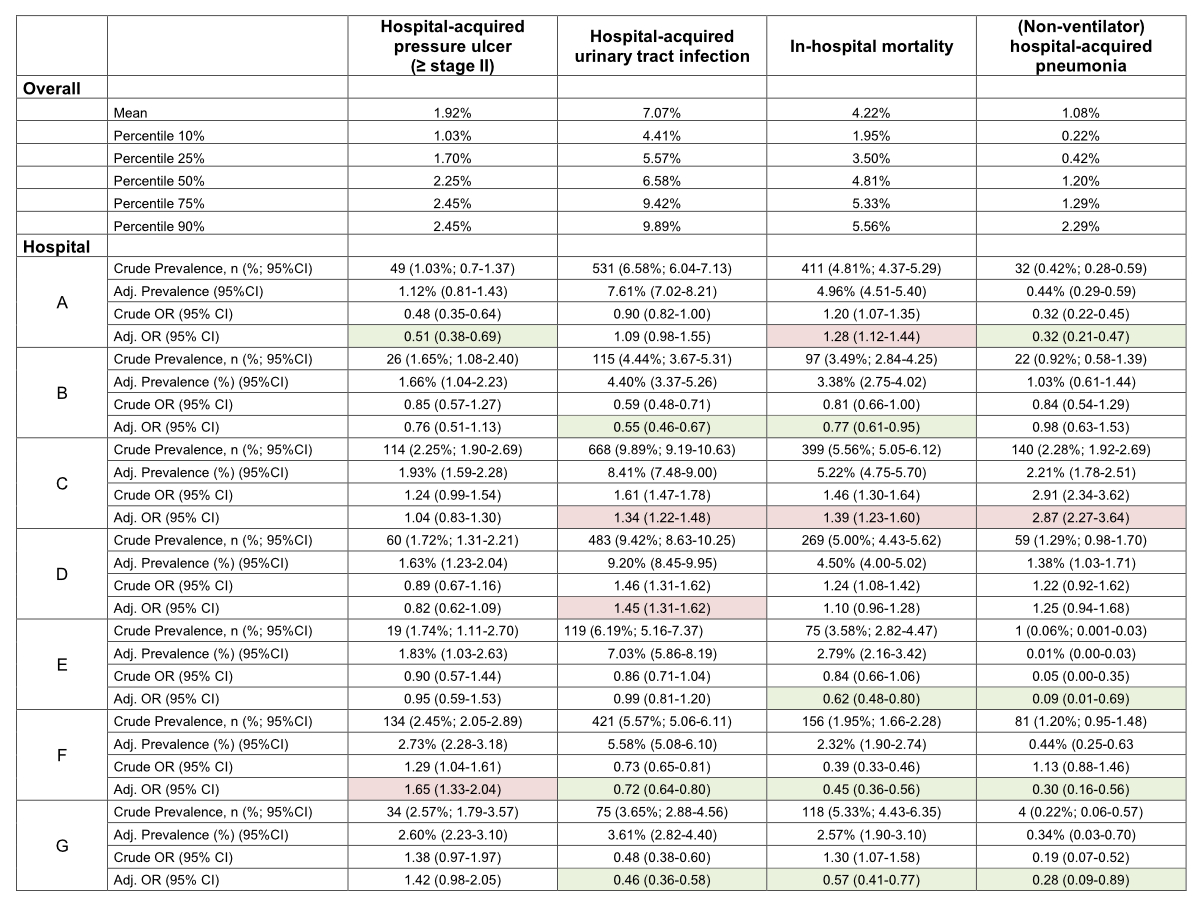
Figure 2 Crude and adjusted association of the nursing-sensitive outcomes between the participating hospitals.
Marked green: significantly lower odds compared to all other hospitals
Marked red: significantly higher odds compared to all other hospitals
The key findings of this study are two-fold: first, the derived and validated prediction models showed a good discrimination ability for four well-studied NSOs (hospital-acquired pressure ulcer (≥ stage II), hospital-acquired urinary tract infection, non-ventilator hospital-acquired pneumonia, and in-hospital mortality). Second, we found relevant variation in risk of achieving an adverse NSO, suggesting that the outcome-related quality of nursing care differs among the investigated hospitals.
The indicators presented in this study may help to compare quality of care between NSOs of different hospitals using uniformly defined administrative data. This approach allows a timely evaluation of the results without additional effort for data generation. Internationally, mainly administrative data is used in the development of NSO-sets. A recent example is the nursing-sensitive outcome indicator suite for monitoring public patient safety in Western Australia, which was shown to be methodologically robust [46]. These results are largely consistent with the C-statistics in our study, confirming the external validity of our results.
Regarding hospital-acquired pressure ulcer (≥ stage II), we found little variance between the hospitals. On the one hand, the reason may be missing data due to underreporting [47]. Although, cross-sectional surveys by the ANQ showed similar but even lower prevalence rates (1.8%) compared to our study data (1.92%). It has been reported that administrative data do not provide valid data for this NSO due to several reasons [48–50]. This fact seems to be confirmed in our data, as we would expect prevalence rates of five percent or higher [51, 52]. Therefore, before using administrative data to calculate the frequency of this NSO, we recommend reviewing the guideline-compliant documentation of the NSO in the electronic documentations as well as the coding procedure. On the other hand, it is important that the selected outcomes also have a clinically relevant frequency and variability. Otherwise, they offer no benefit in terms of quality development. Regarding hospital-acquired urinary tract infection the measured prevalence in our cohort (6.78%) is consistent with the expected prevalence (between 5.1 and 9.4% [53]), so we do not expect relevant under- or over-recording in the administrative data used.
With regards to the application of the developed method as a benchmark comparison by means of real-world data, two hospitals (B and E) showed a tendency towards lower risks in all NSOs, with some being statistically significant. Other hospitals, however, had higher risks of all (C) or almost all (D) NSOs, again with some reaching statistical significance. While our results should not be used for judging on a hospital’s quality per se, it may provide an overview nevertheless which is notably more comprehensive than reporting individual outcomes based on cross-sectional surveys. For future studies, evaluations at the ward level are needed so that it can be investigated whether the prevalence and variation of the outcomes show relevant differences between the wards. Results on this level may support decision makers to reevaluate their pathways in providing care and thus to improve quality of nursing care. Nursing-related reasons for the differing frequency of negative outcomes could be, for example, an inadequate skill and grade mix, staffing ratios, or insufficiently planned or standardisednursing processes [54].
The strength of this study is the large sample size. While this study covers hospitals from different regions in Switzerland, results might be generalisedat a larger level. However, the results of this study must be interpreted in the context of the study design. First, the use of administrative data is prone to information bias as hospitalisations will be selected according to the ICD-10 codes with the risk of misclassification and underreporting of diagnoses. Thus, frequency of NSO is usually underestimated, especially due to its low financial relevance [55, 56]. Second, we did not have severity estimates of the hospitalised cases. Third, the non-experimental, observational design of our study limits the ability to draw a firm causal link. Fourth, since we do not have information about clinical parameters, we will be unable to account for unmeasured residual confounding and we were limited in selecting all appropriate covariates for the models. Fifth, we did not have data on nurse staffing in the study period. Sixth, external validation of our models is needed in follow-up studies.
The application of risk adjustment when comparing quality of nursing care enables a more objective assessment across hospitals or wards with heterogeneous patient populations. This approach has potential to establish a set of benchmarks allowing comparison of quality of nursing care between different hospitals or wards with manageable effort.
The data that support the findings of this study are available from the corresponding author, [DK], upon reasonable request.
Authors' contributions: PS and BM were the initiators and scientific project leaders. DK, AK contributed to the data collection. DK, AK, TV, CG, AC, MK, PS and BM participated in the conception and design of the study, contributed methodical expertise, and performed statistical analysis. DK wrote the manuscript, which was revised and approved by all authors.
This trial is funded by the Swiss National Science Foundation (National Research Program (NRP 74), 407440_167376), the research council (Grant 1410.000.086) and the “Wissenschaft & Weiterbildung” (W&W) Fonds (140.000.495) of the Kantonsspital Aarau, and the “Hugo und Elsa Isler Fonds” of the “Argovian Department of Health and SocialAffairs”. The funders had no role in data collection, analysis, interpretation, writing of the manuscript and the decision to submit.
All authors have completed and submitted the International Committee of Medical Journal Editors form for disclosure of potential conflicts of interest. No potential conflict of interest was disclosed.
1. Needleman J , Buerhaus P , Mattke S , Stewart M , Zelevinsky K . Nurse-staffing levels and the quality of care in hospitals. N Engl J Med. 2002 May;346(22):1715–22. https://doi.org/10.1056/NEJMsa012247
2. Kane RL , Shamliyan TA , Mueller C , Duval S , Wilt TJ . The association of registered nurse staffing levels and patient outcomes: systematic review and meta-analysis. Med Care. 2007 Dec;45(12):1195–204. https://doi.org/10.1097/MLR.0b013e3181468ca3
3. Needleman J , Buerhaus P , Pankratz VS , Leibson CL , Stevens SR , Harris M . Nurse staffing and inpatient hospital mortality. N Engl J Med. 2011 Mar;364(11):1037–45. https://doi.org/10.1056/NEJMsa1001025
4. Aiken LH , Sermeus W , Van den Heede K , Sloane DM , Busse R , McKee M , et al. Patient safety, satisfaction, and quality of hospital care: cross sectional surveys of nurses and patients in 12 countries in Europe and the United States. BMJ. 2012 Mar;344 mar20 2:e1717. https://doi.org/10.1136/bmj.e1717
5. Aiken LH , Clarke SP , Sloane DM , Sochalski J , Silber JH . Hospital nurse staffing and patient mortality, nurse burnout, and job dissatisfaction. JAMA. 2002 Oct;288(16):1987–93. https://doi.org/10.1001/jama.288.16.1987
6. Driscoll A , Grant MJ , Carroll D , Dalton S , Deaton C , Jones I , et al. The effect of nurse-to-patient ratios on nurse-sensitive patient outcomes in acute specialist units: a systematic review and meta-analysis. Eur J Cardiovasc Nurs. 2018 Jan;17(1):6–22. https://doi.org/10.1177/1474515117721561
7. Oner B , Zengul FD , Oner N , Ivankova NV , Karadag A , Patrician PA . Nursing-sensitive indicators for nursing care: A systematic review (1997-2017). Nurs Open. 2021 May;8(3):1005–22. https://doi.org/10.1002/nop2.654
8. Doran D. Functional Status. Nursing-sensitive Outcomes: state of the science. Londom: Jones and Bartlett Publishers International. 2003.
9. Doran DM , Harrison MB , Laschinger HS , Hirdes JP , Rukholm E , Sidani S , et al. Nursing-sensitive outcomes data collection in acute care and long-term-care settings. Nurs Res. 2006 Mar-Apr;55(2 Suppl):S75–81. https://doi.org/10.1097/00006199-200603001-00012
10. Sim J , Crookes P , Walsh K , Halcomb E . Measuring the outcomes of nursing practice: A Delphi study. J Clin Nurs. 2018 Jan;27(1-2):e368–78. https://doi.org/10.1111/jocn.13971
11. Sim J , Joyce-McCoach J , Gordon R , Kobel C . Development of a data registry to evaluate the quality and safety of nursing practice. J Adv Nurs. 2019 Sep;75(9):1877–88. https://doi.org/10.1111/jan.13967
12. Dubois CA , D’amour D , Brault I , Dallaire C , Déry J , Duhoux A , et al. Which priority indicators to use to evaluate nursing care performance? A discussion paper. J Adv Nurs. 2017 Dec;73(12):3154–67. https://doi.org/10.1111/jan.13373
13. Connolly D , Wright F . The nursing quality indicator framework tool. Int J Health Care Qual Assur. 2017 Aug;30(7):603–16. https://doi.org/10.1108/IJHCQA-08-2016-0113
14. National Quality Forum . National Voluntary Consensus Standards for Nursing-Sensitive Care: An Initial Performance Measure Set2004.
15. Hannah K , White PA , Kennedy MA , Hammell N , editors . C-HOBIC–standardized information to support clinical practice and quality patient care across Canada. NI 2012: 11th International Congress on Nursing Informatics, June 23-27, 2012, Montreal, Canada; 2012: American Medical Informatics Association.
16. Dubois C-A , D’Amour D , Pomey M-P , Girard F , Brault I . Conceptualizing performance of nursing care as a prerequisite for better measurement: a systematic and interpretive review. 2013.
17. Paulsen RA . Taking nurse staffing research to the unit level. Nurs Manage. 2018 Jul;49(7):42–8. https://doi.org/10.1097/01.NUMA.0000538915.53159.b5
18. Kutz A , Koch D , Conca A , Baechli C , Haubitz S , Regez K , et al. Integrative hospital treatment in older patients to benchmark and improve outcome and length of stay - the In-HospiTOOL study. BMC Health Serv Res. 2019 Apr;19(1):237. https://doi.org/10.1186/s12913-019-4045-x
19. Charlson ME , Pompei P , Ales KL , MacKenzie CR . A new method of classifying prognostic comorbidity in longitudinal studies: development and validation. J Chronic Dis. 1987;40(5):373–83. https://doi.org/10.1016/0021-9681(87)90171-8
20. Twigg DE , Gelder L , Myers H . The impact of understaffed shifts on nurse-sensitive outcomes. J Adv Nurs. 2015 Jul;71(7):1564–72. https://doi.org/10.1111/jan.12616
21. Twigg DE , Geelhoed EA , Bremner AP , Duffield CM . The economic benefits of increased levels of nursing care in the hospital setting. J Adv Nurs. 2013 Oct;69(10):2253–61. https://doi.org/10.1111/jan.12109
22. Maas ML , Johnson M , Moorhead S . Classifying nursing-sensitive patient outcomes. Image J Nurs Sch. 1996;28(4):295–301. https://doi.org/10.1111/j.1547-5069.1996.tb00377.x
23. Griffiths P , Jones S , Maben J , Murrells T . State of the art metrics for nursing: a rapid appraisal. London: King’s College London; 2008.
24. Recio-Saucedo A , Dall’Ora C , Maruotti A , Ball J , Briggs J , Meredith P , et al. What impact does nursing care left undone have on patient outcomes? Review of the literature. J Clin Nurs. 2018 Jun;27(11-12):2248–59. https://doi.org/10.1111/jocn.14058
25. Schubert M , Glass TR , Clarke SP , Aiken LH , Schaffert-Witvliet B , Sloane DM , et al. Rationing of nursing care and its relationship to patient outcomes: the Swiss extension of the International Hospital Outcomes Study. Int J Qual Health Care. 2008 Aug;20(4):227–37. https://doi.org/10.1093/intqhc/mzn017
26. Schubert M , Clarke SP , Glass TR , Schaffert-Witvliet B , De Geest S . Identifying thresholds for relationships between impacts of rationing of nursing care and nurse- and patient-reported outcomes in Swiss hospitals: a correlational study. Int J Nurs Stud. 2009 Jul;46(7):884–93. https://doi.org/10.1016/j.ijnurstu.2008.10.008
27. Twigg D , Duffield C , Bremner A , Rapley P , Finn J . The impact of the nursing hours per patient day (NHPPD) staffing method on patient outcomes: a retrospective analysis of patient and staffing data. Int J Nurs Stud. 2011 May;48(5):540–8. https://doi.org/10.1016/j.ijnurstu.2010.07.013
28. Butler M , Collins R , Drennan J , Halligan P , O’Mathúna DP , Schultz TJ , et al. Hospital nurse staffing models and patient and staff-related outcomes. Cochrane Database Syst Rev. 2011 Jul;(7):CD007019. https://doi.org/10.1002/14651858.CD007019.pub2
29. Soban LM , Hempel S , Munjas BA , Miles J , Rubenstein LV . Preventing pressure ulcers in hospitals: A systematic review of nurse-focused quality improvement interventions. Jt Comm J Qual Patient Saf. 2011 Jun;37(6):245–52. https://doi.org/10.1016/S1553-7250(11)37032-8
30. Lankshear AJ , Sheldon TA , Maynard A . Nurse staffing and healthcare outcomes: a systematic review of the international research evidence. ANS Adv Nurs Sci. 2005 Apr-Jun;28(2):163–74. https://doi.org/10.1097/00012272-200504000-00008
31. Fuchs MA , Sexton DJ , Thornlow DK , Champagne MT . Evaluation of an evidence-based, nurse-driven checklist to prevent hospital-acquired catheter-associated urinary tract infections in intensive care units. J Nurs Care Qual. 2011 Apr-Jun;26(2):101–9. https://doi.org/10.1097/NCQ.0b013e3181fb7847
32. Bernard MS , Hunter KF , Moore KN . A review of strategies to decrease the duration of indwelling urethral catheters and potentially reduce the incidence of catheter-associated urinary tract infections. Urol Nurs. 2012 Jan-Feb;32(1):29–37. https://doi.org/10.7257/1053-816X.2012.32.1.29
33. Ausserhofer D , Schubert M , Desmedt M , Blegen MA , De Geest S , Schwendimann R . The association of patient safety climate and nurse-related organizational factors with selected patient outcomes: a cross-sectional survey. Int J Nurs Stud. 2013 Feb;50(2):240–52. https://doi.org/10.1016/j.ijnurstu.2012.04.007
34. Kovner C , Jones C , Zhan C , Gergen PJ , Basu J . Nurse staffing and postsurgical adverse events: an analysis of administrative data from a sample of U.S. hospitals, 1990-1996. Health Serv Res. 2002 Jun;37(3):611–29. https://doi.org/10.1111/1475-6773.00040
35. Cho SH , Ketefian S , Barkauskas VH , Smith DG . The effects of nurse staffing on adverse events, morbidity, mortality, and medical costs. Nurs Res. 2003 Mar-Apr;52(2):71–9. https://doi.org/10.1097/00006199-200303000-00003
36. Carryer JB , Diers D , McCloskey B , Wilson D . Effects of health policy reforms on nursing resources and patient outcomes in New Zealand. Policy Polit Nurs Pract. 2010 Nov;11(4):275–85. https://doi.org/10.1177/1527154410393360
37. Weissman JS , Rothschild JM , Bendavid E , Sprivulis P , Cook EF , Evans RS , et al. Hospital workload and adverse events. Med Care. 2007 May;45(5):448–55. https://doi.org/10.1097/01.mlr.0000257231.86368.09
38. Mattke S , Needleman J , Buerhaus P , Stewart M , Zelevinsky K . Evaluating the role of patient sample definitions for quality indicators sensitive to nurse staffing patterns. Med Care. 2004 Feb;42(2 Suppl):II21–33. https://doi.org/10.1097/01.mlr.0000109124.90702.8b
39. Tourangeau AE , Giovannetti P , Tu JV , Wood M . Nursing-related determinants of 30-day mortality for hospitalized patients. Can J Nurs Res. 2002 Mar;33(4):71–88.
40. Estabrooks CA , Midodzi WK , Cummings GG , Ricker KL , Giovannetti P . The impact of hospital nursing characteristics on 30-day mortality. Nurs Res. 2005 Mar-Apr;54(2):74–84. https://doi.org/10.1097/00006199-200503000-00002
41. Tourangeau AE , Doran DM , McGillis Hall L , O’Brien Pallas L , Pringle D , Tu JV , et al. Impact of hospital nursing care on 30-day mortality for acute medical patients. J Adv Nurs. 2007 Jan;57(1):32–44. https://doi.org/10.1111/j.1365-2648.2006.04084.x
42. Kelly DM , Kutney-Lee A , McHugh MD , Sloane DM , Aiken LH . Impact of critical care nursing on 30-day mortality of mechanically ventilated older adults. Crit Care Med. 2014 May;42(5):1089–95. https://doi.org/10.1097/CCM.0000000000000127
43. Federal Statistical Office (FSO) . Variablen der Medizinischen Statistik, Spezifikationen gültig ab 1.1.2019. 2018.
44. Needleman J , Buerhaus P , Mattke S , Stewart M , Zelevinsky K . Nurse staffing and patient outcomes in hospitals. Final report. Rockville, MD: Health Resources and Services Administration, US Department of Health and Human Services. 2001.
45. Stagg V. CHARLSON: Stata module to calculate Charlson index of comorbidity. 2017.
46. Twigg DE , Pugh JD , Gelder L , Myers H . Foundations of a nursing-sensitive outcome indicator suite for monitoring public patient safety in Western Australia. Collegian. 2016;23(2):167–81. https://doi.org/10.1016/j.colegn.2015.03.007
47. Smith IL , Nixon J , Brown S , Wilson L , Coleman S . Pressure ulcer and wounds reporting in NHS hospitals in England part 1: audit of monitoring systems. J Tissue Viability. 2016 Feb;25(1):3–15. https://doi.org/10.1016/j.jtv.2015.11.001
48. Swiss National Association for Quality Development in Hospitals and Clinics . Sturz und Dekubitus Akutsomatik Erwachsene - Nationaler Vergleichsbericht2019.
49. Ho C , Jiang J , Eastwood CA , Wong H , Weaver B , Quan H . Validation of two case definitions to identify pressure ulcers using hospital administrative data. BMJ Open. 2017 Aug;7(8):e016438. https://doi.org/10.1136/bmjopen-2017-016438
50. Backman C , Vanderloo SE , Miller TB , Freeman L , Forster AJ . Comparing physical assessment with administrative data for detecting pressure ulcers in a large Canadian academic health sciences centre. BMJ Open. 2016 Oct;6(10):e012490. https://doi.org/10.1136/bmjopen-2016-012490
51. Tubaishat A , Papanikolaou P , Anthony D , Habiballah L . Pressure Ulcers Prevalence in the Acute Care Setting: A Systematic Review, 2000-2015. Clin Nurs Res. 2018 Jul;27(6):643–59. https://doi.org/10.1177/1054773817705541
52. Tomova-Simitchieva T , Akdeniz M , Blume-Peytavi U , Lahmann N , Kottner J . [The Epidemiology of Pressure Ulcer in Germany: systematic Review]. Gesundheitswesen. 2019 Jun;81(6):505–12.
53. Öztürk R , Murt A . Epidemiology of urological infections: a global burden. World J Urol. 2020 Nov;38(11):2669–79. https://doi.org/10.1007/s00345-019-03071-4
54. Kalánková D , Kirwan M , Bartoníčková D , Cubelo F , Žiaková K , Kurucová R . Missed, rationed or unfinished nursing care: A scoping review of patient outcomes. J Nurs Manag. 2020 Nov;28(8):1783–97. https://doi.org/10.1111/jonm.12978
55. Jhung MA , Banerjee SN . Administrative coding data and health care-associated infections. Clin Infect Dis. 2009 Sep;49(6):949–55. https://doi.org/10.1086/605086
56. Quan H , Eastwood C , Cunningham CT , Liu M , Flemons W , De Coster C , et al.; IMECCHI investigators . Validity of AHRQ patient safety indicators derived from ICD-10 hospital discharge abstract data (chart review study). BMJ Open. 2013 Oct;3(10):e003716. https://doi.org/10.1136/bmjopen-2013-003716
57. Padula WV , Makic MB , Mishra MK , Campbell JD , Nair KV , Wald HL , et al. Comparative effectiveness of quality improvement interventions for pressure ulcer prevention in academic medical centers in the United States. Jt Comm J Qual Patient Saf. 2015 Jun;41(6):246–56. https://doi.org/10.1016/S1553-7250(15)41034-7
58. Berlowitz DR , Brandeis GH , Morris JN , Ash AS , Anderson JJ , Kader B , et al. Deriving a risk-adjustment model for pressure ulcer development using the Minimum Data Set. J Am Geriatr Soc. 2001 Jul;49(7):866–71. https://doi.org/10.1046/j.1532-5415.2001.49175.x
59. Berlowitz DR , Ash AS , Brandeis GH , Brand HK , Halpern JL , Moskowitz MA . Rating long-term care facilities on pressure ulcer development: importance of case-mix adjustment. Ann Intern Med. 1996 Mar;124(6):557–63. https://doi.org/10.7326/0003-4819-124-6-199603150-00003
60. Letica-Kriegel AS , Salmasian H , Vawdrey DK , Youngerman BE , Green RA , Furuya EY , et al. Identifying the risk factors for catheter-associated urinary tract infections: a large cross-sectional study of six hospitals. BMJ Open. 2019 Feb;9(2):e022137. https://doi.org/10.1136/bmjopen-2018-022137
61. Li F , Song M , Xu L , Deng B , Zhu S , Li X . Risk factors for catheter-associated urinary tract infection among hospitalized patients: A systematic review and meta-analysis of observational studies. J Adv Nurs. 2019 Mar;75(3):517–27. https://doi.org/10.1111/jan.13863
62. Di Pasquale M , Aliberti S , Mantero M , Bianchini S , Blasi F . Non-Intensive Care Unit Acquired Pneumonia: A New Clinical Entity? Int J Mol Sci. 2016 Feb;17(3):287. https://doi.org/10.3390/ijms17030287
63. Sopena N , Heras E , Casas I , Bechini J , Guasch I , Pedro-Botet ML , et al. Risk factors for hospital-acquired pneumonia outside the intensive care unit: a case-control study. Am J Infect Control. 2014 Jan;42(1):38–42. https://doi.org/10.1016/j.ajic.2013.06.021
64. Federal Statistical Office (FSO) . Variablen der Medizinischen Statistik Spezifikationen gültig ab 1.1.2019 2019 14.01.2021. Available from: https://www.bfs.admin.ch/bfs/de/home/statistiken/gesundheit/erhebungen/ms.assetdetail.7066232.html
65. Sabrià M , Sopena N . Nosocomial Pneumonia Outside the Intensive Care Unit. Clin Pulm Med. 2011;18(5):215–21. https://doi.org/10.1097/CPM.0b013e31822c5f19
Table S1 Covariates
| Variable | Description |
| Age | Age at hospital admission (full years) |
| Gender | 1 if male; 0 if female |
| Charlson Comorbidity Index (CCI) | Integer between 0 and 29: The CCI is a method of categorising comorbidities of patients based on the International Classification of Diseases (ICD) diagnosis codes. Each comorbidity category has an associated weight (from 1 to 6), based on the adjusted risk of mortality or resource use, and the sum of all the weights results in a single comorbidity score for a patient. A score of zero indicates that no comorbidities were found. The higher the score, the more likely the predicted outcome will result in mortality or higher resource use (19). |
| Length of hospital stay | Integer between 1 and 90 (see exclusion criteria); Length of stay of one patient = date of discharge - date of admission |
| Major Diagnostic Category according to DRG | Refers to the chapter structure of the Swiss DRG catalog; Coded as integer between 1 and 20. (Example: Main Diagnostic Category "Certain infectious and parasitic diseases" (Chapter 1) = 1.) |
| Type of hospital | According to hospital typology (Swiss Federal Statistical Office); Coded as integer between 1 and 4: |
| K122 = 1 | |
| K121 = 2 | |
| K112 = 3 | |
| K111 = 4 | |
| In-hospital death | 0 = not deceased during hospitalisation |
| 1 = deceased during hospitalisation | |
| Presence of diabetes | 0 = diabetes not present (according to CCI) |
| 1 = diabetes present (according to CCI) | |
| Peripheral vascular disease present | 0 = Peripheral vascular disease not present (according to CCI) |
| 1 = Peripheral vascular disease present (according to CCI) | |
| Presence of a stage I pressure ulcer | 1 = Stage I pressure ulcer present (DRG-codes: L8900; L8901; L8902; L8903; L8904; L8905; L8906; L8907; L8908; L8909) |
| 0 = Stage I pressure ulcer not present | |
| Presence of urinary tract infection | 1 = urinary tract infection present (DRG-codes: T835; N390) |
| 0 = urinary tract infection not present | |
| Living situation before hospital admission | 1 = Lived in own home before hospitalisation (no institution) |
| 0 = Has lived in an institution before admission to hospital (e.g., retirement home, nursing home) | |
| Readmission | 1 = case is readmitted to the same hospital within 18 calendar days of discharge and both cases fall into the same MDC |
| 0 = no readmission that meets the above criteria | |
| MDC "Myeloproliferative Disease & Disorder" present | 1 = Disease from the main Diagnostic category "Myeloproliferative Diseases & Disorders" present. |
| 0 = No disease from the main Diagnostic category "Myeloproliferative Diseases & Disorders" present. |
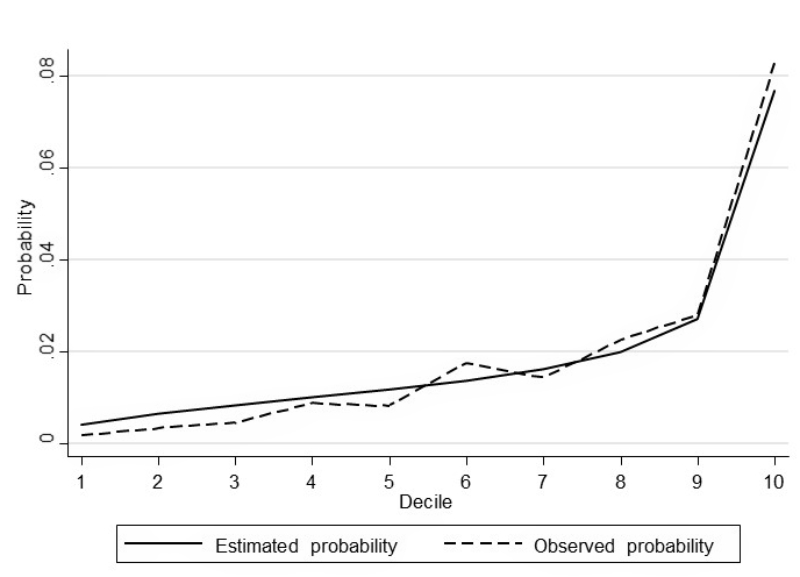
Figure S1 Model fit by decile (hospital-acquired pressure ulcer (≥ stage II).
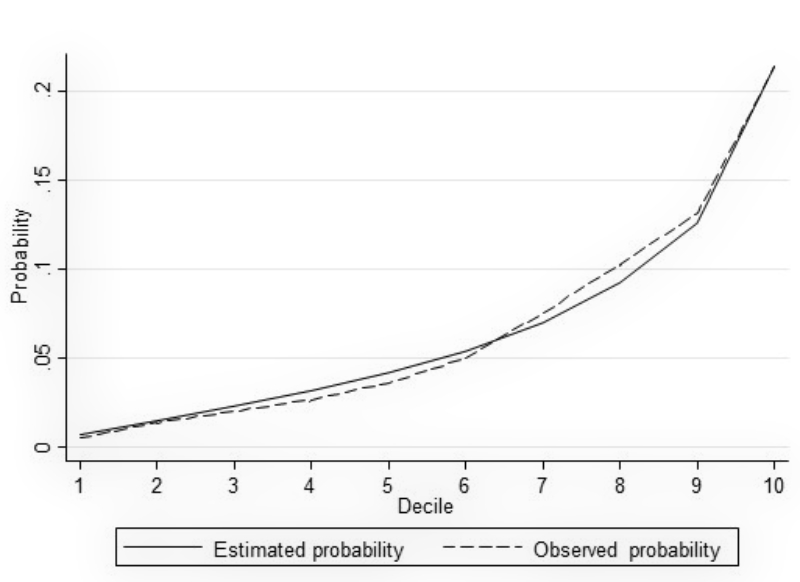
Figure S2 Model fit by decile (hospital-acquired urinary tract infection).
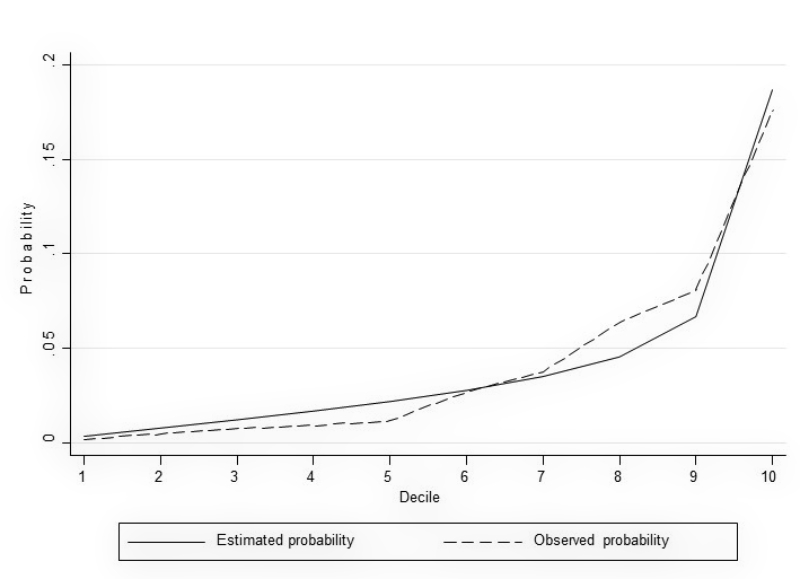
Figure S3 Model fit by decile (in-hospital mortality).
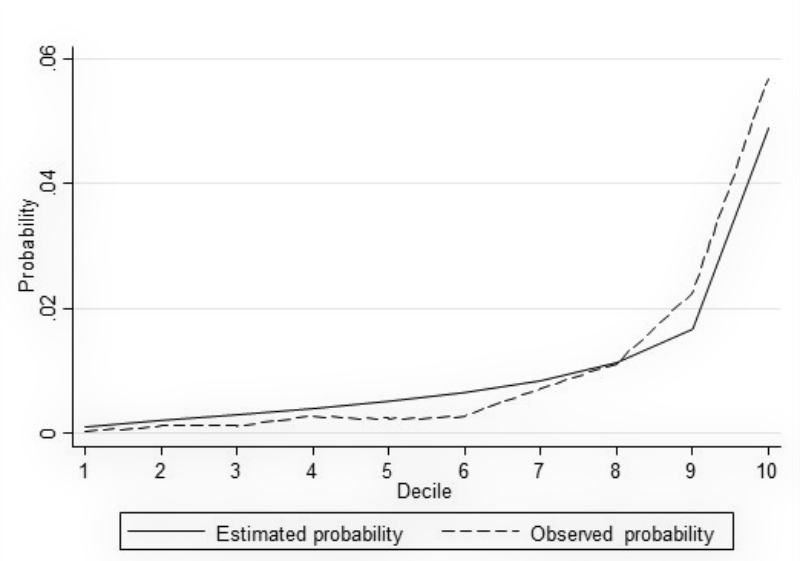
Figure S4 Model fit by decile (non-ventilator hospital-acquired pneumonia).