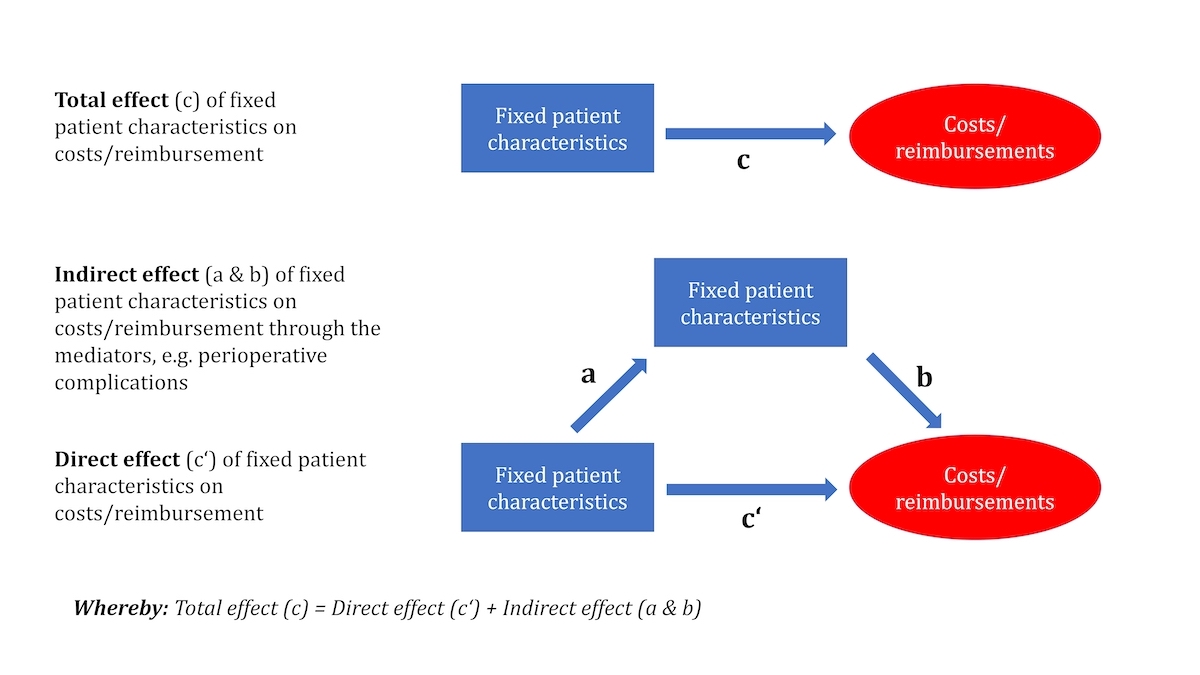
Figure 1 Direct, indirect and total effects on monetary outcomes as calculated using structural equation models. The total effect (c) corresponds to the sum of the direct effects (c') and the indirect effects (a and b).
DOI: https://doi.org/10.4414/SMW.2022.w30135
Multimorbidity is a global health problem in our aging society. It is magnified by lifestyle factors such as obesity, urbanisation, socioeconomic deprivation [1] and the resulting increase in non-communicable diseases. At the same time, the baseline risk status and the resulting complexity of patients undergoing surgical procedures has increased over recent decades [2]. According to a report from Canada [3], over one quarter of total inpatient acute care costs is associated with multimorbid patients, and healthcare costs are rising faster than the gross domestic product (GDP) [4]. This creates pressure to reduce healthcare costs as well as a need for efficient resource allocation.
Risk assessment and personalised management of multimorbid patients are becoming fundamental to assure optimal outcomes, thus lowering healthcare costs. One of these tools is the American Society of Anesthesiologists (ASA) classification [5], which was developed over 60 years ago. Despite several modifications, the ASA classification uses only the single most severe systemic disease to define the ASA class and ignores multimorbidity. The ASA classification has shown a strong association with perioperative mortality and morbidity [2, 6]. Furthermore, it is a strong predictor of surgical adverse events [7] and prolonged hospital intensive care unit (ICU) stay [8]. These perioperative outcomes are important drivers of higher costs [9, 10] and lower reimbursement [11]. Hence, the ASA classification plays a central role in perioperative risk assessment and is associated with healthcare costs of a surgical procedure. Given the far-reaching influence of the ASA classification [12], explicit consideration of multimorbidity may become essential.
Data on both the prevalence of multimorbidity and its impact on outcome and costs in the perioperative patient population are limited. This warrants an in-depth analysis of the costs and reimbursement in the perioperative patient population taking into account multimorbidity. Therefore, this study aimed to assess the number and severity of all anaesthesia-relevant comorbidities and analyse their direct and indirect effects on perioperative outcome and hospital costs in a predetermined perioperative patient population.
The regional ethics committee Ethikkommission Nordwest- und Zentralschweiz (EKNZ, Basel, Switzerland) approved this study (reference No Req-2019-00753 and Req-2016-00469) and waived the requirement for a written informed consent.
This investigator-initiated cohort study is nested in the prospective international multicentre study for the external validation of ClassIntra® [13] and includes only patients enrolled at the University Hospital of Basel. Details about the validation study of ClassIntra® , a newly developed classification of intraoperative adverse events, are described elsewhere [13]. In short, 2520 hospital inpatients undergoing any type of in-hospital surgery from any surgical discipline were included at 18 centres located in 12 countries. Patients with outpatient surgery, follow-up procedures or procedures without involvement of anaesthesia, and patients who refused to participate or had an ASA VI status (i.e., brain dead organ donor) were excluded. Patients were monitored intra- and postoperatively until hospital discharge for all perioperative adverse events. Afterwards, patients were followed up to assess 30-day mortality.
At the University Hospital of Basel, a consecutive sample of approximately 30 patients from each of the 13 surgical disciplines was enrolled in the ClassIntra® validation study between February 2017 and May 2018, to achieve a high generalisability. For the current research questions, all anaesthesia-relevant comorbidities as well as data on costs and reimbursement were retrieved from the electronic anaesthesia protocol and the electronic medical record, and entered into the online study database, making use of pseudonymisation to allow for reversal of the coded database using the unique patient-case identifiers.
Initially, a list of all anaesthesia-relevant comorbidities was developed by a group of anaesthesiologists and anaesthesia trainees. This includes all comorbidities with an influence on intraoperative anaesthesia management and postoperative outcome. All of these comorbidities are routinely recorded by the anaesthesiologist before surgery. Each comorbidity was divided into five severity-classes and assigned to an appropriate ASA class (supplementary table 1 in the appendix). Whenever possible, this grading was based on official cut-offs, current definitions or on the examples detailed by the ASA [12]. If no such cut-offs were found, the extent of disease was graded according the generic definition of the ASA classification [5]. In cases of doubt, the grading was based on a consensus decision of a team of anaesthesiologists from the University Hospital of Basel with extensive expertise in perioperative care. Multimorbidity was defined as the presence of two or more comorbidities in a patient [1].
ECG and laboratory testing were only performed according to preoperative guidelines. We assumed that the patient was healthy (ASA I) if no ECG or laboratory testing was available. We proceeded analogously with missing information on tobacco or other drug use.
Costs were calculated based on a comprehensive accounting algorithm used by Swiss hospitals to internally compute provider costs associated with outpatient and inpatient visits (REKOLE®). Costs included imaging, laboratory tests, medical and treatment services, pharmaceutical products, nursing care, intensive care services, surgical procedures and operating room charges. Reimbursement was calculated before taxes as the difference between overall inpatient Diagnosis-Related Group revenues (Swiss DRG) and costs of the index hospitalisation. Swiss-DRG is a flat-fee based remuneration system for acute hospital care. Hospital cases grouped into the same DRG (based on ICD-10 diagnoses, procedures performed, age and some other criteria) receive identical remuneration as long as the length of stay falls in a typical range. Lengths of stay below or above this range lead to a lower or moderately higher remuneration. The remuneration for a given index hospitalisation also includes any hospitalisations during the immediate postoperative period (18 days) due to surgical complications. There are additional revenues for semi-privately and privately insured patients [14, 15].
Financial data were expressed in Euros using the average exchange rate of the recruitment period between February 2017 and May 2018 (1 Swiss franc = 0.8802 Euros).
The primary endpoint was the number of comorbidities relevant for the ASA (physical status) PS classification across all ASA classes. Secondary endpoints were the effect of ASA class and number of comorbidities on hospital costs and reimbursement.
The sample size of the ClassIntra® validation study was 2520, allowing for robust estimation in the multivariable models, assuming at least one postoperative complication in 10% of the patients (i.e., at least 250 events) [13]. The sample of the current study consisted of all patients enrolled at the University Hospital of Basel, for whom we had access to all hospital charts and monetary data. About 30 consecutive patients from each surgical discipline were enrolled.
Baseline characteristics were summarised as mean and standard deviation (SD), median and interquartile range (IQR), or absolute (relative) frequencies as appropriate.
To investigate whether the number of comorbidities, our primary endpoint, increased with increasing ASA class, a median regression analysis with bootstrapped standard errors was used. The overall agreement between the preoperative ASA class assignment by the anaesthesiologist in charge (overall ASA PS class) and the retrospectively derived ASA class of the most severe comorbidity as assigned by the study team was calculated.
We further used structural equation models [16, 17] to estimate the effects of fixed patient characteristics and hospitalisation-related parameters on total hospital costs and reimbursements incurred by the hospital (fig. 1).
Figure 1 Direct, indirect and total effects on monetary outcomes as calculated using structural equation models. The total effect (c) corresponds to the sum of the direct effects (c') and the indirect effects (a and b).
The perspective of cost assessment was, hence, that of the hospital, implying a restriction to the relevant subset of direct medical costs. These costs were not differentiated further (i.e., not separated into fixed and variable costs). However, the structural equation model allowed us to analyse complex relationships among multiple variables, where some variables are only predictors (exogenous variables) and others are only outcomes, and the remaining variables, referred to as intermediate variables, are both predictors and outcomes. These relationships may be direct or indirect (i.e., mediated by an intermediate variable; fig. 2), which we referred to as direct and indirect effects on costs. Structural equation modelling enables quantification of both the direct and mediated proportions of the total effect of a predictor variable on an outcome.

Figure 2 Path diagram for the relationship of cost-driving factors. This diagram reflects how potential cost-driving factors were included in the structural equation models.
CCI: comprehensive complication index; LOS: length of stay
Patient characteristics were considered as exogenous variables and hospital costs or reimbursements as final outcomes, whereas hospitalisation-related parameters were considered as both: as potential mediators of causal effects and as sources of causal effects in their own right. Baseline characteristics included age, gender, ASA class, number of comorbidities, insurance class of the patients and complexity of the surgical procedure according to the British United Provident Association (BUPA) [18, 19]. This classification categorises all commonly performed surgical procedures into five complexity grades (minor, intermediate, major, major plus, and complex major operations) and has previously been used for scientific purposes [20]. When an undefined or missing complexity grade in the BUPA classification system (in n = 24, 7.5% of procedures) was found, a grade corresponding to a similar procedure was used, as defined by consensus of the core team and clinical experts in the field. There were no other missing values in any of the data. Hospitalisation-related parameters included intraoperative adverse events categorised according to ClassIntra® [13], the comprehensive complication index (CCI®) [21] as the weighted sum of all postoperative adverse events, length of ICU stay and length of hospital stay in days. For the latter, days on the ICU were excluded. All of these factors used in the structural equation model were prespecified and selected based on content and expert knowledge.
Analyses were conducted both for original and log-transformed monetary data. In the latter case, lengths of ICU and hospital stay were transformed using the function log(x+0.04). The choice of the constant c = 0.04 was a compromise between keeping as close as possible to the classical logarithmic transformation log(LOS_ICU), which would have led to the loss of patients without an ICU stay, and achieving a close to linear relationship between log(cost) and log(LOS_ICU+c). The variable ASA class was represented by indicator variables for each ASA class from I to IV, and complexity of the surgical procedure according to BUPA was replaced by a dichotomous variable with values 0 for complexity grades of "minor" to "major" and 1 for "major plus" and "complex major" operations. Final analyses were conducted without the variables gender, age and indirect effects of insurance class, as these variables did not improve goodness-of-fit. To adjust for potential heteroscedasticity of outcomes, robust standard errors were computed using the sandwich estimator. Although our analyses also provided estimates of direct, indirect and total effects on intermediate outcomes, we only report indirect, direct and total effects on the final outcomes. Complete model outputs are, however, provided in the supplementary tables 2 and 3 (appendix) for both costs and reimbursements. We conducted all analyses using Stata software, Version 16.
Five patients returned to the hospital within 18 days for the same diagnosis. In such cases, a single DRG was generated and was assigned to the readmission. These patients were excluded from the main analysis of monetary data and were only considered in a sensitivity analysis (supplementarytables 4 and 5). An additional five patients were outliers with a protracted postoperative length of hospital stay of over 40 days (n = 2) or an ICU stay of over 10 days (n = 3). These five patients were included in the models with log-transformed outcomes (supplementary tables 6 and 7) but were excluded in the linear regression models with untransformed monetary outcome variables (supplementary tables 8 and 9), as their inclusion would have introduced a non-linear pattern. Two patients died during the hospital stay and were excluded in the main analysis (see table 3) as reimbursement is different in this case, but they were included in a further sensitivity analysis (supplementary tables 10 and 11). An additional sensitivity analysis was performed excluding semi-privately and privately insured patients (supplementary tables 12 and 13).
At the University Hospital of Basel, 320 patients were enrolled in the ClassIntra® cohort study between February 2017 and May 2018 and were considered in the current study. There were approximately 30 patients for each of the 13 surgical disciplines. All patients could be followed upuntil hospital discharge. Patients were on average 56 years old (SD 19), and 54% were women (n = 174). Patients were classified according to ASA PS as follows: 27 ASA I (8%), 150 ASA II (47%), 116 ASA III (36%) and 27 ASA IV (8%) patients (table 1). Overall agreement between preoperative assignment of ASA class by the anaesthesiologist in charge compared to the most severe ASA class, as derived from the assignment within the current data extraction, was 69% (n = 217). In cases of disagreement, the majority of patients were classified in a lower ASA class by the anaesthesiologist in charge (in 79/103 patients by one ASA class, in 1/103 patients by two ASA classes), whereas 22% (n = 23) were classified one ASA class higher. Patients had a median length of hospital stay of 4 days (IQR 2–6).
Table 1Patient and procedural characteristics for the total study population (n = 320) and for the different ASA PS classes
Quantitative variables are reported as mean (SD), quantitative as number (percentage).
| All patients (n = 320) | ASA I (n = 27, 8.4%) | ASA II (n = 150, 47%) | ASA III (n = 116, 36%) | ASA IV (n = 27, 8.4%) | ||
| Age | 56 (19) | 36 (15) | 49 (17) | 65 (15) | 70 (13) | |
| Sex | Female | 174 (54%) | 14 (52%) | 90 (60%) | 60 (52%) | 10 (37%) |
| Male | 146 (46%) | 13 (48%) | 60 (40%) | 56 (48%) | 17 (63%) | |
| Body mass index (kg/m 2 ) | 26.9 (5.6) | 25.4 (3.5) | 26.4 (4.6) | 27.9 (6.1) | 26.6 (8.3) | |
| Surgical discipline | Visceral surgery | 30 (9.4%) | 3 (11%) | 11 (7.3%) | 12 (10%) | 4 (15%) |
| Orthopaedic surgery and traumatology | 24 (7.5%) | 3 (11%) | 13 (8.7%) | 8 (6.9%) | – | |
| Vascular surgery | 18 (5.6%) | -- | 1 (0.7%) | 15 (13%) | 2 (7.4%) | |
| Urology | 28 (8.8%) | 2 (7.4%) | 13 (8.7%) | 13 (11%) | – | |
| Ear, nose, throat and maxillofacial surgery | 57 (18%) | 14 (52%) | 29 (19%) | 13 (11%) | 1 (3.7%) | |
| Neurosurgery and spine surgery | 62 (19%) | – | 32 (21%) | 27 (23%) | 3 (11%) | |
| Cardiac surgery | 28 (8.8%) | – | – | 13 (11%) | 15 (56%) | |
| Gynaecology | 30 (9.4%) | 4 (15%) | 19 (13%) | 6 (5.2%) | 1 (3.7%) | |
| Obstetrics | 30 (9.4%) | -- | 26 (17%) | 4 (3.5%) | – | |
| Reconstructive and hand surgery | 13 (4.1%) | 1 (3.7%) | 6 (4.0%) | 5 (4.3%) | 1 (3.7%) | |
| Urgency of the procedure | Planned | 294 (92%) | 24 (89%) | 137 (91%) | 109 (94%) | 24 (89%) |
| Unplanned | 26 (8.1%) | 3 (11%) | 13 (8.7%) | 7 (6.0%) | 3 (11%) | |
| Complexity of surgical procedure1 | Minor | 17 (5.3%) | 1 (3.7%) | 10 (6.7%) | 5 (4.3%) | 1 (3.7%) |
| Intermediate | 41 (13%) | 4 (15%) | 16 (11%) | 18 (16%) | 3 (11%) | |
| Major | 102 (32%) | 13 (48%) | 62 (41%) | 24 (21%) | 3 (11%) | |
| Major plus | 72 (23%) | 6 (22%) | 41 (27%) | 22 (19%) | 3 (11%) | |
| Complex major operation | 88 (28%) | 3 (11%) | 21 (14%) | 47 (41%) | 17 (63%) | |
| Anaesthesia technique | General anaesthesia | 252 (79%) | 24 (89%) | 108 (72%) | 94 (81%) | 26 (96%) |
| Regional anaesthesia | 45 (14%) | 1 (3.7%) | 31 (21%) | 13 (11%) | 1 (3.7%) | |
| Combined techniques | 14 (4.4%) | 2 (7.4%) | 5 (3.3%) | 6 (5.2%) | – | |
| Monitored anaesthesia care | 9 (2.8%) | – | 6 (4.0%) | 3 (2.6%) | – | |
| Insurance class | Basic | 235 (73%) | 24 (89%) | 110 (73%) | 85 (73%) | 16 (59%) |
| Semi-private | 49 (15% | 3 (11%) | 20 (13%) | 18 (16%) | 8 (30%) | |
| Private | 36 (11%) | – | 20 (13%) | 13 (11%) | 3 (11%) | |
| Length of ICU stay 2 (days), median (IQR) | 1 (1–2) | 1 (1–1) | 1 (1–1) | 1 (1–2) | 2 (1–3) | |
| pLOS3 (days), median (IQR) | 4 (2–6) | 2 (1–3) | 3 (2–4) | 5 (3–7) | 7 (6–10) | |
1 When an undefined or missing complexity grade in the BUPA classification system (n = 24, 7.5% of procedures) was found, a grade corresponding to a similar procedure was used, as defined through consensus by the core team and clinical experts in the field. There were no missing values in any of the other variables.
2 In total, 74 (23%) required at least one day in the ICU.
‡ pLOS = Postoperative length of stay (excluding days on ICU).
On average, the patients had five comorbidities (range 0–18) with a significantly higher number of comorbidities with increasing ASA class. The median number of comorbidities was 1 in ASA I patients (95% CI 0.0–2.0; range 0–4), 4 in ASA II patients (95% CI 3.8–4.2; range 1–12), 9 in ASA III patients (95% CI 8.1–9.9; range 1-17), and 12 in ASA IV patients (95% CI 10–14; range 5–18) (fig. 3, table 2).
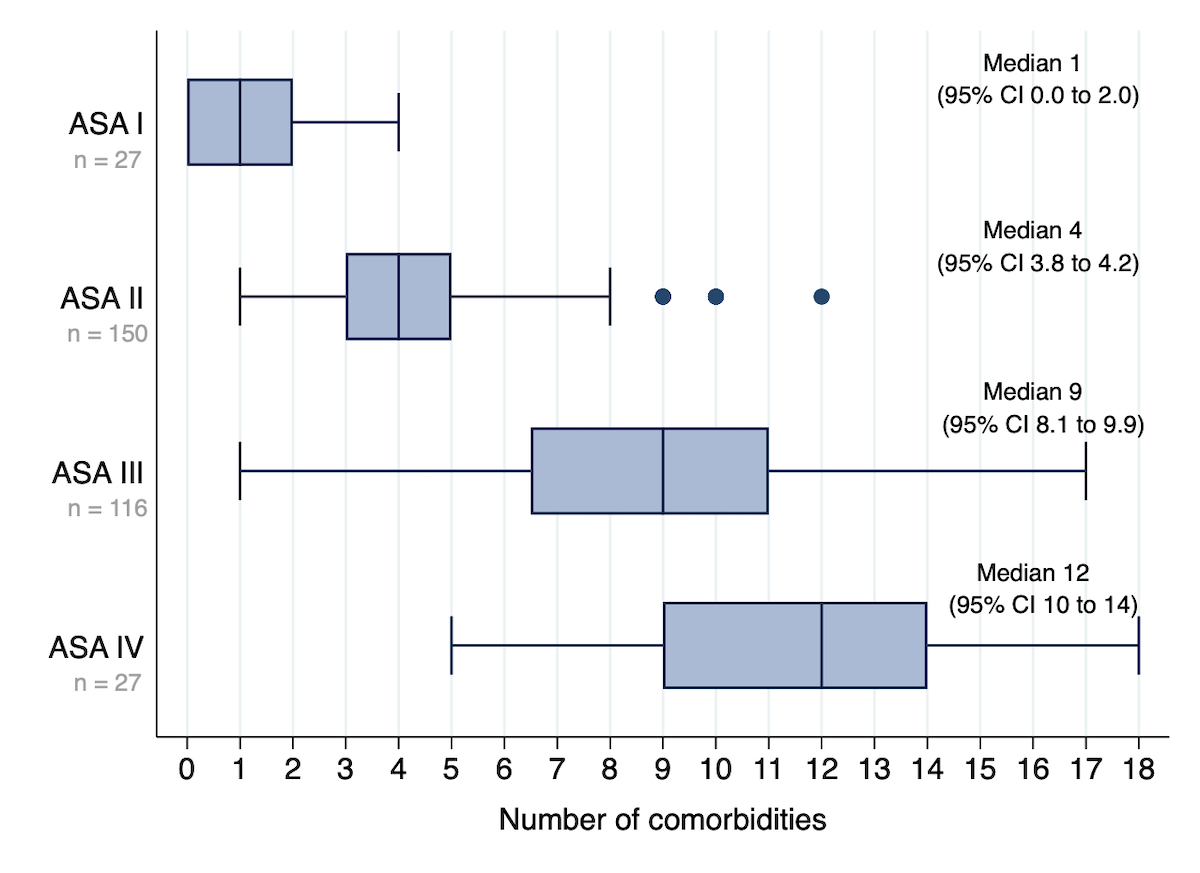
Figure 3 Median number (95% confidence interval [CI]) of comorbidities in relation to the ASA class. Boxplots show average number (IQR and range) of all anaesthesia-relevant comorbidities in each patient (regardless of severity) across all ASA classes. The confidence intervals are estimated in a median regression model using bootstrapped standard errors.
Table 2Comorbidities for the total study population (n = 320) and for the different ASA PS classes
This table gives an overview of the number and severity of anaesthesia-relevant comorbidities. An ASA class was assigned to each comorbidity by the study team. The columns correspond to the overall ASA PS classes as preoperatively assigned by the treating anaesthesiologists. Quantitative variables are reported as median (IQR), quantitative as number (percentages).
| All patients (n = 320) | ASA I (n = 27, 8.4%) | ASA II (n = 150, 47%) | ASA III (n = 116, 36%) | ASA IV (n = 27, 8.4%) | |
| Number of comorbidities | 5 (0–18) | 1 (0–4) | 4 (1–12) | 9 (1–17) | 12 (5–18) |
| ASA class of most severe anaesthesia-relevant comorbidity | |||||
| – ASA I | 12 (3.8%) | 12 (44%) | – | – | – |
| – ASA II | 123 (38%) | 15 (56%) | 96 (64%) | 12 (10%) | – |
| – ASA III | 157 (49%) | – | 53 (35%) | 93 (80%) | 11 (41%) |
| – ASA IV | 28 (8.8%) | – | 1 (0.7%) | 11 (9.5%) | 16 (59%) |
| Types of comorbidities | |||||
| – Cardiovascular | 177 (55%) | 1 (3.7%) | 49 (33%) | 100 (86%) | 27 (100%) |
| – Pulmonary | 139 (43%) | 3 (11%) | 60 (40%) | 65 (56%) | 11 (41%) |
| – Neurology | 150 (47%) | – | 67 (45%) | 70 (60%) | 13 (48%) |
| – Trauma/coagulation | 128 (40%) | 2 (7.4%) | 40 (27%) | 64 (55%) | 22 (81%) |
| – Liver/kidney | 150 (47%) | 1 (3.7%) | 55 (37%) | 60 (60%) | 24 (89%) |
| - Airway (incl. BMI and risk for aspiration) | 179 (56%) | 6 (22%) | 93 (62%) | 68 (59%) | 12 (44%) |
| – Metabolic disorder (including diabetes etc.) | 117 (37%) | 6 (22%) | 41 (21%) | 59 (51%) | 21 (78% |
| – Allergies | 103 (32%) | 5 (19%) | 53 (35%) | 35 (30%) | 10 (37%) |
| – Pregnancy | 30 (9.4%) | – | 26 (17%) | 4 (3.5%) | – |
| – Substance abuse (e.g., alcohol, drugs) | 39 (12%) | -- | 11 (7.3%) | 24 (21%) | 4 (15%) |
| – Others | 118 (37%) | – | 42 (28%) | 62 (53%) | 14 (52%) |
The most common comorbidities were risk of aspiration (n = 151), hypertension (n = 132), renal pathology (n = 125), neurological deficit (n = 113), smoking (n = 113), anaemia (n = 105) and allergies (n = 103). Among all ASA classes, the most commonly observed comorbidity clusters were cardiovascular (n = 177, 55%), neurological (n = 150, 47%) and liver or kidney (n = 150, 47%) disorders (table 2). The distribution of the severity of all comorbidities is shown in fig. 4.
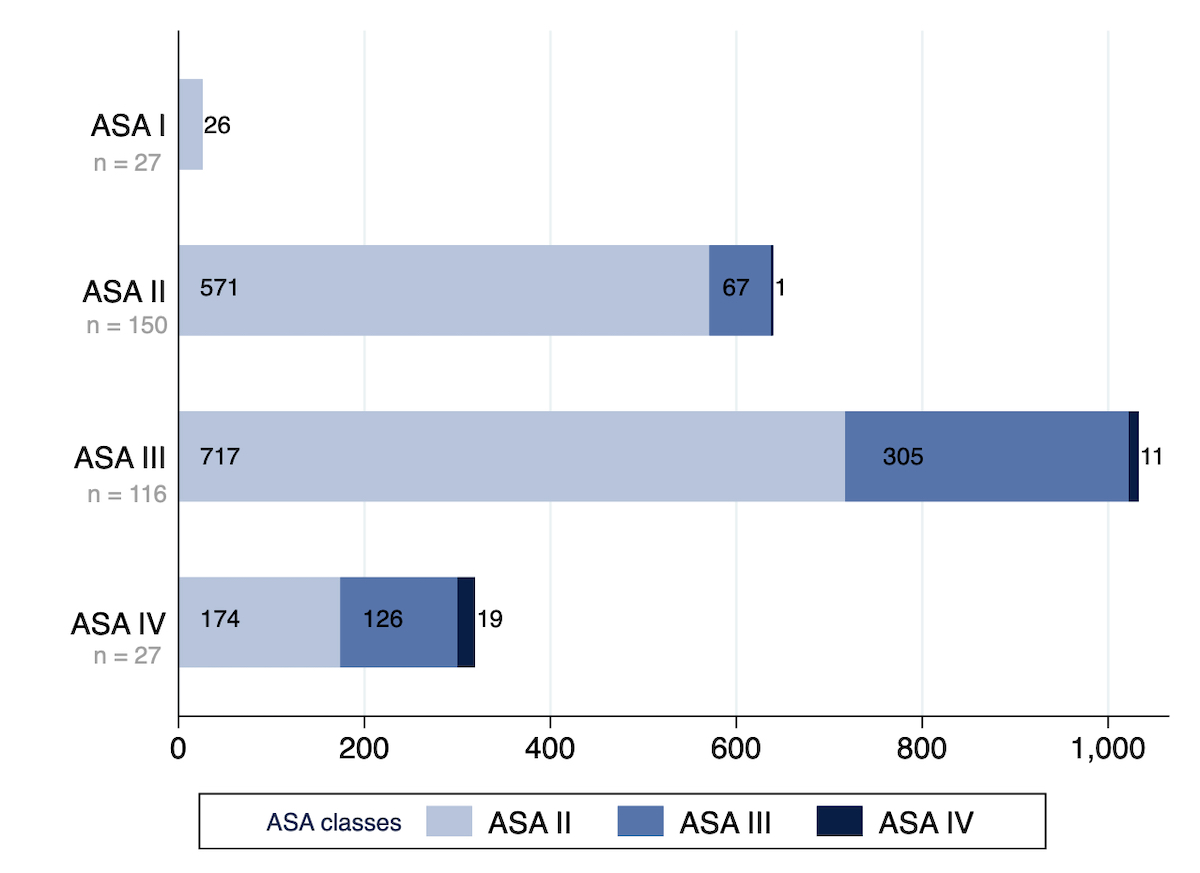
Figure 4 Number and severity of comorbidities according to ASA class. Number and severity of all anaesthesia-relevant comorbidities for all patients in the corresponding overall ASA class. The ASA class of each comorbidity has been assigned as if this comorbidity would have been the only one in this patient.
On average, the indirect, direct and total effects on costs increased with rising ASA classification, as did the proportional contribution of the indirect effect to the total effect. However, only the cost difference between ASA IV and ASA I patients was statistically significant, with additional costs of EUR 30,631 (95% CI 15,205–46,057) for total costs, most of which were caused by an indirect effect (EUR 27,415, 95% CI 11,180–43,649). Independent of the ASA class, the total effect of the number of comorbidities on costs was statistically significant, with an average increase by EUR 1198 (95% CI 288–2108) for each additional comorbidity and with almost identical contributions of direct and indirect effects. The indirect path can be explained by each additional comorbidity significantly prolonging length of hospital stay, independent of the ASA class (output not shown), without a corresponding statistically significant effect on the length of ICU stay.
Moreover, increasing surgical complexity, as well as intra- and postoperative adverse events, also led to a significant, mainly indirect effect on increasing costs, whereas increasing insurance class, postoperative length of hospital and ICU stay led to a mainly direct effect on increasing costs (table 3). Whereas the cost-driving effect of intraoperative adverse events was mainly mediated by their positive association with postoperative adverse events and the length of ICU stay, the cost-driving effect of postoperative adverse events was mainly mediated through a prolonged ICU and hospital stay (supplementary table 2).
Table 3Indirect, direct and total effects on costs (in Euros).
Coefficients are mean differences (mean diff.) in cost. Patients with protracted hospital or ICU stay and patients who died during hospital stay were excluded. R-squared 57.1% (n = 308).
| Indirect effect | Direct effect | Total effect | Proportion of total effect mediated | ||||
| Factor | Mean diff. | 95% CI | Mean diff. | 95% CI | Mean diff. | 95% CI | |
| ASA class II vs I | 2177 | –829; 5182 | –3060 | –5876; –244 | –883 | –4824; 3057 | 42% |
| ASA class III vs I | 6220 | 902; 11,538 | –2728 | –7488; 2031 | 3491 | –3580; 10,563 | 70% |
| ASA class IV vs I | 27,415 | 11,180; 43,649 | 3216 | –6515; 12,948 | 30,631 | 15,205; 46,057 | 89% |
| Comorbidities (per one additional comorbidity) | 577 | –136; 1290 | 621 | –16; 1258 | 1198 | 288; 2108 | 48% |
| Complexity of surgery (BUPA Major Plus and CMO1 vs Minor to Major) | 10,905 | 6322; 15,489 | –1374 | –5387; 2639 | 9531 | 5708; 13,354 | 89% |
| Insurance (per one class increase)2 | – | – | 4724 | 1919; 7529 | 4724 | 1919; 7529 | – |
| ClassIntra® (per one grade increase) | 2378 | 487; 4269 | 22 | –1250; 1295 | 2400 | 579; 4222 | 99% |
| CCI® (per 10 units increase)3 | 5485 | 2089; 8880 | 455 | –845; 1755 | 5940 | 2810; 9070 | 92% |
| Length of ICU stay (per one day increase) | –929 | –2835; 978 | 11,759 | 6547; 16,970 | 10,830 | 4134; 17,526 | 7.3% |
| Length of postop stay (per one day increase) | – | – | 2184 | 1403; 2965 | 2184 | 1403; 2965 | – |
1 CMO: complex major operations; 2 insurance class has only been included as a direct effect. 3 CCI: comprehensive complication index
The sensitivity analyses of the log-transformed outcome enabling the additional inclusion of patients with protracted hospital and ICU stay (n = 5) and of those who died during hospital stay (n = 2) are shown in the appendix in supplementary tables 6 and 7. As a consequence of the log-transformation of the outcome, the magnitudes of the results of these analyses are not directly comparable to the results for the untransformed outcome. However, differences in the relative importance of the indirect effects become apparent. The number of comorbidities had a significant total indirect and direct effect on the costs, independent of the ASA classes. Furthermore, the total effect on costs when comparing ASA III with I also became significant. The sensitivity analysis in the subgroup of patients with basic insurance showed similar results to the main model, but with greater uncertainty reflected by wider confidence intervals (supplementary tables 12 and 13).
The analysis of reimbursement only showed significant positive effects of increasing insurance class. On average, reimbursement increased by EUR 3097 (95% CI 1942–4251) per increase in insurance class (table 4).
In the sensitivity analysis using a log-transformed outcome, number of comorbidities, postoperative adverse events and higher surgical complexity significantly decreased reimbursement in addition to the insurance class.
Table 4Indirect, direct and total effects on reimbursement (in Euros).
Coefficients are mean differences in reimbursement; patients with protracted hospital or ICU stay and patients who died during hospital stay were excluded. R-squared 56.5% (n = 308)
| Indirect effect | Direct effect | Total effect | Proportion of total effect mediated | ||||
| Factor | Mean difference | 95% CI | Mean difference | 95% CI | Mean difference | 95% CI | |
| ASA class II vs I | –255 | –761; 312 | 447 | –1269; 2162 | 222 | –1415; 1859 | 33% |
| ASA class III vs I | –743 | –1782; 296 | 3047 | –420; 6515 | 2304 | –961; 5569 | 20% |
| ASA class IV vs I | –3224 | –9301; 2854 | 1647 | –5307; 8601 | –1577 | –8147; 4993 | 66% |
| Comorbidities (per one additional comorbidity) | –89 | –240; 62 | –180 | –488; 129 | –269 | –635; 97 | 33% |
| Complexity of surgery (BUPA Major Plus and CMO1 vs Minor to Major) | –1186 | –3530; 1157 | 946 | –1532; 3424 | –241 | –1769; 1288 | 56% |
| Insurance (per one class increase)2 | – | – | 3097 | 1942; 4251 | 3097 | 1942; 4251 | – |
| ClassIntra® (per one grade increase) | –327 | –1025; 372 | 329 | –507; 1166 | 3 | –760; 765 | 50% |
| CCI® (per 10 units increase)3 | –695 | –2057; 667 | –268 | –1244; 708 | –963 | –2213; 287 | 72% |
| Length of ICU stay (per one day increase) | 149 | –125; 424 | –1174 | –4640; 2291 | –1025 | –4578; 2528 | 11% |
| Length of postop stay (per one day increase) | – | – | –351 | –724; 22 | –351 | –724; 22 | –– |
1 CMO: complex major operations; 2 insurance class has only been included as a direct effect; 3 CCI: comprehensive complication index
In patients presenting for surgery from a broad range of surgical disciplines in a single tertiary centre, the prevalence of multimorbidity was high, especially in patients assigned to higher ASA classes. Independent of ASA class, each additional comorbidity increased the total effect on hospital costs with almost identical proportions of direct and indirect effects. The path analysis revealed that intra- and postoperative complications mainly had an indirect effect on costs, whereas the length of hospital and ICU stay mostly had a direct effect. Regarding the results on reimbursement, only the insurance class revealed a significant positive effect. In addition to a relevant effect of comorbidities on costs, we demonstrated that anaesthesia-relevant comorbidities impacted postoperative complications and postoperative length of stay.
A major strength of this study was that the results are based on baseline and outcome data with granular details prospectively recorded during a cohort study, covering a broad range of surgical disciplines. Additionally, our analysis involved structural equation modelling, enabling not only an estimation of the total effects but also a quantification of direct and indirect effects taking into account the complex relationship of all variables. Our cost analysis is, however, limited by its restriction to total costs without distinction between fixed and variable costs. Whereas the cost data correspond to effective costs based on drug and material costs, infrastructure, salaries and overheads, the reimbursement data are based on negotiated base rates specific for each Swiss hospital. Generalisability of our results is limited because of greatly differing reimbursement systems in other countries.
The retrospective data collection about type and extent of comorbidities is a limitation of this study. However, misclassification bias is limited as the severity of all anaesthesia-relevant comorbidities was based on predefined definitions elaborated and revised by a team of experienced anaesthesiologists, frequently following official cut-offs. In order to ensure the best possible accuracy, every unclear comorbidity assignment was discussed and verified with a senior team member. This resulted in some discrepancies, particularly between the preoperative overall ASA class assignment by the anaesthesiologists in charge and the retrospective assignment of certain comorbidities in our study, strictly following the ASA guidelines. However, in the monetary analysis, only the number of comorbidities was considered, disregarding the severity and potential differences in prognostic relevance. The relevance of multimorbidity on perioperative clinical outcome will be evaluated in a multicentre study including additional national and international study centres from the multicentre validation study of ClassIntra® [13]. The larger sample size will allow for broader generalisability to different hospital settings and countries, and provide a basis for determining whether certain comorbidities are prognostically more relevant than others.
Literature investigating the effect of multimorbidity on outcome and hospital costs in perioperative patients is sparse and typically based on administrative data. Usually, only a selection of postoperative adverse events and comorbidities is considered, whereby most studies have used classifications not routinely applied nor validated in perioperative medicine such as the Charlson comorbidity index. In addition, the prognostic value of these other classifications is not well established in perioperative medicine, whereas the ASA class has previously been shown to be strongly associated with length of hospital stay and hospital costs in general [22], orthopaedic [23] and spine surgery [24, 25]. Nevertheless, numerous studies [26–30] support the assumption that comorbidities lead to an increase in hospital costs mediated by a higher susceptibility of multimorbid patients to postoperative complications, although we could only show supporting evidence for this association in our sensitivity analysis using a log-transformed outcome excluding recurring patients. Extending the results of Whitmore and colleagues who found a significant association between increasing ASA class and costs only in patients undergoing spine surgery [31], we were able to show a linear association between the number of comorbidities and total costs independent of the corresponding ASA class.
A well-known surgical risk calculator developed by the American College of Surgeons National Surgery Quality Improvement Program (ACS NSQIP Surgical Risk Calculator) [32] allows calculation of the risk for a set of postoperative complications based on a selected number of preoperative patient and operative risk factors. Although the ACS-NSQIP risk calculator had been developed using data from all surgical subspecialities, a recent review showed unconvincing performance in predicting postoperative complications in a variety of surgical disciplines [33]. The lack of a strong and generalisable correlation between the predicted risk and postoperative complications renders high performance in predicting hospital costs unlikely. This has been confirmed by a single-centre retrospective study in neurosurgical patients, which found only a moderate correlation between the risk predicted using the ACS NSQIP risk calculator and hospital costs [34].
According to several other studies, postoperative complications lead to an increase in length of hospital stay [35] and costs [9, 10, 35, 36]. In our study, not only postoperative, but also intraoperative adverse events led to significantly increased costs. In the case of intraoperative adverse events, the effect was partly mediated by the number and severity of postoperative adverse events and a prolonged length of ICU stay. This is in line with a study in patients undergoing noncardiac surgery [37], where increased costs related to postoperative adverse events were mostly driven by a prolonged length of ICU and hospital stay.
Regarding hospital reimbursement, Dimick et al. [38] and Eappen et al. [35] found the contribution margin in patients experiencing postoperative complications to be dependent on the payer mix, whereas our main model did not show a significant increase or decrease in reimbursement in the case of a postoperative complication. In two different sensitivity analyses, we found that the inclusion of patients with protracted ICU or hospital stay led to a significant negative effect of postoperative complications on the reimbursement. This could be due to the Swiss DRG not adequately reimbursing for patients with poor outcome [39].
Our study showed that, in addition to the ASA class, the number of comorbidities had a relevant direct effect on the risk of postoperative complications, and an indirect effect on length of postoperative stay and costs. This affects the decision between conservative and invasive treatment, bed planning on the ward, reimbursement negotiations with insurance providers and type of postoperative care.
The single disease framework of the ASA classification, by using only the single most severe systemic disease to define the ASA class, may be responsible for the cost increasing effect of each additional comorbidity in our study. Thus, integrating multimorbidity into the ASA classification could allow for an easier and more accurate reimbursement. In addition, integration could allow for better perioperative planning and management, since comorbidities also seem to increase length of hospital stay and the risk for postoperative complications. The number of comorbidities consists of information readily available after the anaesthesia consultation, hence their integration would be far easier as compared to the use of a separate risk calculator.
Non-randomised outcome studies aim to adjust for patients’ basic risk profiles. Up to now, the ASA classification has frequently been used to adjust for the complexity of a patient’s physical health status as a single covariate in perioperative outcome research [40]. When the ASA classification system was devised in 1941, multimorbidity was less common than it is today. Given the increase of concomitant diseases over recent decades, the ASA classification has declined in value as a predictor of perioperative risk ignoring multimorbidity [2]. Our study provides evidence that – in addition to the adjustment according to ASA class – the number of comorbidities is an important co-factor for the occurrence of postoperative complications, and hence also for postoperative length of stay and hospital costs. Therefore, adjusting the classification to incorporate this relevant confounder for postoperative outcomes may be desirable.
In demonstrating that the number of anaesthesia-relevant comorbidities is large, increases with increasing ASA class and is responsible for higher hospital costs, this study shows the importance of assessing and explicitly considering multimorbidity in the perioperative risk assessment. Moreover, the number of comorbidities is a crucial additional covariate for investigating perioperative outcomes, since the most severe comorbidity, as reflected by the ASA class, is not sufficient for confounder adjustment.
In particular, we show that hospital costs grow with the number of comorbidities, independent of ASA class. In line with the sparse literature on this topic, the relationship between comorbidity and hospital costs was mainly mediated by a prolonged length of hospital stay related to intra- and postoperative adverse events. We suggest that the assessment of all anaesthesia-relevant comorbidities and possibly their integration into the current ASA classification may improve its predictive framework and would potentially allow for a more precise prediction of costs.
De-identified patient-level data are available on request for investigators whose proposed use of the data has been approved by a review committee identified for this purpose.
LC, LA, CS and SDK had full access to all data in the study and take responsibility for the integrity of the data and the accuracy of the data analysis.
Concept and design: LC, LA, CG, MK and SDK
Acquisition, analysis, or interpretation of data: LC, LA, CS, NO, CG, LAS, MS, SDK
Drafting of the manuscript: LC, LA and SDK
Critical revision of the manuscript for important intellectual content: CS, NO, CG, MK, LAS, MS
Statistical analysis: CS and SDK
We thank Ramon Saccilotto who programmed and maintained the online database, and Allison Dwileski for editorial assistance on the manuscript.
The research was supported by a grant from the Foundation for Research and Education in Anaesthesiology, Switzerland.
All authors have completed and submitted the International Committee of Medical Journal Editors form for disclosure of potential conflicts of interest. No potential conflict of interest was disclosed
This work was accepted for an oral presentation and an E-poster at the SwissAnaesthesia 2021 in Geneva.
1. Barnett K , Mercer SW , Norbury M , Watt G , Wyke S , Guthrie B . Epidemiology of multimorbidity and implications for health care, research, and medical education: a cross-sectional study. Lancet. 2012 Jul;380(9836):37–43. https://doi.org/10.1016/s0140-6736(12)60240-2 https://doi.org/10.1016/S0140-6736(12)60240-2
2. Bainbridge D , Martin J , Arango M , Cheng D ; Evidence-based Peri-operative Clinical Outcomes Research (EPiCOR) Group . Perioperative and anaesthetic-related mortality in developed and developing countries: a systematic review and meta-analysis. Lancet. 2012 Sep;380(9847):1075–81. https://doi.org/10.1016/s0140-6736(12)60990-8 https://doi.org/10.1016/S0140-6736(12)60990-8
3. CIHI . Care in Canadian ICUs Ottawa: CIHI 2016 [Available from: https://secure.cihi.ca/free_products/nhex_acutecare07_e.pdf accessed January 2018.
4. WHO . Global spending on health: a world in transition Geneva: WHO 2019 [Available from: https://www.who.int/health_financing/documents/health-expenditure-report-2019.pdf?ua=1 accessed March 9 2021.
5. ASA Physical Status Classification System . 2014 [Available from: http://www.asahq.org/resources/clinical-information/asa-physical-status-classification-system accessed April 2021.
6. Lagasse RS . Anesthesia safety: model or myth? A review of the published literature and analysis of current original data. Anesthesiology. 2002 Dec;97(6):1609–17. https://doi.org/10.1097/00000542-200212000-00038
7. Visser A , Geboers B , Gouma DJ , Goslings JC , Ubbink DT . Predictors of surgical complications: A systematic review. Surgery. 2015 Jul;158(1):58–65. https://doi.org/10.1016/j.surg.2015.01.012
8. Menke H , Klein A , John KD , Junginger T . Predictive value of ASA classification for the assessment of the perioperative risk. Int Surg. 1993 Jul-Sep;78(3):266–70.
9. Hemmila MR , Jakubus JL , Maggio PM , Wahl WL , Dimick JB , Campbell DA Jr , et al. Real money: complications and hospital costs in trauma patients. Surgery. 2008 Aug;144(2):307–16. https://doi.org/10.1016/j.surg.2008.05.003
10. Staiger RD , Cimino M , Javed A , Biondo S , Fondevila C , Périnel J , et al. The Comprehensive Complication Index (CCI®) is a Novel Cost Assessment Tool for Surgical Procedures. Ann Surg. 2018 Nov;268(5):784–91. https://doi.org/10.1097/SLA.0000000000002902
11. Ramly EP , Larentzakis A , Bohnen JD , Mavros M , Chang Y , Lee J , et al. The financial impact of intraoperative adverse events in abdominal surgery. Surgery. 2015 Nov;158(5):1382–8. https://doi.org/10.1016/j.surg.2015.04.023
12. Abouleish AE , Cohen NH . ASA provides exam- ples to each ASA Physical Status Class [ASA Provides Examples to Each ASA Physical Status Class.]. ASA Newsl. 2015;79(6):38–9.
13. Dell-Kuster S , Gomes NV , Gawria L , Aghlmandi S , Aduse-Poku M , Bissett I , et al. Prospective validation of classification of intraoperative adverse events (ClassIntra): international, multicentre cohort study. BMJ. 2020 Aug;370:m2917. https://doi.org/10.1136/bmj.m2917
14. Boes S , Napierala C . Assessment of the introduction of DRG-based reimbursement in Switzerland: evidence on the short-term effects on length of stay compliance in university hospitals [published Online First: 2021/04/30]. Health Policy. 2021 Jun;125(6):739–50. https://doi.org/10.1016/j.healthpol.2021.01.010
15. Swiss DR . [Available from: https://www.swissdrg.org/de accessed Oktober 7 2021.
16. Acock AC . Discovering Structural Equation Modeling Using Stata. Revised ed. College Station, TX: Stata Press 2013.
17. Kline RB . Principles and Practice of Structural Equation Modeling. 4th ed. New York: Guilford Press 2016.
18. BUPA . (British United Provident Association) [Available from: https://bupa.secure.force.com/procedures accessed August 17th 2015.
19. BUPA (British United Provident Association) . Schedule of Procedures 1999 [Available from: http://www.cambridgevascularaccess.com/userfiles/BUPAScheduleofProcedures1.pdf accessed August 17th 2015.
20. Sutton R , Bann S , Brooks M , Sarin S . The Surgical Risk Scale as an improved tool for risk-adjusted analysis in comparative surgical audit. Br J Surg. 2002 Jun;89(6):763–8. https://doi.org/10.1046/j.1365-2168.2002.02080.x
21. Slankamenac K , Graf R , Barkun J , Puhan MA , Clavien PA . The comprehensive complication index: a novel continuous scale to measure surgical morbidity. Ann Surg. 2013 Jul;258(1):1–7. https://doi.org/10.1097/SLA.0b013e318296c732
22. Cullen DJ , Apolone G , Greenfield S , Guadagnoli E , Cleary P . ASA Physical Status and age predict morbidity after three surgical procedures. Ann Surg. 1994 Jul;220(1):3–9. https://doi.org/10.1097/00000658-199407000-00002
23. Kay HF , Sathiyakumar V , Yoneda ZT , Lee YM , Jahangir AA , Ehrenfeld JM , et al. The effects of American Society of Anesthesiologists physical status on length of stay and inpatient cost in the surgical treatment of isolated orthopaedic fractures. J Orthop Trauma. 2014 Jul;28(7):e153–9. https://doi.org/10.1097/01.bot.0000437568.84322.cd
24. Schupper AJ , Shuman WH , Baron RB , Neifert SN , Chapman EK , Gilligan J , et al. Utilization of the American Society of Anesthesiologists (ASA) classification system in evaluating outcomes and costs following deformity spine procedures. Spine Deform. 2021 Jan;9(1):185–90. https://doi.org/10.1007/s43390-020-00176-4
25. Bronheim RS , Caridi JM , Steinberger J , Hunter S , Neifert SN , Deutsch BC , et al. American Society of Anesthesiologists’ Status Association With Cost and Length of Stay in Lumbar Laminectomy and Fusion: Results From an Institutional Database. Spine. 2020 Mar;45(5):333–8. https://doi.org/10.1097/brs.0000000000003257 https://doi.org/10.1097/BRS.0000000000003257
26. Lee DK , Frye A , Louis M , Koshy AN , Tosif S , Yii M , et al. Postoperative complications and hospital costs following small bowel resection surgery. PLoS One. 2020 Oct;15(10):e0241020. https://doi.org/10.1371/journal.pone.0241020
27. Khechen B , Haws BE , Bawa MS , Patel DV , Cardinal KL , Guntin JA , et al. The Impact of Comorbidity Burden on Complications, Length of Stay, and Direct Hospital Costs After Minimally Invasive Transforaminal Lumbar Interbody Fusion. Spine. 2019 Mar;44(5):363–8. https://doi.org/10.1097/BRS.0000000000002834
28. Milne S , Parmar J , Ong TK . Adult Comorbidity Evaluation-27 as a predictor of postoperative complications, two-year mortality, duration of hospital stay, and readmission within 30 days in patients with squamous cell carcinoma of the head and neck. Br J Oral Maxillofac Surg. 2019 Apr;57(3):214–8. https://doi.org/10.1016/j.bjoms.2019.01.004
29. Shen Y , Silverstein JC , Roth S . In-hospital complications and mortality after elective spinal fusion surgery in the united states: a study of the nationwide inpatient sample from 2001 to 2005. J Neurosurg Anesthesiol. 2009 Jan;21(1):21–30. https://doi.org/10.1097/ANA.0b013e31818b47e9
30. Fukuse T , Satoda N , Hijiya K , Fujinaga T . Importance of a comprehensive geriatric assessment in prediction of complications following thoracic surgery in elderly patients. Chest. 2005 Mar;127(3):886–91. https://doi.org/10.1378/chest.127.3.886
31. Whitmore RG , Stephen JH , Vernick C , Campbell PG , Yadla S , Ghobrial GM , et al. ASA grade and Charlson Comorbidity Index of spinal surgery patients: correlation with complications and societal costs. Spine J. 2014 Jan;14(1):31–8. https://doi.org/10.1016/j.spinee.2013.03.011
32. American College of Surgeons NSQIP Surgical Risk Calculator [Available from: https://riskcalculator.facs.org/RiskCalculator/ accessed 21. Decemeber 2021.
33. Mir WA , Fiumara F , Shrestha DB , Gaire S , Verda L . Utilizing the Most Accurate Preoperative Risk Calculator [published Online First: 20210810]. Cureus. 2021 Aug;13(8):e17054. https://doi.org/10.7759/cureus.17054
34. Vaziri S , Abbatematteo JM , Fleisher MS , Dru AB , Lockney DT , Kubilis PS , et al. Correlation of perioperative risk scores with hospital costs in neurosurgical patients [published Online First: 20190215]. J Neurosurg. 2019 Feb;132(3):818–24. https://doi.org/10.3171/2018.10.Jns182041 https://doi.org/10.3171/2018.10.JNS182041 Crossref reports the DOI should be "10.3171/2018.10.JNS182041", not "10.3171/2018.10.Jns182041". Edifix has used the Crossref-supplied DOI. (Ref. 34 "Vaziri, Abbatematteo, Fleisher, Dru, Lockney, Kubilis, et al., 2019")
35. Eappen S , Lane BH , Rosenberg B , Lipsitz SA , Sadoff D , Matheson D , et al. Relationship between occurrence of surgical complications and hospital finances. JAMA. 2013 Apr;309(15):1599–606. https://doi.org/10.1001/jama.2013.2773
36. de la Plaza Llamas R , Hidalgo Vega Á , Latorre Fragua RA , López Marcano AJ , Medina Velasco AA , Díaz Candelas DA , et al. The Cost of Postoperative Complications and Economic Validation of the Comprehensive Complication Index: prospective Study. Ann Surg. 2021 Jan;273(1):112–20. https://doi.org/10.1097/sla.0000000000003308 https://doi.org/10.1097/SLA.0000000000003308
37. Khan NA , Quan H , Bugar JM , Lemaire JB , Brant R , Ghali WA . Association of postoperative complications with hospital costs and length of stay in a tertiary care center. J Gen Intern Med. 2006 Feb;21(2):177–80. https://doi.org/10.1111/j.1525-1497.2006.00319.x https://doi.org/10.1007/s11606-006-0254-1
38. Dimick JB , Weeks WB , Karia RJ , Das S , Campbell DA Jr . Who pays for poor surgical quality? Building a business case for quality improvement. J Am Coll Surg. 2006 Jun;202(6):933–7. https://doi.org/10.1016/j.jamcollsurg.2006.02.015
39. Mehra T , Müller CT , Volbracht J , Seifert B , Moos R . Predictors of High Profit and High Deficit Outliers under SwissDRG of a Tertiary Care Center. PLoS One. 2015 Oct;10(10):e0140874. https://doi.org/10.1371/journal.pone.0140874
40. Grosflam JM , Wright EA , Cleary PD , Katz JN . Predictors of blood loss during total hip replacement surgery. Arthritis Care Res. 1995 Sep;8(3):167–73. https://doi.org/10.1002/art.1790080309
The appendix is available in the PDF version of this article.