PROCAM based myocardial infarction risk in relation to global vascular disease risk: observations from the ARCO cohort study
DOI: https://doi.org/10.4414/SMW.2022.w30111
Michel
Romanensa, Ansgar
Adamsb, Walter
Warmuthc
aVascular Risk Foundation (Varifo), Olten, Switzerland
bBAD Gesundheitsvorsorge und Sicherheitstechnik GmbH, Bonn, Germany
cGesundheitsforen Leipzig, Germany
Summary
BACKGROUND: In Switzerland, risk for acute myocardial infarction (AMI) has been considered as equivalent to risk for atherosclerotic cardiovascular disease (ASCVD). This may lead to an underestimation of ASCVD risk and prevent adequate preventive measures.
METHODS: We calculated correction factors for AMI risk to obtain ASCVD risk, tested predicting abilities of PROCAM/AGLA, SCORE, HerzCheck® and carotid plaque imaging (TPA) for ASCVD events in this cohort study and calculated survival curves, calibration and discrimination for ASCVD outcomes derived from PROCAM/AGLA, SCORE and TPA.
RESULTS: In 2842 subjects (age 50 ± 8, 38% women), 154 (5.4%) cardiovascular events occurred (ASCVD: 41 myocardial infarctions, 16 strokes or TIAs, 21 CABG, 41 PTCA, 35 coronary artery disease [CAD]defined by invasive angiography) during a mean follow-up time of 5.9 (1–12) years. AGLA-AMI risk was well calibrated for AMI (15% underreported risk for the risk of AMI), but was poorly calibrated for ASCVD (stroke, CABG, PTCA or CAD, which contributed to the secondary outcome variables) with underreported risk resulting in a correction factor of 3.45. Discrimination was comparable for all risk calculators, but TPA outperformed risk calculators for survival using Cox proportional survival functions. Net reclassification improvement for PROCAM and SCORE using TPA tertiles groups increased significantly between 30% to 48%.
CONCLUSIONS: PROCAM-derived risk calculators are well calibrated for the risk of AMI. PROCAM-AMI should be multiplied by a factor of 4 to obtain ASCVD. PROCAM-AMI does not represent global cardiovascular risk. Corresponding adjustments in the AGLA communication of risk appear necessary.
List of abbreviations
- AGLA
-
National working group on lipids and atherosclerosis of the Swiss Society of Cardiology
- AGLA-AMI
-
AGLA risk for myocardial infarction
- AUC
-
Area under the curve in ROC analysis
- ASCVD
-
Atherosclerotic cardiovascular disease
- AMI
-
Fatal or nonfatal acute myocardial infarction
- AMISTR
-
Risk for AMI and stroke
- AMISTRCABG
-
Risk for AMI, stroke and coronary artery bypass grafting
- CABG
-
Coronary artery bypass grafting
- CAD
-
Coronary artery disease defined as >50% narrowing of an epicardial coronary artery detected by invasive coronary angiography
- CVD
-
Cardiovascular disease
- HerzCheck®
-
Registered by the Swiss Heart Foundation: a PROCAM based risk calculator for myocardial infarction only
- HerzCheck-AMI
-
HerzCheck risk for AMI
- NRI
-
Net reclassification improvement
- PTCA
-
Percutaneous transluminal coronary angioplasty
- ROC
-
Receiver operating curves (discrimination analysis)
- STR
-
Fatal or nonfatal stroke
- TPA
-
Total plaque area (carotid plaque)
- PROCAM
-
Prospective Cardiovascular Münster Study for fatal and nonfatal myocardial infarction
- PROCAM-AMI
-
PROCAM risk for myocardial infarction
- PROCAM-AMISTR
-
PROCAM risk for myocardial infarction and stroke
- PROCAMpoint-AMI
-
PROCAM risk for myocardial infarction based upon a point scoring system developed by the PROCAM investigators
- SCORE
-
SCORE risk charts and equations, European Society of Cardiology, for fatal cardiovascular events
- SCORE-ASCVD
-
SCORE risk for ASCVD
Introduction
Preventive medicine is a pillar of basic health care and is essential to avoid disease expansion [1]. In order to detect healthy subjects at risk for cardiovascular events, several calculators are based upon cardiovascular risk factors with the Framingham Heart Study as the pioneering epidemiological study. The Framingham Heart Study was begun in 1948 with 5209 men and women [2] and identified major independent cardiovascular risk factors such as age, total and high-density lipoprotein cholesterol, systolic blood pressure, treatment for hypertension, smoking, and diabetes status. The Framingham Heart Study defines cardiovascular disease (CVD) as a composite of coronary heart disease (coronary death, myocardial infarction, coronary insufficiency, and angina), cerebrovascular events (including ischaemic stroke, haemorrhagic stroke and transient ischaemic attack), peripheral artery disease (intermittent claudication) and heart failure [2]. In Germany, calculators based on PROCAM (Prospective Cardiovascular Münster Study for fatal and non-fatal myocardial infarction) have been published by the Assmann Foundation (https://www.assmann-stiftung.de/procam-tests/), where risk for fatal or nonfatal myocardial infarction (AMI) and risk for fatal or nonfatal ischaemic stroke (STR) can be calculated with two different risk calculators. In Switzerland, the national working group on lipids and atherosclerosis (AGLA) has recommended the PROCAM risk calculator for fatal and nonfatal myocardial infarction with a calibration factor of 0.7, because international epidemiological data [3] and results from a Swiss imaging study [4] suggested that the Swiss population is at low risk for cardiovascular events. Further, the Swiss Heart Foundation has adopted a PROCAM-based score system for myocardial infarction in their HerzCheck® risk calculator [5].
In this study we address the question: how many other cardiovascular diseases such as ischaemic stroke, peripheral artery disease, coronary obstruction on an invasive coronary angiogram or coronary revascularisation (atherosclerotic cardiovascular disease; ASCVD) occur per one myocardial infarction? Since such diseases are all preventable, reporting only the risk for myocardial infarction may underestimate the risk for the aforementioned cardiovascular diseases. The reason for this exercise is that it has become a (mal)practice for almost 10 years to label AMI risk as ASCVD risk in Switzerland. Such mislabeling occurs, to the best of our knowledge, in Switzerland only. Several publications [6, 7], the AGLA website, the AGLA pocket guide and HerzCheck
® [5] show such confounding between the risk for AMI versus ASCVD since 2013.
The frequency relation between AMI and ASCVD was assessed in Germany using the DETECT study [8], where for every AMI another 4.6 ASCVD events occurred.
In this study we first present our own outcome data from the ARCO cohort study, where we assessed the occurrence of AMI, stroke (STR), percutaneous transluminal coronary angioplasty (PTCA), coronary artery bypass grafting (CABG) and obstructive coronary artery disease (CAD), and compared our results with the DETECT study. Second, we calculated calibration and discrimination as well as survival curves for the occurrence of myocardial infarction (AMI) and other cardiovascular events (ASCVD) using various risk assessment tools such as HerzCheck®, PROCAM-AMI, SCORE-ASCVD and carotid total plaque area (TPA). Third, we compared these risk assessment tools regarding the frequency of low-, intermediate- and high-risk results.
Materials and methods
We used the cohort method to detect cardiovascular events and used medical imaging (total carotid plaque area, TPA) compared with coronary/cardiovascular risk equations as predictors.
Patients with known ASCVD or diabetes mellitus were excluded. Consecutive patients aged 40–65 years were included in the study. All data were entered into an Excel spreadsheet for data processing and pseudonymisation.
Subject selection
In the Swiss Imaging Centre in Olten, subjects were self-referred to the Vascular Risk Foundation (Varifo) after public advertisements approved by the local ethics committee. In the German centre in Koblenz, all subjects were referred within a working medicine setting. Subjects had to be free of cardiovascular symptoms or disease or diabetes mellitus and be within the age range of 40 to 65 years. Laboratory values, blood pressure (measured once in the sitting position after a brief resting period with a plethysmographic method for measuring the systolic blood pressure) and medical history were obtained locally and entered into a spreadsheet (Excel, Microsoft, Richmond, USA).
Patient information
Blood pressure was measured in the imaging centres and a blood sample was obtained (usually in a fasting state) from all patients for lipid measurements. Smoking status, family history of premature coronary disease and presence of diabetes mellitus were self-reported.
Follow-up information
We contacted patients by telephone, email or post mail and asked them to inform us about the occurrence of cardiovascular events, either fatal or nonfatal myocardial infarction, percutaneous transluminal coronary angioplasty (PTCA), coronary artery bypass grafting (CABG), fatal or nonfatal stroke or transient ischaemic attack (TIA), or presence of a significant (≥50%) stenosis assessed by invasive coronary angiography. Whenever possible and always in unclear situations, we obtained clinical records from treating physicians. When coronary revascularisation was performed in patients with an acute myocardial infarction, the endpoint was adjudicated to myocardial infarction. The primary endpoint was a composite of acute myocardial infarction, stroke/TIA, or CABG. The secondary endpoint included the primary endpoint plus PTCA and coronary artery disease. Results were further compared with a single outcome measure (fatal or nonfatal myocardial infarction).
We decided to add CABG to the primary endpoint to improve the statistical power with an additional 21 CABG events, thus adding up to 78 primary events (total events could be nearly doubled with PTCA and CAD to 154 events). CABG is almost uniquely performed in severe coronary artery disease (left main stem or triple vessel disease) and is therefore a diagnosis related to advanced atherosclerosis and inherent cardiovascular risk.”
Sensitivity analysis
Because 20% of subjects were lost during follow-up, we performed a sensitivity analysis comparing patients with complete follow-up with the total of patients potentially available for our cohort study.
Ethical aspects
Subjects self-referred to the Varifo gave written consent. The study protocol was approved by the local ethics committee of Solothurn, Switzerland. Subsequently subjects were entered into an anonymised study registry, for which current legislation in Switzerland and Germany does not require formal ethics committee consent, since no medical intervention was performed within the study design.
Carotid imaging
Burden of longitudinal carotid plaque surface was imaged with a high-resolution ultrasound linear transducer probe (7.5–12.0 MHz), which identified plaques with intimal thickening ≥1.0 mm. The longitudinal area of all plaques was summed to give the total plaque area (TPA) in mm2. The sum of the cross-sectional areas of all plaques seen between the clavicle and the angle of the jaw was taken as TPA. Large calcified carotid plaques creating large areas of shadowing were rarely seen in subjects aged 40–65 years; therefore, this was not a significant problem when TPA was measured. Intraobserver reproducibility (MR) was tested for the right carotid artery in 57 patients with a correlation coefficient of r2 0.964 (left carotid artery r2 0.944, both arteries r2 0.986). For the cutoff of TPA 0–9 mm2, 10–49 mm2, 50–99 mm2 and ≥100 mm2 the kappa value was 0.69 (95% confidence interval [CI] 0.54–0.84) [9]. All TPA measurements were made by AA in Koblenz and by MR in Olten. Arterial age was calculated as previously reported [10]. We published a paper about arterial age for 1500 men and women separately and calculated arterial age as follows: mean values of TPA derived from 5-year intervals for men and women aged 35–79 years were plotted against the chronological age. An exponential function was added, which connected these 5-year intervals, and the equation of the line was displayed along with the 95% CIs. These two exponential equations describing TPA (y) as a function of age (x) were solved for x in order to determine the age at which such an amount of TPA is generally found in the population, i.e., the arterial age, for men and women separately.
Patient status was known to AA and MR in all cases.
Computation of cardiovascular risk
Cardiovascular risk was computed using the published risk formulae in an Excel spreadsheet. We used the European Society of Cardiology risk equation for low-risk populations (SCORE [11]) and the German PROCAM risk for myocardial infarction and for stroke multiplied by a correction factor of 0.7 [12]. Further, we calculated point scores for HerzCheck® and PROCAM with associated 10-year risk estimates and we calculated PROCAM using the original formula [13]. For net reclassification improvement (NRI) calculations we calculated sensitivity and specificity of TPA tertiles and arterial age classes and derived post-test risk calculations for PROCAM and SCORE using the Bayes theorem as described elsewhere [14].
Statistics
We used MedCalc software (Version 16.8.4) to calculate receiver operating characteristic (ROC) curves and their comparisons [15]. Groups were compared using a t-test for continuous variables and chi2 for categorical variables. NRIs were calculated as described elsewhere [16]. The NRI is a statistical tool to assess improvement in model performance offered by a new method of classification compared with a reference one. The NRI indicates how much more frequently appropriate reclassification than inappropriate reclassification occurs with the use of a new model of classification. The NRI is based on reclassification tables constructed separately for participants with and without the event of interest, and quantifies the correct movement in categories, upwards for events and downwards for non-events. Upward movement (up) are defined as a change into higher category based on the new algorithm and downward movement (down) as a change in the opposite direction. The NRI is defined as a proportion P as follows:
NRI = P(up|event) − P(down|event) + P(down|non-event) − P(up|non-event). The null hypothesis for NRI = 0 is tested using Z statistic following McNemar asymptotic test for correlated proportions.
Survival analysis was performed with Kaplan-Meier analysis and Cox proportional-hazards regression for both the primary and secondary outcomes. We assessed model performance using discrimination (ROC analysis). Patients were split according to TPA into those without atherosclerosis (reference group) and tertiles of TPA, and also split on the basis of arterial age below chronological age (reference group), and those with arterial age 1–10, 11–20, and >20 years over chronological age. Sensitivity and specificity of TPA tertiles and arterial age groups were analysed and used for post-test calculations with PROCAM and SCORE as the prior probabilities using the Bayes theorem.
The formula for the calculation of post-test probabilities was:
PTP positive: (PV x SE) / [PV x SE + (1 – PV) x (1 – SP)]
PTP negative: [PV x (1 – SE)] / [PV x (1 – SE) + SP x (1 – PV)]
Where PTP denotes post-test probability, PV denotes prevalence, SE denotes sensitivity, SP denotes specificity, pos denotes positive (test positivity) and neg denotes negative (test negativity). A TPA below the first tertile was considered to be a negative test. An arterial age below chronological age was considered a negative test. The level of statistical significance was set at p <0.05.
Results
Our cohort was built from data on subjects from the cardiological practice Kardiolab in Olten, Switzerland (n = 1255), the vascular risk foundation (Varifo) in Olten, Switzerland (n = 1050) and the prevention centre in Koblenz, Germany (n = 3326). All patients lived in central Europe or Switzerland with a predominantly white population.
Therefore, the original cohort is built of 5631 subjects, from which the following subjects were excluded for this study: 1255 Kardiolab subjects (no follow-up data, many patients had medical interventions that can alter the predictors used in this study); of 1050 Varifo subjects, subjects were excluded for age below 40 or over 65 years (n = 237) or diabetes (n = 30) or death for unknown reason (n = 5); in the Koblenz cohort, excluded were 124 subjects with diabetes and 528 for age reasons. The remaining 3452 subjects were eligible for study entry and follow-up data could be obtained for 2842 (82.3%) subjects, who were predominantly in Koblenz, Germany (80%); the German cohort contributed 123 ASCVD events to the total of 154 events (80%). Events werere confirmed by medical records in 75% and by telephone interview in 25%.
In the Varifo cohort, 16 deaths occurred, of which 5 were of unknown origin and these were excluded from the study. The remaining 11 deaths were attributed to myocardial infarction (n = 9) and to stroke (n = 2). All ASCVD deaths had a TPA above the third tertile, except for one with TPA in the second tertile (average TPA for all ASCVD deaths 136 mm2). In the Koblenz cohort, there were 10 deaths, of which 8 were attributed to myocardial infarction and 2 to stroke. In all these patients, TPA was within the third tertile (range 62–260 mm2, average 149 mm2).
The numbers of events contributing to the primary outcome were 41 AMIs, 16 strokes, 21 CABG (total 78 events) and the numbers of additional events in the secondary outcome were 41 PTCA and 35 CAD (adding another 74 events to the total 154 ).
The average follow-up time was 5.9 ± 2.9 years (range 3–144 months) and the ASCVD event rate was 5.4% or, by linear extrapolation, 9.2% in 10 years.
Table 1 shows the clinical baseline characteristics and cardiovascular risks. Of the 2842 observed subjects, 38% were women, average age was 50 ± 8 years, 21% were smokers, average systolic blood pressure was 126 mm Hg, average total cholesterol was 6.0 mmo/l (HDL 1.5 mmol/l, LDL 3.7 mmol/l) and the average total plaque area (TPA) was 42 ± 5 mm2. Subjects were at an average intermediate risk with SCORE (1.3%) and at low risk for PROCAM-AMI (4.8%), AGLA-AMI (3.3%), HerzCheck-AMI (4.1%) and PROCAM-AMISTR (6.2%).
Table 1Baseline characteristics, results from risk scores and imaging.
|
|
n = 2 842
|
| Female, n (%) |
1077 (38%) |
| Age (years) mean ± SD |
50 ± 8 |
| Smoker, n (%) |
609 (21%) |
| Systolic blood pressure (mm Hg), mean ± SD |
126 ± 16 |
| BMI (kg/m2) mean ± SD |
26 ± 4 |
| Cholesterol (mmol/l) mean ± SD |
6.0 ± 1.1 |
| High-density lipoprotein (mmol/l) mean ± SD |
1.5 ± 0.4 |
| Low-density lipoprotein (mmol/l) mean ± SD |
3.7 ± 0.9 |
| Triglycerides (mmol/l) mean ± SD |
1.6 ± 1.1 |
| Total plaque area (mm2) mean ± SD |
42 ± 54 |
| SCORE-ASCVD (%) mean ± SD |
1.3 ± 1.6 |
| PROCAM-AMI (%) mean ±+ SD |
4.8 ± 6.4 |
| PROCAM-STR (%) mean ±+ SD |
1.6 ± 1.7 |
| PROCAM-AMISTR (%) mean ±+ SD |
6.2 ± 7.6 |
| AGLA-AMI (%) mean ±+ SD |
3.3 ± 4.5 |
| AGLA-STR (%) mean ±+ SD |
1.0 ± 1.2 |
| AGLA-AMISTR (%) mean ±+ SD |
4.4 ± 5.3 |
| HerzCheck®-AMI (%) mean ±+ SD |
4.1 ± 5.1 |
Based upon our imaging results, definition of risk categories for TPA and arterial age were as follows: first (TPA 1–21 mm2), second (TPA 22–61 mm2) and third TPA tertile (TPA ≥62 mm2) and in subjects with arterial age older than chronological age by 11–20 or 21 years or more. The distribution of TPA was no plaque patients n = 728, and for tertiles 1, 2 and 3 n = 720, n = 687 and n = 707, respectively.
Figure 1 shows unadjusted risk prediction results for TPA tertiles and arterial age groups for the primary and secondary outcomes. A 20% risk was reached for arterial age regarding the primary outcome after 11 years, and secondary high-risk outcome was reached with TPA third tertile after 6 years and was reached with arterial age high-risk after 4 years.
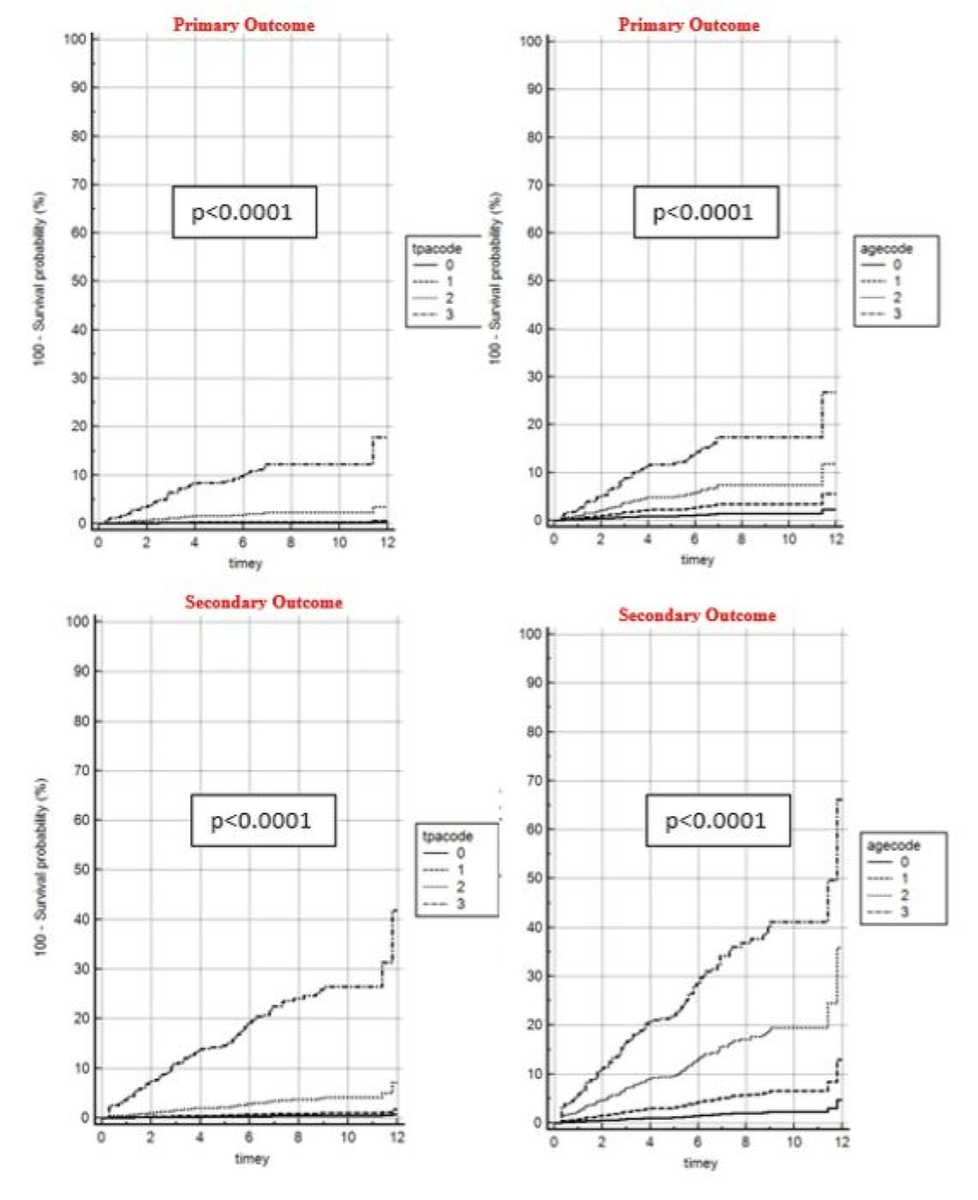
Figure 1 Unadjusted hazard ratioss for primary (hard events) and secondary (all events) outcome associated with TPA and differences in arterial age
aacode: arterial age code (0 = below calander age [cAge], 1 = 1–10 years older than cAge, 2 = 11–20 years older than cAge, 3 = >20 years older than cAge). tpacode: total plaque area code (0 = no atherosclerosis, 1 = first tertile, 2 = second tertile, 3 = third tertile)
The p-values for trend of TPA and arterial age as a continuous variable were highly significant (all p <0.0001) with Wald test values derived from a Cox proportional-hazards regression of 244 for the primary and 519 for the secondary outcome with TPA, and Wald values of 103 for the primary and 221 for the secondary outcome with arterial age.
Tables 2 and 3 show observed event rates in the ARCO study for AMI, AMISTR, AMISTRCABG and all events, the associated follow-up times and the extrapolated event rates for 10 years. From this we observed a risk for AMI of 5.5% in 10 years, of AMISTR of 7.4%, of AMISTRCABG of 9.3% and for all events of 16.6% (table 2). PROCAM-AMI risk was 4.8%, therefore underestimating ARCO-AMI risk by a calibration factor of 0.87 and the associated correction factor should be 1.15, giving an underestimation of AMI risk of 15%. Table 2 also shows an example of a subject with a PROCAM-AMI risk of 6% and applied correction factors for AMI (6.92%), AMISTR (9.31%), AMISTRCABG (11.64%) and all events (20.71%). Therefore, an AMI risk of 6% turns out to be an ASCVD risk of 21%.
Table 2Calibration factors and performance of PROCAM and AGLA to detect events from the ARCO cohort with event rates extrapolated to 10 years for various outcomes separately (AMI, AMI + STR, AMI + STR + CABG, All).
| Observation (ARCO) and estimation (PROCAM, AGLA) |
| Follow-up time (years) |
5.9 |
2.6 |
2.7 |
2.9 |
3.3 |
| ARCO |
All patients |
AMI |
AMISTR |
AMISTRCABG |
All events |
| Event rate (%) |
|
1.44 |
2.01 |
2.7 |
5.4 |
|
|
10 years extrapolation |
| Outcome |
|
AMI |
AMISTR |
AMISTRCABG |
All |
| ARCO |
|
5.5 |
7.4 |
9.3 |
16.6 |
| Baseline |
Estimates |
Calibration |
| PROCAM-AMI |
4.8 |
0.87 |
0.64 |
0.52 |
0.29 |
| PROCAM-AMISTR |
6.3 |
1.14 |
0.85 |
0.68 |
0.38 |
| AGLA-AMI |
3.4 |
0.61 |
0.45 |
0.36 |
0.20 |
| AGLA- AMISTR |
4.4 |
0.80 |
0.59 |
0.47 |
0.27 |
| Correction |
|
Correction factors |
| PROCAM-AMI |
|
1.15 |
1.55 |
1.94 |
3.45 |
| PROCAM- AMISTR |
|
0.88 |
1.18 |
1.48 |
2.63 |
| AGLA-AMI |
|
1.65 |
2.22 |
2.77 |
4.93 |
| AGLA- AMISTR |
|
1.26 |
1.69 |
2.11 |
3.76 |
| Example |
|
6% AMI risk multiplied by correction factor |
| PROCAM-AMI |
|
6.92 |
9.31 |
11.64 |
20.71 |
| PROCAM- AMISTR |
|
5.27 |
7.09 |
8.87 |
15.78 |
| AGLA-AMI |
|
9.89 |
13.29 |
16.63 |
29.58 |
| AGLA- AMISTR |
|
7.54 |
10.13 |
12.67 |
22.54 |
| Discrimination |
|
ROC AUC analysis |
| PROCAM-AMI |
|
|
0.84 |
0.83 |
0.83 |
| PROCAM- AMISTR |
|
|
0.85 |
0.84 |
0.84 |
| TPA |
|
|
0.83 |
0.85 |
0.89 (0.01) |
| Survival |
|
Survival analysis (Cox proportional hazards model) |
| PROCAM-AMI |
|
|
N.S. |
N.S. |
N.S. |
| PROCAM-AMISTR |
|
|
N.S. |
N.S. |
N.S. |
| TPA |
|
|
<0.0001 |
<0.0001 |
<0.0001 |
Table 3 adds a calibration factor to the ARCO 10-year risk of 0.7 in order to simulate the expected lower risk present in Switzerland. In consequence, AGLA-AMI underestimates risk, which results in a correction factor of 1.15 and underestimates ASCVD risk with a correction factor of 3.45.
Table 3Calibration factors for PROCAM and AGLA to detect events from the ARCO cohort with event rates extrapolated to 10 years for various outcomes separately (AMI, AMI + STR, AMI + STR + CABG, All). Outcome was multiplied by 0.7 to reflect the expected risk in Switzerland.
| Observation (ARCO) and estimation (PROCAM, AGLA) with outcome calibration of 0.7. |
| Follow-up time |
5.9 |
2.6 |
2.7 |
2.9 |
3.3 |
| ARCO |
All patients |
AMI |
AMISTR |
AMISTRCABG |
All events |
| Event ate (%) |
|
1.44 |
2.01 |
2.7 |
5.4 |
|
|
10-year extrapolation |
| Outcome |
|
AMI |
AMISTR |
AMISTRCABG |
All |
| ARCO |
|
3.9 |
5.2 |
6.5 |
11.6 |
| Baseline |
Estimates |
Calibration |
| PROCAM-AMI |
4.8 |
1.24 |
0.92 |
0.74 |
0.41 |
| PROCAM-AMISTR |
6.3 |
1.63 |
1.21 |
0.97 |
0.54 |
| AGLA-AMI |
3.4 |
0.87 |
0.64 |
0.52 |
0.29 |
| AGLA-AMISTR |
4.4 |
1.14 |
0.85 |
0.68 |
0.38 |
| Correction |
|
Correction factors |
| PROCAM-AMI |
|
0.81 |
1.09 |
1.36 |
2.42 |
| PROCAM-AMISTR |
|
0.62 |
0.83 |
1.03 |
1.84 |
| AGLA-AMI |
|
1.15 |
1.55 |
1.94 |
3.45 |
| AGLA- AMISTR |
|
0.88 |
1.18 |
1.48 |
2.63 |
| Example |
|
6% AMI risk multiplied by correction factor |
| PROCAM-AMI |
|
4.85 |
6.51 |
8.15 |
14.49 |
| PROCAM-AMISTR |
|
3.69 |
4.96 |
6.21 |
11.04 |
| AGLA-AMI |
|
6.92 |
9.31 |
11.64 |
20.71 |
| AGLA-AMISTR |
|
5.27 |
7.09 |
8.87 |
15.78 |
Tables 4 and 5 show the discrimination comparison of HerzCheck, PROCAMold (prior PROCAM version available at https://www.kardiolab.ch/MONICA-PROCAM3_RA1.html) and PROCAM to detect primary and secondary outcomes. PROCAM (AUC 0.835) outperformed HerzCheck (AUC 0.809) and PROCAMold (AUC 0.815) significantly (p = 0.02 for AUC difference), whereas for the secondary outcome, PROCAM (AUC 0.832) outperformed HerzCheck® (AUC 0.817) significantly (p = 0.020), but not PROCAMold.
Table 4Discrimination (ROC analysis) comparison of HerzCheck, PROCAMold and PROCAM to detect primary outcome (AMI + STR + CABG).
|
AUC
|
SD
|
95% confidence interval
|
| HerzCheck®-AMI |
0.809 |
0.0206 |
0.794–0.823 |
| PROCAMold-AMI |
0.815 |
0.0195 |
0.800–0.829 |
| PROCAM-AMI |
0.835 |
0.0182 |
0.821–0.848 |
Table 5Discrimination (ROC analysis) comparison of HerzCheck, AGLAold and AGLA to detect secondary outcome (all cardiovascular events).
|
AUC
|
SD
|
95% confidence interval
|
| HerzCheck®-AMI |
0.817 |
0.0148 |
0.802–0.831 |
| PROCAMold-AMI |
0.816 |
0.0146 |
0.801–0.830 |
| PROCAM-AMI |
0.832 |
0.0139 |
0.818–0.846 |
Appendix table S1 shows the reclassification of risk categories for various risk calculator combinations, their associated kappa (agreement) values and the net reclassification changes. As an example, PROCAM-AMI would classify 3.1% of subjects in a higher risk category than SCORE-ASCVD, but SCORE-ASCVD would classify 31.1% of subjects in a higher risk category than PROCAM-AMI, resulting in a net reclassification difference of 33.7%. The largest reclassification difference was found for AGLA-AMI versus SCORE-ASCVD (37.6%). The smallest difference regarding reclassification was 7% for PROCAM-AMI versus PROCAM-AMI-STR with an expected high kappa value of 0.76.
Tables 6 and 7 show a Cox proportional hazards model survival analysis for the primary and the secondary outcomes using HerzCheck, PROCAM, SCORE and TPA. For the primary outcome (AMI + STROKE + CABG), only TPA remained as a significant predictor. For the secondary outcome, TPA and HerzCheck were significant predictors, but PROCAM and SCORE were not in both models.
Table 6Cox proportional hazards model survival analysis for the primary outcome using the covariates HerzCheck®, PROCAM, SCORE and TPA.
|
Covariate
|
b
|
SE
|
Wald
|
p-value
|
Exp(b)
|
95% CI of Exp(b)
|
| HerzCheck®-AMI |
0.0573 |
0.03131 |
3.3497 |
0.0672 |
1.059 |
0.9959–1.1260 |
| PROCAM-AMI |
–0.0008 |
0.02159 |
0.001445 |
0.9697 |
0.9992 |
0.9578–1.0424 |
| SCORE-ASCVD |
0.07514 |
0.04367 |
2.9606 |
0.0853 |
1.078 |
0.9896–1.1744 |
| TPA |
0.01042 |
0.0009197 |
128.2606 |
<0.0001
|
1.0105 |
1.0086–1.0123 |
Table 7Cox proportional hazards model survival analysis for the secondary outcome using the covariates HerzCheck®, PROCAM, SCORE and TPA.
|
Covariate
|
b
|
SE
|
Wald
|
p-value
|
Exp(b)
|
95% CI of Exp(b)
|
| HerzCheck®-AMI |
0.05855 |
0.02236 |
6.8572 |
0.0088
|
1.0603 |
1.0148–1.1078 |
| PROCAM-AMI |
0.00674 |
0.01487 |
0.2056 |
0.6503 |
1.0068 |
0.9779–1.0365 |
| SCORE-ASCVD |
0.04122 |
0.03287 |
1.5721 |
0.2099 |
1.0421 |
0.9771–1.1114 |
| TPA |
0.0108 |
0.0006211 |
302.3675 |
<0.0001
|
1.0109 |
1.0096–1.0121 |
Appendix table S2 shows the net reclassification improvements using either TPA or arterial age categories, which are statistically significant for the primary outcome and the secondary outcome with improvements of 37% to 42%.
Table 8 shows the patient characteristics stratified by no atherosclerosis (reference group) and presence of atherosclerosis defined by TPA tertiles. In all groups, AGLA average risk was below 10% (6.7%), whereas SCORE showed average intermediate risk in the third tertile high-risk cohort, where an event rate of 38.2% was expected by linear extrapolation of the 5 observed years.
Table 8Characteristics of patients and estimates of myocardial infarction (PROCAM, AGLA) or cardiovascular (SCORE) risk, stratified by atherosclerosis presence (TPA tertiles).
|
TPA groups
|
All
|
Zero plaque
|
Carotid plaque tertiles (TPA)
|
|
0
|
1
|
2
|
3
|
| N (%) |
2842 |
728 (26%) |
688 (24%) |
719 (25%) |
707 (25%) |
| Age (years), mean ± SD |
50.1 ± 7.6 |
44.3 ± 6.4 |
49.8 ± 7.0 |
51.8 ± 6.8 |
54.7 ± 5.9 |
| LDL (mmol/l), mean ± SD |
3.7 ± 0.9 |
3.4 ± 0.8 |
3.6 ± 0.9 |
3.8 ± 0.9 |
4.1 ± 1.0 |
| Follow up (years), mean ± SD |
5.9 ± 2.9 |
5.1 ± 2.8 |
6.2 ± 2.8 |
5.8 ± 2.8 |
4.7 ± 2.9 |
| Event (%) |
5.4 |
0.3 |
0.7 |
2.9 |
17.8 |
| Event10 (%) |
10.0 |
0.5 |
1.2 |
5.0 |
38.2 |
| SCORE-ASCVD, mean ± SD |
1.3 ± 1.6 |
0.5 ± 0.6 |
0.9 ± 1.0 |
1.4 ± 0.9 |
2.6 ± 2.2 |
| PROCAM-AMI, mean ± SD |
4.8 ± 6.4 |
1.8 ± 2.9 |
3.0 ± 4.0 |
4.9 ± 2.8 |
9.5 ± 8.7 |
| AGLA-AMI, mean ± SD |
3.3 ± 4.5 |
1.2 ± 2.0 |
2.1 ± 2.8 |
3.4 ± 5.5 |
6.7 ± 6.1 |
Table 9 shows the cumulative incidence of cardiovascular events with myocardial infarction as the reference observed in the DETECT [8] and in the ARCO study. For every AMI, 1.8 AMI+STR occur in the combination of DETECT with ARCO; when adding revascularisation and peripheral or coronary artery disease, cumulative incidence increases by a factor of 4.1.
Table 9Incidence of cardiovascular endpoints in DETECT [8] (n = 4044) and ARCO (n = 2842) and combination of both studies with 34,340 observed patient years (29 transient ischaemic attacks from DETECT were excluded from this analysis).
|
Endpoint
|
DETECT
|
ARCO
|
DETECT+ARCO
|
|
Events
|
Cumulative incidence
|
Events
|
Cumulative incidence
|
Sum of events
|
Cumulative incidence
|
| AMI |
30 |
1.00 |
41 |
1.00 |
71 |
1.00 |
| STR |
40 |
2.33 |
16 |
1.39 |
56 |
1.79 |
| PTCA/CAGB |
36 |
3.53 |
62 |
2.90 |
98 |
3.17 |
| CAD/ PAD |
32 |
4.60 |
35 |
3.76 |
67 |
4.11 |
| All |
138 |
|
154 |
|
292 |
|
Figure 2 shows risk prediction with AGLA stratified by zero carotid plaque and TPA tertiles and observed (extrapolated) 10-year event rate in ARCO. In patients with TPA in the third tertile, AGLA risk is 7% and observed risk is 38%, an underestimation of risk by a factor of 5.7.
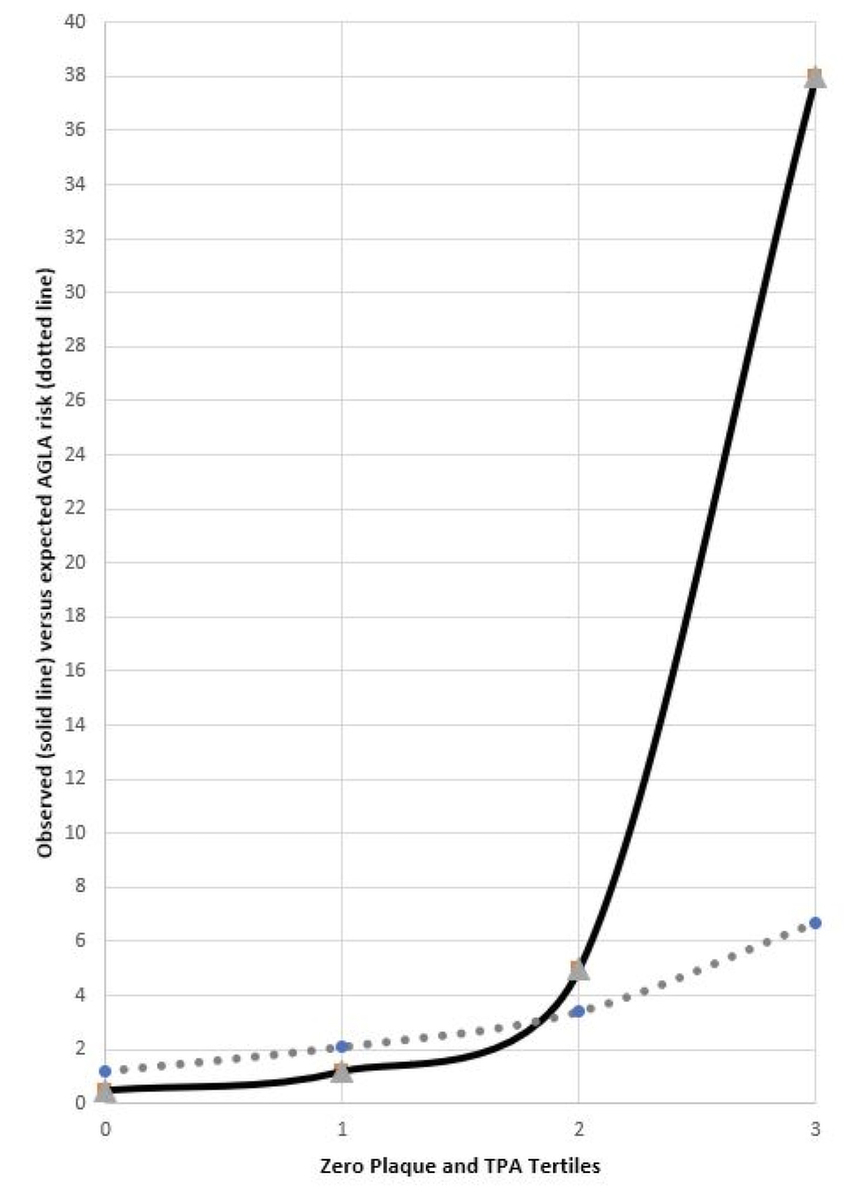
Figure 2 Observed events (solid) and AGLA-AMI prediction (dotted line) plotted by zero plaque and TPA tertiles in the ARCO study.
Sensitivity analysis showed that those with complete follow-up (n = 2842) and the whole group of patients (n = 5314) were comparable regarding sex (37% vs 36% women), average age (50 and 52 years), smokers (21% vs 22%), blood pressure (126 vs 126 mm Hg), total cholesterol (6.0 vs 6.0 mmol/l), HDL (1.5 vs 1.5 mmol/l), LDL (3.7 vs 3.7 mmol/l), Triglycerides (1.6 vs 1.5 mmol/l), and TPA (42 vs 46 mm2).
Discussion
The principal result of this study in subjects aged 40 to 65 years is a correction factor of 3.8, which allows estimation of the 10-year risk for atherosclerotic cardiovascular disease (ASCVD) from the myocardial infarction (PROCAM-AMI) risk. Therefore, a subject with a PROCAM-AMI risk of 6% is expected to have an ASCVD risk of 23%.
Similarly, the German DETECT study [8] found a correction factor of 4.6 and the combination of DETECT and ARCO with 34,340 observed patient years resulted in a correction factor of 4.1. In clinical practice, a PROCAM risk of 5%, which is regarded as low risk for fatal and non-fatal myocardial infarction would give an estimated ASCVD risk of 20% in 10 years, which would probably represent a high ASCVD risk. Therefore, terms such as “global cardiovascular risk” or “cardiovascular risk” should not be used to describe AMI risk defined by PROCAM-AMI, because such a description underestimates ASCVD risk by a factor of 4 and is therefore expected to result in a frequent underestimation of ASCVD risk in Switzerland.
According to SCORE2, the new European guidelines to assess cardiovascular risk in primary care [17], a 10-year risk is available for ASCVD, defined as a composite of cardiovascular mortality, non-fatal myocardial infarction and non-fatal stroke. In subjects aged below 50 years, a SCORE2 risk below 2.5% is a low risk and above or equal 7.5% represent a high-risk situation. Cut-offs for subjects aged 50–69 years are 5% and 10%, respectively. If we put our results in perspective with SCORE2 recommendations, we find a PROCAM-AMI risk of 5% to represent high ASCVD risk in a population aged 50 years on average. Therefore, we may propose multiplying PROCAM-AMI by a correction factor of 4 in order to estimate ASCVD risk. We calculated SCORE2 risk in our population (data not shown) and found a SCORE2 risk of 4.5 ± 3.0% in the ARCO study, which is very close to the PROCAM-AMI risk of this cohort (4.8%). Therefore, the European guideline investigators have chosen not to use such a correction factor, but to substantially lower the risk threshold for high risk from 20% to 7.5%, which is 2.7 times lower (in subjects aged 50–69 years, high risk was reduced from 20% to 10%). According to a health technology assessment of the Federal Office of Public Health, the incremental cost-effectiveness ratios per quality-adjusted life years for the use of statins in primary care were all cost-effective through ages 40–75 and an AGLA risk of 5% [18], and even showed a return-on-investment for AGLA risk above 15%. Therefore, from a cost-effectiveness point of view also, drastic lowering of the AGLA high-risk threshold from 20% to 7.5% or 10% (in subjects aged 50–69 years) is inevitably required in order to better address the ASCVD epidemic.
With respect to calibration for myocardial infarction (AMI), AGLA underestimated the extrapolated 10-year risk found in ARCO by 65%. However, 80% of the ARCO population was composed of German habitants from the Koblenz area, so – for Switzerland – it may be justified to multiply the ARCO risk by 0.7 (table 3), where risk by AGLA for AMI is still underestimated by 15%. If we assess the calibration factors of AGLA for AMI+STR and for all ASCVD events, then risk is underestimated by factors of 1.55 and 3.45, respectively (table 3). AGLA risk appears appropriate to detect AMI risk in a contemporary population with good calibration in Switzerland, but for other cardiovascular outcomes such as stroke, CABG, PTCA and coronary artery disease (CAD, confirmed by a coronary angiogram), calibration is poor or even extremely poor. Therefore, to calculate ASCVD risk, it is important to add additional risk elements, for example, from PROCAM STR or by direct calculation of SCORE ASCVD or by using the new SCORE2 risk calculator [17]. Moreover, as presented in Table S1, many patients at low risk with PROCAM-based calculators have intermediate risk with SCORE-ASCVD.
For discrimination using receiver operating curve (ROC) analysis, similar results were found for HerzCheck®, PROCAM old and PROCAM-AMI with slightly better performance for PROCAM-AMI, looking at the primary and secondary outcomes.
In the survival analysis for the primary outcome, only TPA remained a significant predictor, whereas for the secondary outcome, HerzCheck® added a little more prognostic information to a highly significant TPA, but neither PROCAM-AMI nor SCORE-ASCVD added prognostic information over TPA in our multivariate Cox proportion hazards model. Our reclassification model (table S2) using risk derived from the Bayes theorem in conjunction with PROCAM-AMI and SCORE-ASCVD significantly reclassified patients into the correct outcome category. This finding shows that the addition of carotid plaque information adds to the correct allocation of patients into risk categories; assessments of carotid plaques is also recommended by the ESC [11].
When we stratified observed events by zero plaque and TPA tertiles (table 8, fig. 2), we found that patients in the third tertile of TPA (25% of the ARCO population) had a remarkably high extrapolated 10-year risk of 38%, whereas PROCAM and AGLA on average remained low and SCORE remained in intermediate risk category on average.
Our prognostic results over an average of 5.9 years might be biased by preventive interventions, especially with statins, since lipids appear to be the strongest population-attributable risk factor for cardiovascular events worldwide. [19]. Our study cohort was mainly statin naïve because we found, although only anecdotally and not formally studied, that most patients with atherosclerosis were not offered statins.
Similarly to other studies [20, 21], we were able to assess only a limited number of follow-up patients (82%), which excludes the derivation of absolute risk in our cohort associated with the used risk markers; however, the limited number of follow-ups does not bias the relative diagnostic power of the risk markers used and our sensitivity analysis renders a selection bias unlikely. Third, we were able to include only a limited number of women and only a limited number of subjects / cardiovascular events from the Olten Centre; however, previous studies have assessed sufficiently high numbers of women and found similar predictive strengths in women [22, 23]. Further, we could not use the help of an independent outcome committee; however the results of singular risk factors and risk estimators significantly detected events, therefore misclassification in our records is very unlikely. Because TIA may be regarded as a difficult outcome measure, we excluded patients with stroke/TIA and found that TPA significantly improved AUC by 4.8% (p = 0.0048) when compared with PROCAM and significantly improved AUC by 6.1% (p = 0.0002) for the secondary outcome. Finally, the non-population-based selection process for the two cohorts may reduce the generalisability of our results.
Several questions remain. Recalibration of the existing instruments or replacement of the AGLA score by SCORE2 or recommendation to measure the total plaque area (TPA) as a primary preventive measure? Which endpoint or event should be chosen for a recalibration in order to indicate, for example, the use of a statin (PTCA or CAD stenosis)? What would this mean for education (specialists who can reliably determine TPA), for the indication of statins (with the current calibration and with an adjusted calibration) and for the healthcare costs of the total population in Switzerland [24]?
From the literature it appears that preventive therapies should be targeted as soon as possible: according to a Markov Model from Germany [25], projections of disease burden will be massive until the year 2060 and the only cost-effective way to deal with this epidemic is intensified preventive medicine. We have found statins and TPA to be cost effective in primary care in a recent study [24]. Disease compression [26–29] and effective prevention [30, 31] are indispensable tools to avoid unaffordable healthcare costs in the future.
Conclusions
PROCAM-based calculators such as AGLA and HerzCheck® showed similar discriminatory power when compared with SCORE, but classification analysis showed that AGLA-AMI should not be interchanged for cardiovascular (ASCVD) outcomes, because it underestimates ASCVD risk by a factor of 4.
We showed that the use of carotid TPA helps to further stratify patients into correct risk categories and may be used more frequently in clinical practice.
As an alternative to PROCAM, SCORE2 risk might show promising results in the future in Switzerland and would eliminate the labelling problem of the AGLA risk calculator.
Michel Romanens, MD
Vascular Risk Foundation
Spitalstrasse 9
CH-4600 Olten
michel.romanens[at]hin.ch
References
1.
Quinto CB
. Prävention in der Grundversorger-Praxis. Schweiz Arzteztg. 2020;101(48):1605–1605. https://doi.org/10.4414/saez.2020.19409
2.
D’Agostino RB Sr
,
Vasan RS
,
Pencina MJ
,
Wolf PA
,
Cobain M
,
Massaro JM
, et al.
General cardiovascular risk profile for use in primary care: the Framingham Heart Study. Circulation. 2008 Feb;117(6):743–53. https://doi.org/10.1161/CIRCULATIONAHA.107.699579
3.
Wietlisbach V
,
Paccaud F
,
Rickenbach M
,
Gutzwiller F
. Trends in cardiovascular risk factors (1984-1993) in a Swiss region: results of three population surveys. Prev Med. 1997 Jul-Aug;26(4):523–33. https://doi.org/10.1006/pmed.1997.0167
4.
Romanens MJ
,
Berger DC
,
Battegay EJ
. Predictive value of clinical risk assessment tools and guidelines for 10-year coronary heart disease risk in practice-based primary care. Kardiovaskuläre Medizin. 2005;8:180–6.
5.
Herzstiftung S
. Das neue Jahr schon im Griff? Schweizerische Herzstiftung 2019:30–1.
6.
Riesen W
. Behandlung modifizierbarer Risikofaktoren. Der Inf Arzt 2016;06.
7. AGLA Pressemitteilung vom 07.11.2013 n.d.
8.
Grammer TB
,
Dressel A
,
Gergei I
,
Kleber ME
,
Laufs U
,
Scharnagl H
, et al.
Cardiovascular risk algorithms in primary care: results from the DETECT study. Sci Rep. 2019 Jan;9(1):1101. https://doi.org/10.1038/s41598-018-37092-7
9.
Romanens M
,
Mortensen MB
,
Sudano I
,
Szucs T
,
Adams A
. Extensive carotid atherosclerosis and the diagnostic accuracy of coronary risk calculators. Prev Med Rep. 2017 Mar;6:182–6. https://doi.org/10.1016/j.pmedr.2017.03.006
10.
Romanens M
,
Ackermann F
,
Sudano I
,
Szucs T
,
Spence JD
. Arterial age as a substitute for chronological age in the AGLA risk function could improve coronary risk prediction. Swiss Med Wkly. 2014 Jul;144:w13967. https://doi.org/10.4414/smw.2014.13967
11.
Mach F
,
Baigent C
,
Catapano AL
,
Koskinas KC
,
Casula M
,
Badimon L
, et al.; ESC Scientific Document Group
. 2019 ESC/EAS Guidelines for the management of dyslipidaemias: lipid modification to reduce cardiovascular risk. Eur Heart J. 2020 Jan;41(1):111–88. https://doi.org/10.1093/eurheartj/ehz455
12.
Voss R
,
Cullen P
,
Schulte H
,
Assmann G
. Prediction of risk of coronary events in middle-aged men in the Prospective Cardiovascular Münster Study (PROCAM) using neural networks. Int J Epidemiol. 2002 Dec;31(6):1253–62. https://doi.org/10.1093/ije/31.6.1253
13.
Silber S
,
Jarre F
,
Pittrow D
,
Klotsche J
,
Pieper L
,
Zeiher AM
, et al.; DETECT-Studiengruppe
. [Cardiovascular risk assessment by primary-care physicians in Germany and its lack of agreement with the Established Risk Scores (DETECT)]. Med Klin (Munich). 2008 Sep;103(9):638–45. https://doi.org/10.1007/s00063-008-1103-2
14.
Romanens M
,
Ackermann F
,
Spence JD
,
Darioli R
,
Rodondi N
,
Corti R
, et al.
Improvement of cardiovascular risk prediction: time to review current knowledge, debates, and fundamentals on how to assess test characteristics. Eur J Cardiovasc Prev Rehabil. 2010 Feb;17(1):18–23. https://doi.org/10.1097/HJR.0b013e3283347059
15.
DeLong ER
,
DeLong DM
,
Clarke-Pearson DL
. Comparing the areas under two or more correlated receiver operating characteristic curves: a nonparametric approach. Biometrics. 1988 Sep;44(3):837–45. https://doi.org/10.2307/2531595
16.
Melander O
,
Newton-Cheh C
,
Almgren P
,
Hedblad B
,
Berglund G
,
Engström G
, et al.
Novel and conventional biomarkers for prediction of incident cardiovascular events in the community. JAMA. 2009 Jul;302(1):49–57. https://doi.org/10.1001/jama.2009.943
17. Collaboration S working group and EC risk., Achenbach S., Aleksandrova K., et al. SCORE2 risk prediction algorithms: new models to estimate 10-year risk of cardiovascular disease in Europe. Eur Heart J 2021;42(25):2439–54. Doi: https://doi.org/10.1093/eurheartj/ehab309.
18.
Oordt A
, Bunge E, van den Ende C, et al. Health Technology Assessment (HTA): Statins for primary prevention of cardiovascular events and mortality in Switzerland. 2021.
19.
Yusuf S
,
Hawken S
,
Ounpuu S
,
Dans T
,
Avezum A
,
Lanas F
, et al.; INTERHEART Study Investigators
. Effect of potentially modifiable risk factors associated with myocardial infarction in 52 countries (the INTERHEART study): case-control study. Lancet. 2004 Sep;364(9438):937–52. https://doi.org/10.1016/S0140-6736(04)17018-9
20.
Belcaro G
,
Nicolaides AN
,
Ramaswami G
,
Cesarone MR
,
De Sanctis M
,
Incandela L
, et al.
Carotid and femoral ultrasound morphology screening and cardiovascular events in low risk subjects: a 10-year follow-up study (the CAFES-CAVE study(1)). Atherosclerosis. 2001 Jun;156(2):379–87. https://doi.org/10.1016/S0021-9150(00)00665-1
21.
Baber U
,
Mehran R
,
Sartori S
,
Schoos M
,
Falk E
,
Sillesen H
, et al.
Detection and Impact of Subclinical Coronary and Carotid Atherosclerosis on Cardiovascular Risk Prediction and Reclassification in Asymptomatic Us Adults: Insights From the High Risk Plaque Bioimage Study. J Am Coll Cardiol. 2014;63(12):A998. https://doi.org/10.1016/S0735-1097(14)60998-0
22.
Brunner FJ
,
Waldeyer C
,
Ojeda F
,
Salomaa V
,
Kee F
,
Sans S
, et al.; Multinational Cardiovascular Risk Consortium
. Application of non-HDL cholesterol for population-based cardiovascular risk stratification: results from the Multinational Cardiovascular Risk Consortium. Lancet. 2019 Dec;394(10215):2173–83. https://doi.org/10.1016/S0140-6736(19)32519-X
23.
Romanens M
,
Sudano I
,
Adams A
,
Schober EA
. Sonographic assessment of carotid atherosclerosis: preferred risk indicator for future cardiovascular events? Swiss Med Wkly. 2019 Dec;149:w20142. https://doi.org/10.4414/smw.2019.20142
24.
Romanens M
,
Adams A
,
Bojara W
,
Balint S
,
Warmuth W
. Cost-effectiveness analysis of statins in primary care: results from the Arteris cohort study. Swiss Med Wkly. 2021 Apr;151:w20498. https://doi.org/10.4414/smw.2021.20498
25.
Milan V
,
Fetzer S
,
Hagist C
. Healing, surviving, or dying? - projecting the German future disease burden using a Markov illness-death model. BMC Public Health. 2021 Jan;21(1):123. https://doi.org/10.1186/S12889-020-09941-6 https://doi.org/10.1186/s12889-020-09941-6
26.
Gesundheitsförderung Schweiz
. Gesundheitsförderung im Alter - Fakten und Zahlen. Faktenblatt. 2016;15:1–8.
27.
Fries JF
. Aging, natural death, and the compression of morbidity. N Engl J Med. 1980 Jul;303(3):130–5. https://doi.org/10.1056/NEJM198007173030304
28.
Felder S
. Im Alter krank und teuer? GGW. 2008;8:20–30.
29.
Degenkolbe B
,
Gette E
,
Höpfner T
,
Warmuth W
. Auf Leben und Tod - Spezifische Implikationen eines vermeintlich längeren Lebens für die Versicherungswirtschaft (1+2). Zeitschrift Für Versicherungswes 2011;23.
30.
Allen NB
,
Zhao L
,
Liu L
,
Daviglus M
,
Liu K
,
Fries J
, et al.
Favorable Cardiovascular Health, Compression of Morbidity, and Healthcare CostsClinical Perspective. Circulation. 2017;135(18):1693–701. https://doi.org/10.1161/CIRCULATIONAHA.116.026252
31.
Jagger C
. Compression or expansion of morbidity—what does the future hold? Age Ageing. 2000 Mar;29(2):93–4. https://doi.org/10.1093/ageing/29.2.93
Appendix: Supplementary tables
Table S1Reclassification of risk, kappa statistics and summed net reclassification changes.
|
N
|
%
|
Net %
|
|
PROCAM-AMI |
| L |
M |
H |
87 |
3.1 |
33.7 |
| SCORE-ASCVD |
L |
1601 |
16 |
0 |
870 |
30.6 |
|
| M |
823 |
240 |
71 |
|
|
|
| H |
15 |
32 |
44 |
|
Kappa
|
0.28
|
|
PROCAM-AMISTR |
| L |
M |
H |
130 |
4.6 |
30.4 |
| SCORE-ASCVD |
L |
1597 |
17 |
3 |
734 |
25.8 |
|
| M |
706 |
318 |
110 |
|
|
|
| H |
1 |
27 |
63 |
|
Kappa
|
0.37
|
|
HerzCheck-AMI |
| L |
M |
H |
42 |
1.5 |
34.4 |
| SCORE-ASCVD |
L |
1597 |
20 |
0 |
934 |
32.9 |
|
| M |
867 |
245 |
22 |
|
|
|
| H |
19 |
48 |
24 |
|
Kappa
|
0.25
|
|
AGLA-AMI |
| L |
M |
H |
20 |
0.7 |
37.6 |
| SCORE-ASCVD |
L |
1612 |
5 |
0 |
1048 |
36.9 |
|
| M |
975 |
144 |
15 |
|
|
|
| H |
33 |
40 |
18 |
|
Kappa
|
0.16
|
|
PROCAMpoint-AMI |
| L |
M |
H |
34 |
1.2 |
36.0 |
| SCORE-ASCVD |
L |
1612 |
5 |
0 |
988 |
34.8 |
|
| M |
926 |
179 |
29 |
|
|
|
| H |
18 |
44 |
29 |
|
Kappa
|
0.21
|
|
PROCAMpoint-AMI |
| L |
M |
H |
5 |
0.2 |
13.0 |
| PROCAM-AMISTR |
L |
2301 |
3 |
0 |
363 |
12.8 |
|
| M |
243 |
117 |
2 |
|
|
|
| H |
12 |
108 |
56 |
|
Kappa
|
0.5
|
|
AGLA-AMI |
| L |
M |
H |
0 |
0.0 |
15.8 |
| PROCAM-AMISTR |
L |
2304 |
0 |
0 |
449 |
15.8 |
|
| M |
306 |
56 |
0 |
|
|
|
| H |
10 |
133 |
33 |
|
Kappa
|
0.35
|
|
HerzCheck-AMI |
| L |
M |
H |
59 |
2.1 |
14.7 |
| PROCAM-AMISTR |
L |
2249 |
55 |
0 |
358 |
12.6 |
|
| M |
224 |
134 |
4 |
|
|
|
| H |
10 |
124 |
42 |
|
Kappa
|
0.47
|
|
PROCAM-AMI |
| L |
M |
H |
0 |
0.0 |
6.9 |
| PROCAM-AMISTR |
L |
2304 |
0 |
0 |
195 |
6.9 |
|
| M |
134 |
228 |
0 |
|
|
|
| H |
1 |
60 |
115 |
|
Kappa
|
0.76
|
|
PROCAMpoint-AMI |
| L |
M |
H |
22 |
0.8 |
7.6 |
| PROCAM-AMI |
L |
2423 |
16 |
0 |
193 |
6.8 |
|
| M |
130 |
152 |
6 |
|
|
|
| H |
3 |
60 |
52 |
|
Kappa
|
0.65
|
Table S2Net reclassification improvement (NRI) using post-test risk of PROCAM-AMI and SCORE-ASCVD based on TPA tertiles derived sensitivities and specificities for observed outcome .
|
NRI
|
95% confidence interval
|
p-value
|
|
PROCAM-AMI
|
Ref model |
|
|
| PROCAM-AMI + Bayes TPA |
0.421 |
0.356–0.486 |
<0.0001 |
|
SCORE
|
Ref model |
|
|
| SCORE-ASCVD + Bayes TPA |
0.373 |
0.307–0.439 |
<0.0001 |