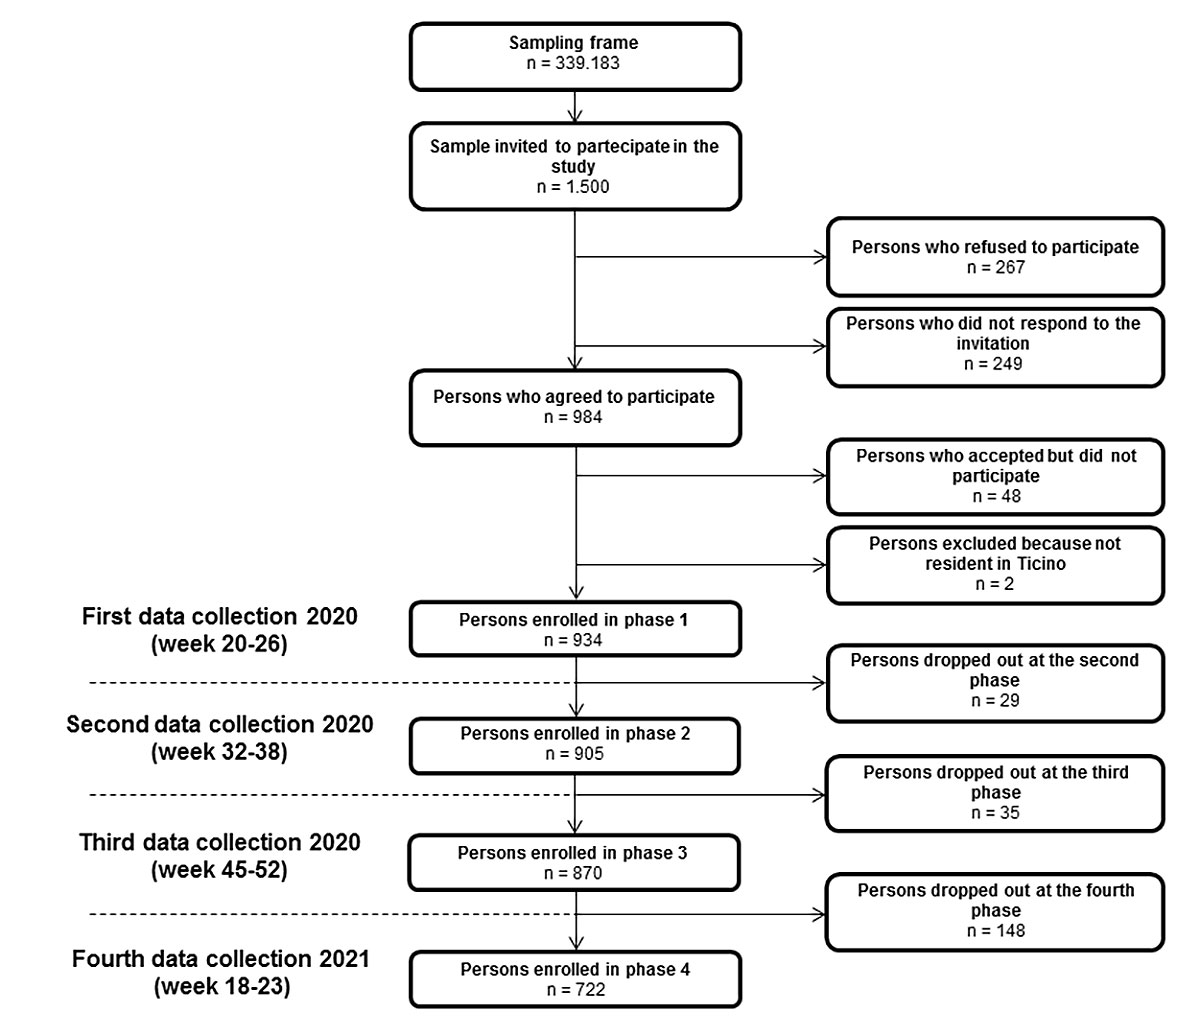
Figure 1 Flow diagram of the cohort study design.
DOI: https://doi.org/10.4414/SMW.2021.w30116
A new emerging severe acute respiratory syndrome coronavirus 2 (SARS-CoV-2) was first identified in Wuhan, China, in December 2019 and then spread rapidly around the world [1].
Since it was declared a pandemic by the World Health Organization on 11 March 2020, SARS-CoV-2 has infected more than 244,000,000 people around the world and coronavirus disease (COVID-19) has caused more than 4,950,000 deaths to date [2].
COVID-19 is usually associated with a mild to severe acute respiratory disease showing a wide range of symptoms including fever or chills, cough, shortness of breath or difficulty breathing, fatigue, muscle or body aches, loss of taste or smell, nausea or vomiting, diarrhoea. Additionally, persons with specific conditions – such as chronic respiratory, cardiovascular and renal diseases, immunosuppressive conditions, obesity, smoking, diabetes – oldest people and healthcare workers are a highest risk for COVID-19 and its complications [3]. Asymptomatic forms are not uncommon, but the estimated prevalence of this part of the infected population can vary significantly between countries.
In Europe, the first case was identified in Italy on 21 February 2020 in the municipality of Codogno close to Milan in the Lombardy region, bordering on the southern part of Switzerland (Canton Ticino). The situation rapidly deteriorated and on 4 March, 2700 cases were reported [4]. Four days later, on 25 February 2020, the first case in the Canton Ticino was identified. Ticino was the most affected canton in Switzerland during the first wave of pandemic, with 3327 infected people and 350 deaths in 4 months; the second wave started in October and the community transmission of the SARS-CoV-2 remained high until the end of January. As of 18 October 2021, 20 months after the diagnosis of the first case, Ticino had had 36,428 infected cases and 1007 deceased patients.
The diagnosis of COVID-19 is based on a real-time polymerase chain reaction (RT-PCR) assay [5]. In Switzerland, from the beginning of the outbreak until March 2021, only symptomatic persons were tested. However, the differences in data collection between the first and second wave are substantial: due to the scarcity of tests, during the first wave in some cantons only symptomatic persons aged ≥65 and with risk factors were tested, whereas in the second wave the tests were performed on all symptomatic persons, including those with mild symptoms. This may have influenced the absolute number of new positive cases per day as well as the positivity rate.
A positive RT-PCR result activates the contact tracing service, which formalises the isolation and quarantine of close contacts (less than 1.5 metres for at least 15 minutes). Other tests have also been developed, such as the rapid antigen test, to offer faster and cheaper analysis; however, the RT-PCR test remains the gold standard.
The prevalence of SARS-CoV-2 in the community can be estimated by using serological tests. Many commercial antibody tests are now available and allow the detection of anti-SARS-CoV-2 antibodies – even in asymptomatic persons or persons not tested with RT-PCR – and estimation of seroprevalence in the population.
In the spring of 2020, many countries and regions affected by COVID-19 started seroprevalence studies to better understand the spread of the new coronavirus in the completely naïve population [6, 7]. In the Canton Ticino, to provide a reliable indicator for the spread of the virus and help decision making at the public health level, a prospective cohort study on a representative sample of resident population with four data collection periods over the course of 12 months was implemented. In the present article, we show the results of the study, with estimates of both seroprevalence and persistence of the SARS-CoV-2 antibodies, as well as the association of demographic and risk factors in people showing positive test results for antibodies against the new coronavirus.
This was a cohort study of a randomly selected sample of 1500 persons from the Civil Registry Office database. The sample was representative of the general population of the Canton of Ticino, stratified by sex and age from 5 years old. Up to the end of April 2020, sampled people received a letter of invitation to participate in the study, differentiated according to age group (5–10, 11–17, over 18 years old).
Recruitment required that the selected person call the hotline to confirm or not their participation in the study. Only the confirmed participants received a second letter including information on organising an appointment with a physician, a list of selected physicians in their own region, the written informed consent form and the questionnaire. The questionnaire collects sociodemographic data and the anamnestic status of the study participant, i.e., whether he/she had already been infected with SARS-CoV-2 (RT-PCR positive), and had symptoms of recent or past infection. In order to measure the significance and degree of association between risk factors and SARS-CoV-2 infection, the questionnaire also contained questions regarding various known risk factors, such as high blood pressure, diabetes, cardiovascular disease, chronic lung disease, immunodeficiency, cancer, regular smoker and body mass index (BMI). During the appointment, all participants gave written informed consent and completed the questionnaire with the help of the physician. After that, they could undergo serological testing to detect antibodies against SARS-CoV-2. The questionnaire is provided in the appendix.
The questionnaires and the results of the tests were univocally encoded and anonymised by the physicians and then sent to our office to be checked and recorded in a specific database. Written informed consents were stored by the physicians, the only ones who know the identity of the participants.
For individuals less than 14 years old, parents or a legal representative provided consent. This study was approved by the Cantonal Research Ethics Commission of the Canton of Ticino (2020-00914 / CE 3626). The study design includes four successive follow-up periods of data collection: 0 (May–June 2020), after 3 months (August–September 2020), after 6 months (November–December 2020) and after 12 months (May–June 2021).
Antibodies against SARS-CoV-2 were identified using a rapid qualitative test (Rapid Test SARS-CoV-2 IgM/IgG Gold, Techno Genetics, produced by KHB Group). This test measures only the antibodies against the SARS-CoV-2 nucleocapsid protein, so it detects antibodies from natural infections and not elicited by vaccination. It is based on solid phase colloidal gold immunochromatographic technology for the qualitative determination of the presence of IgM/IgG antibodies against SARS-CoV-2 nucleocapsid (N) protein in human serum, plasma and whole blood. The gold SARS-CoV-2 antigen conjugate and the gold chicken IgY conjugate are coated to the conjugate pad. The test line T1 (antibodies against human IgM), the test line T2 (Staphylococcus aureus protein A) and the control line (antibodies against chicken IgY) are pre-coated on the surface of a nitrocellulose membrane. When the specimen is added to the sample pad, it migrates through the conjugate pad resulting in the appearance of test line T1/T2. In this case, the result is considered positive (presence of IgM/IgG antibodies). In absence – or with a very low level of specific IgM/IgG, no test line appears, representing a negative result.
The test was made by the physician taking about 15 μl of blood from the ring finger (fingerpick blood sample), depositing them in the specimen well of the test device and reading the result after 15 minutes. The validation test provided by the manufacturer reports a specificity for total antibody IgM + IgG of 98.9% and a sensitivity for total antibody IgM + IgG of 95.1%, 16 days after infection. An independent assessment made in September 2020 on a mix of in-hospital symptomatic and asymptomatic patients reported sensitivity and specificity comparable to those declared by the manufacturer [8].
The target of this study is the population of the Canton Ticino (n = 350,986) and the sampling frame is represented by the resident population aged 5 years and older (n = 339,183), recorded in the Movpop database (Civil Registry Office). On these data, a probability sampling technique based on stratified random sampling was used, where the strata were represented by the age and sex subgroups of the overall population.
During the design of the study protocol (early April 2020), as we had no prior knowledge about the seroprevalence in Canton Ticino, we adopted a conservative maximum uncertainty criterion. Assuming an overall seroprevalence of 50%, a 95% confidence level, and a margin of error of ±5%, the resulting sample size for each stage was n = 384. With an assumed dropout rate of 20% for each data collection phase and a 50% response rate on the overall resulting sample, we reached the final sample size of n = 1500. Random extraction was then performed to allocate this sample size among the effective proportions of sex and age subgroups previously defined in the sampling frame.
In order to check the presence of attrition bias for age and sex strata, two methods were applied: a Pearson's chi-square test to compare the observed sample frequencies with the expected population frequencies in each wave, and a binary logistic regression considering who stayed in / dropped out of the study as response variable, and age and sex – extracted from the MovPop database – as independent variables. Post-stratification weighting was applied to adjust for discrepancies between the sample and population distributions for age and sex. As the sensitivity and the specificity of a diagnostic test cannot perfectly detect all true positives and true negatives, the simple frequency of positive tests is a biased estimator of the seroprevalence [9]. In order to calculate a “true” prevalence (intended as a non-biased or, at least, a less biased estimate) from the “apparent” prevalence (observed), an explicit relationship between estimator, sensitivity and specificity was considered [9]. Moreover, in order to avoid the issues of a confidence interval calculation directly on the “true” prevalence (i.e., actual probability less than nominal probability), the Blaker’s method on binomial distribution was applied [10].
The associations between the presence of antibodies against SARS-CoV-2 and age, sex, and potential risk factors were evaluated by binary logistic regression models. With the serological test outcome ( “positive” or “negative”) as the response variable, two logistic regression models with different age classes (“5–9”, ”10–19”, ”20–49”, ”50–64”, ”65 and over”) and sex (“male” or “female”) as categorical independent variables were performed. In order to detect possible associations between test outcome and eight different risk factors (arterial hypertension, diabetes, cardiovascular disease, chronic pulmonary disease, immunodeficiency, cancer disease, regular smoking, overweight/obesity), single and multiple logistic regression models were calculated. Multiple regression models were performed to test the presence of possible confounding effects induced by age and sex, with the covariate age as a continuous variable (≥18 years old), and sex (“male” or “female”) and the presence of risk factors (“yes” or “no”) as categorical variables. Moreover, to determine a possible differentiation of the association among predictors (risk factors) and outcome (test results), an effect modification at the level of sex, age or both, for each risk factor and for each data collection period was additionally tested. Association degree and relative statistical significance between dependent and independent variables was measured by, respectively, regression coefficients expressed as odds ratios (ORs) and p-values. The margin of error of the ORs was estimated using a 95% confidence level. Statistical analysis was performed using IBM SPSS Statistics v.21, R language v.3.6.3 [11] and Microsoft Excel.
Of the 1500 persons invited to participate in the study, 267 (17.8%) declined and 249 (16.6%) did not respond, 48 (3.2%) accepted but did not attend, and 2 (0.01%) were excluded because they were not resident in Canton Ticino. Thus, 934 (62.3%) people participated in the first phase, 905 (60.3%) in the second phase, 870 (58%) in the third phase and 722 (48.1%) in the fourth and last phase of the study (fig. 1). In order to determine the presence of attrition bias, a goodness-of-fit test and a logistic regression model were applied. In the fourth phase, the goodness-of-fit test does not allow rejection of the null hypothesis of equivalence between observed and expected frequencies in the population for sex (p = 0.103), but not for age (p <0.05). Specifically, in this data collection period, regression analysis revealed a possible oversampling for the 50–64 age group (OR 2.374, 95% confidence interval [CI] 1.130–4.987; p = 0.022) and for the 65 and over group (OR 2.521, 95% CI 1.170–5.433; p = 0.018). Moreover, no statistically significant change was found for the sex variable in any of the four phases. Overall, the median age of the cohort in the first wave was 47 years (interquartile range [IQR] 30–61), 53.0% (495/934) were women and 47.0% (439/934) were men.
Figure 1 Flow diagram of the cohort study design.
As shown in figure 2 and table 1, in the first data collection period (weeks 20–26), the overall estimated seroprevalence, adjusted for sensitivity and specificity, was 9.0% (95% CI 7.1–11.2%); in the second period (weeks 32–38) it was 8.4% (95% CI 6.5–10.5%); in the third period (weeks 45–52) it was 14.1% (95% CI 11.7–16.8%) and in the fourth and last data collection period (weeks 18–23, 2021) it was 22.3% (95% CI 19.2–25.7%).
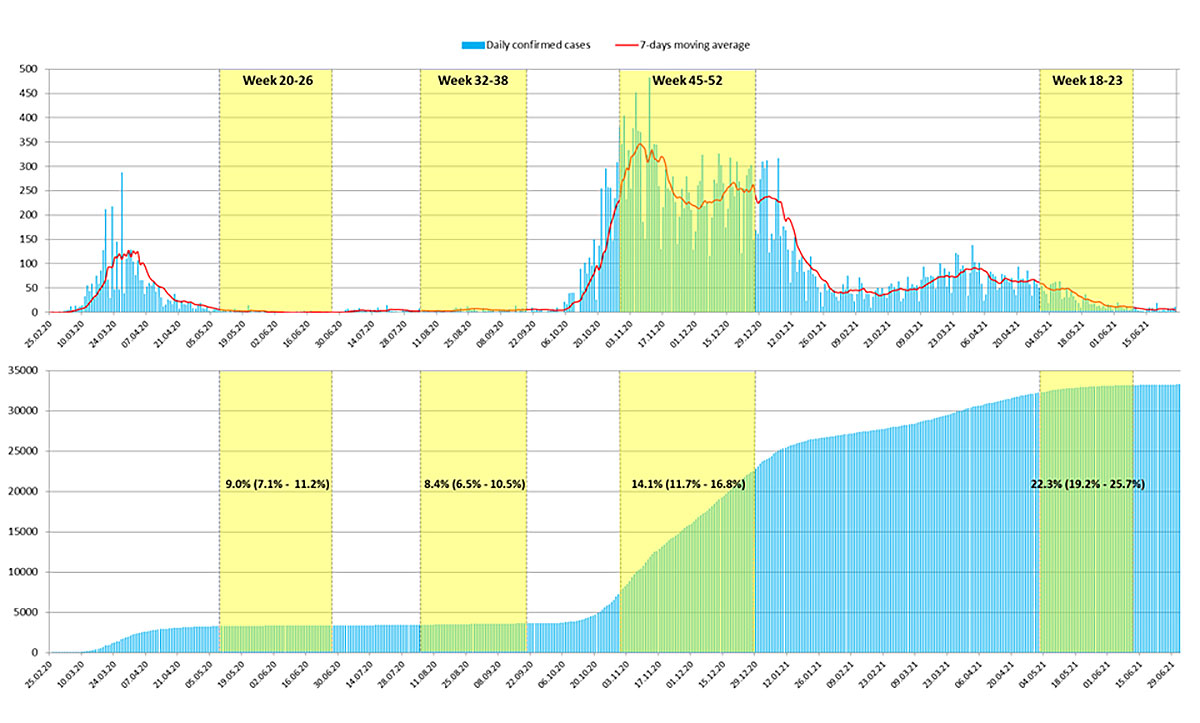
Figure 2 Epidemic evolution over time in Canton Ticino from February 2020 to June 2021. Upper panel: Confirmed new daily COVID-19 cases (light blue lines) and a 7-day moving average (red line). Lower panel: Cumulative confirmed daily cases (light blue lines). The yellow boxes represent the three data collection periods of the study and the resulting estimated seroprevalences (95% confidence intervals).
Table 1Estimated seroprevalence for each data collection period calculated on the whole sample, sex and age groups.
| n | Positive tests (%) | Negative tests (%) | Indeterminate tests (%) | Adjusted estimated seroprevalence (95% CI) | ||
| Week 20–26 (2020) | Total | 934 | 90 (9.6%) | 839 (89.9%) | 5 (0.5%) | 9.0% (7.1–11.2%) |
| Sex | ||||||
| Females | 495 | 47 (9.5%) | 446 (90.1%) | 2 (0.4%) | 8.5% (6.1–11.6%) | |
| Males | 439 | 43 (9.8%) | 393 (89.5%) | 3 (0.7%) | 9.8% (7.0–13.2%) | |
| Age | ||||||
| 5–9 | 48 | 3 (6.3%) | 45 (93.8%) | 0 (0.0%) | 3.7% (0.0–15.0%) | |
| 10–19 | 102 | 10 (9.8%) | 90 (88.2%) | 2 (2.0%) | 9.2% (4.2–17.6%) | |
| 20–49 | 355 | 30 (8.5%) | 323 (91.0%) | 2 (0.6%) | 8.1% (5.3–11.7%) | |
| 50–64 | 255 | 29 (11.4%) | 225 (88.2%) | 1 (0.4%) | 10.8% (6.8–15.9%) | |
| 65 and over | 174 | 18 (10.3%) | 156 (89.7%) | 0 (0.0%) | 9.7% (5.8–14.8%) | |
| Week 32–38 (2020) | Total | 905 | 81 (9.0%) | 820 (90.6%) | 4 (0.4%) | 8.4% (6.5–10.5%) |
| Sex | ||||||
| Females | 481 | 37 (7.7%) | 443 (92.1%) | 1 (0.2%) | 6.8% (4.5–9.6%) | |
| Males | 424 | 44 (10.4%) | 377 (88.9%) | 3 (0.7%) | 10.2% (7.3–13.7%) | |
| Age | ||||||
| 5–9 | 46 | 3 (6.5%) | 43 (93.5%) | 0 (0.0%) | 3.9% (0.0–15.8%) | |
| 10–19 | 98 | 6 (6.1%) | 92 (93.9%) | 0 (0.0%) | 5.8% (1.9–13.1%) | |
| 20–49 | 340 | 30 (8.8%) | 307 (90.3%) | 3 (0.9%) | 8.4% (5.5–12.1%) | |
| 50–64 | 247 | 25 (10.1%) | 221 (89.5%) | 1 (0.4%) | 9.8% (5.8–14.8%) | |
| 65 and over | 174 | 17 (9.8%) | 157 (90.2%) | 0 (0.0%) | 9.0% (5.2–13.9%) | |
| Week 45–52 (2020) | Total | 870 | 125 (14.4%) | 738 (84.8%) | 7 (0.8%) | 14.1% (11.7–16.8%) |
| Sex | ||||||
| Females | 465 | 66 (14.2%) | 396 (85.2%) | 3 (0.6%) | 13.6% (10.4–17.2%) | |
| Males | 405 | 59 (14.6%) | 342 (84.4%) | 4 (1.0%) | 14.7% (11.2–18.8%) | |
| Age | ||||||
| 5–9 | 33 | 4 (12.1%) | 29 (87.9%) | 0 (0.0%) | 11.8% (4.1–25.9%) | |
| 10–19 | 93 | 12 (12.9%) | 80 (86.0%) | 1 (1.1%) | 12.4% (6.2–21.4%) | |
| 20–49 | 317 | 46 (14.5%) | 271 (85.5%) | 0 (0.0%) | 14.8% (11.0–19.3%) | |
| 50–64 | 243 | 38 (15.6%) | 202 (83.1%) | 3 (1.2%) | 16.0% (11.0–22.1%) | |
| 65 and over | 184 | 25 (13.6%) | 156 (84.8%) | 3 (1.6%) | 12.3% (8.0–17.9%) | |
| Week 18–23 (2021) | Total | 722 | 162 (22.4%) | 558 (77.3%) | 2 (0.3%) | 22.3% (19.2–25.7%) |
| Sex | ||||||
| Females | 393 | 85 (21.6%) | 307 (78.1%) | 1 (0.3%) | 21.4% (17.2–25.9%) | |
| Males | 329 | 77 (23.4%) | 251 (76.3%) | 1 (0.3%) | 23.5% (18.8–28.6%) | |
| Age | ||||||
| 5–9 | 25 | 7 (28.0%) | 18 (72.0%) | 0 (0.0%) | 27.0% (13.7–45.6%) | |
| 10–19 | 75 | 19 (25.3%) | 55 (73.3%) | 1 (1.3%) | 25.8% (15.9–37.6%) | |
| 20–49 | 252 | 52 (20.6%) | 200 (79.4%) | 0 (0.0%) | 20.7% (16.0–26.2%) | |
| 50–64 | 210 | 48 (22.9%) | 161 (76.7%) | 1 (0.5%) | 22.9% (16.7–30.4%) | |
| 65 and over | 160 | 36 (22.5%) | 124 (77.5%) | 0 (0.0%) | 22.0% (15.9–29.4%) | |
Test results are expressed in absolute numbers and rough percentages. The estimated seroprevalences and the confidence intervals (CIs) are adjusted by the diagnostic sensitivity and specificity of the test.
As shown in table 2, in none of these four phases was evidence of an association between sex and presence of anti-SARS-CoV-2 antibodies detected. Similarly, no significant association was found among seropositivity and specific age groups.
Table 2Association between the presence of antibodies against SARS-CoV-2 nucleocapsid protein and age, sex and potential risk factors in the four collection periods.
| Not adjusted | Adjusted | ||||||
| OR | 95% CI | p-value | OR | 95% CI | p-value | ||
| Week 20–26 (2020) | Sex | ||||||
| Females | 1 (ref) | ||||||
| Males | 1.139 | 0.736–1.763 | 0.558 | ||||
| Age | |||||||
| 5–9 | 0.627 | 0.165–2.381 | 0.492 | ||||
| 10–19 | 1.148 | 0.527–2.501 | 0.728 | ||||
| 20–49 | 1 (ref) | ||||||
| 50–64 | 1.331 | 0.764–2.319 | 0.313 | ||||
| 65 and over | 1.170 | 0.657–2.084 | 0.593 | ||||
| Risk factor | |||||||
| Arterial hypertension | 1.468 | 0.857–2.514 | 0.162 | 1.496 | 0.819–2.733 | 0.190 | |
| Diabetes | 3.062 | 1.529–6.131 | 0.002 | 3.366 | 1.555–7.285 | 0.002 | |
| Cardiovascular disease | 1.496 | 0.719–3.112 | 0.282 | 1.416 | 0.643–3.118 | 0.388 | |
| Chronic pulmonary disease | 2.414 | 1.012–5.755 | 0.047 | 2.377 | 0.981–5.759 | 0.055 | |
| Immunodeficiency | 0.669 | 0.075–5.980 | 0.719 | 0.701 | 0.078–6.325 | 0.752 | |
| Cancer | 0.950 | 0.260–3.474 | 0.938 | 0.928 | 0.250–3.446 | 0.912 | |
| Regular smoker | 1.307 | 0.749–2.279 | 0.346 | 1.299 | 0.740–2.278 | 0.362 | |
| Overweight/obesity | 1.388 | 0.859–2.240 | 0.180 | 1.351 | 0.823–2.219 | 0.235 | |
| Week 32–38 (2020) | Sex | ||||||
| Females | 1 (ref) | ||||||
| Males | 1.397 | 0.884–2.210 | 0.152 | ||||
| Age | |||||||
| 5–9 | 0.714 | 0.209–2.440 | 0.591 | ||||
| 10–19 | 0.667 | 0.269–1.653 | 0.382 | ||||
| 20–49 | 1 (ref) | ||||||
| 50–64 | 1.158 | 0.662–2.023 | 0.607 | ||||
| 65 and over | 1.108 | 0.593–2.071 | 0.748 | ||||
| Risk factor | |||||||
| Arterial hypertension | 1.354 | 0.752–2.437 | 0.313 | 1.351 | 0.706–2.585 | 0.364 | |
| Diabetes | 3.189 | 1.447–7.028 | 0.004 | 3.297 | 1.392–7.812 | 0.007 | |
| Cardiovascular disease | 1.603 | 0.728–3.529 | 0.241 | 1.505 | 0.638–3.548 | 0.350 | |
| Chronic pulmonary disease | 3.537 | 1.443–8.669 | 0.006 | 3.418 | 1.369–8.535 | 0.008 | |
| Immunodeficiency | 0.941 | 0.119–7.456 | 0.954 | 1.022 | 0.128–8.161 | 0.984 | |
| Cancer | 0.717 | 0.167–3.083 | 0.655 | 0.734 | 0.168–3.213 | 0.682 | |
| Regular smoker | 1.392 | 0.783–2.475 | 0.260 | 1.383 | 0.774–2.471 | 0.273 | |
| Overweight/obesity | 1.125 | 0.686–1.844 | 0.641 | 1.043 | 0.625–1.742 | 0.872 | |
| Week 45–52 (2020) | Sex | ||||||
| Females | 1 (ref) | ||||||
| Males | 1.093 | 0.747–1.600 | 0.646 | ||||
| Age | |||||||
| 5–9 | 0.760 | 0.280–2.062 | 0.590 | ||||
| 10–19 | 0.847 | 0.422–1.701 | 0.641 | ||||
| 20–49 | 1 (ref) | ||||||
| 50–64 | 1.084 | 0.668–1.759 | 0.745 | ||||
| 65 and over | 0.841 | 0.507–1.397 | 0.504 | ||||
| Risk factor | |||||||
| Arterial hypertension | 0.801 | 0.453–1.416 | 0.444 | .836 | 0.448–1.559 | 0.574 | |
| Diabetes | 2.137 | 1.006–4.538 | 0.048 | 2.550 | 1.131–5.751 | 0.024 | |
| Cardiovascular disease | 1.083 | 0.515–2.278 | 0.833 | 1.170 | 0.534–2.562 | 0.695 | |
| Chronic pulmonary disease | 1.345 | 0.455–3.971 | 0.592 | 1.379 | 0.462–4.115 | 0.565 | |
| Immunodeficiency | 0.527 | 0.049–5.652 | 0.597 | .568 | 0.053–6.120 | 0.641 | |
| Cancer | 1.511 | 0.491–4.655 | 0.472 | 1.682 | 0.536–5.275 | 0.373 | |
| Regular smoker | 0.714 | 0.402–1.267 | 0.249 | .679 | 0.381–1.212 | 0.190 | |
| Overweight/Obesity | 1.343 | 0.871– 2.069 | 0.182 | 1.382 | 0.882– 2.166 | 0.158 | |
| Week 18–23 (2021) | Sex | ||||||
| Females | 1 (ref) | ||||||
| Males | 1.126 | 0.791–1.602 | 0.510 | ||||
| Age | |||||||
| 5–9 | 1.438 | 0.637–3.247 | 0.381 | ||||
| 10–19 | 1.343 | 0.732–2.465 | 0.341 | ||||
| 20–49 | 1 (ref) | ||||||
| 50–64 | 1.163 | 0.731–1.848 | 0.524 | ||||
| 65 and over | 1.065 | 0.667–1.700 | 0.793 | ||||
| Risk factor | |||||||
| Arterial hypertension | 0.939 | 0.558–1.580 | 0.812 | 0.850 | 0.481–1.502 | 0.576 | |
| Diabetes | 1.241 | 0.591–2.607 | 0.568 | 1.156 | 0.526–2.537 | 0.718 | |
| Cardiovascular disease | 1.036 | 0.504–2.129 | 0.924 | 0.947 | 0.446–2.014 | 0.888 | |
| Chronic pulmonary disease | 1.406 | 0.502–3.939 | 0.517 | 1.358 | 0.472–3.904 | 0.570 | |
| Immunodeficiency | 0.875 | 0.154–4.979 | 0.881 | 0.898 | 0.157–5.119 | 0.903 | |
| Cancer | 1.145 | 0.382–3.431 | 0.809 | 1.113 | 0.367–3.378 | 0.850 | |
| Regular smoker | 0.783 | 0.454–1.350 | 0.378 | .790 | 0.457–1.366 | 0.400 | |
| Overweight/obesity | 1.402 | 0.934–2.105 | 0.103 | 1.378 | 0.905– 2.100 | 0.135 | |
CI: confidence interval; OR: odds ratio
Odds ratios are estimated by binary logistic regression models, not adjusted and adjusted for sex and age as potential confounders. The references are “Female” for “Sex”, “20–49” for “Age” and the answer “No” for each item on “Risk factor”.
For risk factors, the only strong and significant association in three out of four data collection periods, either adjusted or not adjusted for age and sex, was found for persons with diabetes. Chronic pulmonary diseases were significantly associated with the presence of antibodies only in the first phase (not adjusted for sex and age) and in the second phase, whereas all other risk factors (hypertension, cardiovascular disease, immunodeficiency, cancer, regular smoker and overweight/obesity) did not show significant associations in any of the four phases of the present study. A check for the presence of effect modification on test results through the interactions among sex, age or both and each risk factors, suggests that, if present, the effect was quiet marginal. In the fourth data collection period, 2 out of 24 regression models showed significant ORs (Sex*Age*Regular smoker: OR 1.062, 95% CI 1.003–1.126; Sex*BMI 3.786, 95% CI 1.073–13.355). Moreover, in the overall data collection period, 5 out of 96 regression models showed significant ORs and 3 out of these 5 models, given the size of the sample, may be due to random error.
Of the 722 participants in the fourth collection period, 2 had an invalid result; it follows that 720 persons had an interpretable test result in each of the four periods of the study: 503 (69.9%, 95% CI 66.5–73.3%) had a negative test, whereas 42 (5.8%, 95% CI 2.5–9.2%) tested positive in each of the four phases (data not shown).
Comparison between these 42 persons with the 68 having a positive test in the first phase still present during the following three stages of the study provides a rough estimate of the persistence of anti SARS-Cov-2 after 12 months (61.8%, 95% CI 49.2–73.3%). Of these 42, 41 persons completed the anamnestic data questionnaire, which showed that 13 (31.7%) had symptoms and a positive RT-PCR test result, 8 (19.5%) had symptoms but were not tested, 3 (7.3%) had symptoms but a negative RT-PCR test, 3 (7.3%) had no symptoms but were tested (e.g., during a hospital stay), and 14 (34.1%) had no symptoms and no RT-PCR test (data not shown).
Thus, among the group of people who still had anti-SARS-CoV-2 antibodies after 12 months, 17 out of 41 (41.5%) were asymptomatic. Of the 16 people who had a positive result in both serological and RT-PCR tests in the first data collection period, 100% (16) retained antibodies during the second period, 93.8% (15) in the third period and, as mentioned above, 81.3% (13) 12 months later.
This seroprevalence study of the virus SARS-CoV-2 in Canton Ticino was well accepted by the overall population: 65.6% (934/1500) of the randomly selected sample participated in the first phase and, during the following stages of the study, the dropouts were limited. A total of 77.3% (722/934) of the initial participants were still present during the fourth and last phase of the study.
The results from the four data collection periods show that in Canton Ticino, the estimated prevalence of people with anti-SARS-CoV-2 antibodies during the first period (9.0%, May–June) was very close to that found in the second period (8.7%, August–September), confirming that after the first epidemic wave, the summer period – despite light containment measures – saw a very low circulation of the virus among the population. Moreover, the serological data allow a crude estimate of how many COVID-19 cases were undetected in the period following the first wave (May–June 2020). Since 9% of the population from 5 years old showed antibodies against SARS-CoV-2 and that in the same period the official cumulative number of COVID-19 cases amounted to about 3300, it is possible to roughly estimate that, for every person with a positive RT-PCR test, there were nine still undetected.
The spread of the virus rose significantly in the following periods, showing an increase in seropositivity from approximately 1 person in 11 in the first two phases, to nearly 1 person in 7 in the third phase (14,1%, November–December) and to nearly 1 person on 5 in the last phase (22.3%, May–June 2021). Studies are rather concordant in finding no statistically significant differences between sexes [6], but the situation is different for age. Although definitive evidence does not yet exist, most studies find a lower risk of infection in younger population [12–15]. The present study, as well as others [16, 17], did not find any significant association between seropositivity and age group.
In Switzerland, several seroprevalence studies have been carried out in different cantons, but they are often not comparable because of different target groups and/or time periods. After the first pandemic wave, the Canton Ticino had a seroprevalence lower than Geneva (9% and 11%, [13]) and higher than Vaud (7% [18]). The seroprevalence measured during the second wave increased, being highest in Geneva (22%, between November–December 2020), followed by Vaud (17%, November 2020), Ticino (14.1%, November–December 2020) and finally Zürich (8%, December 2020) [18]. A seroprevalence study conducted between 1 June and 7 July 2021 in Canton Geneva, estimated that 29.9% of the population developed antibodies after infection [19].
In the Swiss border countries, the seroprevalence measured in Italy in the Lombardy region, from 25 May to 15 July 2020, was 7.5% [4], and a more recent study in the same region (Castiglione d’Adda), conducted from 18 May to 7 June 2021, reported a seroprevalence similar to our estimate (22.2%) [15]. In France, seroprevalence from 5–11 October 2020 in the Bourgogne Franche-Comté region was 9.3% and in the Grand Est regions 11.6% [20]. In Austria, in the west region, during the middle/end of October 2020, the estimated seroprevalence was 5.7% [21] and in Germany, in the Baden-Württemberg region, from 20 May to 9 June 2020, it was 12.0% [22].
A significant association between risk factors (arterial hypertension, cardiovascular diseases, immunodeficiency, cancer, smoking or non-smoking status and high BMI) and the presence of anti-SARS-CoV-2 antibodies was not detected in our sample, drawn from a population in a non-hospital setting. Chronic pulmonary diseases showed a statistically significant association only in the first two phases, and diabetes was the only disease which kept a high and significant association in three out of four phases of the study. Although an exhaustive discussion of the topic is beyond the scope of this study, it is worth noticing that diabetes – as well as other risk factors [23] – often emerges as a leading comorbidity among severe COVID-19 hospitalised patients [24, 25]. Some of the proposed reasons involve dysregulation of immune response imputable to impaired chemotaxis and phagocytosis [26, 27], chronic imbalance of helper T cells (Th1/Th2) [28], high glucose levels inhibiting the antiviral response [29], an excessive and uncontrolled inflammatory response [30] and overexpression of the angiotensin converting enzyme 2 (ACE-2) receptor, the cellular receptor used by SARS-CoV-2 to infect the cell [31].
Through the analysis of the people participating in all the four data collection periods, it was possible to estimate the persistence of anti-SARS-CoV-2 antibodies after infection. Our sample showed that among people who tested positive in the first period, 86.8% remained positive in the second, 75.0% were positive in the third and 61.8% were positive even in the fourth, 12 months later. Moreover, although the sample size was too small to allow statistical inference, it is interesting to note that almost all of the people (81.3%) who tested positive in serological test during the first collection period and declared a positive previous RT-PCR test, also retained antibodies in the three subsequent phases. As only highly symptomatic persons were tested with RT-PCR during the first pandemic wave, this might suggest that those who had symptomatic disease as a result of developing a strong immune response to the virus showed greater persistence of anti-SARS-CoV-2 antibodies. Interestingly, a systematic review [32] aiming to define the risk of reinfection by SARS-Cov-2 reported a progressive decline in antibody response 3–6 months after infection. However, an immune response mediated by T and B cells persists and is still present 8 months after infection.
Although the sample was small, it is worth noting that of the people who tested positive in each of the four periods of the study, almost half did not report any symptoms. This result is consistent with other meta-analysis studies [33]. However, the range of this estimate is very wide and it is strictly dependent on several factors such as the experimental design and the country where the study was conducted. For example, Ling et al. [34], reported 1% asymptomatic patients in a Chinese study, whereas Keelay et al. [35] reported a prevalence of 81% in an Argentinean study. Among these two extremes, a more reliable overall estimation of asymptomatic would be around one fourth of SARS-CoV-2 infections [36].
Our study has several limitations. The serological test employed has the advantage of being rapid and minimally invasive. On the other hand, it is a qualitative test and so does not allow antibody titration. The estimate of the prevalence of seropositivity is therefore only binary (presence/absence of IgG and IgM) and does not provide a precise estimate of levels of persistant antibodies. It follows that we are unable to accurately determine whether people who retain antibodies after 12 months, have had a stronger initial immune response compared with those who have lost their antibodies during the same period. In addition, although recent studies show a general persistence of anti-SARS-CoV-2 antibodies [37, 38], they highlight different kinetics between anti-nucleocapsid and anti-spike antibodies. The present study was based exclusively on the detection of anti--nucleocapsid antibodies, so our results, albeit in agreement with some evidence [37], cannot fully elucidate the complex picture of the humoral immune response against SARS-CoV-2.
Another limitation is that, to ensure high and sustained adherence to the study, we administered a qualitative questionnaire to participants. This allowed us only general information about self-reported illnesses or behaviours, but not to precisely characterise the risk profile of persons enrolled in the study. Moreover, although the sampling process was random, participation was voluntary and we cannot exclude further biases related to physical conditions, past experiences of severe symptoms, or subjective attitudes.
Our results support the hypothesis that, after one year and despite the severe burden in terms of hospitalisations and deaths experienced in the Canton Ticino, natural infection with SARS-CoV-2 affected approximately 20% of the population and suggest that anti-nucleocapsid antibodies persist after 12 months in the majority of infected persons. Furthermore, it is important to emphasise how the response of the population to cantonal and federal recommendations was responsible and extensive, allowing a catastrophe of even greater proportions to be avoided.
We would like to thank the people who participated in this study and the 115 general practitioners who enthusiastically collaborated in the data collection. We also thank IBSA Institut Biochimique SA for generously providing the diagnostic kits totally free of charge.
All authors have completed and submitted the International Committee of Medical Journal Editors form for disclosure of potential conflicts of interest. No potential conflict of interest was disclosed.
No financial support relevant to this article was reported.
1. World Health Organisation (WHO) . Coronavirus disease (COVID-19) Weekly Epidemiological Update and Weekly Operational Update [Internet]. [cited 2021 Feb 10]. Available from: https://www.who.int/emergencies/diseases/novel-coronavirus-2019/situation-reports
2. World Health Organization (WHO) . WHO Coronavirus (COVID-19) Dashboard [Internet]. [cited 2021 Oct 28]. Available from: https://covid19.who.int/
3. Centers for Disease Control and Prevention (CDC) . People with Certain Medical Conditions [Internet]. [cited 2021 Feb 10]; Available from: https://www.cdc.gov/coronavirus/2019-ncov/need-extra-precautions/people-with-medical-conditions.html
4. Livingston E , Bucher K . Coronavirus Disease 2019 (COVID-19) in Italy. JAMA. 2020 Apr;323(14):1335. https://doi.org/10.1001/jama.2020.4344
5. Lai CC , Wang CY , Ko WC , Hsueh PR . In vitro diagnostics of coronavirus disease 2019: technologies and application. J Microbiol Immunol Infect. 2021 Apr;54(2):164–74. https://doi.org/10.1016/j.jmii.2020.05.016
6. Lai CC , Wang JH , Hsueh PR . Population-based seroprevalence surveys of anti-SARS-CoV-2 antibody: an up-to-date review. Int J Infect Dis. 2020 Dec;101:314–22. https://doi.org/10.1016/j.ijid.2020.10.011
7. Rostami A , Sepidarkish M , Leeflang MM , Riahi SM , Nourollahpour Shiadeh M , Esfandyari S , et al. SARS-CoV-2 seroprevalence worldwide: a systematic review and meta-analysis. Clin Microbiol Infect. 2021 Mar;27(3):331–40. https://doi.org/10.1016/j.cmi.2020.10.020
8 Caruso A , Bonfanti C (Università degli studi di Brescia, Dipartimento di medicina molecolare e traslazionale, Brescia, Italy). Analytical and diagnostic performances of a Covid-19 serology POCT method to assess anti-SARS-CoV-2 IgG and IgM antibodies. Available upon request. Letter to: D Zanelli and S De Rosa (Technogenetics, Italy). 2020 Sept 21. 14 p.
9. Rogan WJ , Gladen B . Estimating prevalence from the results of a screening test. Am J Epidemiol. 1978 Jan;107(1):71–6. https://doi.org/10.1093/oxfordjournals.aje.a112510
10. Blaker H . Confidence curves and improved exact confidence intervals for discrete distributions. Can J Stat. 2000;28(4):783–98. https://doi.org/10.2307/3315916
11. R Core Team . R: A language and environment for statistical computing. R Foundation for Statistical Computing, Vienna, Austria; 2020. Available from: https://www.R-project.org
12. Pollán M , Pérez-Gómez B , Pastor-Barriuso R , Oteo J , Hernán MA , Pérez-Olmeda M , et al.; ENE-COVID Study Group . Prevalence of SARS-CoV-2 in Spain (ENE-COVID): a nationwide, population-based seroepidemiological study. Lancet. 2020 Aug;396(10250):535–44. https://doi.org/10.1016/S0140-6736(20)31483-5
13. Stringhini S , Wisniak A , Piumatti G , Azman AS , Lauer SA , Baysson H , et al. Seroprevalence of anti-SARS-CoV-2 IgG antibodies in Geneva, Switzerland (SEROCoV-POP): a population-based study. Lancet. 2020 Aug;396(10247):313–9. https://doi.org/10.1016/S0140-6736(20)31304-0
14. Havers FP , Reed C , Lim T , Montgomery JM , Klena JD , Hall AJ , et al. Seroprevalence of Antibodies to SARS-CoV-2 in 10 Sites in the United States, March 23-May 12, 2020. JAMA Intern Med. 2020 Jul;180(12):1576–86. https://doi.org/10.1001/jamainternmed.2020.4130
15. Pagani G , Giacomelli A , Conti F , Bernacchia D , Rondanin R , Prina A , et al. Prevalence of SARS-CoV-2 in an area of unrestricted viral circulation: mass seroepidemiological screening in Castiglione d’Adda, Italy. PLoS One. 2021 Feb;16(2):e0246513. https://doi.org/10.1371/journal.pone.0246513
16. Tess BH , Granato CF , Alves MC , Pintão MC , Nunes MC , Rizzatti EG , et al. Assessment of initial SARS-CoV-2 seroprevalence in the most affected districts in the municipality of São Paulo, Brazil. Braz J Infect Dis. 2021 Jul-Aug;25(4):101604. https://doi.org/10.1016/j.bjid.2021.101604
17. Melotti R , Scaggiante F , Falciani M , Weichenberger CX , Foco L , Lombardo S , et al. Prevalence and determinants of serum antibodies to SARS-CoV-2 in the general population of the Gardena valley. Epidemiol Infect. 2021 Aug;149 e194:e194. https://doi.org/10.1017/S0950268821001886
18. Corona Immunitas . Study overview [Internet]. [cited 2021 Mar 01]. Available from: https://www.corona-immunitas.ch/en/program/studies/
19. Stringhini S , Zaballa ME , Pullen N , Perez-Saez J , de Mestral C , Loizeau A , et al. Seroprevalence of anti-SARS-CoV-2 antibodies six months into the vaccination campaign in Geneva, Switzerland. medRxiv 2021.08.12.21261929; doi: https://doi.org/10.1101/2021.08.12.21261929
20. Santé publique France. Estimation de la séroprévalence des infections à SARS-CoV-2. COVID-19: point épidémiologique [Internet]. 2020 Dec 31 [cited 2021 Apr 7]: 41-43. French. Available from: https://www.santepubliquefrance.fr/maladies-et-traumatismes/maladies-et-infections-respiratoires/infection-a-coronavirus/documents/bulletin-national/covid-19-point-epidemiologique-du-31-decembre-2020
21. Statistik Austria . COVID-19 Prävalenzstudien [Internet]. [cited 2021 Apr 3]. German. Available from: http://www.statistik.at/web_de/statistiken/menschen_und_gesellschaft/gesundheit/covid19/index.html
22. Santos-Hövener C , Neuhauser HK , Rosario AS , Busch M , Schlaud M , Hoffmann R , et al.; CoMoLo Study Group . Serology- and PCR-based cumulative incidence of SARS-CoV-2 infection in adults in a successfully contained early hotspot (CoMoLo study), Germany, May to June 2020. Euro Surveill. 2020 Nov;25(47): Available from: https://www.eurosurveillance.org/content/10.2807/1560-7917.ES.2020.25.47.2001752 https://doi.org/10.2807/1560-7917.ES.2020.25.47.2001752
23. Yang J , Zheng Y , Gou X , Pu K , Chen Z , Guo Q , et al. Prevalence of comorbidities and its effects in patients infected with SARS-CoV-2: a systematic review and meta-analysis. Int J Infect Dis. 2020 May;94:91–5. https://doi.org/10.1016/j.ijid.2020.03.017
24. Kumar A , Arora A , Sharma P , Anikhindi SA , Bansal N , Singla V , et al. Is diabetes mellitus associated with mortality and severity of COVID-19? A meta-analysis. Diabetes Metab Syndr. 2020 Jul - Aug;14(4):535–45. https://doi.org/10.1016/j.dsx.2020.04.044
25. Yan Y , Yang Y , Wang F , Ren H , Zhang S , Shi X , et al. Clinical characteristics and outcomes of patients with severe covid-19 with diabetes. BMJ Open Diabetes Res Care. 2020 Apr;8(1):e001343. https://doi.org/10.1136/bmjdrc-2020-001343
26. Huang J , Xiao Y , Zheng P , Zhou W , Wang Y , Huang G , et al. Distinct neutrophil counts and functions in newly diagnosed type 1 diabetes, latent autoimmune diabetes in adults, and type 2 diabetes. Diabetes Metab Res Rev. 2019 Jan;35(1):e3064. https://doi.org/10.1002/dmrr.3064
27. Lecube A , Pachón G , Petriz J , Hernández C , Simó R . Phagocytic activity is impaired in type 2 diabetes mellitus and increases after metabolic improvement. PLoS One. 2011;6(8):e23366. https://doi.org/10.1371/journal.pone.0023366
28. Menart-Houtermans B , Rütter R , Nowotny B , Rosenbauer J , Koliaki C , Kahl S , et al.; German Diabetes Study Group . Leukocyte profiles differ between type 1 and type 2 diabetes and are associated with metabolic phenotypes: results from the German Diabetes Study (GDS). Diabetes Care. 2014 Aug;37(8):2326–33. https://doi.org/10.2337/dc14-0316
29. Reading PC , Allison J , Crouch EC , Anders EM . Increased susceptibility of diabetic mice to influenza virus infection: compromise of collectin-mediated host defense of the lung by glucose? J Virol. 1998 Aug;72(8):6884–7. https://doi.org/10.1128/JVI.72.8.6884-6887.1998
30. Guo W , Li M , Dong Y , Zhou H , Zhang Z , Tian C , et al. Diabetes is a risk factor for the progression and prognosis of COVID-19. Diabetes Metab Res Rev. 2020 Mar;e3319(7):e3319. https://doi.org/10.1002/dmrr.3319
31. Roca-Ho H , Riera M , Palau V , Pascual J , Soler MJ . Characterization of ACE and ACE2 expression within different organs of the NOD mouse. Int J Mol Sci. 2017 Mar;18(3):563. https://doi.org/10.3390/ijms18030563
32. Health Information and Quality Authority (HIQA) . Duration of immunity (protection from reinfection) following SARSCoV-2 infection. Dublin (Ireland): 2021. Available from: https://www.hiqa.ie/sites/default/files/2021-03/Duration-of-protective-immunity_Evidence-Summary.pdf
33. Syangtan G , Bista S , Dawadi P , Rayamajhee B , Shrestha LB , Tuladhar R , et al. Asymptomatic SARS-CoV-2 Carriers: A Systematic Review and Meta-Analysis. Front Public Health. 2021 Jan;8:587374. https://doi.org/10.3389/fpubh.2020.587374
34. Ling Z , Xu X , Gan Q , Zhang L , Luo L , Tang X , et al. Asymptomatic SARS-CoV-2 infected patients with persistent negative CT findings. Eur J Radiol. 2020 May;126:108956. https://doi.org/10.1016/j.ejrad.2020.108956
35. Keeley AJ , Evans CM , de Silva TI . Asymptomatic SARS-CoV-2 infection: the tip or the iceberg? Thorax. 2020 Aug;75(8):621–2. https://doi.org/10.1136/thoraxjnl-2020-215337
36. Alene M , Yismaw L , Assemie MA , Ketema DB , Mengist B , Kassie B , et al. Magnitude of asymptomatic COVID-19 cases throughout the course of infection: A systematic review and meta-analysis. PLoS One. 2021 Mar;16(3):e0249090. https://doi.org/10.1371/journal.pone.0249090
37. L’Huillier AG , Meyer B , Andrey DO , Arm-Vernez I , Baggio S , Didierlaurent A , et al.; Geneva Centre for Emerging Viral Diseases . Antibody persistence in the first 6 months following SARS-CoV-2 infection among hospital workers: a prospective longitudinal study. Clin Microbiol Infect. 2021 Jan;27(5):784.e1–8. https://doi.org/10.1016/j.cmi.2021.01.005
38. Van Elslande J , Gruwier L , Godderis L , Vermeersch P . Estimated half-life of SARS-CoV-2 anti-spike antibodies more than double the half-life of anti-nucleocapsid antibodies in healthcare workers. Clin Infect Dis. 2021 Mar;•••:ciab219. https://doi.org/10.1093/cid/ciab219
The appendix is available online in the PDF version of this article.