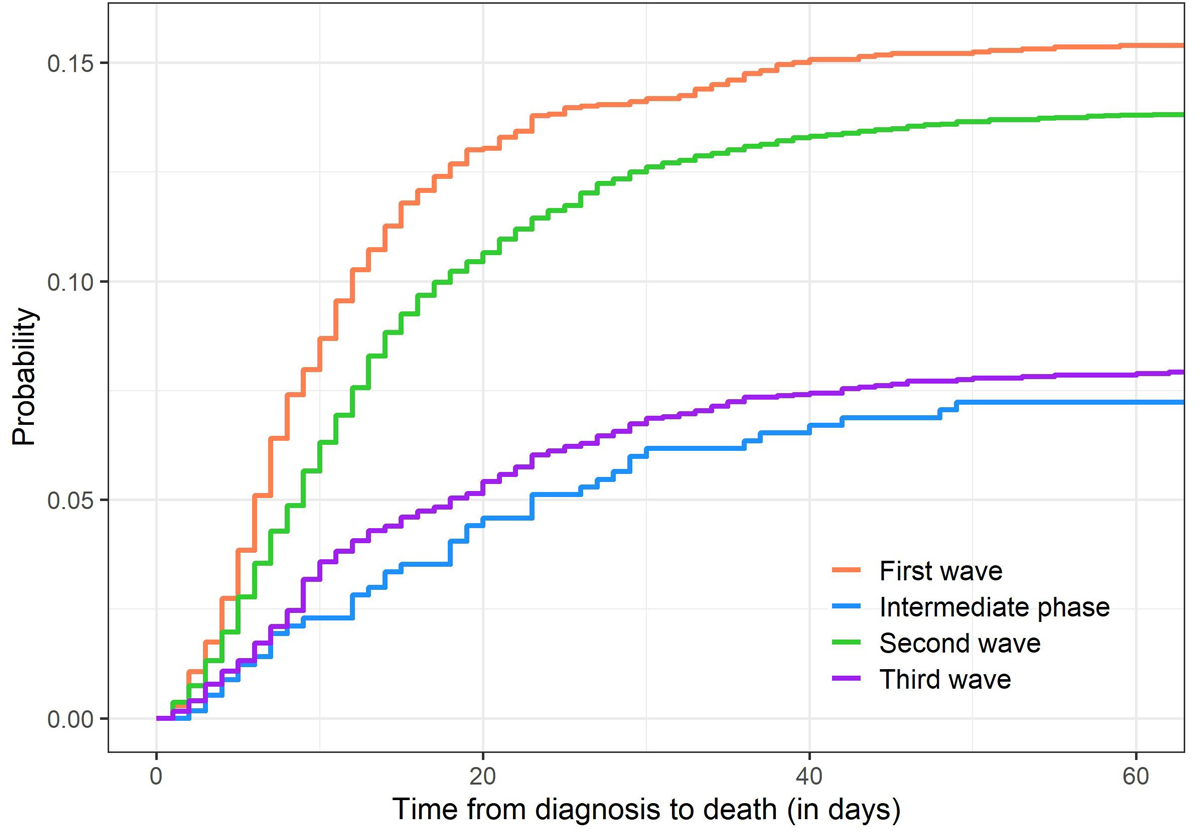
Figure 1 Cumulative incidences of death due to COVID-19 in CH-SUR, for the different waves of COVID-19.
DOI: https://doi.org/10.4414/SMW.2021.w30105
Many countries around the world, and in particular in Europe, experienced an evolution of the COVID-19 pandemic over time with a first wave occurring in Spring 2020, followed by a substantial decrease in the number of COVID-19 cases during the intermediate period, and then by the emergence of a second wave in Autumn 2020. The chronology of the different COVID-19 waves is tightly related to governments’ responses to the epidemic, which varied widely over time and country, often tightening and relaxing non-pharmaceutical interventions (hereafter NPIs, i.e., infection control measures including lockdown, travel banning and the setting up of testing and tracing programmes) depending on the number of diagnosed COVID-19 cases.
The assessment of COVID-19-associated mortality is crucial not only to evaluate the impact of the pandemic, but also to evaluate the improvement of knowledge on the disease and of patient care, as well as the effectiveness of measures adopted to control the outbreak. It has been hypothesised that COVID-19 mortality might have been lower after the first wave in Europe [1–3].
Crude calculations from numbers of cases and deaths reported by the Federal Office of Public Health (FOPH) [4, 5] yield case fatality ratios (CFRs, i.e., the proportion of deaths among all infected persons identified) for COVID-19 in Switzerland of approximately 5.4% between end of February and end of April 2020 (first wave), 0.94% between early May and end of September 2020, 1.6% from October 2020 to mid-February 2021 (second wave) and 0.6% from mid-February to end June 2021 (third wave). This change in mortality could potentially be explained by several factors. First, the restrictions on COVID-19 testing during the first wave likely resulted in a high CFR, whereas the increase in testing capacity over time and especially since November 2020 could decrease the CFR estimate over time. However, since testing restrictions were not applied to hospitalised persons, it should not affect the in-hospital mortality rate (the proportion of deaths among all persons hospitalised with COVID-19 diagnosis). Then, it could relate to changes in demographic characteristics of the population. In particular, older age and comorbidities are very well-known risk factors for mortality of SARS-CoV-2 infected persons [6–9]. Moreover, earlier access to medical care and improved care in hospitals could also contribute to a lower morbidity and mortality over time. Some studies showed an improvement of survival among critical care patients with COVID-19 [10], likely due to improvements in treatment strategies and management of severe cases.
To our knowledge, no study has been performed to investigate the evolution of COVID-19 related morbidity and mortality among hospitalised patients at a national scale in Switzerland, while also accounting for risk factors. Therefore, the aim of the present study was to investigate the trends in COVID-19 related mortality over time in Switzerland, comparing in particular the first and the second wave, using data from the COVID-19 Hospital-based Surveillance (CH-SUR) database [11].
CH-SUR (COVID-19 Hospital Based Surveillance) is a prospective hospital surveillance system for COVID-19 coordinated by the Swiss Federal Office of Public Health (FOPH) and the Institute of Global Health (ISG) of the University of Geneva [11, 12], designed to capture detailed information on COVID-19 hospitalised patients in Switzerland. It includes patients hospitalised for more than 24 hours and diagnosed with COVID-19 confirmed by a laboratory test (e.g., polymerase chain-reaction test, PCR), plus those confirmed by a serology or with a computed tomography (CT) scan and thorax radiography compatible with COVID-19 diagnosis since 14 November 2020. To date, 21 Swiss hospitals are participating in this surveillance (including university hospitals and cantonal hospitals), spread all over Switzerland, and accounting for most of the hospitalisations related to COVID-19 in Switzerland, ensuring that CH-SUR data are representative of the overall COVID-19 situation in the country [9].
For each COVID-19 episode recorded in CH-SUR, information on demographics, admission, clinical information (including comorbidities, complications, admission to intermediate care unit and/or intensive care unit – hereafter IMCU/ICU – and treatments) and follow-up (death, discharge or transfer) are collected. Further information on CH-SUR can be found elsewhere [11]. Of note, since CH-SUR was set up first for surveillance purposes, in a period of high burden for participating hospitals, priority was given to collection of data on admission and follow-up, to enable timely estimates of numbers of new cases and outcomes. Hence, the documentation of additional complementary information (which is relatively time-consuming) is optional, and is often provided with some delay compared with the mandatory information on admission and follow-up. At the time of data export, the clinical complementary information was complete for more than 90% of recorded episodes.
For that analysis, we included all adult (age ≥18 years) patients in CH-SUR diagnosed between 24 February 2020 and 20 June 2021, as recorded by 10 August 2021. Out of the 21 hospitals participating in CH-SUR, one had too incomplete data to be included in our analysis (clinical complementary information provided for less than 50% of patients), and 6 were paediatric hospitals (hence reporting no adult case), consequently the data we used was collected from only 14 hospitals.
This study was submitted and approved by the Geneva Ethics Committee (CCER) and by all hospitals’ local Ethics Committees through the Swiss ethics BASEC submission system, under reference 2020-00827.
We investigated four different time periods in our analyses, corresponding to the different waves of COVID-19 observed in Switzerland, which are defined in table 1. The outcome of a COVID-19 episode was either death due to COVID-19, death due to a cause other than COVID-19, discharge (including both recovered patients who went home and those discharged – presumably not infectious any more – to a nursing home) or transfer to a hospital outside the surveillance network. Patients with no outcome documented were assumed to be still in care.
| Time period | Start date | End date |
| First wave | 2020-02-24 | 2020-04-30 |
| Intermediate phase | 2020-05-01 | 2020-09-30 |
| Second wave | 2020-10-01 | 2021-02-14 |
| Third wave | 2021-02-15 | 2021-06-20 |
Date format: yyyy-mm-dd
We conducted a survival analysis, for which time-to-event was calculated from the date of the first COVID-19 diagnosis (i.e., date of first sample positive for SARS-CoV-2 infection or date of first clinical diagnosis with imaging) to either the date of outcome or the censoring date. We accounted for competing risks, with death due to COVID-19 being the outcome of interest, and death due to other causes, discharge and transfer being considered as competing risks. Patients still in care were censored at the date of the data export (10 August 2021) [13].
We calculated crude cumulative incidence functions (CIFs) for death, overall and per time period, using the R package mstate [13,14]. We used univariable and multivariable Fine and Gray models [15] to determine risk factors of mortality, adjusting for sex (male, female), age (as a continuous variable with restricted cubic splines [16]), time period of COVID-19 diagnosis (first wave, intermediate phase, second wave, third wave), obesity (no, yes), smoking (no, yes), chronic respiratory disease (no, yes), cardiovascular disease (no, yes), renal disease (no, yes), oncological pathologies (no, yes), dementia (no, yes), immunosuppression (no, yes). We excluded patients with missing age, sex, or outcome date when the outcome was documented. We imputed missing values of all other covariables using multiple imputation by chained equation (R package mice [17]), adding the outcome and time to event to improve the results of the imputation. We ran the model on 20 imputed datasets for each analysis, and combined the estimates with Rubin’s rule [17]. For patients with multiple hospitalisations recorded in CH-SUR, we used the information on comorbidities provided at the first admission. We considered only the outcome of the last hospitalisation, and time-to-event was defined as the time from the date of first COVID-19 diagnosis to the date of the last outcome (or the time of censoring if considered still in care).
In a sensitivity analysis, we recalculated univariable and multivariable Fine and Gray models without multiple imputation, excluding all patients with incomplete information on any of the adjusted covariables. We also calculated univariable and multivariable Cox models, hence without accounting for competing risk, with and without multiple imputation, for comparison purposes. Finally, we re-ran all the aforementioned analyses with all-cause death among COVID-19 infected patients of CH-SUR being the outcome of interest, this time not distinguishing death due to COVID-19 from other causes of death.
Similar analyses were conducted for the subgroup of patients who have ever been admitted to IMCU/ICU during their COVID-19 episode(s), with time-to-event being defined as the time from first admission in IMCU/ICU to either the date of outcome or the censoring date. Risk factors of mortality among the IMCU/ICU subgroup were explored using Fine and Gray models as detailed above. For sensitivity purposes, we repeated these analyses but including only patients ever admitted to ICU.
As of 10 August 2021, 16,984 patients recorded in CH-SUR were included in our analysis with 2458 reported deaths (14.5%), 2201 of which were reported to be due to COVID-19 (13.0%). Characteristics of included patients overall and for the first and second waves of COVID-19, are shown in tables 2 and 3. The complete table of characteristics of all the included patients, overall and stratified by time period of COVID-19 diagnosis, can be found in appendix 1.
Table 2Distribution of outcomes for the included COVID-19 patients. P-value corresponds to comparison between the first wave and the second wave, from a chi-square test.
| All, n = 16,984 | First wave, n = 2808 | Second wave, n = 10,653 | P-value, 1 st wave / 2 nd wave | |
| Censored | 638 (3.8%) | 2 (0.1%) | 440 (4.1%) | P <0.001 |
| Deceased – COVID-19 | 2201 (13%) | 438 (15.6%) | 1485 (13.9%) | |
| Deceased – other | 257 (1.5%) | 12 (0.4%) | 211 (2%) | |
| Discharged | 13,386 (78.8%) | 2240 (79.8%) | 8216 (77.1%) | |
| Transferred | 502 (3%) | 116 (4.1%) | 301 (2.8%) |
Table 3Characteristics of COVID-19 patients. For continuous variables, the values given are median (interquartile range). For categorical variables, percentages provided are calculated with respect to total number of patients. P-values correspond to comparison between the first wave and the second wave, from Kruskal-Wallis rank-sum test for continuous variables and chi-square test for categorical variables.
| All, n = 16984 | First wave, n = 2808 | Second wave, n = 10,653 | P-value, 1 st wave / 2 nd wave | ||
| Time from diagnosis to outcome or censoring (d) | 13 (7–21) | 11 (621) | 13 (722) | P < 0.001 | |
| Time from symptoms onset to diagnosis (d) | 2 (06) | 4 (17) | 2 (05) | P < 0.001 | |
| Time from hospital admission to outcome (d) | 9 (519) | 10 (520) | 10 (519) | P = 0.38 | |
| Time from diagnosis to hospital admission (d) | 0 (04) | 0 (02) | 0 (04) | P < 0.001 | |
| Age (years) | 71 (5881) | 69 (5580) | 73 (61–82) | P <0.001 | |
| Sex | Female | 7187 (42.3%) | 1119 (39.9%) | 4527 (42.5%) | P = 0.012 |
| Male | 9797 (57.7%) | 1689 (60.1%) | 6126 (57.5%) | ||
| Obesity | No | 9195 (54.1%) | 1377 (49%) | 5997 (56.3%) | P <0.001 |
| Yes | 4375 (25.8%) | 619 (22%) | 2707 (25.4%) | ||
| Unknown | 3414 (20.1%) | 812 (28.9%) | 1949 (18.3%) | ||
| Smoking | No | 9192 (54.1%) | 1671 (59.5%) | 5540 (52%) | P <0.001 |
| Yes | 1765 (10.4%) | 235 (8.4%) | 1111 (10.4%) | ||
| Unknown | 6027 (35.5%) | 902 (32.1%) | 4002 (37.6%) | ||
| Renal disease | No | 13,326 (78.5%) | 2338 (83.3%) | 7962 (74.7%) | P <0.001 |
| Yes | 3207 (18.9%) | 466 (16.6%) | 2304 (21.6%) | ||
| Unknown | 451 (2.7%) | 4 (0.1%) | 387 (3.6%) | ||
| Oncological pathology | No | 14,489 (85.3%) | 2513 (89.5%) | 8841 (83%) | P <0.001 |
| Yes | 2030 (12%) | 290 (10.3%) | 1417 (13.3%) | ||
| Unknown | 465 (2.7%) | 5 (0.2%) | 395 (3.7%) | ||
| Chronic respiratory disease | No | 13,224 (77.9%) | 2189 (78%) | 8153 (76.5%) | P <0.001 |
| Yes | 3310 (19.5%) | 613 (21.8%) | 2116 (19.9%) | ||
| Unknown | 450 (2.6%) | 6 (0.2%) | 384 (3.6%) | ||
| Cardiovascular disease | No | 10,811 (63.7%) | 1925 (68.6%) | 6271 (58.9%) | P <0.001 |
| Yes | 5730 (33.7%) | 883 (31.4%) | 4006 (37.6%) | ||
| Unknown | 443 (2.6%) | 0 (0%) | 376 (3.5%) | ||
| Dementia | No | 15,045 (88.6%) | 2609 (92.9%) | 9132 (85.7%) | P <0.001 |
| Yes | 1461 (8.6%) | 190 (6.8%) | 1117 (10.5%) | ||
| Unknown | 478 (2.8%) | 9 (0.3%) | 404 (3.8%) | ||
| Immunosuppression | No | 15,118 (89%) | 2556 (91%) | 9345 (87.7%) | P <0.001 |
| Yes | 1371 (8.1%) | 217 (7.7%) | 912 (8.6%) | ||
| Unknown | 495 (2.9%) | 35 (1.2%) | 396 (3.7%) | ||
| Any comorbidity | No | 2832 (16.7%) | 577 (20.5%) | 1385 (13%) | P <0.001 |
| Yes | 13,746 (80.9%) | 2231 (79.5%) | 8910 (83.6%) | ||
| Unknown | 406 (2.4%) | 0 (0%) | 358 (3.4%) | ||
| CURB-65 score | 0 | 4441 (26.1%) | 870 (31%) | 2230 (20.9%) | P <0.001 |
| 1 | 6214 (36.6%) | 940 (33.5%) | 4011 (37.7%) | ||
| 2 | 4405 (25.9%) | 672 (23.9%) | 3089 (29%) | ||
| 3 | 1568 (9.2%) | 268 (9.5%) | 1078 (10.1%) | ||
| 4 | 320 (1.9%) | 53 (1.9%) | 222 (2.1%) | ||
| 5 | 33 (0.2%) | 5 (0.2%) | 22 (0.2%) | ||
| Unknown | 3 (0%) | 0 (0%) | 1 (0%) | ||
| Ever admitted to ICU | No | 13,752 (81%) | 2272 (80.9%) | 8715 (81.8%) | P <0.001 |
| Yes | 2723 (16%) | 534 (19%) | 1576 (14.8%) | ||
| Unknown | 509 (3%) | 2 (0.1%) | 362 (3.4%) | ||
| Ever admitted to IMCU/ICU | No | 12,742 (75%) | 1988 (70.8%) | 8179 (76.8%) | P <0.001 |
| Yes | 3750 (22.1%) | 819 (29.2%) | 2112 (19.8%) | ||
| Unknown | 492 (2.9%) | 1 (0%) | 362 (3.4%) | ||
Of 2201 deaths due to COVID-19 recorded in CH-SUR by the date of data export, 438 patients were diagnosed during the first wave, and 1485 during the second wave. Crude in-hospital COVID-19 mortality was of 15.6% for patients diagnosed during the first wave and 13.9% for those diagnosed during the second wave. Hospitalised COVID-19 patients were slightly older in the second wave (median 73 years, interquartile range [IQR] 61–82) than in the first wave (median 69 years, IQR 55–80). The proportion of male patients was lower in the second wave (57.5%) than in the first wave (60.1%). Low severity scores at admission (CURB-65 score) tended to be more frequent in the second wave (20.9% with score 0, 37.7% with score 1, 29.0% with score 2) compared with the first wave (31.0% with score 0, 33.5% with score 1, 23.9% with score 2.
Because the clinical complementary information is often entered in the database with some delay, data on comorbidities were less complete for the second wave than for the first wave (3.4% and 0%, respectively, of patients with missing information or presence of any comorbidity). Based on the available data, hospitalised patients diagnosed during the second wave appeared to be more comorbid than those diagnosed during the first wave (86.5% and 79.5%, respectively, of patients who had information on presence or absence of comorbidities available).
The median time from first COVID-19 diagnosis to outcome (or censoring), was 11 days (IQR 6–21) for the first wave and 13 days (IQR 7–22) for the second wave. For patients who died due to COVID-19, median time-to-event was 9 days (IQR 6–15) in the first wave compared with 12 days (IQR 6–20) in the second wave. Further statistics on time-to-event stratified per outcome and per time period are provided in appendix 2. The duration of hospital stay was similar between the first (median 10 days, IQR 5–22) and the second waves (median 10 days, IQR 5–19). Time from diagnosis to first hospital admission was often equal to zero in both waves, meaning that most patients are tested at hospital entry, however it tended to be shorter in the first wave (3rd quartile 2 days) than in the second wave (3rd quartile 4 days).
Figure 1 shows cumulative incidence functions of death due to COVID-19 for each time period. Similar figures for the other outcomes (discharge, transfer, death due to other causes) can be found in appendix 3. For the first wave, about 75% of deaths occurred within 15 days after diagnosis, and the probability of death increased from 5.1% 1week after diagnosis to 10.7% after 2 weeks, 14.0% after 4 weeks and 15.1% after 6 weeks. In contrast, for the second wave, about 66% of deaths occurred within 15 days after diagnosis and the probability of death increased from 3.6% after 1 week to 8.3% after 2 weeks, 12.2% after 4 weeks and 13.3% after 6 weeks. This indicates that the probability of death was lower in the second wave than in the first wave and that death tended to occur later after diagnosis in the second wave compared with the first wave.
Figure 1 Cumulative incidences of death due to COVID-19 in CH-SUR, for the different waves of COVID-19.
Table 4 shows the hazard ratios (HRs) for in-hospital COVID-19 mortality for the different time periods, with 95% confidence intervals (95% CIs), from the Fine and Gray models. HRs and 95% CIs for all the covariables included in the models can be found in appendix 4. The risk of death due to COVID-19 was lower for hospitalised patients diagnosed during the second wave compared with those diagnosed during the first wave (HR 0.70, 95% CI 0.63–0.78).
Table 4Estimates of the effect of time period of diagnosis on cause-specific mortality (associated to COVID-19) among hospitalised patients, from Fine and Gray models.
| Time period | Multivariable, imputed | Multivariable, complete case | Univariable, complete case |
| p <0.001 | p <0.001 | p <0.001 | |
| First wave | 1.0 (ref.) | 1.0 (ref.) | 1.0 (ref.) |
| Intermediate phase | 0.495 (0.359−0.682) | 0.666 (0.449−0.989) | 0.439 (0.319−0.604) |
| Second wave | 0.7 (0.629−0.779) | 0.729 (0.625−0.849) | 0.876 (0.788−0.975) |
| Third wave | 0.645 (0.55−0.756) | 0.667 (0.535−0.832) | 0.488 (0.417−0.572) |
For comparison purposes, HRs for in-hospital COVID-19 mortality from Cox models (hence not accounting for competing risk), with and without multiple imputation, can be found in appendix 5. Results from sensitivity analyses on in-hospital all-cause mortality in CH-SUR (Fine-Gray models and Cox models, with and without imputation) are shown in appendix 6 and appendix 7, respectively.
As of 10 August 2021, out of the 16,984 patients included in the main analysis, 3750 patients (22.1%) were admitted at least once to IMCU/ICU: 819 in the first wave and 2,112 in the second wave. Overall, for 3739 of them the time to event variable was available (819 for the first wave, 2106 for the second wave), with time to event being defined as time from first IMCU/ICU admission to outcome (or censoring). Characteristics of all those IMCU/ICU patients, overall and stratified by time period of COVID-19 diagnosis, can be found in appendix 8. The proportion of patients ever admitted to IMCU/ICU was lower in the second wave than in the first wave (table 3). The time elapsed from COVID-19 diagnosis to first admission into IMCU/ICU was longer in the second wave (median 4 days, IQR 0–8) than in the first wave (median 2 days, IQR 0–5). The time from first IMCU/ICU admission to outcome (or censoring) was similar in the second wave (median 16 days, IQR 9–30) and in the first wave (median 16 days, IQR 8–33.5). Moreover, the proportion of patients who ever went to IMCU/ICU and experienced invasive ventilation was higher in the first wave (53.5%) compared with the second wave (45.2%).
Similarly to all hospitalised patients, IMCU/ICU patients of the second wave were more comorbid than those of the first wave (87.9% versus 81.9%). Crude in-hospital COVID-19 mortality rates among patients who were admitted to IMCU/ICU are 19.3% and 27.4% for patients hospitalised during the first wave, and second wave, respectively.
Cumulative incidence functions for death due to COVID-19 during the different waves, limited to patients ever admitted to IMCU/ICU, are shown in figure 2. Similar CIFs for the other outcomes (death due to other causes, discharge and transfer) can be found in appendix 9. During the first wave, about 82% of deaths occurred within 4 weeks after first admission to IMCU/ICU; the probability of death among IMCU/ICU patients increased from 5.9% after 1 week to 11.4% after 2 weeks, 15.9% after 4 weeks and 18.2% after 6 weeks. During the second wave, about 88% of deaths occurred within 4 weeks after first admission to IMCU/ICU; the probability of death increased from 8.2% after 1 week to 14.8% after 2 weeks, 23.6% after 4 weeks and 26.0% after 6 weeks. This indicates that the probability of death among IMCU/ICU patients was higher in the second wave than in the first wave, and that death tended to occur earlier after IMCU/ICU admission in the second wave compared with the first wave.
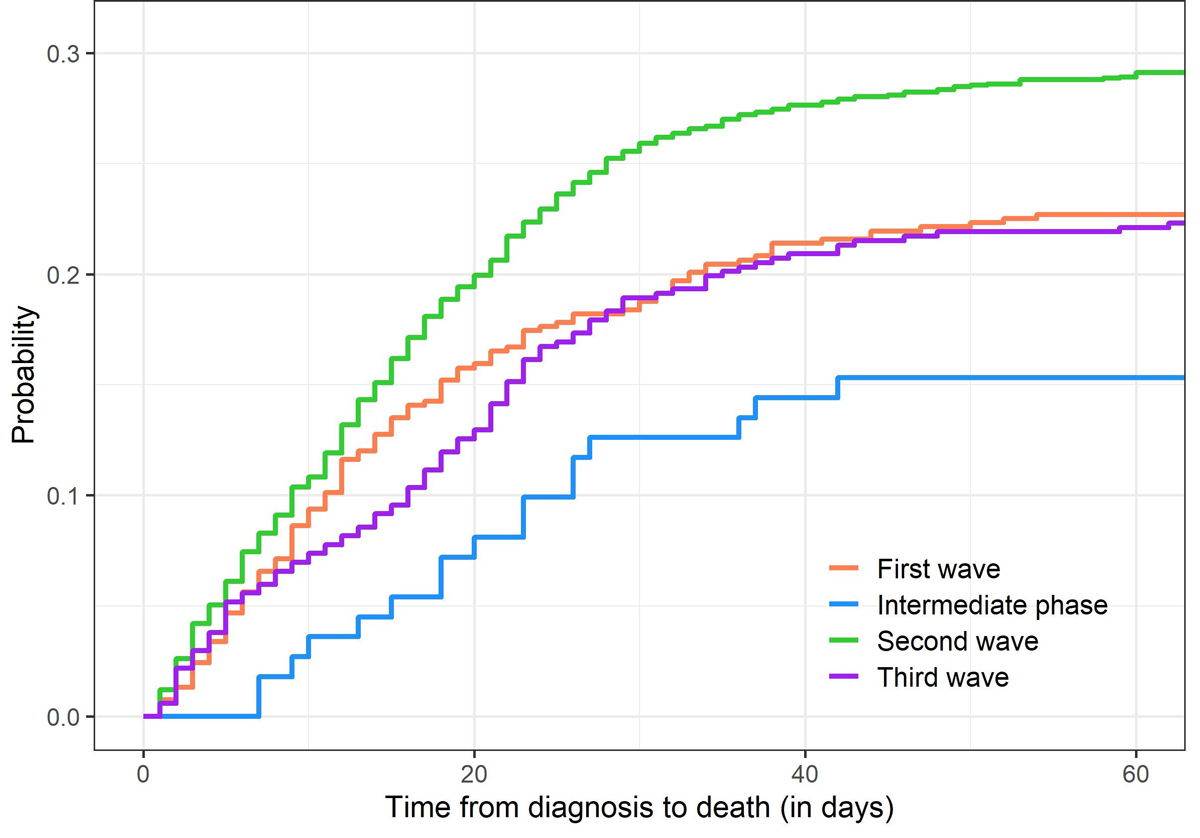
Figure 2 Cumulative incidence functions of death due to COVID-19 for patients admitted to IMCU/ICU, for the different time periods.
HRs associated with time period and use of invasive ventilation from Fine and Gray models are shown in table 5. HRs and 95% CIs for all the covariables included in the models can be found in appendix 10. The risk of death was higher for patients who ever were admitted to IMCU/ICU during the second wave compared to the first wave (HR 1.25, 95% CI 1.05–1.49).
Table 5Estimates of the effect of time period and invasive ventilation on cause-specific (i.e., due to COVID-19) mortality among patients who ever went to IMCU/ICU, from Fine and Gray models.
| Time period | Multivariable, imputed | Multivariable, complete case | Univariable, complete case |
| p = 0.029 | p = 0.2 | p <0.001 | |
| First wave | 1.0 (ref.) | 1.0 (ref.) | 1.0 (ref.) |
| Intermediate phase | 0.824 (0.532−1.28) | 1.12 (0.641−1.97) | 0.788 (0.509−1.22) |
| Second wave | 1.25 (1.05−1.49) | 1.33 (1.02−1.74) | 1.49 (1.25−1.78) |
| Last period | 1.17 (0.931−1.48) | 1.27 (0.907−1.78) | 1.07 (0.852−1.34) |
For comparison purposes, HRs for in-IMCU/ICU COVID-19 mortality from Cox models (hence not accounting for competing risk), with and without multiple imputation, can be found in appendix 11. Results from sensitivity analyses on in-IMCU/ICU all-cause mortality in CH-SUR (Fine-Gray models and Cox models, with and without imputation) are shown in appendix 12 and appendix 13, respectively.
Finally, results from ICU-specific analysis can be found in appendix 14 (characteristics of patients), appendix 15 (CIFs) and appendix 16 (HRs for in-ICU COVID-19 mortality from Fine-Gray models). The proportion of patients who ever were admitted to ICU was lower in the second wave than in the first wave (table 2). During the second wave, compared with the first wave, ICU patients had a longer time from diagnosis to first ICU admission (median 4 days IQR 0–8, versus median 3 days IQR 0–6), shorter time from first ICU admission to outcome (median 18 days, IQR 10–33, versus median 23 days IQR 12–41 days), a significantly lower use of invasive ventilation (60.6% versus 82.2%), and a possibly increased risk of death though the difference between the two waves does not appear to be very significant (HR 1.17, 95% CI 0.96–1.43, p = 0.13).
Based on CH-SUR data, we investigated the changes of in-hospital COVID-19 mortality over time in Switzerland, accounting for well-known risk factors for mortality such as age, sex or comorbidities. In-hospital mortality due to COVID-19 was lower and the time from diagnosis to death was longer during the second wave of COVID-19 compared with the first wave.
In contrast, in-IMCU/ICU mortality due to COVID-19 significantly increased in the second wave compared with the first wave. Time from diagnosis to first IMCU/ICU admission was longer in the second wave than in the first wave. Time from first IMCU/ICU admission to outcome appeared to be similar between the first and the second waves, whereas time from first ICU admission to outcome appeared to be shorter in the second wave. The use of invasive ventilation was significantly less frequent in the second wave, whereas the use of non-invasive ventilation increased from the first to the second wave.
The lower in-hospital COVID-19 mortality observed in CH-SUR for the second wave seems not to be explained by changes in the demographic characteristics of patients, since patients during the second wave tended to be slightly older, more comorbid, and they were more often male (all three being known to increase the risk of COVID-19-related death [6–9]). However, the changes in case management over time, induced by a growing knowledge on COVID-19, probably played a role in reducing in-hospital mortality. The use of corticosteroids (e.g., dexamethasone), which is recommended systematically since summer 2020 by World Health Organization for patients with severe or critical COVID-19 [18], and which was widely used during the second wave, has been shown to reduce mortality among patients receiving oxygen or invasive ventilation [19].
Moreover, a significantly lower referral rate of patients with a poor prognosis in the second wave could also have contributed to the reduction of observed in-hospital mortality over time while increasing the out-of-hospital mortality. Such a phenomenon could concern typically over-80-year-old persons who would have been hospitalised during the first wave but who were not because of their serious prognosis and the heaviness of acute care (either according to their will or due to triage [20]).
Compared with neighbouring countries in Western Europe, Switzerland had a lower in-hospital mortality (first wave 15.6%, second wave 14.0%) than, for example, France (first wave 16.2%, second wave 17.7%) [21] or Germany (first wave 19.1%, second wave 19.8%) [22], during both waves. This is a probable consequence of the good general health condition in Switzerland (reflected by one of the highest life expectancy worldwide [23]), a country with a well-developed health system, where comorbidities known as risk factors for COVID-19 mortality (e.g., cardiovascular diseases) are carefully controlled.
However, Switzerland was less successful at containing the pandemic during the second wave than other European countries. Its overall mortality (e.g. number of deaths per million, see [7]) and excess mortality [24] both increased during the second wave, despite being among the lowest in Europe during the first wave. This discrepancy between the time trends of in-hospital mortality and overall mortality related to COVID-19 further supports the hypothesis of increased out-of-hospital mortality during the second wave.
The characteristics of IMCU/ICU and ICU patients in CH-SUR during the first and second wave revealed significant changes in the case management and in the course of hospitalisation of COVID-19 patients. Those observations are in line with the updated guidelines in Swiss hospitals regarding acute care of hospitalised COVID-19 patients [25–28]. After the first COVID-19 wave, admission in ICU was avoided or postponed as much as possible, limiting it to the most severe cases, with a wider use of intermediate care facilities in hospitals having such a unit. Moreover, invasive ventilation, which was used for most ICU patients during the first wave, was partly replaced by non-invasive ventilation or high-flow nasal cannula [29] when possible, to avoid the risks associated with mechanical ventilation, including bacterial or fungal co-infections [30].
The higher in-IMCU/ICU COVID-19 mortality observed in CH-SUR for the second wave could be a consequence of the high burden of COVID-19 cases on Swiss hospitals in the early weeks of the second wave, up to the saturation of ICU capacity in several cantons (particularly in the western part of Switzerland) in November 2020. After that date, when the epidemic was increasing exponentially, NPIs were re-introduced, whereas the stringency index was relatively low in the preceding weeks compared with neighbouring western European countries [31, 32]. Alternatively, given the longer time elapsed between diagnosis and first IMCU/ICU admission in the second wave, patients admitted to ICU might have been in a more severe condition during the second wave, subsequently leading to worse outcomes, possibly due to delayed optimal care.
To our knowledge, this is one of the first studies investigating the time trends of COVID-19 related in-hospital mortality in Switzerland. Use of CH-SUR data allowed us to perform analyses including clinical information on comorbidities and ensured a high coverage of COVID-19 hospitalisations in Switzerland, with about 70% of all hospitalisations reported mandatorily to the FOPH by 21 June 2021 included in CH-SUR. By imputing missing values of covariables, accounting for competing risks and including age as a continuous variable (instead of categorising it arbitrarily), we improved the accuracy of our approach. In contrast, as our study used observational patient data, it may be subject to some biases, such as selection or information bias [33]. Another limitation of our study is that, for some models and some variables, the proportional hazard assumption inherent to Cox and Fine-Gray models was violated, hence mitigating the statistical power of our analysis.
Other studies in Europe have investigated the risk of death among patients infected by some SARS-CoV-2 variants of concern [34], such as the alpha variant, which appears to increase the risk of critical care admission and mortality compared to the common SARS-CoV-2 strain [35,36], or the delta variant which was shown to double the risk of hospital admission compared to the alpha variant [37]. The emergence of several suspected more virulent variants since autumn 2020 likely influences the time trends of COVID-19-related mortality. Information on the variant type has been recorded in the CH-SUR database since January 2021 for a fraction of documented episodes. However, to date data remain very sparse, which limits analyses on the effect of variants on COVID-19 in-hospital mortality.
Vaccination should also affect significantly trends in COVID-19 mortality, by reducing the risk of developing a severe form of the disease, and therefore reducing the risk of hospitalisation and death. In Switzerland, the vaccination campaign started in early January 2021, first limited to very specific subgroups of the population. Consequently, we do not expect it to have played a role in the differences in mortality between the first and the second wave. Nevertheless, vaccination will be a key element of analyses on COVID-19 related morbidity and mortality for the subsequent waves.
In conclusion, we found that in Switzerland COVID-19 in-hospital mortality was lower during the second wave than in the first wave. In contrast, in the second wave, COVID-19-related mortality significantly increased among patients admitted to intermediate or intensive care, compared with the first wave. We put our findings in perspective with the changes operated between the two time periods in terms of case management, treatment strategy, hospital burden and NPIs. Further analyses in the near future, taking into account the potential effect of variants and vaccination on mortality, would be crucial to have a complete overview of COVID-19 mortality trends throughout the different phases of the pandemic.
The anonymised data can be accessed through a multi-stage process described elsewhere [11]. Applicants must fill a concept-sheet and send it to the team in charge of the study. An Executive Committee of experts and representatives of hospital participants will review the concept. Depending on the goal of the analysis, additional ethics clearance might be needed. Data will be restricted to the request and shared through a secure platform.
The list of members of CH-SUR is available on the CH-SUR website: https://www.unige.ch/medecine/hospital-covid/
The authors would like to thank all the participating centres’ teams, study nurses, and physicians for their hard work and commitment to the study. The Clinical Research Centre (Geneva University Hospitals and Faculty of Medicine) hosted the database.
This work was supported by the Swiss Federal Office of Public Health under reference 333.0-20/1 (UniGe) and 334.0-80/1 (UniBe). O.K. acknowledges additional support from the Swiss National Science Foundation (SNF) via grant #163878. PWS is supported by the academic career program “Filling the Gap” of the Medical Faculty of the University of Zurich.
All authors have completed and submitted the International Committee of Medical Journal Editors form for disclosure of potential conflicts of interest. PWS received travel grants from Pfizer and Gilead, honoraria for advisory board activity and talks from Pfizer outside of the submitted work. All other authors declare no conflict of interest.
The appendices are available in the PDF version of this article.
1. Cookson C , Burn-Murdoch J . Why the second wave of COVID-19 appears to be less lethal. Financial Times. 2020; Available at: https://www.ft.com/content/b3801b63-fbdb-433b-9a46-2174 05b1109f.
2. Griffin S . Covid-19: second wave death rate is doubling fortnightly but is lower and slower than in March. BMJ. 2020 Oct;371:m4092. https://doi.org/10.1136/bmj.m4092
3. James N , Menzies M , Radchenko P . COVID-19 second wave mortality in Europe and the United States. Chaos. 2021 Mar;31(3):031105. https://doi.org/10.1063/5.0041569
4. COVID-19 Switzerland | Coronavirus | Dashboard. Available at: https://www.covid19.admin.ch/en/overview. Accessed 2021 April 30.
5. FOPH Federal Office of Public Health . Coronavirus: Situation in Switzerland. Available at: https://www.bag.admin.ch/bag/en/home/krankheiten/ausbrueche-epidemien-pandemien/aktuelle-ausbrueche-epidemien/novel-cov/situation-schweiz-und-international.html. Accessed 2021 May 7.
6. Williamson EJ , Walker AJ , Bhaskaran K , Bacon S , Bates C , Morton CE , et al. Factors associated with COVID-19-related death using OpenSAFELY. Nature. 2020 Aug;584(7821):430–6. https://doi.org/10.1038/s41586-020-2521-4
7. Bravi F , Flacco ME , Carradori T , Volta CA , Cosenza G , De Togni A , et al. Predictors of severe or lethal COVID-19, including Angiotensin Converting Enzyme inhibitors and Angiotensin II Receptor Blockers, in a sample of infected Italian citizens. PLoS One. 2020 Jun;15(6):e0235248. https://doi.org/10.1371/journal.pone.0235248
8. Hothorn T , Bopp M , Günthard H , Keiser O , Roelens M , Weibull CE , et al. Assessing relative COVID-19 mortality: a Swiss population-based study. BMJ Open. 2021 Mar;11(3):e042387. https://doi.org/10.1136/bmjopen-2020-042387
9. Maximiano Sousa F , Roelens M , Fricker B , Thiabaud A , Iten A , Cusini A , et al.; Ch-Sur Study Group . Risk factors for severe outcomes for COVID-19 patients hospitalised in Switzerland during the first pandemic wave, February to August 2020: prospective observational cohort study. Swiss Med Wkly. 2021 Jul;151:w20547. https://doi.org/10.4414/smw.2021.20547
10. Dennis JM , McGovern AP , Vollmer SJ , Mateen BA . Improving Survival of Critical Care Patients With Coronavirus Disease 2019 in England: A National Cohort Study, March to June 2020. Crit Care Med. 2021 Feb;49(2):209–14. https://doi.org/10.1097/CCM.0000000000004747
11. Thiabaud A , Iten A , Balmelli C , Senn L , Troillet N , Widmer A , et al. Cohort profile: SARS-CoV-2/COVID-19 hospitalised patients in Switzerland. Swiss Med Wkly. 2021 Feb;151:w20475. [cited 2021 Mar 15] Available from: https://smw.ch/article/doi/smw.2021.20475 https://doi.org/10.4414/smw.2021.20475
12. Hospital-based surveillance of COVID-19 in Switzerland. 2020. Available at: https://www.unige.ch/medecine/hospital-covid/. Accessed 2021 April 30.
13. Putter H , Fiocco M , Geskus RB . Tutorial in biostatistics: competing risks and multi-state models. Stat Med. 2007 May;26(11):2389–430. https://doi.org/10.1002/sim.2712
14. Putter H. Tutorial in biostatistics: Competing risks and multi-state models Analyses using the mstate package. :43.
15. Fine JP , Gray RJ . A Proportional Hazards Model for the Subdistribution of a Competing Risk. J Am Stat Assoc. 1999;94(446):496–509. https://doi.org/10.1080/01621459.1999.10474144
16. Shepherd BE , Rebeiro PF ; Caribbean, Central and South America network for HIV epidemiology . Assessing and interpreting the association between continuous covariates and outcomes in observational studies of HIV using splines. J Acquir Immune Defic Syndr. 2017 Mar;74(3):e60–3. https://doi.org/10.1097/QAI.0000000000001221
17. van Buuren S , Groothuis-Oudshoorn K . mice: Multivariate Imputation by Chained Equations in R. J Stat Softw. 2011;45(3):1–67. https://doi.org/10.18637/jss.v045.i03
18. Rochwerg B , Agarwal A , Siemieniuk RA , Agoritsas T , Lamontagne F , Askie L , et al. A living WHO guideline on drugs for covid-19. BMJ. 2020 Sep;370:m3379. https://doi.org/10.1136/bmj.m3379
19. Horby P , Lim WS , Emberson JR , Mafham M , Bell JL , Linsell L , et al.; RECOVERY Collaborative Group . Dexamethasone in Hospitalized Patients with Covid-19. N Engl J Med. 2021 Feb;384(8):693–704. https://doi.org/10.1056/NEJMoa2021436
20. SAMS – Swiss Academy of Medical Sciences . Intensive care medicine: triage under resource scarcity. Available at: https://www.samw.ch/en/Ethics/Topics-A-to-Z/Intensive-care-medicine.html. Accessed 2021 July 27.
21. Synthèse des indicateurs de suivi de l’épidémie COVID-19 - data.gouv.fr. Available at: /fr/datasets/synthese-des-indicateurs-de-suivi-de-lepidemie-covid-19/. Accessed 2021 June 18.
22. Gessler N , Gunawardene MA , Wohlmuth P , Arnold D , Behr J , Gloeckner C , et al. Clinical outcome, risk assessment, and seasonal variation in hospitalized COVID-19 patients-Results from the CORONA Germany study. PLoS One. 2021 Jun;16(6):e0252867. https://doi.org/10.1371/journal.pone.0252867
23. World Health Organization (WHO) . Global Health Observatory - Life expectancy at birth. Available at: https://www.who.int/data/gho/data/indicators/indicator-details/GHO/life-expectancy-at-birth-(years). Accessed 2021 July 30.
24. EuroMOMO . The European monitoring of excess mortality for public health action (EuroMOMO) network. Available at: https://www.euromomo.eu/. Accessed 2021 June 17.
25. Société Suisse de Médecine Intensive (SSMI) . Nouvelles recommandations de la SSMI sur l’oxygénothérapie pourles patients COVID-19. Available at: https://www.sgi-ssmi.ch/fr/covi19.html?file=files/Dateiverwaltung/COVID_19/Guidelines/IMSGCVCM_Neue%20Empfehlungen_Sauerstoff_Covid-19_FR_201027_03.pdf. Accessed 2021 July 21.
26. Société Suisse de Médecine Intensive (SSMI) . Recommandations pour l’admission en unité de soins intermédiaires et de soins intensifs des patients présentant une infection à SARS-CoV-2 –Epidémie Covid-19. Available at: https://www.sgi-ssmi.ch/fr/covi19.html?file=files/Dateiverwaltung/COVID_19/Guidelines/ISGCVCM_Triageempfehlungen_200318_FR.pdf
27. Colloque médical COVID-19 | HUG - Hôpitaux Universitaires de Genève. Available at: https://www.hug.ch/maladies-infectieuses/colloque-medical-covid-19. Accessed 2021 May 7.
28. Recommandations pour les professionnels de la santé | HUG - Hôpitaux Universitaires de Genève. Available at: https://www.hug.ch/coronavirus/recommandations-pour-professionnels-sante. Accessed 2021 June 18.
29. Calligaro GL , Lalla U , Audley G , Gina P , Miller MG , Mendelson M , et al. The utility of high-flow nasal oxygen for severe COVID-19 pneumonia in a resource-constrained setting: A multi-centre prospective observational study. EClinicalMedicine. 2020 Nov;28:100570. [cited 2021 Jun 17] Available from: https://www.thelancet.com/journals/eclinm/article/PIIS2589-5370(20)30314-X/abstract https://doi.org/10.1016/j.eclinm.2020.100570
30. Søgaard KK , Baettig V , Osthoff M , Marsch S , Leuzinger K , Schweitzer M , et al. Community-acquired and hospital-acquired respiratory tract infection and bloodstream infection in patients hospitalized with COVID-19 pneumonia. J Intensive Care. 2021 Jan;9(1):10. https://doi.org/10.1186/s40560-021-00526-y
31. Ritchie H , Ortiz-Ospina E , Beltekian D , et al. Coronavirus Pandemic (COVID-19). Our World in Data 2020; Available at: https://ourworldindata.org/coronavirus. Accessed 2021 July 29.
32. COVID-19 . Stringency Index. Available at: https://ourworldindata.org/grapher/covid-stringency-index. Accessed 2021 July 29.
33. Hammer GP , du Prel JB , Blettner M . Avoiding bias in observational studies: part 8 in a series of articles on evaluation of scientific publications. Dtsch Arztebl Int. 2009 Oct;106(41):664–8.
34. Tracking SARS-CoV-2 variants. Available at: https://www.who.int/activities/tracking-SARS-CoV-2-variants. Accessed 2021 June 24.
35. Challen R , Brooks-Pollock E , Read JM , Dyson L , Tsaneva-Atanasova K , Danon L . Risk of mortality in patients infected with SARS-CoV-2 variant of concern 202012/1: matched cohort study. BMJ. 2021 Mar;372(579):n579. https://doi.org/10.1136/bmj.n579
36. Patone M , Thomas K , Hatch R , et al. Analysis of severe outcomes associated with the SARS-CoV-2 Variant of Concern 202012/01 in England using ICNARC Case Mix Programme and QResearch databases. medRxiv 2021; 2021.03.11.21253364. https://doi.org/10.1101/2021.03.11.21253364
37. Sheikh A , McMenamin J , Taylor B , Robertson C ; Public Health Scotland and the EAVE II Collaborators . SARS-CoV-2 Delta VOC in Scotland: demographics, risk of hospital admission, and vaccine effectiveness. Lancet. 2021 Jun;397(10293):2461–2. https://doi.org/10.1016/S0140-6736(21)01358-1