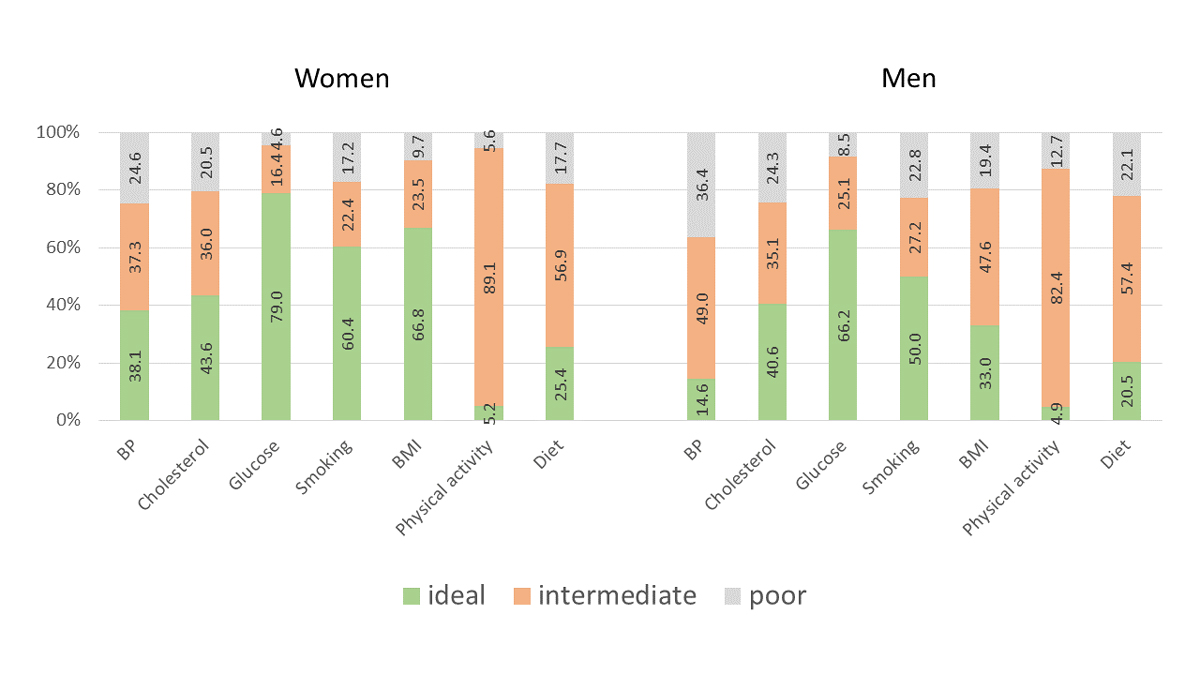
Figure 1 Prevalence of the three levels (ideal, intermediate and poor) for all seven health metrics of the American Heart Association separate for women and men.
DOI: https://doi.org/10.4414/SMW.2021.w30040
The American Heart Association (AHA) developed a concept to measure cardiovascular health in populations and to monitor changes of cardiovascular health over time [1]. To measure cardiovascular health in a given population, the AHA selected seven health metrics of known cardiovascular risk factors, three of which corresponded to health factors (blood pressure, total cholesterol and blood glucose), and four to health behaviours (smoking, body weight, physical activity, and diet) [1]. For each of the seven health metrics, the AHA defined three levels of cardiovascular health: ideal, intermediate and poor [1]. In recent years, many studies have adopted this concept and reported results on the prevalence of ideal cardiovascular health [2–8]. Some of the studies also investigated associations of ideal cardiovascular health with mortality, cardiovascular events, dementia or cancer [5–8]. To the best of the authors’ knowledge, all of these previous studies represented selected study populations, and none of the studies was based on the population level. The Swiss Longitudinal Cohort Study (SWICOS) was initiated in 2015 with the aim to evaluate health status in regions of Switzerland at the population level and to observe changes in health status over several decades [9]. We therefore aimed to analyse cardiovascular health according to the AHA concept in participants in the SWICOS study.
Between 2015 and 2018, all inhabitants aged 6 years or older (with no upper age limit) of two municipalities in Southern Switzerland (Cama and Lostallo) were invited to participate in the prospective SWICOS cohort. The detailed study protocol has been previously published [9]. For the purpose of this interim analysis, we excluded participants who were younger than 18 years. The local ethics committee approved the protocol, and the study complied with the Declaration of Helsinki. All participants provided written informed consent.
In all participants, blood pressure was measured in the sitting position using an oscillometric device (OMRON 705, OMRON Healthcare, Nederland), repeated after 5 minutes rest and the second value was used for further analysis. A blood sample was drawn in all participants; total cholesterol and blood glucose were analysed using an Architect CI8200 (Abbott, USA). Smoking was assessed using standardised questions. Body mass index (BMI) was calculated based on measurements of weight and height. Physical activity and diet were assessed using validated instruments [10, 11].
An ideal health metric was defined as untreated blood pressure <120/80 mm Hg, untreated total cholesterol <5.17 mmol/l, untreated blood glucose <5.6 mmol/l, never smoking, BMI <25 kg/m2, moderate physical activity ≥150 min/week and/or intensive physical activity ≥75 min/week, and diet with daily ingestion of unprocessed food (daily fresh vegetables and/or fruit). The definition of an intermediate health metric was untreated blood pressure 120–139/80–89 mm Hg or treated blood pressure <140/90 mm Hg, untreated total cholesterol 5.17–6.19 mmol/ or treated total cholesterol <6.20 mmol/l, untreated blood glucose 5.6–6.9 mmol/l or treated blood glucose <7.0 mmol/l, former smoker, BMI 25–29.9 kg/m2, moderate physical activity 1–140 min/week and/or intensive physical activity 1–75 min/week, and diet with eating of unprocessed and processed/ultra-processed food within 25 and 75 percentiles. The definition of a poor health metric was untreated or treated blood pressure ≥140/≥90 mm Hg, untreated or treated total cholesterol ≥6.20 mmol/l, untreated or treated blood glucose ≥7.0 mmol/l, current smoker, BMI ≥30 kg/m2, no moderate or intensive physical activity, and diet including daily ingestion of processed or ultra-processed food. Diet was classified according to a concept of the Food and Agriculture Organization (FAO) of the United Nations [12].
Statistical analysis included descriptive analysis of the seven health metrics for the overall study population as well as separately for women and men. We analysed differences between women and men using Pearson’s chi-square test. Furthermore, we used a univariate and multivariate logistic regression model to detect associations between baseline variables and ideal cardiovascular health. We defined the dependent outcome of ideal cardiovascular as having an ideal health metric for five or more of the seven health metrics. Finally, we performed a sensitivity analysis of the seven health metrics after exclusion of participants who had a previous cardiovascular event (coronary artery disease, heart failure, myocardial infarction and/or stroke).
All 474 participants of the SWICOS cohort who were 18 years or older were part of this analysis. Of these, 268 were female (56.5%) with a mean age of 50.5 ± 16.2 years, and 206 were male (43.5%) with a mean age of 50.4 ± 16.1 years (table 1). Differences between women and men were significant for systolic and diastolic blood pressure (p < 0.001), BMI (p < 0.001) and physical activity (p = 0.030), whereas for total cholesterol (p = 0.82), blood glucose (p = 0.14) and smoking (p = 0.13), no significant differences were found. Among the 474 participants, 30 participants (6.3%) had a previous cardiovascular event (coronary artery disease, heart failure, myocardial infarction and/or stroke).
Table 1Baseline characteristics of the participants.
| Variable | All (n = 474) | Women (n = 268) | Men (n = 206) | p-value |
| Age (years), mean (SD) | 50.5 (16.1) | 50.5 (16.2) | 50.4 (16.1) | 0.92 |
| Higher education level (%) | 76.6 | 70.0 | 85.3 | <0.001 |
| Current smoking* (%) | 19.6 | 17.2 | 22.8 | 0.13 |
| Hypertension* (%) | 16.0 | 14.2 | 18.4 | 0.26 |
| Hyperlipidaemia* (%) | 18.1 | 12.7 | 25.2 | 0.001 |
| Diabetes* (%) | 3.8 | 3.0 | 4.9 | 0.34 |
| Overweight** (%) | 34.0 | 23.5 | 47.6 | <0.001 |
| Obesity** (%) | 13.9 | 9.7 | 19.4 | <0.001 |
| Moderate or intensive physical activity* (%) | 5.9 | 5.2 | 4.9 | 0.030 |
| SBP (mm Hg), mean (SD) | 135 (21) | 139 (22) | 141 (19) | <0.001 |
| DBP (mm Hg), mean (SD) | 81 (10) | 79 (11) | 83 (10) | <0.001 |
| TC (mmol/l), mean (SD) | 5.4 (1.0) | 5.4 (0.9) | 5.4 (1.0) | 0.82 |
| LDL (mmol/l), mean (SD) | 3.4 (0.9) | 3.3 (0.9) | 3.5 (1.0) | 0.06 |
| Blood glucose (mmol/l), mean (SD) | 5.4 (1.6) | 5.3 (1.8) | 5.5 (1.4) | 0.14 |
| DBP = diastolic blood pressure; LDL = low-density lipoprotein; SBP = systolic blood pressure; TC = total cholesterol* According to self-report questionnaire.† Overweight was defined as body mass index ≥25 and <30 kg/m2, obesity as body mass index ≥30 kg/m2 | ||||
DBP = diastolic blood pressure; LDL = low-density lipoprotein; SBP = systolic blood pressure; TC = total cholesterol
* According to self-report questionnaire.
** Overweight was defined as body mass index ≥25 and <30 kg/m2, obesity as body mass index ≥30 kg/m2
Table 2 and figure 1 show the prevalence of the three levels (ideal, intermediate and poor) of the seven AHA health metrics. The prevalence of ideal cardiovascular health was significantly higher and that of poor cardiovascular health significantly lower in women than in men for most of the seven health metrics (blood pressure, glucose, smoking, BMI and physical activity).
Table 2Prevalence of the three levels (i.e., ideal, intermediate and poor) of the seven American Heart Association health metrics for the overall study population, separate for women and men, and after exclusion of participants who had a previous cardiovascular event.
| All | Women | Men | p-value* | All without CVE | p-value ** | ||
| Blood pressure | Ideal (%) | 27.8 | 38.1 | 14.6 | <0.001 | 29.5 | 0.72 |
| Intermediate (%) | 42.4 | 37.3 | 49.0 | 41.4 | |||
| Poor (%) | 29.7 | 24.6 | 36.4 | 29.1 | |||
| Cholesterol | Ideal (%) | 42.3 | 43.6 | 40.6 | 0.60 | 41.1 | 0.83 |
| Intermediate (%) | 35.6 | 36.0 | 35.1 | 36.2 | |||
| Poor (%) | 22.1 | 20.5 | 24.3 | 22.7 | |||
| Glucose | Ideal (%) | 73.4 | 79.0 | 66.2 | 0.008 | 75.3 | 0.64 |
| Intermediate (%) | 20.3 | 16.4 | 25.4 | 19.4 | |||
| Poor (%) | 6.3 | 4.6 | 8.5 | 5.3 | |||
| Smoking | Ideal (%) | 55.9 | 60.4 | 50.0 | 0.072 | 57.4 | 0.72 |
| Intermediate (%) | 24.5 | 22.4 | 27.2 | 23.2 | |||
| Poor (%) | 19.6 | 17.2 | 22.8 | 19.4 | |||
| Body mass index | Ideal (%) | 52.1 | 66.8 | 33.0 | <0.001 | 54.1 | 0.70 |
| Intermediate (%) | 34.0 | 23.5 | 47.6 | 32.9 | |||
| Poor (%) | 13.9 | 9.7 | 19.4 | 13.1 | |||
| Physical activity | Ideal (%) | 5.1 | 5.2 | 4.9 | 0.026 | 5.2 | 0.90 |
| Intermediate (%) | 86.2 | 89.1 | 82.4 | 85.7 | |||
| Poor (%) | 8.7 | 5.6 | 12.7 | 9.1 | |||
| Diet | Ideal (%) | 23.3 | 25.4 | 20.5 | 0.34 | 22.6 | 0.89 |
| Intermediate (%) | 57.1 | 56.9 | 57.4 | 56.7 | |||
| Poor (%) | 19.6 | 17.7 | 22.1 | 20.7 | |||
CVE = cardiovascular event
* p-value for the comparison of women vs men
** p-value for the comparison of all participants vs all participants without previous cardiovascular event
Figure 1 Prevalence of the three levels (ideal, intermediate and poor) for all seven health metrics of the American Heart Association separate for women and men.
Ideal cardiovascular health for three or more of the seven health metrics simultaneously was found in 259 participants (54.9%, 95% confidence interval [CI] 50.1–59.4%); 213 participants (45.1%, 95% CI 40.6–49.7%) showed ideal cardiovascular health for only two or fewer of the seven health metrics. Poor cardiovascular health for three or more of the seven health metrics was found in 40 participants (8.5%, 95% CI 6.1–11.4%); 432 participants (91.5%, 95% CI 88.6–93.9%) showed a poor level for only two or less of the seven health metrics simultaneously.
Table 3 displays the results of the logistic regression analysis. Increasing age was independently associated with decreasing cardiovascular health, whereas women and participants with higher educational level more often achieved ideal cardiovascular health.
Table 3Associations between baseline variables and the outcome of ideal cardiovascular health.
| Baseline variable | Univariate associations | Multivariate associations* | ||
| OR (95% CI) | p-value | OR (95% CI) | p-value | |
| Age (per year increase) | 0.96 (0.94–0.98) | <0.001 | 0.97 (0.94–0.99) | 0.007 |
| Sex (female vs male) | 4.60 (2.11–10.03) | <0.001 | 5.54 (2.48–12.41) | <0.001 |
| Educational level (higher vs lower) | 5.24 (1.60–17.18) | 0.006 | 4.16 (1.19–14.58) | 0.026 |
| Marital status (married vs unmarried) | 0.58 (0.32–1.05) | 0.072 | 0.79 (0.40–1.57) | 0.51 |
| Emotional status (depressed vs not depressed) | 1.06 (0.62–1.81) | 0.84 | 1.01 (0.55–1.85) | 0.98 |
CI = confidence interval; OR = odds ratio.
* The multivariate analysis was adjusted for all baseline variables in table 3.
The sensitivity analysis after exclusion of participants who had a previous cardiovascular event showed that prevalence of the three levels of the seven AHA health metrics were similar to the overall study population (table 2).
Overall, this study found favourable results for cardiovascular health among SWICOS participants. For some of the health metrics, the prevalence of ideal cardiovascular health might seem low, in particular for blood pressure, physical activity and diet. However, the cut-offs used for the differentiation of ideal vs intermediate of these three health metrics were rigorous. For example, the definition of ideal blood pressure was untreated blood pressure <120/80 mm Hg and the question arises whether this cut-off was not too low given the higher cut-offs for normal vs high blood pressure according to current guidelines [13]. Nevertheless, relevant proportions of participants had poor health metrics, which in our study was particularly true for blood pressure, total cholesterol, smoking and diet.
In comparison with a previous study from the United States, our study found ideal cardiovascular health more frequently and poor health metrics less often, except for smoking, which was less prevalent in the United States [3]. In comparison with another European study, our study found more favourable results for the four health behaviours, whereas health factors were comparable [4]. The reasons for these differences are not fully evident, but are probably differences in the age of the study population (e.g., the study population of the United States study was older than our study population), health prevention strategies (e.g., smoking prevention in the United States), access to the healthcare system (e.g., mandatory healthcare insurance for all Swiss inhabitants with nearly full coverage of expenses), and/or selection bias of more severely diseased participants in other studies, which did not recruit their participants on the population level [2–8].
Our study has implications. Although we found a favourable cardiovascular health status for a majority of the participants, relevant proportions of the participants showed poor cardiovascular health in one or more of the seven health metrics. Given the high relevance of poor cardiovascular health for cardiovascular events (e.g., myocardial infarction, stroke), loss of autonomy, disability and mortality, we see the need for further health prevention campaigns aimed at increasing awareness about cardiovascular health among the Swiss population. According to our analyses, older men with low educational status should constitute an important target population of such a campaign.
Our study has limitations. The data originated from two villages in Southern Switzerland, and the participants were not randomly selected. Therefore, we may not exclude a selection bias, and generalisability to the overall Swiss population might be limited. However, demographic data of the adult study population (e.g., age and sex distribution, prevalence of cardiovascular risk factors) were similar to the Swiss population according to Swiss federal statistics [14]. We therefore believe that the findings of this analysis are representative for the overall Swiss population.
In conclusion, we found favourable results for cardiovascular health in the population-based SWICOS cohort. Nevertheless, we see the need for further health prevention campaigns given the fact that relevant proportions of the participants might optimize their cardiovascular health by optimised blood pressure and cholesterol control, by stopping smoking, by increasing physical activity and by eating a healthier diet.
None of the authors has any conflict of interest relating to the submitted article.
The SHK “Stiftung für Herz- und Kreislaufkrankheiten” (Hergiswil, Switzerland) supported the study with an unrestricted grant.
1. Lloyd-Jones DM , Hong Y , Labarthe D , Mozaffarian D , Appel LJ , Van Horn L , et al.; American Heart Association Strategic Planning Task Force and Statistics Committee . Defining and setting national goals for cardiovascular health promotion and disease reduction: the American Heart Association’s strategic Impact Goal through 2020 and beyond. Circulation. 2010 Feb;121(4):586–613. https://doi.org/10.1161/CIRCULATIONAHA.109.192703
2. Medina-Inojosa JR , Vinciguerra M , Maugeri A , Kunzova S , Sochor O , Movsisyan N , et al. Prevalence of ideal cardiovascular health in a Central European community: results from the Kardiovize Brno 2030 Project. Eur J Prev Cardiol. 2020 Mar;27(4):441–3. https://doi.org/10.1177/2047487319834875
3. Bambs C , Kip KE , Dinga A , Mulukutla SR , Aiyer AN , Reis SE . Low prevalence of “ideal cardiovascular health” in a community-based population: the heart strategies concentrating on risk evaluation (Heart SCORE) study. Circulation. 2011 Mar;123(8):850–7. https://doi.org/10.1161/CIRCULATIONAHA.110.980151
4. Graciani A , León-Muñoz LM , Guallar-Castillón P , Rodríguez-Artalejo F , Banegas JR . Cardiovascular health in a southern Mediterranean European country: a nationwide population-based study. Circ Cardiovasc Qual Outcomes. 2013 Jan;6(1):90–8. https://doi.org/10.1161/CIRCOUTCOMES.112.967893
5. Ford ES , Greenlund KJ , Hong Y . Ideal cardiovascular health and mortality from all causes and diseases of the circulatory system among adults in the United States. Circulation. 2012 Feb;125(8):987–95. https://doi.org/10.1161/CIRCULATIONAHA.111.049122
6. Lachman S , Peters RJ , Lentjes MA , Mulligan AA , Luben RN , Wareham NJ , et al. Ideal cardiovascular health and risk of cardiovascular events in the EPIC-Norfolk prospective population study. Eur J Prev Cardiol. 2016 Jun;23(9):986–94. https://doi.org/10.1177/2047487315602015
7. Sabia S , Fayosse A , Dumurgier J , Schnitzler A , Empana JP , Ebmeier KP , et al. Association of ideal cardiovascular health at age 50 with incidence of dementia: 25 year follow-up of Whitehall II cohort study. BMJ. 2019 Aug;366:l4414. https://doi.org/10.1136/bmj.l4414
8. Rasmussen-Torvik LJ , Shay CM , Abramson JG , Friedrich CA , Nettleton JA , Prizment AE , et al. Ideal cardiovascular health is inversely associated with incident cancer: the Atherosclerosis Risk In Communities study. Circulation. 2013 Mar;127(12):1270–5. https://doi.org/10.1161/CIRCULATIONAHA.112.001183
9. Schoenenberger AW , Muggli F , Parati G , Gallino A , Ehret G , Suter PM , et al. Protocol of the Swiss Longitudinal Cohort Study (SWICOS) in rural Switzerland. BMJ Open. 2016 Nov;6(11):e013280. https://doi.org/10.1136/bmjopen-2016-013280
10. Richardson MT , Leon AS , Jacobs DR Jr , Ainsworth BE , Serfass R . Comprehensive evaluation of the Minnesota Leisure Time Physical Activity Questionnaire. J Clin Epidemiol. 1994 Mar;47(3):271–81. https://doi.org/10.1016/0895-4356(94)90008-6
11. National Center for Health Statistics . Plan and operation of the Third National Health and Nutrition Examination Survey, 1988-94. Series 1: programs and collection procedures. Vital Health Stat 1. 1994 Jul;1(32):1–407.
12. Monteiro CA , Cannon G , Levy RB , Moubarac JC , Louzada ML , Rauber F , et al. Ultra-processed foods: what they are and how to identify them. Public Health Nutr. 2019 Apr;22(5):936–41. https://doi.org/10.1017/S1368980018003762
13. Williams B , Mancia G , Spiering W , Agabiti Rosei E , Azizi M , Burnier M , et al.; ESC Scientific Document Group . 2018 ESC/ESH Guidelines for the management of arterial hypertension. Eur Heart J. 2018 Sep;39(33):3021–104. https://doi.org/10.1093/eurheartj/ehy339
14. Bundesamt für Statistik (BFS) . Schweizerische Gesundheitsbefragung 2017. BFS, Neuchâtel 2018.