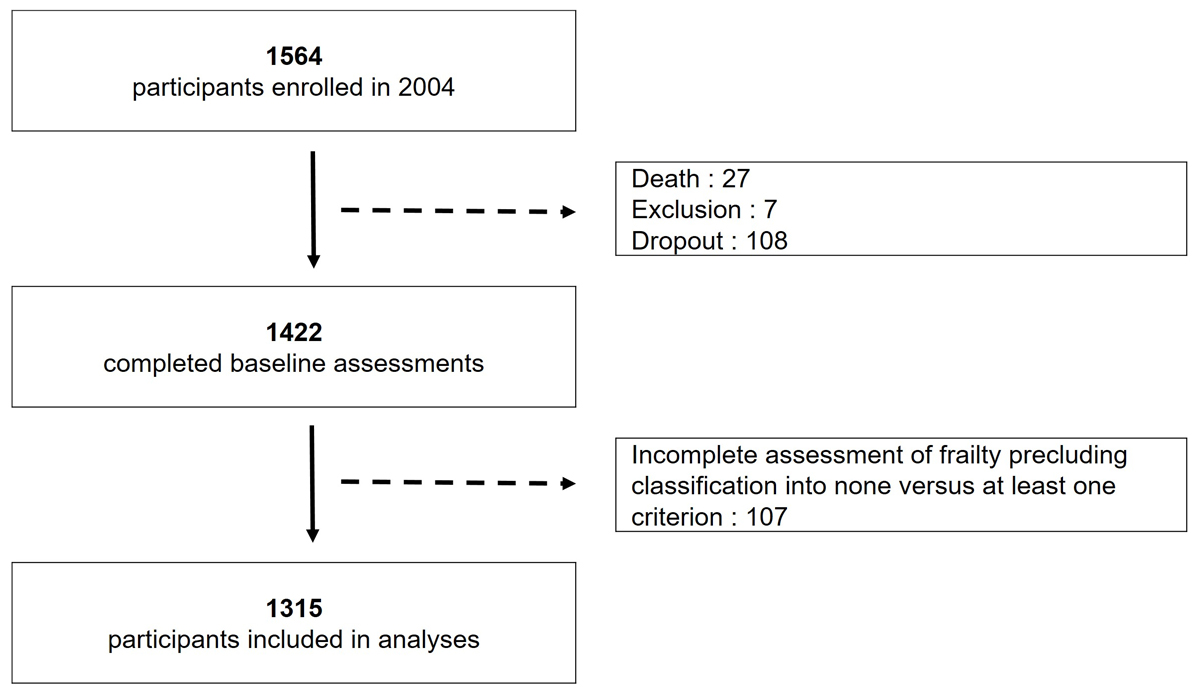
Figure 1 Study flowchart.
DOI: https://doi.org/10.4414/SMW.2021.w30042
Determining the biological age of older adults and the related risk of dying is a challenge for epidemiologists and for clinicians. The chronological age is an imperfect indicator of this risk since health in later life is highly heterogeneous. An approach based on single diseases is not satisfactory either, as coexistence of multiple chronic conditions is frequent in old age [1]. Comprehensive health indicators related to the risk of dying are needed to approximate the biological age of older individuals. Besides characteristics such as the level of comorbidity or functional dependency, the concept of frailty emerged in recent decades as an attempt to capture the loss of physiological reserve available to face stressful situations in old age. Amidst various measures proposed to assess frailty, the five dimensional phenotype described in 2001 by Fried et al. [2] has attracted particular attention. As described by Dent et al. [3], Fried’s frailty phenotype and Rockwood’s frailty index appear to be the two most common and robust assessment tools in epidemiological research. Fried’s phenotype relies on a clear conceptual model referring to the biology of the aging process [4], which explains its fast diffusion in the medical field. Older individuals classified as phenotypically frail have been found to be at significantly higher risk for a range of adverse health outcomes, including death. As the prevalence of a frail phenotype rises with age [5, 6], measuring frailty makes sense primarily as a component of routine geriatric assessments. Furthermore, frailty assessment is increasingly advocated in anaesthesiology, surgery or oncology to evaluate the mortality risk of exposure to stressful treatments at an advanced age [7–9]. Although more knowledge should still be acquired regarding effective interventions on frailty and its consequences in general [10, 11], an individually-tailored management of frail patients may address rehabilitation needs related to specific problems such as denutrition, sarcopenia or cognitive decline, both before and after invasive procedures.
However, the relevance of frailty assessments before the age of 75 is less clear. Several population-based studies reported low rates of frailty but also a high prevalence of pre-frailty in middle and early old age [12]. The significance of this observation deserves further research. On one hand, pre-frail individuals are more likely to return to a non-frail state than frail individuals, as shown in several studies of transitions [13]; therefore pre-frail individuals may be a particularly appropriate target for preventive action. On the other hand, because fulfilment of only one criterion of the Fried’s frailty phenotype is sufficient to classify individuals as pre-frail, the diagnosis of pre-frailty may be unstable and prone to measurement errors. The extent to which the frailty phenotype should be assessed before the age of 75 as an indicator of biological age and to target preventive actions depends on the capability of this phenotype to predict adverse outcomes such as death.
The aims of this study were to investigate the association between (pre-)frailty and mortality in a population of 66- to 71-year-old community-dwelling persons, to estimate the extent to which the frailty phenotype predicts short-term (0 to 4 years) and long-term (>4 to 14 years) mortality, and to consider sex differences.
The Lausanne cohort 65+ study (Lc65+) started in 2004 to investigate the natural history of frailty in the general population. It enrolled in 2004, 2009 and 2014 three successive samples of community-dwelling, 65 to 70 year old adults living in the city of Lausanne. Design, random selection of participants from the population register and data collection were previously described [14]. Briefly, all participants included in the cohort filled in an initial questionnaire sent during the recruitment year, collecting information on personal history and health. The following year they were invited to the study centre for a baseline interview and examination including anthropometric measurements, and physical and cognitive performance tests, and they completed a self-administered questionnaire mailed before the appointment. We used baseline data from the first sample of the Lc65+ cohort recruited in 2004 and assessed for frailty in 2005.
The study protocol and informed consent were approved by the Ethics committee for human research of the Canton of Vaud (19/04).
The five components of Fried’s frailty phenotype were evaluated at baseline with minimal adaptations [14]:
Low grip strength and slow walking were defined using Fried et al. reference cut-off values observed in the Cardiovascular Health Study [2]. Individuals were classified according to the number of frailty criteria fulfilled and categorised into non-frail (0 criterion), pre-frail (1–2 criteria) and frail (3 criteria).
Deaths were recorded over a 14-year follow-up period starting from the 2005 baseline frailty assessment and validated by consultation of the Canton of Vaud population registry. As this registry did not provide information on the vital status of drop-out participants who moved outside the Canton of Vaud, their follow-up was censored at the date of move or last direct contact.
Covariates for adjustment included demographics (age at inclusion, sex), socioeconomic and health characteristics reported at inclusion. Education was defined by the highest completed level and categorised into basic compulsory, apprenticeship and post-compulsory schooling (including baccalaureate, technical and professional schools, and university). Financial difficulties were defined by a positive answer to the question “Do you sometimes have trouble making ends meet?”; missing responses were imputed based on benefit of means-tested subsidies reported in the initial questionnaire. Living alone was defined by the response “zero” to the question “How many people do you currently live with?”. Depressive feelings were defined by a positive response to either of the following two questions: “During the past month, have you often been bothered by (1) feeling down, depressed, or hopeless? (2) little interest in doing things?” [15]. The number of chronic diseases was based on a list of 11 diagnoses: hypertension, coronary heart disease, other heart disease, stroke, diabetes mellitus, chronic respiratory disease, osteoporosis, arthritis, cancer, ulcer and Parkinson’s disease. Impaired basic activities of daily living were defined by reported difficulties or help received during the past 4 weeks in any of five activities: showering or bathing, dressing, transferring from bed or chair, using toilets, and eating, both at recruitment and in the following year.
Descriptive statistics compared the baseline profile of survivors and dead participants at the end of the observation period using chi2 tests for nominal variables and Student’s t-test for the variable age.
Mortality analyses explored the effect of a dichotomised frailty explanatory variable separating individuals fulfilling at least one frailty criterion (i.e., pre-frail of frail phenotype) or none (non-frail), overall and by sex. We computed mortality rates, expressed as the number of deaths per 1000 people per year, using the stptime command in Stata, and analysed the effect of frailty on survival. The evolution of mortality was first illustrated by Kaplan-Meier unadjusted survival curves. The association between frailty and the mortality outcome was analysed in Cox regression models. The proportionality assumption was tested and validated first graphically and then including time-dependent covariates in the model (tvc option in Stata), defined as an interaction term between each variable in the model and the logarithm of time. As the assumption of proportionality of risk was not satisfied in the 0 to 14 years follow-up, we used time-split Cox proportional hazards models that enable varying hazard ratios (HRs) within multiple time intervals to be estimated. Log-log plots according to the frailty status were used to determine a time cut-off for sub-analyses of early (0 to 4 years) and later (>4 to 14 years) mortality risk. Model 1 controlled the confounding effect of age at baseline. Model 2 adjusted for age and socioeconomic covariates (education, financial difficulties and living alone). Model 3 controlled age, socio-economic and health covariates (depressive feelings, number of chronic diseases and impairment in basic activities of daily living). The predictive capability of multivariable Cox models was evaluated using Harrell’s C index, a value of 0.5 indicating no predictive discrimination and a value of 1.0 indicating perfect discrimination [16]. P-values <0.05 were considered as statistically significant. All analyses were conducted using Stata 16.1 software.
Among 1564 persons enrolled in 2004 in the Lc65+ study, 27 died in the following months, 108 filled only the recruitment questionnaire and 7 were excluded from the baseline data collection (5 cases of severe cognitive impairment, 2 end-of-life situations), leaving a sample of 1422 individuals for frailty assessment in 2005. The final study sample included 1315 subjects who could be classified as fulfilling none (non-frail) versus at least one (pre-frail or frail) of the five phenotype criteria (fig.1). The vital status at 14 years could be ascertained for all but 23 drop-out participants who left the study area during the follow-up period and whose observation was therefore truncated at their last participation.
Figure 1 Study flowchart.
Baseline characteristics of the 1315 participants included in analyses are presented in table 1. Mean age at frailty assessment was 69.1 years (standard deviation [SD] 1.4) and females made 59.0% of the study sample. Overall, 914 (69.5%) participants could be classified as non-frail, whereas 401 (30.5%) were pre-frail or frail: 336 (25.6%) pre-frail, 35 (2.7%) frail, and 30 (2.3%) participants who could not be assessed on all five dimensions but who fulfilled at least one criterion of frailty.
A total of 336 (25.6%) persons died over the study period. The mean ± SD follow-up duration was 12.5 ± 3.1 years and the median was 14.0 years. As shown in table 1, the baseline profile of survivors and participants who died during the 14-year follow-up period was significantly different in almost all characteristics. The deceased persons were only slightly, but significantly, older at baseline (69.3 vs 69.0 years, p = 0.001). They were more frequently male (49.4% vs 38.1%, p <0.001), had a lower educational level (70.4% vs 62.6% with basic compulsory or apprenticeship, p =0.030), more often lived alone (41.0% vs 33.3%, p = 0.011), expressed depressive feelings (31.3% vs 23.9%, p = 0.006), had comorbidities (47.6% vs 37.6% with two or more comorbidities, p <0.001) and reported functional difficulties (8.6% vs 3.2%, p <0.001). The prevalence of (pre-)frailty and of each criterion of the frailty phenotype was significantly higher among the deceased (44.9% vs 25.5% pre-frail or frail, p <0.001).
Table 1Baseline characteristics according to vital status at the end of the follow-up.
| N | Alive (n = 979) | Deceased (n = 336) | Total | p-value a | |
| Age (years), mean ± SD | 1315 | 69.0 ± 1.4 | 69.3 ± 1.5 | 69.1 ± 1.4 | 0.001 |
| Sex, females, n (%) | 1315 | 606 (61.9) | 170 (50.6) | 776 (59.0) | <0.001 |
| Educationb, n (%) | |||||
| – Basic compulsory | 1308 | 233 (23.9) | 96 (28.7) | 329 (25.2) | 0.030 |
| – Apprenticeship | 377 (38.7) | 139 (41.6) | 516 (39.4) | ||
| – Post-compulsory schooling | 364 (37.4) | 99 (29.6) | 463 (35.4) | ||
| Financial difficulties, n (%) | 1309 | 115 (11.8) | 52 (15.6) | 167 (12.8) | 0.070 |
| Living alone,b n (%) | 1312 | 326 (33.3) | 137 (41.0) | 463 (35.3) | 0.011 |
| Depressive feelings,b n (%) | 1294 | 228 (23.9) | 102 (31.3) | 330 (25.5) | 0.006 |
| Chronic diseasesa, b, n (%) | |||||
| – None | 1310 | 261 (26.7) | 58 (17.4) | 319 (24.4) | <0.001 |
| – 1 disease | 348 (35.7) | 117 (35.0) | 465 (35.5) | ||
| – 2+ diseases | 367 (37.6) | 159 (47.6) | 526 (40.2) | ||
| Basic ADL impairment, n (%) | 1313 | 31 (3.2) | 29 (8.6) | 60 (4.6) | <0.001 |
| Frailty phenotype, n (%) | |||||
| – Non-frail (0 criterion) | 1315 | 729 (74.5) | 185 (55.1) | 914 (69.5) | <0.001 |
| – Pre-frail or frail (1 or more criteria) | 250 (25.5) | 151 (44.9) | 401 (30.5) | ||
| Frailty, criteria, n (%) | |||||
| – Shrinking | 1314 | 65 (6.6) | 61 (18.2) | 126 (9.6) | <0.001 |
| – Exhaustion | 1315 | 51 (5.2) | 40 (11.9) | 91 (6.9) | <0.001 |
| – Low physical activity | 1298 | 62 (6.4) | 49 (15.0) | 111 (8.6) | <0.001 |
| – Muscle weakness | 1289 | 127 (13.1) | 62 (19.3) | 189 (14.7) | 0.007 |
| – Slowness | 1285 | 20 (2.1) | 27 (8.4) | 47 (3.7) | <0.001 |
ADL = activities of daily living; SD = standard deviation
a From chi2 test for nominal variables and Student’s t-test for variable age.
b From postal questionnaire 2004
c Among a list of 11 diagnoses: hypertension, coronary heart disease, other heart diseases, stroke, diabetes mellitus, chronic respiratory disease, osteoporosis, arthritis, cancer, ulcer, Parkinson’s disease
Overall, mortality amounted to 20.4/1000 person-years (95% confidence interval [CI] 18.3–22.7). It was higher in males (25.3/1000, 95% CI 21.8–29.5) than in females (17.2/1000, 95% CI 14.8–19.9; p <0.001). Kaplan-Meier survival curves (fig 2) illustrate the significant effect of fulfilling at least one phenotype criterion on mortality both in males and in females.
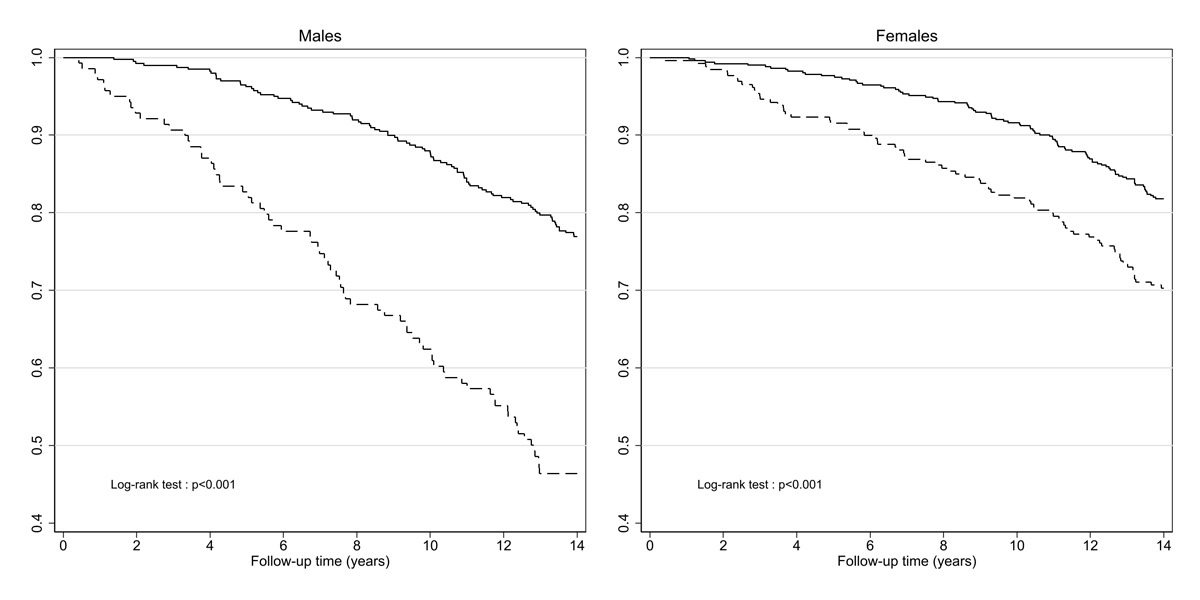
Figure 2 Kaplan-Meier survival curves according to the frailty phenotype at baseline, by sex.
Continuous line: non-frail, dotted line: pre-frail or frail
The level of mortality among non-frail participants (overall 15.6/1000, 95% CI 13.5–18.0) was slightly, but not significantly higher in males (18.0/1000, 95% CI 14.6–22.0 versus 13.8/1000, 95% CI 11.3–16.9 in females; p = 0.074). Mortality among pre-frail or frail participants (overall rate 32.8/1000, 95% CI 28.0–38.5) was significantly higher in males (51.8/1000, 95% CI 41.2–65.1 versus 24.3/1000, 95% CI 19.4–30.4 in females; p <0.001).
In males, the short-term effect on mortality of fulfilling at least one criterion of the frailty phenotype was significant when adjusted for age only (adjusted hazard ratio [aHR] at 4 years 8.0, 95% CI 3.3–19.2; p <0.001), for age and socioeconomic characteristics (aHR 7.0, 95% CI 2.8–17.2; p <0.001) and for age, socioeconomic characteristics and health at baseline (aHR 5.2, 95% CI 2.0–13.8; p = 0.001). The Harrell’s C statistic of models 1 to 3 ranged from 0.74 to 0.79 (table 2), indicating an acceptable discrimination. The effect on mortality over years 4 to 14 was lower but still significant, with aHRs between 2.6 (95% CI 1.9–3.6; p <0.001; model 1) and 2.3 (95% CI 1.6–3.3; p <0.001; model 3). The Harrell’s C index ranged between 0.61 (model 1) and 0.67 (model 3).
In females, the short-term effect on mortality of fulfilling at least one criterion of the frailty phenotype was weaker than in males but it was significant in the three models (aHR 4.9, 95% CI 2.2–10.9; p <0.001; aHR 4.9, 95% CI 2.2–11.0; p <0.001 and aHR 3.5, 95% CI 1.5–8.1; p = 0.004, respectively). Harrell’s C ranged from 0.69 to 0.75. However, the effect of pre-frailty or frailty on later mortality was not significant with aHRs between 1.4 (95% CI 1.0–1.9; p = 0.088, model 1) and 1.1 (95% CI 0.8–1.6; p = 0.574, model 3).
Table 2Adjusted effect of pre-frailty or frailty at age 66 to 71 on mortality, by sex and follow-up period, Cox regression models.
| Model 1 a | Model 2 b | Model 3 c | |||||
| MALES | |||||||
| 0 to 4 years | |||||||
| Observations/events | 539 | 25 | 532 | 24 | 522 | 23 | |
| HR (95% CI) | Non-frail (ref.) | 1.00 | 1.00 | 1.00 | |||
| Pre-frail or frail | 8.00*** | (3.33–19.22) | 6.95*** | (2.82–17.18) | 5.20** | (1.95–13.84) | |
| Harrell’s C | 0.74 (0.63–0.85) | 0.77 (0.67–0.87) | 0.79 (0.70–0.89) | ||||
| >4 to 14 years | |||||||
| Observations/events | 512 | 141 | 506 | 138 | 497 | 133 | |
| HR (95% CI) | Non-frail (ref.) | 1.00 | 1.00 | 1.00 | |||
| Pre-frail or frail | 2.59*** | (1.85–3.64) | 2.39*** | (1.69–3.40) | 2.26*** | (1.55–3.29) | |
| Harrell’s C | 0.61 (0.56–0.66) | 0.65 (0.60–0.70) | 0.67 (0.62–0.71) | ||||
| FEMALES | |||||||
| 0 to 4 years | |||||||
| Observations/events | 776 | 29 | 767 | 29 | 750 | 27 | |
| HR (95% CI) | Non-frail (ref.) | 1.00 | 1.00 | 1.00 | |||
| Pre-frail or frail | 4.87*** | (2.18–10.86) | 4.90*** | (2.19–10.96) | 3.47** | (1.48–8.14) | |
| Harrell’s C | 0.69 (0.58–0.80) | 0.73 (0.63–0.82) | 0.75 (0.65–0.84) | ||||
| > 4 to 14 years | |||||||
| Observations/events | 743 | 141 | 734 | 138 | 719 | 135 | |
| HR (95% CI) | Non-frail (ref.) | 1.00 | 1.00 | 1.00 | |||
| Pre-frail or frail | 1.35 | (0.96–1.90) | 1.27 | (0.90–1.81) | 1.11 | (0.77–1.61) | |
| Harrell’s C | 0.59 (0.54–0.64) | 0.61 (0.56–0.66) | 0.63 (0.58–0.68) | ||||
CI: confidence interval; HR: Hazard ratio
*** p <0.001, ** p <0.01
a adjusted for age at baseline;
b adjusted for: model 1 + living alone, education and financial difficulties at baseline;
c adjusted for: model 2 + depressive feelings, chronic diseases, and impairment in basic activities of daily living reported at baseline
Our study points to a significant association between pre-frailty or frailty at the age of 66 to 71 years in community-dwellers and the risk of dying in the following 14 years. (Pre-)frailty had a significant relationship with mortality in males and in females, particularly during the first 4 years of the follow-up. Models adjusting the effect of (pre-)frailty for age only were predictive of short-term mortality, suggesting that it is a useful indicator of biological age. Further adjustment for socioeconomic and health characteristics slightly improved the prediction. The control of covariates attenuated the effect on short-term mortality of fulfilling at least one criterion of the frailty phenotype, owing to the known association of frailty with comorbidities, depression and socioeconomic determinants of health, but also revealed the independent effect of the phenotype.
Our results highlight important sex and period contrasts. We recorded a higher mortality in males over the whole study period. However, our subgroup analysis found that among individuals who were non-frail at baseline males and females did not have a significantly different risk of dying. The excess mortality of males was observed in our study selectively in the (pre-)frail subgroup. To our knowledge, previous studies did not report on the sex-specific risk of dying within subgroups defined by the frailty phenotype.
The association of frailty with the short-term mortality was found in both sexes, but it was stronger in males. Previous studies of sex differences in the effect of the frailty phenotype on mortality produced inconsistent results. One meta-analysis [17] and some later studies [18–21] reported a stronger effect of frailty on the risk of death in males, whereas another, recent meta-analysis found a similar effect of the frailty phenotype on mortality in both sexes [22]. A more deleterious effect of frailty in males may explain the so-called frailty paradox [23] of a higher prevalence of frailty in females and a higher mortality in males.
Relationships between the frailty phenotype and the risk of death were not constant over time. Beyond 4 years, the effect on mortality of fulfilling at least one frailty criterion at baseline was weaker, but still significant in males. It vanished and lost significance in females. A lower influence of the baseline frailty phenotype on long-term mortality and a decreasing predictive capability with increasing follow-up have been observed in other populations [24, 25]. They may result from the dynamic nature of frailty and were expected, as the evolution of frailty is characterised by frequent transitions between levels of the phenotype [13, 26]. Thompson et al. [24] noted that recurrent measurement of the frailty phenotype improves the prediction of death.
This study has some limitations. It was performed in a population of a narrow age range and results should not be extrapolated to older populations. Von Renteln-Kruse et al. [20] described an effect of frailty on mortality stronger in females, and weaker in males, beyond the age of 70. Turusheva et al. [27] found a significant relationship only in the oldest subgroup. However, other studies [28, 29] and a meta-analysis [17] did not find a significant effect of age on the relationship between the frailty phenotype and the risk of dying. Another limitation of our study, also related to the age range of our study population, was the low prevalence of frailty among sexagenarians. As a consequence we grouped pre-frail and frail individuals in one single category, as did other authors [29, 30]. In several studies including older individuals, the effect of frailty on mortality was stronger than the effect of pre-frailty [19, 31–37]. Finally, our results were limited to the relationship between Fried’s frailty phenotype and mortality, and could be different with other definitions of frailty.
The observation of one or more frailty criteria in sexagenarians is predictive of death, particularly in the following 4 years. This suggests the appropriateness of a systematic assessment of the frailty phenotype in both sexes to adapt medical interventions to the individual needs.
The authors declare no conflict of interest.
The Lc65+ study has been supported by the University of Lausanne Centre for Primary Care and Public Health (Unisanté); University of Lausanne Hospital Centre; Canton de Vaud Department of Public Health; City of Lausanne; Loterie Romande [research grants 2006-2008 and 2018-2019]; Lausanne University Faculty of Biology and Medicine [multidisciplinary research grant 2006]; Swiss National Foundation for Scientific Research [grant 3247B0-120795/1]; and Fondation Médecine Sociale et Préventive, Lausanne. The sponsors had no role in the design, execution, analysis and interpretation of data, or writing of the study.
We are deeply grateful to all Lc65+ participants and to the team members involved in data collection, registration and management.
1. World Health Organization . Decade of healthy ageing: baseline report. Geneva, Switzerland, 2020
2. Fried LP , Tangen CM , Walston J , Newman AB , Hirsch C , Gottdiener J , et al.; Cardiovascular Health Study Collaborative Research Group . Frailty in older adults: evidence for a phenotype. J Gerontol A Biol Sci Med Sci. 2001 Mar;56(3):M146–56. https://doi.org/10.1093/gerona/56.3.M146
3. Dent E , Kowal P , Hoogendijk EO . Frailty measurement in research and clinical practice: a review. Eur J Intern Med. 2016 Jun;31:3–10. https://doi.org/10.1016/j.ejim.2016.03.007
4. Walston JD , Bandeen-Roche K . Frailty: a tale of two concepts. BMC Med. 2015 Aug;13(1):185. https://doi.org/10.1186/s12916-015-0420-6
5. Collard RM , Boter H , Schoevers RA , Oude Voshaar RC . Prevalence of frailty in community-dwelling older persons: a systematic review. J Am Geriatr Soc. 2012 Aug;60(8):1487–92. https://doi.org/10.1111/j.1532-5415.2012.04054.x
6. O’Caoimh R , Sezgin D , O’Donovan MR , Molloy DW , Clegg A , Rockwood K , et al. Prevalence of frailty in 62 countries across the world: a systematic review and meta-analysis of population-level studies. Age Ageing. 2021 Jan;50(1):96–104. https://doi.org/10.1093/ageing/afaa219
7. Boakye D , Rillmann B , Walter V , Jansen L , Hoffmeister M , Brenner H . Impact of comorbidity and frailty on prognosis in colorectal cancer patients: a systematic review and meta-analysis. Cancer Treat Rev. 2018 Mar;64:30–9. https://doi.org/10.1016/j.ctrv.2018.02.003
8. Houghton JS , Nickinson AT , Morton AJ , Nduwayo S , Pepper CJ , Rayt HS , et al. Frailty factors and outcomes in vascular surgery patients: a systematic review and meta-analysis. Ann Surg. 2020 Aug;272(2):266–76. https://doi.org/10.1097/SLA.0000000000003642
9. Tjeertes EK , van Fessem JM , Mattace-Raso FU , Hoofwijk AG , Stolker RJ , Hoeks SE . Influence of frailty on outcome in older patients undergoing non cardiac surgery - a systematic review and meta-analysis. Aging Dis. 2020 Oct;11(5):1276–90. https://doi.org/10.14336/AD.2019.1024
10. Dent E , Martin FC , Bergman H , Woo J , Romero-Ortuno R , Walston JD . Management of frailty: opportunities, challenges, and future directions. Lancet. 2019 Oct;394(10206):1376–86. https://doi.org/10.1016/S0140-6736(19)31785-4
11. Walston J , Buta B , Xue QL . Frailty screening and interventions: considerations for clinical practice. Clin Geriatr Med. 2018 Feb;34(1):25–38. https://doi.org/10.1016/j.cger.2017.09.004
12. Santos-Eggimann B , Cuénoud P , Spagnoli J , Junod J . Prevalence of frailty in middle-aged and older community-dwelling Europeans living in 10 countries. J Gerontol A Biol Sci Med Sci. 2009 Jun;64(6):675–81. https://doi.org/10.1093/gerona/glp012
13. Kojima G , Taniguchi Y , Iliffe S , Jivraj S , Walters K . Transitions between frailty states among community-dwelling older people: a systematic review and meta-analysis. Ageing Res Rev. 2019 Mar;50:81–8. https://doi.org/10.1016/j.arr.2019.01.010
14. Santos-Eggimann B , Karmaniola A , Seematter-Bagnoud L , Spagnoli J , Büla C , Cornuz J , et al. The Lausanne cohort Lc65+: a population-based prospective study of the manifestations, determinants and outcomes of frailty. BMC Geriatr. 2008 Aug;8(1):20. https://doi.org/10.1186/1471-2318-8-20
15. Whooley MA , Avins AL , Miranda J , Browner WS . Case-finding instruments for depression. Two questions are as good as many. J Gen Intern Med. 1997 Jul;12(7):439–45. https://doi.org/10.1046/j.1525-1497.1997.00076.x
16. Harrell FE Jr , Lee KL , Mark DB . Multivariable prognostic models: issues in developing models, evaluating assumptions and adequacy, and measuring and reducing errors. Stat Med. 1996 Feb;15(4):361–87. https://doi.org/10.1002/(SICI)1097-0258(19960229)15:4<361:AID-SIM168>3.0.CO;2-4 https://doi.org/10.1002/(SICI)1097-0258(19960229)15:4<361::AID-SIM168>3.0.CO;2-4
17. Chang SF , Lin PL . Frail phenotype and mortality prediction: a systematic review and meta-analysis of prospective cohort studies. Int J Nurs Stud. 2015 Aug;52(8):1362–74. https://doi.org/10.1016/j.ijnurstu.2015.04.005
18. Ding YY . Predictive validity of two physical frailty phenotype specifications developed for investigation of frailty pathways in older people. Gerontology. 2017;63(5):401–10. https://doi.org/10.1159/000471803
19. Langholz PL , Strand BH , Cook S , Hopstock LA . Frailty phenotype and its association with all-cause mortality in community-dwelling Norwegian women and men aged 70 years and older: the Tromsø Study 2001-2016. Geriatr Gerontol Int. 2018 Aug;18(8):1200–5. https://doi.org/10.1111/ggi.13447
20. von Renteln-Kruse W , Minder CE . It is time to detect preclinical signs of incipient frailty. J Am Geriatr Soc. 2016 Oct;64(10):2166–7. https://doi.org/10.1111/jgs.14419
21. Zasadzka E , Trzmiel T , Roszak M , Pawlaczyk M . Is the outcome of frailty syndrome gender dependent? J Women Aging. 2020 May-Jun;32(3):349–60. https://doi.org/10.1080/08952841.2019.1593797
22. Fan Y , Huang J , Zhou Y , Gu X , Gong D . Does the impact of frailty on all-cause mortality in older persons differ between women and men? A meta-analysis. J Am Med Dir Assoc. 2021 Mar;22(3):606.e1–6. https://doi.org/10.1016/j.jamda.2020.05.059
23. Gordon EH , Hubbard RE . Do sex differences in chronic disease underpin the sex-frailty paradox? Mech Ageing Dev. 2019 Apr;179:44–50. https://doi.org/10.1016/j.mad.2019.02.004
24. Thompson MQ , Theou O , Tucker GR , Adams RJ , Visvanathan R . Recurrent measurement of frailty is important for mortality prediction: findings from the North West Adelaide Health Study. J Am Geriatr Soc. 2019 Nov;67(11):2311–7. https://doi.org/10.1111/jgs.16066
25. Zucchelli A , Vetrano DL , Marengoni A , Grande G , Romanelli G , Calderón-Larrañaga A , et al. Frailty predicts short-term survival even in older adults without multimorbidity. Eur J Intern Med. 2018 Oct;56:53–6. https://doi.org/10.1016/j.ejim.2018.06.012
26. Gill TM , Gahbauer EA , Allore HG , Han L . Transitions between frailty states among community-living older persons. Arch Intern Med. 2006 Feb;166(4):418–23. https://doi.org/10.1001/archinte.166.4.418
27. Turusheva A , Frolova E , Korystina E , Zelenukha D , Tadjibaev P , Gurina N , et al. Do commonly used frailty models predict mortality, loss of autonomy and mental decline in older adults in northwestern Russia? A prospective cohort study. BMC Geriatr. 2016 May;16(1):98. https://doi.org/10.1186/s12877-016-0276-4
28. Hanlon P , Nicholl BI , Jani BD , Lee D , McQueenie R , Mair FS . Frailty and pre-frailty in middle-aged and older adults and its association with multimorbidity and mortality: a prospective analysis of 493 737 UK Biobank participants. Lancet Public Health. 2018 Jul;3(7):e323–32. https://doi.org/10.1016/S2468-2667(18)30091-4
29. Kusumastuti S , Gerds TA , Lund R , Mortensen EL , Westendorp RG . Discrimination ability of comorbidity, frailty, and subjective health to predict mortality in community-dwelling older people: population based prospective cohort study. Eur J Intern Med. 2017 Jul;42:29–38. https://doi.org/10.1016/j.ejim.2017.05.016
30. Gonzalez-Colaço Harmand M , Meillon C , Bergua V , Tabue Teguo M , Dartigues JF , Avila-Funes JA , et al. Comparing the predictive value of three definitions of frailty: results from the Three-City study. Arch Gerontol Geriatr. 2017 Sep;72:153–63. https://doi.org/10.1016/j.archger.2017.06.005
31. Grabovac I , Haider S , Mogg C , Majewska B , Drgac D , Oberndorfer M , et al. Frailty status predicts all-cause and cause-specific mortality in community dwelling older adults. J Am Med Dir Assoc. 2019 Oct;20(10):1230–1235.e2. https://doi.org/10.1016/j.jamda.2019.06.007
32. Graham JE , Snih SA , Berges IM , Ray LA , Markides KS , Ottenbacher KJ . Frailty and 10-year mortality in community-living Mexican American older adults. Gerontology. 2009;55(6):644–51. https://doi.org/10.1159/000235653
33. Lohman MC , Sonnega AJ , Resciniti NV , Leggett AN . Frailty phenotype and cause-specific mortality in the United States. J Gerontol A Biol Sci Med Sci. 2020 Sep;75(10):1935–42. https://doi.org/10.1093/gerona/glaa025
34. Papachristou E , Wannamethee SG , Lennon LT , Papacosta O , Whincup PH , Iliffe S , et al. <div>Ability of self-reported frailty components to predict incident disability, falls, and all-cause mortality: results from a population-based study of older British men</div><div></div>. J Am Med Dir Assoc. 2017 Feb;18(2):152–7. https://doi.org/10.1016/j.jamda.2016.08.020
35. Pereira AA , Borim FS , Aprahamian I , Neri AL . Comparison of two models of frailty for the prediction of mortality in Brazilian community-dwelling older adults: the FIBRA study. J Nutr Health Aging. 2019;23(10):1004–10. https://doi.org/10.1007/s12603-019-1264-0
36. Ravindrarajah R , Lee DM , Pye SR , Gielen E , Boonen S , Vanderschueren D , et al.; European Male Aging Study Group . The ability of three different models of frailty to predict all-cause mortality: results from the European Male Aging Study (EMAS). Arch Gerontol Geriatr. 2013 Nov-Dec;57(3):360–8. https://doi.org/10.1016/j.archger.2013.06.010
37. Shi GP , Ma T , Zhu YS , Wang ZD , Chu XF , Wang Y , et al. Frailty phenotype, frailty index and risk of mortality in Chinese elderly population- Rugao longevity and ageing study. Arch Gerontol Geriatr. 2019 Jan - Feb;80:115–9. https://doi.org/10.1016/j.archger.2018.11.001