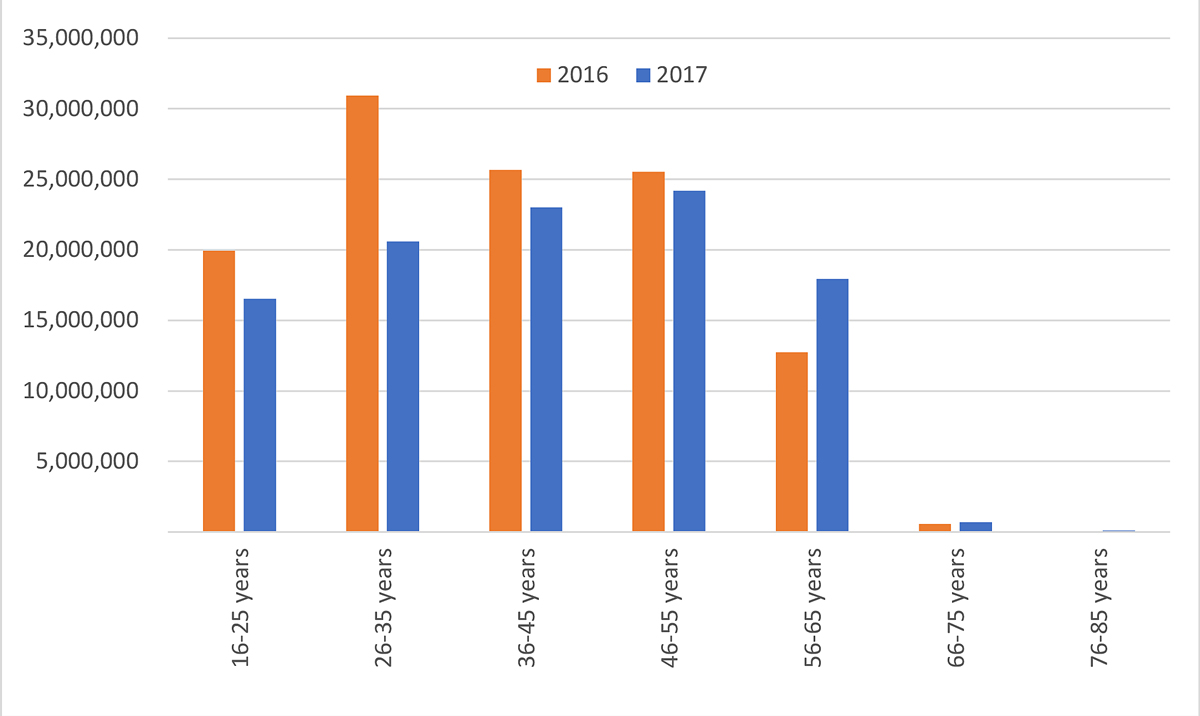
Figure 1 Estimated total costs by age class in 2016 and 2017 (in CHF).
DOI: https://doi.org/10.4414/SMW.2021.w30022
Seasonal influenza and influenza-like illnesses are characterised by numerous symptoms, including sudden onset of fever, chills, cough, shortness of breath, sore throat, fatigue, runny or stuffy nose, muscle and joint pain or headache [1]. Influenza viruses result in near-yearly epidemics, which are of variable intensity and severity [2–7].
Influenza and influenza-like illnesses are usually self-limiting diseases with a recovery period of 3–7 days. Nevertheless, every year many persons require medical advice or hospitalisation [8,9]. In Switzerland, it has been previously estimated that influenza-like illnesses lead to 112,000–275,000 medical consultations and several thousands of hospitalisations annually [10].
Vaccination is generally considered the most effective means to prevent infection, complications and mortality related to influenza. For many years the World Health Organization (WHO) has recommended vaccination for all people at high risk [11]. In Switzerland, vaccination is currently highly recommended for people aged 65 and above, pregnant women, children born prematurely up to 2 years of age and persons with chronic diseases. Moreover, to better protect these persons, everyone in regular contact with them (e.g., family members or caregivers) should be vaccinated [10]. Despite these recommendations, vaccination coverage among high-risk groups in most European countries is still far from the WHO goal of 75% [12,13]. In Switzerland, vaccination coverage among older people has been estimated to have been approximatively 30% in 2014/15 and 32% in 2016/2017 and 2017/2018 [13–16].
Because of their high incidence, influenza and influenza-like illnesses are expected to represent a high economic burden. For example, the costs of seasonal influenza in 2015 in the US have been estimated at USD 11.2 billion: USD 3.2 billion (29% of the total costs) were direct medical costs and USD 8.0 billion indirect costs (71% of the total costs) [9]. In a German study including 17,836 adults managed by primary care physicians, the total average mean cost per episode was EUR 514, and the costs of workdays lost were the main cost driver (82% of the total costs) [8]. There are currently no comparable Swiss data.
The aim of this project was to assess the costs of lost productivity due to influenza and influenza-like illnesses in Switzerland. This included an estimation of the total number of cases of inability to work, days off work and the respective costs according to year, sex, age and region. Additional analyses investigated whether the duration of inability to work might be affected by factors such as influenza testing results (i.e., confirmed true influenza), vaccination status, increased risk of complications, acute start of disease, and symptoms.
This analysis of data collected though the Swiss Sentinel Surveillance Network system does not require ethics approval under the Swiss Human Research Act ("Humanforschungsgesetz").
The main source for the estimation of the number of cases and duration of the inability to work due to influenza and influenza-like illnesses in Switzerland was the Swiss Sentinel Surveillance Network of the SFOPH [17]. The Swiss Sentinel Surveillance Network is a network of 150 to 250 general practitioners and paediatricians that was founded in 1986 to survey communicable diseases in Switzerland. The dataset consisted of 3971 cases with symptoms of influenza-like illness reported in 2016 and 2017. Influenza-like illnesses included illnesses with a usually sudden onset of high fever above 38°C and cough or sore throat, as well as secondary illnesses (pneumonia, bronchitis, otitis, etc.) after influenza, not yet reported as the initial illness.
The main variables covered details on the physicians collecting the data, patients’ characteristics, symptoms, treatments, and inability to work (in terms of workdays lost). More details on the information collected by the Swiss Sentinel Surveillance Network is provided as supplementary material (table S1 in the appendix). The duration of the inability to work was collected through the certificate of incapacity for work or an estimation of the work loss (if no certificate was issued) provided by the treating physicians. Days of vacation, weekends, public holidays and part-time-related non-working days were included in the estimations. This means that a patient visiting on a Friday and reporting five workdays lost may effectively have lost “only” three days (assuming that he/she was not working during the weekend). To adjust the estimated number of workdays lost we took into consideration the weekdays in which the patients visited their physicians: if the reported number of workdays lost overlapped with one (or more) weekend(s), the total number of workdays lost was reduced accordingly (e.g., by two if a complete weekend was included). The weekday was reported for only 626 out of 3971 cases. For those with missing date information we applied the same proportion as found in the known cases (i.e., we applied the proportion calculated by dividing, for the 626 known cases, the number of adjusted workdays lost by the reported workdays lost).
The estimation of the duration of the inability to work also considered the degree of employment (0–100%) of the patients. The loss of productivity of a full-time employee losing one single workday was considered equal to the loss of a half-time employee losing two workdays. For patients reporting a part-time occupation we assumed that the work was equally distributed during a normal working week.
The participating physicians were asked to distinguish whether the included patients were unable to work because they were sick themselves, because they were caring for other family members, or both. For patients indicating that they were sick themselves and also had to care for a sick family member it was possible to provide two numbers (one indicating the days of self-sickness, the other indicating the days spent in caregiving). In most cases, the reported numbers were identical, whereas in other cases the period of self-sickness was longer than the period for caregiving. For the present analysis we always considered the highest reported number only, assuming that the periods of self-sickness and caregiving were overlapping.
The duration of the inability to work was estimated for the whole country as well as for subgroups of the population defined by region, sex and age group. The resulting duration estimates were multiplied by the estimated number of cases of inability to work. The six Sentinel regions are the cantons Genève, Neuchâtel, Vaud and Valais (Southwest), Bern, Fribourg and Jura (Midwest), Aargau, Basel-Landschaft, Basel-Stadt, Solothurn (Northwest), Luzern, Obwalden, Nidwalden, Uri, Schwyz und Zug (Central), Appenzell Innerrhoden, Appenzell Ausserrhoden, Glarus, Sankt Gallen, Schaffhausen, Thurgau und Zürich (Northeast), and Graubünden and Ticino (Southeast).
Extrapolation to the national level was performed with adjustment for the size of the Swiss population, age, sex, regional distribution, number of Sentinel general physician contacts and specialisation of the physician. The data for adjustment were provided by the SFOPH.
The costs of lost productivity were calculated using the human capital approach, which assumes that patients who are absent from work due to symptoms of influenza-like illness are not available for paid work and not replaced [18,19]. Under this approach, the cost of lost productivity was calculated as the number of workdays lost due to influenza-like illnesses multiplied by the mean salary for one working day. Other causes of lost productivity (e.g., early retirement, premature death) were not considered as they could not be assessed based on the data source used.
Mean salaries per working day were calculated with consideration of differences between sex, age, and region. Main sources were monthly gross salary data for 2016 published by the Swiss Federal Statistical Office, as Swiss salaries per month for 2017 were not available [20]. Monthly gross salaries included employee contributions for social insurance, regularly paid bonuses/revenues/compensations shares, compensation for shift/night/Sunday work, 1/12 of the 13th month’s salary, and 1/12 of the annual special payments, whereas family and child allowances were not taken into account. Monthly salaries according to sex, age group and region were multiplied by 12 to achieve yearly salaries. On the assumption of 220 working days per year for a fully employed person, daily salaries were estimated. To consider salary changes over time, salaries were adjusted by taking into account the changes in the Swiss nominal wage index (between 2016 and 2017 the Swiss nominal wage index increased by 0.3995%) [21].
Sensitivity analyses investigated the impact of various sources of uncertainty on the estimated total costs of lost productivity. In a first sensitivity analysis the estimated mean costs per workday lost were varied by ±30%. In a second sensitivity analysis the costs arising from lost productivity were estimated assuming uniform employment rates, ranging from 50% to 100% (in the main analyses we assumed that the sample of patients recruited through the Sentinel system was representative of the Swiss population). In a third sensitivity analysis we assumed no costs for patients of the age of retirement (i.e., males older than 65 years and females older than 64 years). In a fourth sensitivity analysis we assumed 200 or 240 working days per year. This automatically led to a higher or lower mean salary per day, respectively. A tentative fifth analysis estimated the total costs expected if all patients were vaccinated. In the Sentinel sample only 182 out of 3971 patients reported being vaccinated. We compared the mean duration of inability to work for vaccinated and unvaccinated patients. To assume that all patients were vaccinated, their duration of inability to work was reduced according to the difference between vaccinated and unvaccinated patients. It should be noted that for this calculation the number of cases remained the same as for the base case calculation. However, higher vaccination coverage might not only lead to shorter durations of inability to work, but could also reduce the overall number of cases. We had no data basis for considering this aspect. In a further sensitivity analysis, we generalised the cost calculation by using a single typical Swiss salary (i.e., without differentiation between age groups, genders or regions) [22].
Additional analyses explored whether influenza test results, vaccination status, increased risk of complications from influenza (i.e., having lung, metabolic or heart diseases, renal insufficiency, immunodeficiency or immunosuppression, being pregnant), medication, acute start of disease, and symptoms may have an influence on the duration of inability to work.
All analyses were performed using IBM SPSS Statistics 23 and Microsoft Excel® 365.
The total yearly number of cases of inability to work was estimated to be 101,287 in 2016 and 86,373 in 2017 (table 1 and table 2). For both years, 90% of the cases of inability to work were due to patients being sick, whereas in only 1–2% of the cases was the inability to work due to caregiving. In the remaining 8–9% of the cases the inability to work was due to a combination of being self-sick and taking care of other persons. Approximatively 53% of the estimated total number of cases of inability to work were among males. The difference in number of cases per 100,000 inhabitants between males and females was similar for both 2016 (1527 vs 1336, i.e., +191 cases per 100,000 inhabitants for males) and 2017 (1306 vs 1119, i.e., +187 cases per 100,000 for males).
Table 1Estimated number of cases and duration of inability to work in Switzerland in 2016.
| Estimated total number of cases of inability to work | % across subgroups | Swiss population (>15 years) | Number of cases per 100,000 inhabitants | Days of inability to work per case Mean (95% CI) | Estimated total number of workdays lost | ||
| Overall | Per 100,000 inhabitants | ||||||
| All cases in 2016 | 101,287 | 7,083,052 | 1430 | 3.20 (3.12–3.27) | 324,118 | 4576 | |
| Sex | |||||||
| Females | 48,043 | 47.4% | 3,596,268 | 1336 | 3.13 (3.02–3.24) | 150,375 | 4181 |
| Males | 53,245 | 52.6% | 3,486,784 | 1527 | 3.27 (3.17–3.37) | 174,111 | 4993 |
| Region | |||||||
| Southwest (GE, NE, VD, VS) | 15,591 | 15.4% | 1,492,684 | 1044 | 3.04 (2.85–3.24) | 47,397 | 3175 |
| Midwest (BE, FR, JU) | 11,565 | 11.4% | 1,188,981 | 973 | 3.12 (2.87–3.35) | 36,083 | 3035 |
| Northwest (AG, BL, BS, SO) | 14,592 | 14.4% | 1,195,324 | 1221 | 3.52 (3.33–3.70) | 51,364 | 4297 |
| Central (LU, OW, NW, UR, SZ, ZG) | 11,015 | 10.9% | 672,242 | 1639 | 3.50 (3.28–3.72) | 38,553 | 5735 |
| Northeast (AI, AR, GL, SG, SH, TG, ZH) | 39,724 | 39.2% | 2,061,296 | 1927 | 3.06 (2.95–3.18) | 121,555 | 5897 |
| Southeast (GR, TI) | 8798 | 8.7% | 473,382 | 1859 | 3.20 (3.04–3.38) | 28,154 | 5947 |
| Age classes | |||||||
| 16–25 years | 23,000 | 22.7% | 960,095 | 2396 | 3.13 (3.01–3.27) | 71,991 | 7498 |
| 26–35 years | 27,742 | 27.4% | 1,175,548 | 2360 | 3.27 (3.13–3.42) | 90,717 | 7717 |
| 36–45 years | 21,372 | 21.1% | 1,178,565 | 1813 | 3.12 (2.97–3.28) | 66,679 | 5658 |
| 46–55 years | 19,365 | 19.1% | 1,312,255 | 1476 | 3.30 (3.12–3.46) | 63,906 | 4870 |
| 56–65 years | 9109 | 9.0% | 1,019,675 | 893 | 3.29 (3.00–3.59) | 29,969 | 2939 |
| 66–75 years | 566 | 0.6% | 792,861 | 71 | 2.07 (1.07–3.22) | 1172 | 148 |
| 76–85 years | 132 | 0.1% | 466,310 | 28 | 1.52 (0–3.80) | 201 | 43 |
AG = Aargau, AI = Appenzell Innerrhoden, AR = Appenzell Ausserrhoden, BL = Basel-Landschaft, BS = Basel-Stadt, BE = Bern, FR = Fribourg, GE = Genève, GL = Glarus, GR = Graubünden, JU = Jura, LU = Luzern, NE = Neuchâtel, NW = Nidwalden, OW = Obwalden, SG = Sankt Gallen, SH = Schaffhausen, SZ = Schwyz, SO = Solothurn, TG = Thurgau, TI = Ticino, UR = Uri, VS = Valais, VD = Vaud, ZG = Zug, ZH = Zürich; CI = confidence interval
Table 2Estimated number of cases and duration of inability to work in Switzerland in 2017.
| Estimated total number of cases of inability to work | % across subgroups | Swiss population (>15 years) | Number of cases per 100,000 inhabitants | Days of inability to work per case Mean (95% CI) | Estimated total number of workdays lost | ||
| Overall | Per 100,000 inhabitants | ||||||
| All cases in 2017 | 86,373 | 7,133,270 | 1211 | 3.22 (3.14–3.31) | 278,121 | 3899 | |
| Sex | |||||||
| Females | 40,508 | 46.9% | 3,620,736 | 1119 | 3.06 (2.94–3.17) | 123,954 | 3423 |
| Males | 45,865 | 53.1% | 3,512,534 | 1306 | 3.37 (3.25–3.49) | 154,565 | 4400 |
| Region | |||||||
| Southwest | 12,848 | 14.9% | 1,505,638 | 853 | 3.18 (2.98–3.40) | 40,857 | 2714 |
| Midwest | 11,270 | 13.0% | 1,195,324 | 943 | 3.32 (3.03–3.63) | 37,416 | 3130 |
| Northwest | 20,840 | 24.1% | 1,203,204 | 1732 | 3.49 (3.34–3.67) | 72,732 | 6045 |
| Central | 6555 | 7.6% | 677,618 | 967 | 2.66 (2.44–2.91) | 17,436 | 2573 |
| Northeast | 30,929 | 35.8% | 2,078,192 | 1488 | 3.30 (3.16–3.44) | 102,066 | 4911 |
| Southeast | 3930 | 4.6% | 473,294 | 830 | 2.82 (2.56–3.13) | 11,083 | 2342 |
| Age classes | |||||||
| 16–25 years | 18,096 | 21.0% | 947,463 | 1910 | 3.22 (3.06–3.40) | 58,268 | 6150 |
| 26–35 years | 18,450 | 21.4% | 1,185,059 | 1557 | 3.19 (3.00–3.38) | 58,857 | 4967 |
| 36–45 years | 17,860 | 20.7% | 1,181,576 | 1511 | 3.27 (3.06–3.48) | 58,401 | 4943 |
| 46–55 years | 18,207 | 21.1% | 1,312,545 | 1387 | 3.23 (3.06–3.42) | 58,810 | 4481 |
| 56–65 years | 12,892 | 14.9% | 1,045,041 | 1234 | 3.33 (3.13–3.55) | 42,929 | 4108 |
| 66–75 years | 811 | 0.9% | 801,428 | 101 | 1.99 (1.30–2.71) | 1614 | 201 |
| 76–85 years | 57 | 0.1% | 477,743 | 12 | 1.30 (0–5.20) | 75 | 16 |
CI = confidence interval
Influenza and influenza-like illnesses leading to physician’s visits and inability to work were more frequent in Central and Western Switzerland, indicating relevant variation between Swiss regions. Compared with 2016, the number of cases per 100,000 inhabitants in 2017 was generally lower across regions. Only Northwest Switzerland showed a higher frequency.
With regard to the age distribution, the number of cases of inability to work per 100,000 inhabitants showed that in 2016 younger age classes were more affected than older ones: the estimated number of cases decreased from 2396 per 100,000 for 16–25-year-old inhabitants to 893 cases per 100,000 for 56–65-year-old inhabitants. The number of cases of inability to work among patients older than 65 years was expected to be low as the great majority should be retired. The data for 2017 showed a similar, but less pronounced trend.
The estimated mean duration of inability to work was 3.20 (95% confidence interval [CI] 3.12–3.27) workdays lost per case in 2016 and 3.22 (95% CI 3.14–3.31) workdays lost per case in 2017. The mean number of days of inability to work did not substantially differ by year, reason for inability to work and sex. In contrast, some differences between regions and age classes were identified. For example, in 2016, the mean number of workdays lost per case ranged from 3.04 (95% CI 2.85–3.24) days in Southwest to 3.52 (95% CI 3.33–3.70) days in Northwest Switzerland. In 2017 it ranged from 2.66 (95% CI 2.44–2.91) days in Central to 3.49 (95% CI 3.34–3.67) days in Northwest Switzerland. The mean number of workdays lost per case was similar across age classes below 65 years of age, whereas it was lower than average in older patients.
The estimated total number of workdays lost was 324,118 (4576 per 100,000 inhabitants) for 2016 and 278,121 (3899 per 100,000 inhabitants) for 2017 (table 1 and table 2). The number of workdays lost was generally higher in men (53.7% of the total in 2016 and 55.6% of the total in 2017) than women. Main reasons explaining the higher numbers among men are the fact that more men than women visited a physician because of symptoms of influenza-like illness and the fact that men in the Sentinel reports had a generally higher employment level (98% vs 90% for women). Regional differences in terms of absolute numbers mainly reflected differences in population size. The numbers of workdays lost per 100,000 suggested that in 2016 there were particularly high numbers of workdays lost in Central, Northeast and Southeast Switzerland (more than 5700 workdays lost per 100,000 inhabitants compared with fewer than 4300 workdays lost per 100,000 inhabitants in the other regions). In 2017, only Northwest and Northeast Switzerland had particularly high numbers (6045 and 4911 workdays lost per 100,000 inhabitants, respectively), whereas all other regions were below the national estimate.
Whereas most regions showed a decrease in the number of workdays lost between 2016 and 2017 (−13.8% in Southwest, −57.8% in Central, −16.0% in Northeast and −60.6% in Southeast Switzerland), Midwest Switzerland showed a small increase (+3.7%) and Central Switzerland showed a large increase (+41.6%).
In 2016, the estimated numbers per 100,000 inhabitants suggest that the number of workdays lost decreased with increasing age (from more than 7000 workdays lost per 100,000 inhabitants aged 16–35 years to fewer than 3000 workdays lost per 100,000 inhabitants aged 56–65 years). The age-dependent decrease in workdays lost in 2017 was less pronounced than in 2016 (from about 6000 workdays lost per 100,000 inhabitants aged 16–25 years to about 4000 workdays lost per 100,000 inhabitants aged 56–65 years).
The estimated total costs of lost productivity due to inability to work were CHF 115 million in 2016 and CHF 103 million in 2017 (table 3). Males accounted for 57–58% of the total costs due to inability to work. The total costs due to inability to work according to region depended on the number of reported cases, which was to a large extent a function of population size.
Table 3Estimated total cost and costs per 100,000 inhabitants due to inability to work in 2016 and 2017.
| Estimated total costs due to inability to work in 2016 (CHF) | Estimated total costs due to inability to work in 2017 (CHF) | |||
| Overall | Per 100,000 inhabitants | Overall | Per 100,000 inhabitants | |
| All cases | 114,951,147 | 1,622,904 | 101,934,787 | 1,429,005 |
| Sex | ||||
| Females | 49,902,984 | 1,387,633 | 42,624,193 | 1,177,225 |
| Males | 65,048,163 | 1,865,563 | 59,310,593 | 1,688,541 |
| Region | ||||
| Southwest | 17,400,956 | 1,165,749 | 14,618,168 | 970,895 |
| Midwest | 13,901,727 | 1,169,214 | 14,167,758 | 1,185,265 |
| Northwest | 17,507,428 | 1,464,660 | 25,752,973 | 2,140,366 |
| Central | 14,699,726 | 2,186,672 | 6,717,439 | 991,331 |
| Northeast | 41,762,929 | 2,026,052 | 36,302,154 | 1,746,814 |
| Southeast | 9,678,381 | 2,044,518 | 4,376,295 | 924,646 |
| Age classes | ||||
| 16–25 years | 19,241,997 | 2,004,176 | 15,559,018 | 1,642,177 |
| 26–35 years | 30,288,144 | 2,576,513 | 19,975,936 | 1,685,649 |
| 36–45 years | 25,742,073 | 2,184,188 | 23,077,177 | 1,953,084 |
| 46–55 years | 26,292,518 | 2,003,613 | 24,511,269 | 1,867,461 |
| 56–65 years | 12,778,468 | 1,253,190 | 17,959,938 | 1,718,587 |
| 66–75 years | 607,948 | 76,678 | 755,793 | 94,306 |
| 76–85 years | – | – | 95,656 | 20,022 |
In terms of estimated costs due to inability to work per 100,000 inhabitants, men induced considerably higher costs than women: about CHF 1.9 million vs CHF 1.4 million per 100,000 inhabitants in 2016 (+34%) and about CHF 1.7 million vs CHF 1.2 million per 100,000 inhabitants in 2017 (+43%). In 2016, Central and Northeast Switzerland had the highest costs per 100,000 inhabitants (about CHF 2.0–2.2 million), whereas Southwest and Midwest Switzerland had the lowest costs (about CHF 1.2 million). In 2017, the regions reporting the highest costs were Northwest and Northeast Switzerland (about CHF 2.2 million and CHF 1.8 million per 100,000 inhabitants, respectively), whereas the estimated costs in all other regions were below the national estimate. The cost estimations stratified by age group show that the highest total costs were induced by 26–35-year-old persons in 2016, and by 36–45-year-old persons in 2017 (figure1).
Figure 1 Estimated total costs by age class in 2016 and 2017 (in CHF).
The results of the sensitivity analyses are reported in table 4. A 30% variation of the mean salary, as well as a variation of the degree of employment, had a considerable impact on the estimated total costs. In contrast, in the sensitivity analysis excluding the costs for all patients of the age of retirement, the mean total costs changed only minimally (−0.87% in 2016 and −1.92% in 2017). The cost consequences of assuming a lower or higher number of working days per year were also limited. The tentative sensitivity analysis estimating the total costs by assuming that all patients were vaccinated merits further discussion. According to the data of the Sentinel Survey, only 5.2% of the included patients were vaccinated. Compared with unvaccinated patients, vaccinated persons reported shorter durations of inability to work (2.79 days vs 3.22 days, 86.8% of the value seen in the unvaccinated). When it was assumed that all patients were vaccinated, the mean workdays lost of the unvaccinated were reduced by 13.2%. The resulting costs, assuming that all patients were vaccinated, were CHF 98 million in 2016 and CHF 88 million in 2017. In other words, the estimated total costs related to productivity loss would decrease by CHF 18 million (−15.3%) in 2016 and by CHF 15 million in 2017 (−14.2%).
In the last sensitivity analysis, we generalised the cost calculation by using a single typical Swiss salary (without differentiation between age groups, genders or regions). The total costs estimation based on a single salary estimation led to minimal changes (CHF 115.1 million vs CHF 115.3 in the base case in 2016, and CHF 99.0 million vs CHF 103.0 million in the base case in 2017).
Table 4Results of the sensitivity analyses.
| 2016 (CHF) | 2017 (CHF) | ||
| Base case | 115,349,819 | 103,057,979 | |
| Mean salary variation: | −30% | 80,465,803 | 71,354,351 |
| +30% | 149,436,491 | 132,515,222 | |
| Uniform employment rate: | 50% | 61,684,055 | 55,309,083 |
| 60% | 74,020,867 | 66,370,900 | |
| 70% | 86,357,678 | 77,432,716 | |
| 80% | 98,694,489 | 88,494,533 | |
| 90% | 111,031,300 | 99,556,350 | |
| 100% | 123,368,111 | 110,618,166 | |
| No costs for patients in retirement age | 114,343,199 | 101,108,338 | |
| Workdays variation (base case: 220 days/year): | 200 workdays/year | 126,884,801 | 113,363,777 |
| 240 workdays/year | 105,737,334 | 94,469,814 | |
| Assuming all patient were vaccinated | 97,751,267 | 88,428,305 | |
| Using a single salary for all patients | 115,062,032 | 99,011,097 | |
In the additional analyses we investigated influenza test results, vaccination status, increased risk of complications, medication, acute start of disease, and symptoms on the duration of inability to work. In most cases, relevant information was available only for a minority of the reported cases.
Among the 3971 patient cases in the Sentinel reports, 315 (7.9%) had a positive influenza test result and 310 (7.8%) had a negative influenza test result, whereas for the remaining 3346 (84.6%) there was no information available. Persons with a positive influenza test result (n = 182, 4.6%) had a significantly longer duration of inability to work compared with those with a negative influenza test: 3.32 days (95% CI 3.12–3.54) vs 3.08 days (95% CI 2.90–3.27), p = 0.039. Similarly, vaccinated persons had a significantly shorter duration of inability to work compared with all unvaccinated patients (2.79 days [95% CI 2.51–3.08] vs 3.22 days [95% CI 3.16–3.28]; p = 0.008). Increased risk of complications and medication had no significant impact on the duration of inability to work.
Details on acute start of disease and symptoms were available for 558 patients (14.1%). There was more detailed information available only for pneumonia (n = 2413, 60.8% of the total sample). Only acute start of disease and fever >38°C seemed to be significantly associated with the mean number of workdays lost: patients reporting an acute start of disease had a significantly shorter duration of inability to work compared with those with a non-acute start of disease (3.13 days [95% CI 2.95–3.32] vs 3.55 days [95% CI 3.29–3.80]; p = 0.008), whereas patients reporting high fever (>38°C) had significantly longer duration of inability to work (3.37 days [95% CI 3.19–3.56] vs 3.05 days [95% CI 2.79–3.30] for people without high fever; p = 0.014).
The data of the Swiss Sentinel Surveillance Network extrapolated to the national level suggested that the total yearly number of cases of inability to work due to influenza and influenza-like illnesses was about 101,000 in 2016 and 86,000 in 2017. The estimated total number of workdays lost in the Switzerland were about 324,000 for 2016 and 278,000 for 2017. The number of workdays lost was generally higher in men. Regional differences in terms of absolute numbers mainly reflected differences in population size. with regard to the number of workdays lost according to age, a different distribution could be identified in 2016 versus 2017: in 2016 younger people seemed to be more affected by influenza and influenza-like illnesses, whereas in 2017 the number of cases was more equally distributed across the working age classes. The estimated total costs due to inability to work were CHF 115 million in 2016 and CHF 103 million in 2017. Cost per 100,000 inhabitants showed important variations across different years, sex, age groups and regions.
The estimated duration of inability to work in Switzerland from this study is of a magnitude consistent with the published literature. For example, in a Swiss study investigating the financial burden of influenza in a small rehabilitation centre during the season 2016/2017, 33 employees were absent from work because of influenza for 5.3 days, with mean costs per absence of CHF 497. In the present study, the mean duration of absence from work was 3.20 days and the mean cost per case was CHF 1138, in 2016 [23]. In a literature review published in 2008, Keech et al. investigated the impact of influenza on working days lost. Studies involving a laboratory-confirmed influenza diagnosis suggested that the mean number of workdays lost ranged between 1.5 and 4.9 days per episode. In contrast, studies in which the diagnosis of influenza was based on the physician diagnosis (without laboratory tests), there was a range of 3.7–5.9 workdays lost per episode [24]. In a US analysis using data of 1278 employed adults collected between 2012 and 2016, it was estimated that a typical full-time employee could expect to lose about 3.5 of their 5.0 workdays in a given week as a result of absenteeism and presenteeism from an influenza infection. In contrast, for a person with other acute respiratory infection, the expected loss of productivity was 3.0 days in a week [25]. In another US study investigating the loss of productivity among 1548 working adults with medically attended acute respiratory illnesses in 2012–2013, it was estimated that the missed worktime during illness was 20.5 hours (about 2.6 days) for influenza test-positive cases and 15.0 hours (1.9 days) for influenza test-negative cases. The difference between influenza test-positive and test-negative cases was somewhat larger than in this report (3.32 days for test-positive cases vs 3.08 days) [26]. In a German study investigating the costs for physician-diagnosed influenza and influenza-like illnesses in primary care between May 2010 and April 2012, the mean number of workdays lost was 6.0 days, and the costs related to productivity lost were EUR 424 per episode (82% of the total costs) [8]. A recently published Italian study investigated the occurrence of influenza episodes in the general population. Among the 1202 adults who were contacted in March 2017 by telephone, 57% had experienced at least one episode of influenza in the previous 12 months. Episodes were usually home managed. Nevertheless, 55.7% of the respondents visited a physician, 2.8% were referred to the emergency room, and 0.9% were hospitalised. The mean duration of each episode was 5.27 days, and the estimated mean cost for workdays lost was EUR 124 (i.e. 90% of the costs) [27,28].
According to data from the Swiss Federal Statistical Office, the mean duration of absenteeism due to diseases or accidents for full-time workers was 6.8 days (7.5 days for females and 6.5 days for males) in 2016 and 7.1 days (8.0 for females and 6.7 for males) in 2017 [29]. This statistic obviously includes diseases/accidents that may lead to particularly long periods of inability to work. For example, a recently published study investigating productivity loss in the year following acute coronary syndrome in Switzerland, estimated up to 75 workdays lost per patient (plus 10 days for caregivers) [30]. Another study investigating the burden of depression in Switzerland reported that the patients had a mean of 50 workdays lost in the first 12 months after diagnosis [31]. If compared with these diseases, the loss of productivity per person due to influenza (approximatively 3.2 days) seems negligible. Nevertheless, for patients getting influenza, the mean number of workdays lost due this disease may still represent about half of the estimated annual productivity loss.
The tentative sensitivity analysis assuming that all patients were vaccinated suggested that full influenza vaccination coverage might reduce the total costs due to inability to work by approximatively 15%. This result was based on our analysis showing that vaccinated persons in the Sentinel report had a significantly shorter duration of inability to work than unvaccinated patients. In this sensitivity analysis, the estimated duration of inability to work, assuming that all patients were vaccinated, was multiplied by the estimated number of cases reported for the main analyses. However, higher vaccination coverage might not only lead to a shorter duration of inability to work, but also reduce the overall number of cases. As the data did not allow us to consider this aspect, the true decrease in lost productivity might be more pronounced. Therefore, it should be emphasised that this kind of calculation is highly speculative and unlikely to reflect the true effects of vaccination. A more complete assessment, not possible with the Sentinel data, would need to consider that vaccinated persons may also completely avoid being sick owing to influenza. According to the Swiss Health Survey, the percentage of patients reporting being vaccinated against influenza was 16.4% in 2007, 14.1% in 2012 and 14.4% in 2017 [32]. Among persons above 64 years of age, the percentages of vaccinated subjects were 47.8% in 2007, 38.5% in 2012 and 36.2 in 2017. According to the annual report on seasonal influenza published by the SFOPH, in both 2016/2017 and 2017/2018 the percentage of vaccinated persons over 64 years was 32% [14,15]. In the Sentinel report, the proportions of vaccinated patients were 0.8% among 0–17-year-olds, 4.2% among 18–65-year-olds and 33.6% among those over 65 years old. On the basis of these numbers, the frequency of vaccination among the working population having influenza-like illnesses in the Sentinel Surveillance Network database was comparable to other national estimates.
The additional analyses suggest that influenza may have a stronger impact on the ability to work than influenza-like illnesses. Increased risk of complications, as well as antibiotic or antiviral medication, did not have a significant impact on the duration of inability to work.
The fact that patients with high fever reported longer durations of inability to work is, per se, not surprising if we assume that people with higher fever are sicker and may require more time to get healthy than those with lower or no fever. In contrast, the observed shorter duration of inability to work for acute start of disease is less intuitive, since an acute start might be interpreted as an indicator for more severe influenza or influenza-like illness. One possible explanation may be that people with an acute start of disease visit a physician immediately, receiving specific medication. In contrast, people with a non-acute start may first decide to stay at home for 1–2 days without visiting a physician or taking specific medication. After a few days of inability to work and in the case of no amelioration of symptoms, they may decide to finally visit a physician, who may only then prescribe them more efficient medication. The lag between start of disease, physician visit and subsequent certificate may lead to differences in the reported duration of inability to work.
One of the major strengths of this study is the large sample size collected through the well-established Sentinel Surveillance Network system. All Swiss regions were well represented, and patients were recruited in almost all Swiss cantons (except Appenzell Innerrhoden). Another strength is that all calculations were based on Swiss data sources. The salary statistics of the Swiss Federal Statistical Office provided detailed information on mean salary by age, gender and region [20–22]. The fact that the base case calculation (with salary stratification by sex and age), the estimation adding a regional stratification, and the sensitivity analysis using a single typical Swiss salary led to almost identical results suggests that the included sample was well representative of the Swiss population of the relevant age.
One first limitation is that several variables were only available for a minority of the included patients. These include the weekday of the physician visit and information on symptoms, which was available for approximatively 15% of the patients. This sub-sample may not be fully representative of the entire population. A second limitation concerns the reason for the inability to work. Physicians were asked to indicate whether the included patients were unable to work due to being self-sick, due to caregiving, or both. For patients indicating that they were self-sick and that they also had to care for a family member it was possible to provide two numbers (one indicating the days of self-sickness, the other indicating the days spent in caregiving). In most cases, the reported numbers were identical, whereas in other cases the period of self-sickness was longer than the period for caregiving. For the present analyses we always considered the highest reported number only, assuming that the periods of self-sickness and caregiving were perfectly overlapping. However, it is theoretically possible that a patient reporting 5 days of self-sickness and 5 days of caregiving may have a total of 10 days of inability to work (if the two periods were not overlapping). Therefore, the results provided should be considered as conservative. A third limitation is the assumption that the employment level among the included patients is representative for the whole Swiss population. For patients reporting being employed but not providing the employment level, we applied the mean employment level of the sample, which was 94.3%. However, according to the Swiss Labour Force Survey, the activity rate in full-time equivalents for the Swiss population aged 15–64 years was 72.5% in 2016 and 72.7% in 2017 [33]. Therefore, it could be argued that the estimation provided in the sensitivity analyses assuming a uniform employment rate of 70% may be more realistic. An important, further limitation is that other causes of lost productivity than short-term inability to work (early retirement, premature death) could not be assessed from the data source used. Moreover, information on an eventual prolongation of the certificate of inability to work, on workdays lost when staying ill at home without seeing a physician, and on presenteeism (reduced productivity of people who go to work while being ill) was not available.
Finally, lost productivity due to hospitalisations or illness attended to in hospital outpatient departments (e.g., due to lack of a family physician) were not included in the analyses. The Sentinel Surveillance Network cannot reliably capture this kind of information, for example, because some patients may directly visit a hospital (there is no physician visit prior to the hospitalisation). According to the Swiss Hospital Statistics, in 2018 there were 11,567 hospitalisations with a main or secondary diagnosis of influenza [34,35]. The mean duration of the hospital stays was 9.44 days. It is evidently difficult to discern which proportion of these hospitalisations was effectively attributable to influenza or influenza-like illnesses. In a tentative analysis taking into consideration only patients of working age with a main diagnosis of influenza, the estimated productivity loss for hospitalised patients in 2018 was estimated to be approximatively CHF 2.1 million, suggesting that the costs missed by not considering influenza hospitalisations may be comparably small.
A final remark concerns the ongoing pandemic of coronavirus disease 2019 (COVID-19), which dramatically changed the way patients with influenza and influenza-like illnesses are managed. Because of its symptoms, COVID-19 has often been compared to influenza or other influenza-like illnesses [36–39]. The SFOPH recommends that all people showing any symptom that might be attributable to COVID-19 should stay at home and get tested [40]. According to the data published by the SFOPH, between the 24 January 2020 and the 21 December 2020 the number of tests officially conducted in Switzerland was 3,382,229 [40]. Although some persons may have been tested twice or more often, the overall number of cases with symptoms was high. It is reasonable to assume that in many cases it was not possible to work at home. Considering such changes in the management of influenza and influenza-like illnesses, it might be interesting to repeat this study regularly and with more recent data.
To summarise, this project investigated the costs of lost productivity due to influenza and influenza-like illnesses in an outpatient setting, focusing on office-based physicians. The results indicated that the costs of lost productivity due to influenza and influenza-like illnesses in Switzerland are substantial. We estimated them at about CHF 115 million in 2016 and CHF 103 million in 2017. The impact of influenza and influenza-like illnesses on the ability to work varies considerably between different years, regions and age classes. For several reasons, our estimates can be assumed to be conservative. The true costs of lost productivity due to influenza or influenza-like illnesses may be somewhat higher than the estimates presented.
We thank Claudia Schmutz for her great input to the survey setup, the Sentinel working group for their contributions to the survey setup and conduct, and especially Diana Guido and Raphael Rytz for their support during data collection. We also thank all physicians of the Swiss Sentinel Surveillance Network for their steady weekly reporting during the 2 years of data collection.
This project was funded by the SFOPH, who proposed the topic of the study. The SFOPH as an institution had no influence on the conduct, analysis and interpretation of the study and was not involved in writing the manuscript. The authors declare that they have no competing interests.
Table S1Main information related to inability to work due to influenza and influenza-like illness collected by the Sentinel Survey.
| Questions | Answer |
| Year of birth | Year |
| Sex | Male, female |
| Reason for the inability to work | Self-sick, caregiving for others |
| Working i.e., paid work | Yes, no, unknown |
| ‒ If working = yes: occupation level in % | |
| ‒ If working = yes: number of workdays lost | |
| Engaged in caregiving/nursing i.e., unpaid caregiving/nursing work, which is needed by others (e.g., caregiving to preschool children, care of aged or invalid persons independent if they live in the same or another household. | Yes, no, unknown |
| ‒ If caregiving/nursing = yes: number of days lost for caregiving/nursing | |
| Pneumonia (clinically diagnosed) | Yes, no |
| Increased risk for complications (defined as chronic lung disease, chronic metabolic disease, chronic heart disease, renal insufficiency, immunodeficiency or immunosuppression, pregnancy, women in childbed (until 4 weeks after birth giving, premature infants aged <24 months (birth before 33. week of pregnancy or birth weight <1500 g) | Yes, no |
| Hospitalisation needed because of influenza complications (incl. secondary bacterial pneumonia) | Yes |
| Death | Yes |
| Antiviral therapy prescribed during consultation | Amantadine, neuraminidase inhibitor |
| Antibiotics prescribed during consultation | Yes, no |
| Vaccinated for the respective influenza season (i.e., vaccinated with the vaccine of the respective influenza season, at least 2 weeks before disease onset) | Yes, no, unknown |
1. Centers for Disease Control and Prevention . National Center for Immunization and Respiratory Diseases (NCIRD) - Flu Symptoms & Diagnosis. https://www.cdc.gov/flu/symptoms/index.html. Accessed 2020-11-02.
2. Coletti P , Poletto C , Turbelin C , Blanchon T , Colizza V . Shifting patterns of seasonal influenza epidemics [PubMed]. Sci Rep. 2018 Aug;8(1):12786. https://doi.org/10.1038/s41598-018-30949-x
3. Lofgren E , Fefferman NH , Naumov YN , Gorski J , Naumova EN . Influenza Seasonality: Underlying Causes and Modeling Theories. Journal of Virology [Internet]. 2007 Jun 1;81(11):5429 LP – 5436. Available from: http://jvi.asm.org/content/81/11/5429.abstract
4. Tamerius J , Nelson MI , Zhou SZ , Viboud C , Miller MA , Alonso WJ . Global influenza seasonality: reconciling patterns across temperate and tropical regions. Environmental health perspectives [Internet]. 2010/11/19. 2011 Apr;119(4):439–45. Available from: https://pubmed.ncbi.nlm.nih.gov/21097384
5. Hayward AC , Fragaszy EB , Bermingham A , Wang L , Copas A , Edmunds WJ , et al.; Flu Watch Group . Comparative community burden and severity of seasonal and pandemic influenza: results of the Flu Watch cohort study [PubMed]. Lancet Respir Med. 2014 Jun;2(6):445–54. https://doi.org/10.1016/S2213-2600(14)70034-7
6. Lee EC , Viboud C , Simonsen L , Khan F , Bansal S . Detecting signals of seasonal influenza severity through age dynamics [PubMed]. BMC Infect Dis. 2015 Dec;15(1):587. https://doi.org/10.1186/s12879-015-1318-9
7. Centers for Disease Control and Prevention . National Center for Immunization and Respiratory Diseases (NCIRD) - How CDC Classifies Flu Severity. https://www.cdc.gov/flu/about/classifies-flu-severity.htm. Accessed: 2020-11-02.
8. Ehlken B , Anastassopoulou A , Hain J , Schröder C , Wahle K . Cost for physician-diagnosed influenza and influenza-like illnesses on primary care level in Germany—results of a database analysis from May 2010 to April 2012 [PubMed]. BMC Public Health. 2015 Jun;15(1):578. Available from: https://pubmed.ncbi.nlm.nih.gov/26093501 https://doi.org/10.1186/s12889-015-1885-0
9. Putri WC , Muscatello DJ , Stockwell MS , Newall AT . Economic burden of seasonal influenza in the United States [PubMed]. Vaccine. 2018 Jun;36(27):3960–6. https://doi.org/10.1016/j.vaccine.2018.05.057
10. Swiss Federal Office of Public Health - Seasonal flu (influenza). https://www.bag.admin.ch/bag/en/home/krankheiten/krankheiten-im-ueberblick/grippe.html. Accessed 2020-11-02.
11. World Health Organisation - Vaccination . https://www.euro.who.int/en/health-topics/communicable-diseases/influenza/vaccination. Accessed 2020-11-04.
12. Blank PR , van Essen GA , Ortiz de Lejarazu R , Kyncl J , Nitsch-Osuch A , Kuchar EP , et al. Impact of European vaccination policies on seasonal influenza vaccination coverage rates: an update seven years later [PubMed]. Hum Vaccin Immunother. 2018;14(11):2706–14. https://doi.org/10.1080/21645515.2018.1489948
13. Jorgensen P , Mereckiene J , Cotter S , Johansen K , Tsolova S , Brown C . How close are countries of the WHO European Region to achieving the goal of vaccinating 75% of key risk groups against influenza? Results from national surveys on seasonal influenza vaccination programmes, 2008/2009 to 2014/2015 [PubMed]. Vaccine. 2018 Jan;36(4):442–52. https://doi.org/10.1016/j.vaccine.2017.12.019
14. Swiss Federal Office of Public Health . Bericht zur Grippesaison 2017/18. https://www.bag.admin.ch/dam/bag/de/dokumente/mt/infektionskrankheiten/grippe/saisonbericht-grippe-2017-18.pdf.download.pdf/saisonbericht-g
15. Swiss Federal Office of Public Health . Saisonbericht Grippe 2016/2017. https://www.bag.admin.ch/dam/bag/de/dokumente/mt/infektionskrankheiten/grippe/saisonbericht-grippe-2016-17.pdf.download.pdf/saisonbericht-grippe-2016-17-de.pdf. Accessed 2021-01-04.
16. Brunner I , Schmedders K , Wolfensberger A , Schreiber PW , Kuster SP . The economic and public health impact of influenza vaccinations: contributions of Swiss pharmacies in the 2016/17 and 2017/18 influenza seasons and implications for vaccination policy [PubMed]. Swiss Med Wkly. 2019 Dec;149(51-52):1–10.
17. Sentinella-Meldesystem . http://www.sentinella.ch/de/info. Accessed 2020-04-16.
18. Breyer F , Zweifel P , Kifmann F . Gesundheitsökonomie 5. Berlin: Springer Verlag; 2005.
19 Zhang W , Anis AH . The economic burden of rheumatoid arthritis: beyond health care costs. Clin Rheumatol. 2011;30(S1, Suppl 1):S25–32. doi:https://doi.org/https://doi.org/10.1007/s10067-010-1637-6. PubMed
20. Swiss Federal Statistical Office . (2018) Wage levels - major regions. https://www.bfs.admin.ch/bfs/en/home/statistics/work-income/wages-income-employment-labour-costs/wage-levels-major-regions.html. Accessed 2021-05-10.
21. Swiss Federal Statistical Office . (2018) Inflation rates. https://www.bfs.admin.ch/bfs/de/home/statistiken/preise/landesindex-konsumentenpreise/lik-resultate.assetdetail.10527650.html. Accessed 2020-04-16.
22. Swiss Federal Statistical Office . (2018) Salaries statistics. https://www.bfs.admin.ch/bfs/de/home/statistiken/arbeit-erwerb/loehne-erwerbseinkommen-arbeitskosten.assetdetail.5126411.html. Accessed 2020-04-16.
23. Sendi P , Dräger S , Batzer B , Walser S , Dangel M , Widmer AF . The financial burden of an influenza outbreak in a small rehabilitation centre [PubMed]. Influenza Other Respir Viruses. 2020 Jan;14(1):72–6. https://doi.org/10.1111/irv.12696
24. Keech M , Beardsworth P . The impact of influenza on working days lost: a review of the literature [PubMed]. PharmacoEconomics. 2008;26(11):911–24. https://doi.org/10.2165/00019053-200826110-00004
25. Van Wormer JJ , King JP , Gajewski A , McLean HQ , Belongia EA . Influenza and Workplace Productivity Loss in Working Adults [PubMed]. J Occup Environ Med. 2017 Dec;59(12):1135–9. https://doi.org/10.1097/JOM.0000000000001120
26. Petrie JG , Cheng C , Malosh RE , VanWormer JJ , Flannery B , Zimmerman RK , et al. Illness Severity and Work Productivity Loss Among Working Adults With Medically Attended Acute Respiratory Illnesses: US Influenza Vaccine Effectiveness Network 2012-2013 [PubMed]. Clin Infect Dis. 2016 Feb;62(4):448–55.
27. Dal Negro RW , Turco P , Povero M . Cost of influenza and influenza-like syndromes (I-LSs) in Italy: results of a cross-sectional telephone survey on a representative sample of general population [PubMed]. Respir Med. 2018 Aug;141(July):144–9. https://doi.org/10.1016/j.rmed.2018.07.001
28. Dal Negro RW , Zanasi A , Turco P , Povero M . Influenza and influenza-like syndromes: the subjects’ beliefs, the attitude to prevention and treatment, and the impact in Italian general population [PubMed]. Multidiscip Respir Med. 2018 Mar;13(1):7. https://doi.org/10.1186/s40248-018-0119-6
29. Swiss Federal Statistical Office . (2021) Employment and working hours - Absences. https://www.bfs.admin.ch/bfs/en/home/statistics/work-income/employment-working-hours/working-time/absences.assetdetail.12707396.html. Accessed 2021-05-17.
30. Mach F , Lyrer P , Hullin R , Dwan B , Wanger C , Reichert N , et al. Productivity loss and indirect costs in the year following acute coronary events in Switzerland. Cardiovasc Med. 2021;(January):1–6.
31. Tomonaga Y , Haettenschwiler J , Hatzinger M , Holsboer-Trachsler E , Rufer M , Hepp U , et al. The economic burden of depression in Switzerland [PubMed]. PharmacoEconomics. 2013 Mar;31(3):237–50. https://doi.org/10.1007/s40273-013-0026-9
32. Zürcher K , Zwahlen M , Berlin C , Egger M , Fenner L . Losing ground at the wrong time: trends in self-reported influenza vaccination uptake in Switzerland, Swiss Health Survey 2007-2017 [PubMed]. BMJ Open. 2021 Feb;11(2):e041354. Available from: http://bmjopen.bmj.com/content/11/2/e041354 https://doi.org/10.1136/bmjopen-2020-041354
33. Swiss Labour Force Survey (SLFS) - Erwerbsquoten in Vollzeitäquivalenten nach Nationalität und Altersgruppe. https://www.bfs.admin.ch/bfs/de/home/statistiken/arbeit-erwerb/erwerbstaetigkeit-arbeitszeit/erwerbspersonen/erwerbsquote.assetdetail.5826517.html
34. Diagnosen (ICD-10 GM 2018). https://www.medcode.ch/ch/de/icds/ICD10-GM-2018. Accessed 2020-10-30.
35. Swiss Federal Statistical Office - Swiss Hospital Statistic . 2018 [Internet]. Available from: https://www.bfs.admin.ch/bfs/de/home/statistiken/kataloge-datenbanken/tabellen.assetdetail.3722888.html
36. Struyf T , Deeks JJ , Dinnes J , Takwoingi Y , Davenport C , Leeflang MM , et al.; Cochrane COVID-19 Diagnostic Test Accuracy Group . Signs and symptoms to determine if a patient presenting in primary care or hospital outpatient settings has COVID-19 disease [PubMed]. Cochrane Database Syst Rev. 2020 Jul;7(7):CD013665.
37 Gómez-Ochoa SA , Franco OH , Rojas LZ , Raguindin PF , Roa-Díaz ZM , Wyssmann BM , et al. COVID-19 in Healthcare Workers: A Living Systematic Review and Meta-analysis of Prevalence, Risk Factors, Clinical Characteristics, and Outcomes. Am J Epidemiol. 2020. PubMed
38. Liu Y , Mao B , Liang S , Yang JW , Lu HW , Chai YH , et al.; Shanghai Clinical Treatment Experts Group for COVID-19 . Association between age and clinical characteristics and outcomes of COVID-19. Eur Respir J. 2020 May;55(5):2001112. https://doi.org/10.1183/13993003.01112-2020
39 Piroth L , Cottenet J , Mariet A-S , Bonniaud P , Blot M , Tubert-Bitter P , et al. Comparison of the characteristics, morbidity, and mortality of COVID-19 and seasonal influenza: a nationwide, population-based retrospective cohort study. Lancet Respir Med. 2020. PubMed
40. Swiss Federal Office of Public Health . Coronavirus: Precautionary measures. https://www.bag.admin.ch/bag/en/home/krankheiten/ausbrueche-epidemien-pandemien/aktuelle-ausbrueche-epidemien/novel-cov/massnahmen-des-bundes/empfehlungen-fuer-die-arbeitswelt.htm