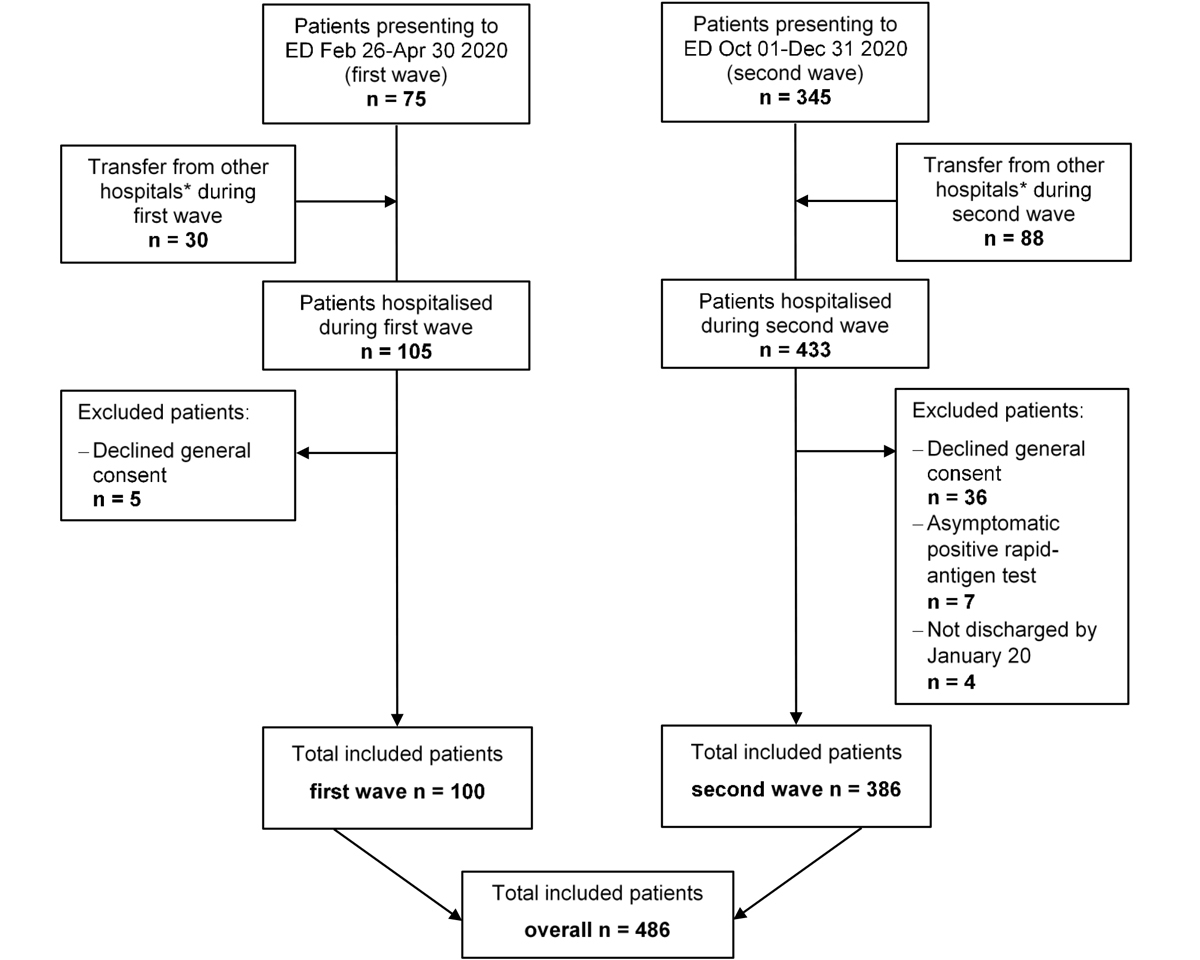
Figure 1 Overview of study flow. A total of 486 patients were included in the final analysis. ED = emergency department * includes psychiatric and rehabilitation care hospitals.
DOI: https://doi.org/10.4414/smw.2021.20569
The emergence and subsequent spread of the novel severe acute respiratory syndrome coronavirus type 2 (SARS-CoV-2) still has a major detrimental impact on healthcare systems worldwide. Today, over a year after its first description in China [1, 2], the number of patients suffering from SARS-CoV-2 is still rising [3, 4]. After an initial wave in spring 2020, the number of new infections in Switzerland and other European countries plateaued over the summer months [3, 5]. With the arrival of autumn, however, infection rates rose again and eventually surpassed the numbers of the first wave [3, 6].
The severe and highly contagious coronavirus disease 2019 (COVID-19) led to an enormous global effort aiming to reduce infection rates. There has also been a major endeavour to improve therapeutic management and thus clinical outcomes and COVID-19 associated mortality. Nevertheless, evidence-based treatment options are currently limited to early anti-coagulation, glucocorticoid use, oxygen administration and different supportive treatments; other experimental treatments have shown mixed results [7–13]. Increasing clinical experience and the more wide-spread use of high-dose glucocorticoids in patients with COVID-19 pneumonitis might have led to improved clinical courses of patients in the second wave, as well as improvements in the general management of in-hospital patients and a reduction in length of stay (LOS).
Whereas several studies reported characteristics and outcomes of patients with COVID-19 during the early pandemic, including a report from our hospital [14], only a few anticipatory [15, 16] and early second-wave publications are already available. These focus, for example, on changes in treatment regimens [10, 13], triage [17] or epidemiological data [18]. More recently, cohort data on hospitalised Swiss patients up to the end of August 2020 were published [19], and another group of authors reported a more severe second wave for member states of the African Union [20]. Potential differences between the two waves in Europe regarding outcomes have thus gone largely underreported. Hence, the aim of this study was to compare characteristics, predictors and outcomes of patients with COVID-19 hospitalised at a tertiary care centre in the northern part of Switzerland during the first and second waves of infection [14].
This retrospective observational analysis included all consecutively hospitalised adult patients (≥18 years) with a confirmed SARS-CoV-2 infection and a LOS of at least 24 hours at the Cantonal Hospital Aarau (Switzerland) between 26 February and 30 April 2020 (first wave) and between 1 October and 31 December 2020 (second wave). In this tertiary care centre with 130 medical ward beds, indications for in-hospital treatment of COVID-19 were respiratory distress with need for oxygen supplementation, high fever or relevant clinical deterioration. This study was approved by the local ethics committee (EKZN, 2020-01306).
A detailed description of the study methodology has been previously reported [14]. A confirmed SARS-CoV-2 infection was defined as a combination of typical clinical symptoms (e.g., respiratory symptoms with or without fever, and/or pulmonary infiltrates and/or anosmia/dysgeusia) and a positive real-time reverse transcriptase polymerase chain reaction (RT-PCR) test, obtained from nasopharyngeal swabs or lower respiratory tract samples, according to WHO guidance [8, 21]. During the second wave, more a- or oligosymptomatic patients with positive RT-PCR tests were hospitalised for non-COVID-19 reasons such as childbirth or trauma. In November 2020, rapid antigen testing was authorised by the Federal Office of Public Health in Switzerland. Hence, data for the second wave also include patients with positive rapid antigen tests. However, because of the lower predictive value for asymptomatic cases, we excluded patients without symptoms unless their rapid antigen results were confirmed by a positive RT-PCR test. We further excluded patients from the analysis if they did not provide general informed consent or if they had not yet been discharged when data collection was closed (20 January 2021).
All analysed data were collected as part of the clinical routine during the hospitalisation (from admission to discharge/death). We performed chart reviews and automatic export from the electronic health record (EHR), including vital signs and clinical characteristics upon admission, as well as sociodemographic factors, comorbidities based on pre-existing diagnoses and home medication. COVID-19-specific inpatient medication was assessed up to hospital discharge or death and exported from the EHR. Experimental treatment was offered to all suitable patients according to ongoing clinical trials and WHO guidelines [7, 8, 21]. The age-adjusted Charlson comorbidity index (ACCI) [22] and the Clinical Frailty Scale score (CFS) [23] were calculated for all patients as part of the clinical routine or through chart review. Laboratory values were available according to clinical routine and correspond to the first blood draw obtained within 24 hours from admission.
The primary endpoint was defined as all-cause in-hospital mortality. The secondary endpoints were admission to the intensive care unit (ICU), discharge to a rehabilitation facility and length of hospital stay (LOS). All endpoints were verified through chart review.
Discrete variables are expressed as frequency (percentage) and continuous variables as medians with interquartile ranges (IQR) for skewed data, or mean with standard deviation (SD, for normally distributed data. We used the Wilcoxon rank-sum test to compare continuous variables and the Pearson's chi-square test to compare categorical or binary variables. We investigated the association of baseline risk factors with the primary and secondary endpoints by performing logistic regression for binary dependent variables and ordinary least-squares linear regression for continuous variables. Odds ratios (ORs) and regression coefficients were calculated with corresponding 95% confidence intervals (CIs), with p-values as measures of association and pi-values as measures of interaction. We calculated three models. The first model was unadjusted (model 0). The second (model 1) was adjusted for sex, ACCI, CFS and immunomodulating home medication and the fully adjusted model 2 was further adjusted for time from symptom onset to admission and transfer from other hospitals. We also investigated subgroups of age, sex, ACCI and CFS, as well as ICU admission as sensitivity analyses. Overall model probability for adjusted ORs (aOR) was evaluated based on likelihood ratio chi-square tests and p-values for individual factors were derived from Wald tests. We considered a two-sided p-value of <0.05 significant and calculated the unadjusted area under the receiver operating characteristic curve (AUC) as a measure of discrimination. Statistical analysis was performed using Stata 15.1 (StataCorp, College Station, TX, USA).
Figure 1 provides an overview of the study flow and table 1 shows overall patient demographics, comorbidities and vital signs on admission, as well as stratified according to the first and the second wave. In total, 486 patients hospitalised with a confirmed SARS-CoV-2 infection were included in this analysis (mean age 65.9 years ± 14.7 SD, 65% male). Patients had a medium burden of comorbidities with a median ACCI of 3 points, indicating an estimated 10-year survival of 77% [22], and a median CFS of 3 points, suggesting well-controlled medical problems [23]. Hypertension was the most common comorbidity, affecting 282 patients (58%), followed by obesity (n = 142, 30%), diabetes (n = 141, 29%) and chronic kidney disease (n = 106, 22%).
Figure 1 Overview of study flow. A total of 486 patients were included in the final analysis. ED = emergency department * includes psychiatric and rehabilitation care hospitals.
Table 1 Baseline characteristics and treatment of patients hospitalised with confirmed SARS-CoV-2 infection.
| Factor |
Overall
(n = 486) |
First wave
(n = 100) |
Second wave
(n = 386) |
p-value* |
|---|---|---|---|---|
| Pre-admission history | ||||
| Age (years), mean ± SD | 65.9 ± 14.7 | 65.8 ± 14.7 | 66.0 ± 14.8 | 0.90 |
| Age ≥ 65 years, n (%) | 276 (56.8%) | 54 (54.0%) | 222 (57.3%) | 0.53 |
| Sex, male, n (%) | 317 (65.2%) | 64 (64.0%) | 253 (65.5%) | 0.77 |
| Nationality, Swiss, n (%) | 272 (56.0%) | 61 (61.0%) | 211 (54.7%) | 0.26 |
| Transfer from other hospital, n (%) | 110 (22.6%) | 29 (29.0%) | 81 (21.0%) | 0.09 |
| Time from symptom onset to admission (days), median (IQR) | 7.0 (4.0–9.0) | 8.0 (4.0–11.0) | 7.0 (4.0–9.0) | 0.02 |
| Pre-existing home medication, n (%) | 406 (83.7%) | 80 (80.0%) | 326 (84.7%) | 0.26 |
| – Immunomodulating medication, n (%) | 44 (9.1%) | 5 (5.0%) | 39 (10.1%) | 0.11 |
| Presentation to emergency department | ||||
| Supplemental oxygen administered n (%) | 111 (22.8%) | 27 (27.0%) | 84 (21.8%) | 0.27 |
| FiO2 (%), mean ± SD | 64.3 ± 28.4 | 56.4 ± 26.8 | 66.8 ± 28.5 | 0.10 |
| Heart rate (bpm), mean ± SD | 90 ± 18 | 87± 15 | 91 ± 19 | 0.09 |
| Respiratory rate (rpm), mean ± SD | 21 ± 8 | 21 ± 8 | 21 ± 8 | 0.67 |
| Temperature (°C), mean ± SD | 37.6 ± 1.0 | 37.8 ± 0.8 | 37.6 ± 1.0 | 0.30 |
| Comorbidities | ||||
| ACCI, median (IQR) | 3.0 (2.0–5.0) | 3.0 (2.0–6.0) | 3.0 (2.0–5.0) | 0.36 |
| ACCI ≥4 points, n (%) | 232 (47.7%) | 45 (45.0%) | 187 (48.4%) | 0.54 |
| CFS, median (IQR) | 3.0 (2.0–5.0) | 3.0 (2.0–4.0) | 3.0 (2.0–5.0) | 0.41 |
| CFS ≥4 points, n (%) | 173 (35.6%) | 29 (29.0%) | 144 (37.3%) | 0.12 |
| Smoker, n (%) | 40 (12.2%) | 7 (9.2%) | 33 (13.1%) | 0.36 |
| Obesity (BMI >30 kg/m2), n (%) | 142 (30.2%) | 27 (27.0%) | 115 (31.1%) | 0.43 |
| Diabetes mellitus, n (%) | 141 (29.0%) | 22 (22.0%) | 119 (30.8%) | 0.08 |
| Hypertension, n (%) | 282 (58.0%) | 57 (57.0%) | 225 (58.3%) | 0.82 |
| Coronary artery disease, n (%) | 93 (19.1%) | 25 (25.0%) | 68 (17.6%) | 0.09 |
| Chronic heart failure (LVEF<40%), n (%) | 14 (2.9%) | 3 (3.0%) | 11 (2.9%) | 0.94 |
| Bronchial asthma, n (%) | 29 (6.0%) | 16 (16.0%) | 13 (3.4%) | <0.01 |
| COPD, n (%) | 35 (7.2%) | 7 (7.0%) | 28 (7.3%) | 0.93 |
| OSAS, n (%) | 46 (9.5%) | 14 (14.0%) | 32 (8.3%) | 0.08 |
| Solid organ transplant, n (%) | 10 (2.1%) | 1 (1.0%) | 9 (2.3%) | 0.40 |
| Active rheumatic disease, n (%) | 13 (2.7%) | 2 (2.0%) | 11 (2.8%) | 0.64 |
| Cancer | 57 (11.7%) | 11 (11.0%) | 46 (11.9%) | 0.80 |
| Liver cirrhosis, n (%) | 4 (0.8%) | 0 (0.0%) | 4 (1.0%) | 0.31 |
| Chronic kidney disease, n (%) | 106 (21.8%) | 28 (28.0%) | 78 (20.2%) | 0.09 |
| SARS-CoV-2 infection treatment | ||||
| Experimental (antiviral) treatment | 86 (17.7%) | 46 (46.0%) | 40 (10.4%) | <0.01 |
| – Hydroxychloroquine† | 43 (8.9%) | 43 (43%) | 0 (0.0%) | n.a. |
| – Remdesivir† | 33 (6.8%) | 0 (0.0%) | 33 (8.6%) | n.a. |
| Antibiotic treatment | 114 (23.5%) | 41 (41.0%) | 73 (18.9%) | <0.01 |
| High-dose glucocorticoids | 293 (60.4%) | 0 (0.0%) | 293 (76.1%) | <0.01 |
ACCI = age-adjusted Charlson comorbidity index; BMI = body mass index; bpm = beats per minute; CFS = clinical frailty scale; COPD = chronic obstructive pulmonary disease; CRP = C-reactive protein; FiO2 = fraction of inspired oxygen; IQR = interquartile range; LVEF = left ventricular ejection fraction; n.a. = not applicable; OSAS = obstructive sleep apnoea syndrome; rpm = respirations per minute; SARS-CoV-2 = severe acute respiratory syndrome coronavirus type 2; SD = standard deviation Bold values denote statistical significance at the p≤0.05 level. * Wilcoxon rank-sum test for continuous variables, Pearson's chi-square test for binary variables † Alone or in combination with other medication
Overall, admission characteristics for patients in the first wave (n = 100) and the second wave (n = 386) did not differ considerably. However, during the second wave, median time of symptom onset to presentation to the ED was significantly shorter (8 days, IQR 4–11 vs 7 days, IQR 4–9; p = 0.02). Patients were generally tachypnoeic, with a mean respiratory rate of 21/min ± 8 SD, indicating high clinical severity. No other significant difference in clinical presentation was found between the first and the second wave.
Treatment regimens, on the other hand, were markedly different. During the first wave, both antiviral (n = 40, 10% vs n = 46, 46%; p <0.01) and antibiotic treatment (n = 73, 19% vs n = 41, 41%; p <0.01) were more common than during the second. Furthermore, hydroxychloroquine (n = 43, 43%) was used only during the first wave and remdesivir (n =3 3, 8.6%) and high-dose glucocorticoids (n = 293, 76%) exclusively during the second. Invasive ventilation was also noticeably less common during the second wave (n = 19, 19.0% vs n = 46, 11.9%; p = 0.06).
Table 2 provides an overview of patient outcomes. A more detailed version can be found in the appendix (table S1). Overall, in-hospital death occurred in 92 patients (19%) and 92 patients (19%) were admitted to the ICU. After a median LOS of 7 days (IQR 4–13), most patients were discharged to home (n = 185, 38%) or rehabilitation care (n = 137, 28%).
Table 2 Outcomes overall and stratified by wave. Odds ratios and regression coefficients for wave (base = first wave).
|
Overall
(n = 486) |
First wave
(n = 100) |
Second Wave | p-value* |
aOR/coefficient† (95% CI), p-value
Model 2 |
||
|---|---|---|---|---|---|---|
| All-cause in-hospital mortality, n (%) | 92 (18.9%) | 19 (19.0%) | 73 (18.9%) | 0.98 | aOR | 1.18 (0.49 to 2.80), 0.71 |
| Time to death (days), median (IQR) | 10.0 (4.0–19.0) | 15.0 (5.0–24.0) | 9.0 (4.0–17.0) | 0.07 | Coefficient | −0.68† (−6.14 to 4.77), 0.80 |
| ICU admission, n (%) | 92 (18.9%) | 24 (24.0%) | 68 (17.6%) | 0.15 | aOR | 0.98 (0.46 to 2.06), 0.95 |
| Time to ICU (days), median (IQR) | 1.0 (0.0–3.0) | 0.5 (0.0–3.0) | 1.0 (0.0–4.0) | 0.70 | Coefficient | −0.10† (−2.12 to 1.92), 0.92 |
| ICU LOS (days), median (IQR) | 9.0 (4.0–15.0) | 9.0 (4.0–19.0) | 9.0 (4.0–14.0) | 0.59 | Coefficient | −1.78† (−6.45 to 2.89), 0.45 |
| Invasive ventilation, n (%) | 65 (13.4%) | 19 (19.0%) | 46 (11.9%) | 0.06 | aOR | 0.73 (0.33 to 1.64), 0.44 |
| Hospital LOS (days), median (IQR) | 7.0 (4.0–13.0) | 9.0 (4.5–15.0) | 6.5 (3.0–13.0) | 0.03 | Coefficient | −2.53 † (−4.51 to −0.54), 0.01 |
| Discharge status‡ | ||||||
| – Home care, n (%) | 185 (38.1%) | 47 (47.0%) | 138 (35.8%) | 0.04 | aOR | 0.55 (0.29 to 1.03), 0.06 |
| – Rehabilitation care, (n (%) | 137 (28.2%) | 18 (18.0%) | 119 (30.8%) | 0.01 | aOR | 2.06 (1.04 to 4.07), 0.04 |
| – Other hospital, n (%) | 51 (10.5%) | 16 (16.0%) | 35 (9.1%) | 0.04 | aOR | 0.58 (0.24 to 1.37), 0.21 |
| – Nursing facility | 20 (4.1%) | 0 (0.0%) | 20 (5.2%) | 0.02 | n.a. | |
| – Unknown | 1 (0.2%) | 0 (0.0%) | 1 (0.3%) | 0.61 | n.a. | |
ACCI = age-adjusted Charlson comorbidity index; aOR = adjusted odds ratio; CFS = clinical frailty scale; CI = confidence interval; ICU = intensive care unit; IQR = interquartile range; LOS = length of stay; n.a. = not applicable Bold values denote statistical significance at the p ≤0.05 level. * Wilcoxon rank-sum test for continuous variables, Pearson's chi-square test for binary variables † Regression coefficients for continuous dependent variables ‡ Other than death Model 2 adjusted for sex, ACCI, CFS, immunomodulating home medication, time from symptom onset to admission, transfer from other hospital.
In-hospital mortality was similar during the first (19/100, 19%) and second waves (73/386, 19%), which was confirmed in the adjusted regression analysis (adjusted OR [aOR] 1.18, 95% CI 0.49–2.80; p = 0.71).
Risk of ICU admission in the first and second wave was similar (24% vs 18%, aOR 0.98, 95% CI 0.46–2.06; p = 0.95). There were more transfers to rehabilitation facilities in the second wave (18% vs 31%, aOR 2.06, 95% CI 1.04–4.07; p = 0.04) and LOS was 2.5 days shorter (9 vs 6.5 days, adjusted difference −2.53 days, 95% CI −4.51 to −0.54; p = 0.01).
Figure 2 illustrates the subgroup analysis for the primary endpoint. Though the overall aOR for wave suggests a trend toward the second wave (1.18, 95% CI 0.49–2.80; p = 0.71), the results were not significant. Similarly, none of the analysed subgroups provided evidence for effect modification between variables.
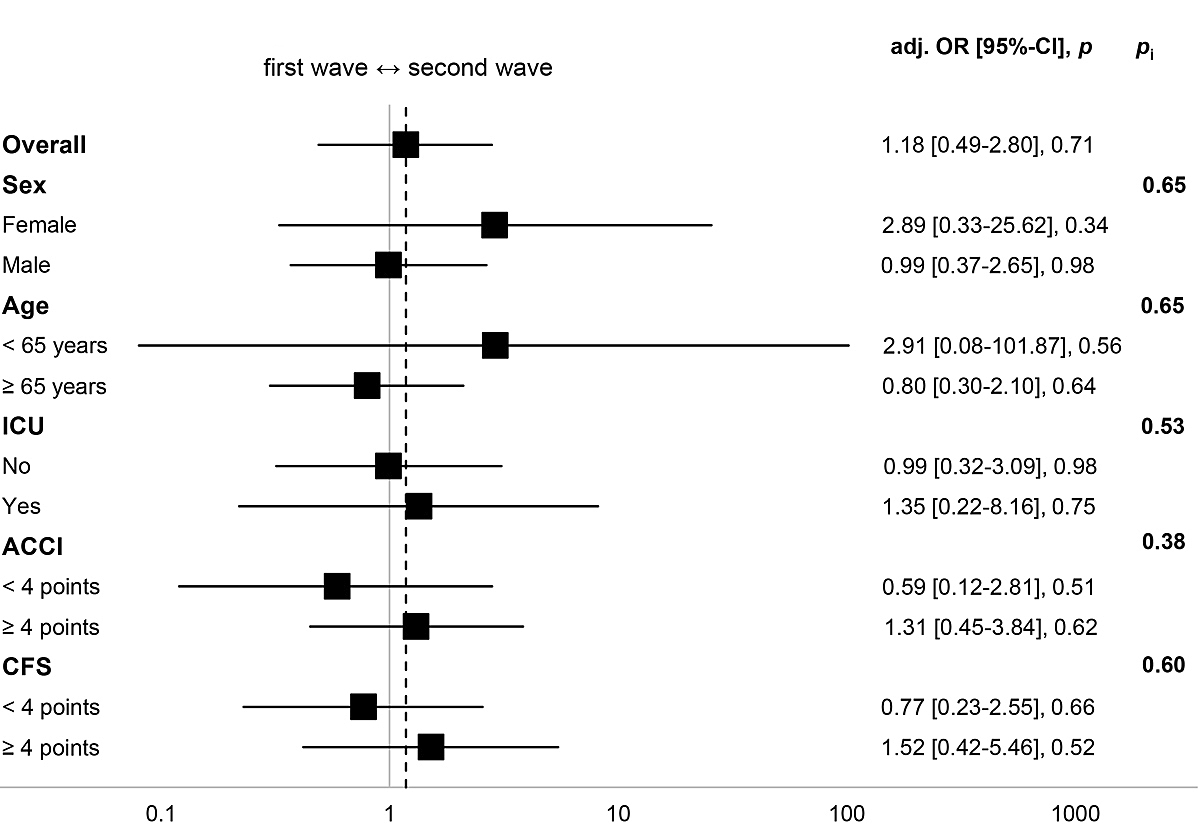
Figure 2 Subgroup analysis for all-cause in-hospital mortality. Fully adjusted OR (Model 2) for wave (base = first wave). Higher ACCI/CFS scores indicate higher burden of comorbidity/frailty. Model 2 adjusted for sex, ACCI, CFS, immunomodulating home medication, time from symptom onset to admission, transfer from other hospital.
The subgroup analysis for ICU admission is summarised in figure 3. Overall, there was no significant difference between waves (aOR 0.98, 95% CI 0.46–2.06; p = 0.95). The results suggest, however, that women (aOR 0.32, 95% CI 0.06–1.71; p = 0.18) and patients with a higher frailty score (CFS ≥4: aOR 0.19, 95% CI 0.03–1.42; p = 0.11) were less often admitted to the ICU during the second wave. Again, effect modifications were not significant.
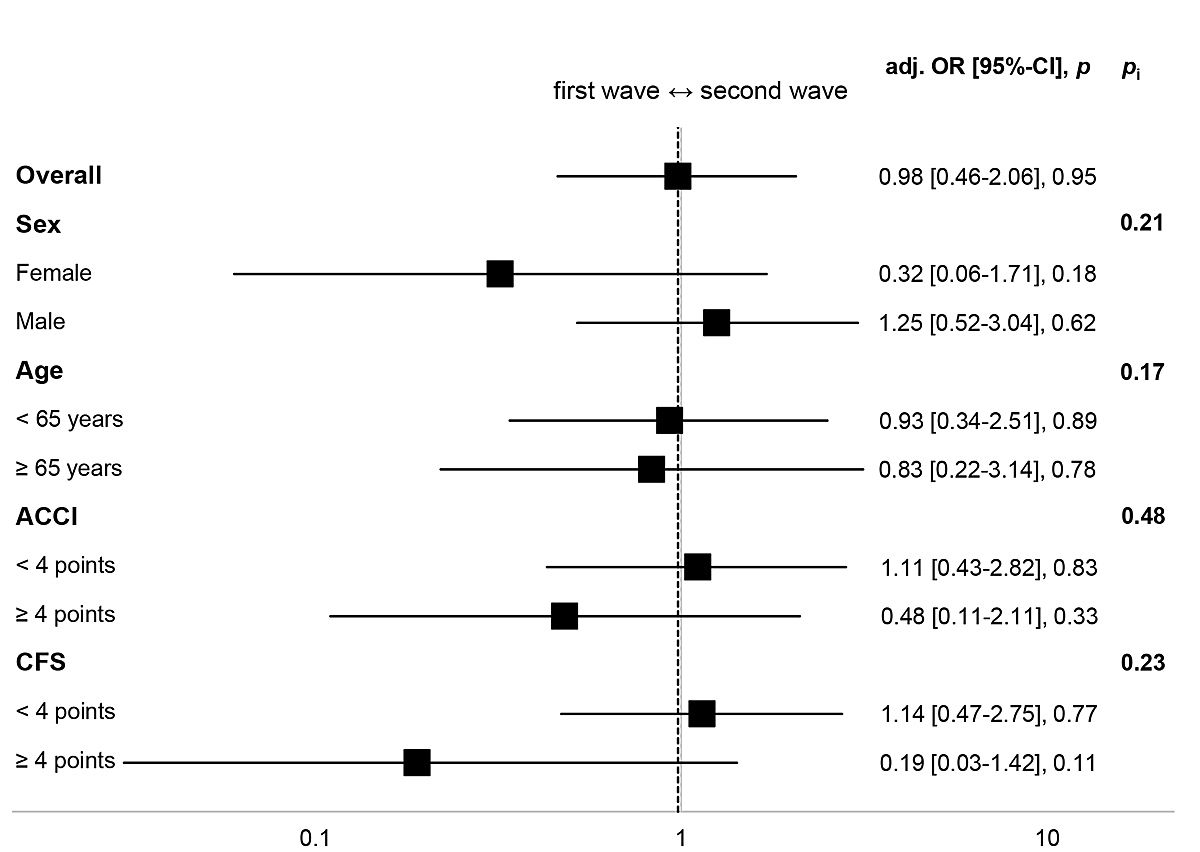
Figure 3 Subgroup analysis for ICU admission. Fully adjusted OR (Model 2) for wave (base = first wave). Higher ACCI/CFS scores indicate higher burden of comorbidity/frailty. Model 2 adjusted for sex, ACCI, CFS, immunomodulating home medication, time from symptom onset to admission, transfer from other hospital.
We performed a sensitivity analysis with stratification of patients based on frailty (CFS cut-off value of ≤3 points) in order to understand whether mortality differed between waves among patients who potentially qualified for intensive care treatment. We found no statistically significant difference in mortality for patients with a low frailty score (n = 7, 14% vs n = 19, 9%; p = 0.31; aOR 0.77. 95% CI 0.23–2.55; p = 0.66).
The overview in table 3 shows association and predictive accuracy of baseline characteristics for in-hospital mortality, as indicated by their aOR and AUC values respectively. A more detailed table can be found in the appendix (table S2). Overall, non-survivors were older (mean 74.2 years ± 9.8 SD vs 64 years ± 15.0 SD; p <0.01), more often male (n = 68, 74% vs n = 249, 63%; p = 0.05) and had a higher burden of comorbidities (ACCI median 5, IQR 4–7 vs 3, IQR 2–5; p <0.01). Likewise, patients who died scored higher on the CFS than survivors (median 4, IQR 4–6 vs 3, IQR 2–4; p <0.01). They were also more likely to receive supplemental oxygen upon presentation (n = 45, 49% vs n = 66, 17%; p <0.01). Regression model 2 revealed a positive association of in-hospital death with all of the aforementioned factors, with the highest association for age ≥65 years (aOR 4.47, 95% CI 1.63–12.26; p <0.01) and supplemental oxygen (aOR 7.32, 95% CI 3.27–16.38; p <0.01).
Table 3 Association of baseline characteristics and vital signs upon admission stratified by all-cause in-hospital mortality.
| Factor |
Survivors
(n = 394) |
Non-Survivors
(n = 92) |
p-value* | AUC (95% CI) |
aOR (95% CI), p-value
Model 2 |
|---|---|---|---|---|---|
| Pre-admission history | |||||
| Age (years), mean ± SD | 64.0 ± 15.0 | 74.2 ± 9.8 | <0.01 | 0.71 (0.66–0.76) | 1.07 (1.02–1.12), <0.01 |
| Age ≥65 years, n (%) | 197 (50.0%) | 79 (85.9%) | <0.01 | 0.68 (0.64–0.72) | 4.47 (1.63–12.26), <0.01 |
| Sex, male, n (%) | 249 (63.2%) | 68 (73.9%) | 0.05 | 0.55 (0.50–0.60) | 2.35 (1.02–5.42), 0.04 |
| Transfer from other hospital, n (%) | 86 (21.8%) | 24 (26.1%) | 0.38 | 0.52 (0.47–0.57) | 1.06 (0.44–2.53), 0.90 |
| Time from symptom onset to admission (days), median (IQR) | 7.0 (4.0–10.0) | 7.0 (3.0–9.0) | 0.27 | 0.46 (0.38–0.54) | 0.97 (0.91–1.04), 0.37 |
| Pre-existing home medication, n (%) | 319 (81.2%) | 87 (94.6%) | <0.01 | 0.57 (0.54–0.60) | 1.38 (0.37–5.12), 0.63 |
| – Immunomodulating medication, n (%) | 33 (8.4%) | 11 (12.0%) | 0.28 | 0.52 (0.48–0.55) | 1.44 (0.51–4.04), 0.49 |
| Presentation to emergency department | |||||
| Supplemental oxygen administered, n (%) | 66 (16.8%) | 45 (48.9%) | <0.01 | 0.66 (0.61–0.72) | 7.33 (3.28–16.38), <0.01 |
| FiO2 (%), mean ± SD | 59.0 ± 28.5 | 72.0 ± 26.7 | 0.02 | 0.64 (0.54–0.74) | 1.05 (1.01–1.08), 0.01 |
| Heart rate (bpm), mean ± SD | 88.9 ± 16.4 | 93.2 ± 22.9 | 0.06 | 0.57 (0.50–0.64) | 1.01 (0.99–1.03), 0.20 |
| Respiratory rate (rpm), mean ± SD | 20.7 ± 7.2 | 21.0 ± 11.0 | 0.80 | 0.53 (0.44–0.62) | 1.04 (0.99–1.09), 0.10 |
| Temperature (°C), mean ± SD | 37.7 ± 0.9 | 37.6 ± 1.0 | 0.52 | 0.48 (0.41–0.56) | 0.96 (0.64–1.43), 0.83 |
| Comorbidities | |||||
| ACCI, median (IQR) | 3.0 (2.0–5.0) | 5.0 (4.0–7.0) | <0.01 | 0.73 (0.69–0.78) | 1.27 (1.09–1.48), <0.01 |
| ACCI ≥4 points, n (%) | 158 (40.1%) | 74 (80.4%) | <0.01 | 0.70 (0.65–0.75) | 2.94 (0.94–9.24), 0.07 |
| CFS, median (IQR) | 3.0 (2.0–4.0) | 4.0 (3.0–6.0) | <0.01 | 0.67 (0.60–0.73) | 1.18 (0.90–1.55), 0.23 |
| CFS ≥4 points, n (%) | 169 (42.9%) | 66 (71.7%) | <0.01 | 0.64 (0.59–0.70) | 1.02 (0.29–3.62), 0.98 |
| Smoker, n (%) | 33 (12.6%) | 7 (10.8%) | 0.69 | 0.49 (0.45–0.53) | 0.80 (0.21–3.01), 0.74 |
| Obesity (BMI >30 kg/m2), n (%) | 118 (30.6%) | 24 (28.2%) | 0.66 | 0.49 (0.43–0.54) | 0.62 (0.28–1.39), 0.25 |
| Diabetes, n (%) | 109 (27.7%) | 32 (34.8%) | 0.18 | 0.54 (0.48–0.59) | 1.05 (0.49–2.22), 0.90 |
| Hypertension, n (%) | 220 (55.8%) | 62 (67.4%) | 0.04 | 0.56 (0.50–0.61) | 0.58 (0.27–1.25), 0.16 |
| Coronary artery disease, n (%) | 61 (15.5%) | 32 (34.8%) | <0.01 | 0.60 (0.54–0.65) | 1.09 (0.47–2.50), 0.85 |
| Chronic heart failure (LVEF <40%), n (%) | 11 (2.8%) | 3 (3.3%) | 0.80 | 0.50 (0.48–0.52) | 0.56 (0.06–5.37), 0.61 |
| Bronchial asthma, n (%) | 24 (6.1%) | 5 (5.4%) | 0.81 | 0.50 (0.47–0.52) | 1.34 (0.34–5.21), 0.67 |
| COPD, n (%) | 25 (6.3%) | 10 (10.9%) | 0.13 | 0.52 (0.49–0.56) | 1.80 (0.61–5.34), 0.29 |
| OSAS, n (%) | 31 (7.9%) | 15 (16.3%) | 0.01 | 0.54 (0.50–0.58) | 1.28 (0.46–3.57), 0.63 |
| Solid organ transplant, n (%) | 9 (2.3%) | 1 (1.1%) | 0.47 | 0.49 (0.48–0.51) | 0.20 (0.02–2.31), 0.20 |
| Active rheumatic disease, n (%) | 8 (2.0%) | 5 (5.4%) | 0.07 | 0.52 (0.49–0.54) | 4.33 (0.85–22.17), 0.08 |
| Cancer, n (%) | 38 (9.6%) | 19 (20.7%) | <0.01 | 0.56 (0.51–0.60) | 0.47 (0.15–1.43), 0.18 |
| Liver cirrhosis, n (%) | 2 (0.5%) | 2 (2.2%) | 0.11 | 0.51 (0.49–0.52) | n.a. |
| Chronic kidney disease, n (%) | 68 (17.3%) | 38 (41.3%) | <0.01 | 0.62 (0.57–0.67) | 2.25 (1.02–4.96), 0.04 |
ACCI = age-adjusted Charlson comorbidity index; aOR = adjusted odds ratio; AUC = area under the receiver operating characteristic curve; BMI = body mass index; bpm = beats per minute; CFS = clinical frailty scale; COPD = chronic obstructive pulmonary disease; CRP = C-reactive protein; FiO2 = fraction of inspired oxygen; IQR = interquartile range; LVEF = left ventricular ejection fraction; OSAS = obstructive sleep apnoea syndrome; rpm = respirations per minute; SD = standard deviation; n.a. = not applicable Bold values denote statistical significance at the p ≤0.05 level. * Wilcoxon rank-sum test for continuous variables, Pearson’s chi-square test for binary variables Model 2 adjusted for sex, ACCI, CFS, immunomodulating home medication, time from symptom onset to admission, transfer from other hospital
The predictive accuracy of these factors ranged from moderate to high, especially age (AUC 0.71, 95% CI 0.66–0.76) and ACCI (AUC 0.73, 95% CI 0.69–0.78). Interestingly, male sex showed low prognostic value (AUC 0.55, 95% CI 0.50–0.60) and was not significantly associated with in-hospital mortality at all when we looked at only second wave patients (data not shown).
Table 4 shows association and discrimination results for baseline characteristics and ICU admission. A more detailed table can be found in the appendix (table S3). Patients admitted to the ICU were younger (mean 63.2 years ± 11.0 SD vs 66.6 years ± 15.4 SD, p = 0.05), more often male (n = 72, 78% vs n = 245, 62%; p <0.01) and admitted from other hospitals more often (n = 42, 46% vs n = 68, 17%; p <0.01). Although the burden of comorbidities and frailty were generally lower, patients admitted to the ICU were more often obese (BMI >30 kg/m2 n = 34, 40% vs n = 108, 28%; p = 0.03). After full adjustment (model 2), transfer from another hospital (aOR 4.33, 95% CI 2.21–8.48; p <0.01) and oxygen supplementation (aOR 6.14, 95% CI 3.02–12.49; p <0.01) showed the highest association. Significant negative association was found for frailty (CFS aOR 0.66, 95% CI 0.46–0.93; p = 0.02) and immunomodulating home medication (aOR 0.66, 95% CI 0.46–0.92; p = 0.02).
Table 4 Association and discrimination of baseline characteristics and vital signs upon admission stratified by ICU admission.
| Factor |
No ICU
(n = 394) |
ICU admission
(n = 92 |
p-value* | AUC (95% CI) |
aOR (95% CI), p-value
Model 2 |
|---|---|---|---|---|---|
| Pre-admission history | |||||
| Age (years), mean ± SD | 66.6 ± 15.4 | 63.2 ± 11.0 | 0.05 | 0.41 (0.35–0.46) | 1.00 (0.97–1.03), 0.88 |
| Age ≥65 years, n (%) | 233 (59.1%) | 43 (46.7%) | 0.03 | 0.44 (0.38–0.50) | 0.84 (0.38–1.84), 0.66 |
| Sex, male, n (%) | 245 (62.2%) | 72 (78.3%) | <0.01 | 0.58 (0.53–0.63) | 2.96 (1.33–6.59), 0.01 |
| Transfer from other hospital, n (%) | 68 (17.3%) | 42 (45.7%) | <0.01 | 0.64 (0.59–0.70) | 4.43 (2.28–8.63), <0.01 |
| Time from symptom onset to admission (days), median (IQR) | 7.0 (4.0–9.0) | 8.0 (5.0–10.0) | 0.04 | 0.57 (0.51–0.64) | 1.02 (0.96–1.08), 0.56 |
| Pre-existing home medication, n (%) | 327 (83.0%) | 79 (86.8%) | 0.37 | 0.52 (0.48–0.56) | 2.94 (1.19–7.29), 0.02 |
| – Immunomodulating medication, n (%) | 37 (9.4%) | 7 (7.6%) | 0.59 | 0.49 (0.46–0.52) | 0.51 (0.14–1.86), 0.31 |
| Presentation to emergency department | |||||
| Supplemental oxygen administered, n (%) | 62 (15.7%) | 49 (53.3%) | <0.01 | 0.69 (0.63–0.74) | 5.71 (2.83–11.53), <0.01 |
| FiO2 (%), mean ± SD | 53.3 ± 25.8 | 78.3 ± 25.3 | <0.01 | 0.75 (0.66–0.84) | 1.06 (1.02–1.09), <0.01 |
| Heart rate (bpm), mean ± SD | 89.5 ± 17.9 | 91.1 ± 18.5 | 0.51 | 0.52 (0.44–0.59) | 1.00 (0.98–1.02), 0.81 |
| Respiratory rate (rpm), mean ± SD | 20.9 ± 7.0 | 20.6 ± 11.4 | 0.85 | 0.54 (0.45–0.64) | 1.02 (0.98–1.07), 0.31 |
| Temperature (°C), mean ± SD | 37.6 ± 1.0 | 37.8 ± 0.7 | 0.24 | 0.55 (0.49–0.62) | 1.00 (0.69–1.44), 0.99 |
| Comorbidities | |||||
| ACCI, median (IQR) | 4.0 (2.0–6.0) | 3.0 (2.0–4.0) | <0.01 | 0.41 (0.36–0.47) | 1.03 (0.87–1.22), 0.72 |
| ACCI ≥4 points, n (%) | 201 (51.0%) | 31 (33.7%) | <0.01 | 0.41 (0.36–0.47) | 0.42 (0.13–1.36), 0.15 |
| CFS, median (IQR) | 3.0 (2.0–5.0) | 3.0 (2.0–3.0) | <0.01 | 0.34 (0.28–0.40) | 0.66 (0.46–0.92), 0.02 |
| CFS ≥4 points, n (%) | 198 (50.3%) | 37 (40.2%) | 0.08 | 0.45 (0.39–0.51) | 1.34 (0.35–5.18), 0.67 |
| Smoker, n (%) | 32 (12.3%) | 8 (11.9%) | 0.93 | 0.50 (0.45–0.54) | 1.54 (0.57–4.17), 0.39 |
| Obesity (BMI >30 kg/m2), n (%) | 108 (28.1%) | 34 (40.0%) | 0.03 | 0.56 (0.50–0.62) | 1.99 (1.03–3.85), 0.04 |
| Diabetes, n (%) | 113 (28.7%) | 28 (30.4%) | 0.74 | 0.51 (0.46–0.56) | 1.47 (0.68–3.16), 0.33 |
| Hypertension, n (%) | 233 (59.1%) | 49 (53.3%) | 0.30 | 0.47 (0.41–0.53) | 0.94 (0.49–1.80), 0.85 |
| Coronary artery disease, n (%) | 75 (19.0%) | 18 (19.6%) | 0.91 | 0.50 (0.46–0.55) | 1.30 (0.56–3.05), 0.54 |
| Chronic heart failure (LVEF <40%), n (%) | 13 (3.3%) | 1 (1.1%) | 0.26 | 0.49 (0.48–0.50) | 1.30 (0.13–13.03), 0.82 |
| Bronchial asthma, n (%) | 23 (5.8%) | 6 (6.5%) | 0.80 | 0.50 (0.48–0.53) | 0.94 (0.28–3.17), 0.92 |
| COPD, n (%) | 31 (7.9%) | 4 (4.3%) | 0.24 | 0.48 (0.46–0.51) | 1.06 (0.26–4.33), 0.93 |
| OSAS, n (%) | 35 (8.9%) | 11 (12.0%) | 0.36 | 0.52 (0.48–0.55) | 1.68 (0.63–4.53), 0.30 |
| Solid organ transplant, n (%) | 9 (2.3%) | 1 (1.1%) | 0.47 | 0.49 (0.48–0.51) | 0.79 (0.06–11.3), 0.86 |
| Active rheumatic disease, n (%) | 9 (2.3%) | 4 (4.3%) | 0.27 | 0.51 (0.49–0.53) | 3.81 (0.66–22.12), 0.14 |
| Cancer, n (%) | 50 (12.7%) | 7 (7.6%) | 0.17 | 0.47 (0.44–0.51) | 1.13 (0.33–3.86), 0.85 |
| Liver cirrhosis, n (%) | 4 (1.0%) | 0 (0.0%) | 0.33 | 0.49 (0.49–0.50) | n.a. |
| Chronic kidney disease, n (%) | 93 (23.6%) | 13 (14.1%) | 0.05 | 0.45 (0.41–0.49) | 1.50 (0.59–3.77), 0.39 |
ACCI = age-adjusted Charlson comorbidity index; AUC = area under the receiver operating characteristic curve; BMI = body mass index; bpm = beats per minute; CFS = clinical frailty scale; COPD = chronic obstructive pulmonary disease; CRP = C-reactive protein; FiO2 = fraction of inspired oxygen; IQR = interquartile range; LVEF = left ventricular ejection fraction; OR = odds ratio; OSAS = obstructive sleep apnoea syndrome; rpm = respirations per minute; SD = standard deviation; n.a. = not applicable Bold values denote statistical significance at the p ≤0.05 level. * Wilcoxon rank-sum test for continuous variables, Pearson’s chi-square test for binary variables Model 2 adjusted for sex, ACCI, CFS, immunomodulating home medication, time from symptom onset to admission, transfer from other hospital
Predictive accuracy of the analysed factors for ICU admission varied considerably, with FiO2 (AUC 0.75, 95% CI 0.660.84), administration of supplemental oxygen in the ED (AUC 0.69, 95% CI 0.63–0.74) and the CFS (AUC 0.34, 95% CI 0.28–0.40) yielding the strongest results.
To our knowledge, this study offers one of the first comparisons of consecutively hospitalised COVID-19 patients during the first and second waves of SARS-CoV-2 cases in Switzerland. Our results indicate only minor differences in clinical presentation, mortality and ICU admission, despite differing treatment regimens. However, LOS was 2.5 days shorter and patients were more likely to be discharged to rehabilitation care during the second wave.
The similarity of outcomes was surprising, as we had anticipated a reduction in mortality risks due to the increased experience regarding medical and supportive handling of COVID-19 patients and the more wide-spread use of high-dose glucocorticoids, which has been associated with lower mortality [11]. It is worth noting, though, that in a sensitivity analysis patients with a low frailty score, who potentially qualified for intensive care treatment, had a lower numerical mortality risk in the second wave, which, however, was not statistically significant. Clearly, our monocentric analysis was limited by a small sample size and patient selection regarding in-hospital treatment was potentially biased. For example, as a tertiary care centre, deteriorating patients were transferred to our institution if they were in need of more intensive treatment and milder cases were sent to peripheral hospitals, especially when fewer beds were available. In contrast, we discharged patients with milder symptoms to peripheral hospitals, leading to higher mortality rates in our hospital compared with those previously reported for other Swiss hospitals (19% vs 15%) [19].
Interestingly, figures from the Swiss Federal Office of Public Health show that overall mortality per 100,000 inhabitants has markedly changed between the waves in Switzerland, with a higher rate during the second wave [6]. However, for the canton of Aargau, where our hospital is situated, there was little difference between waves, which is reflected in our own results. Because epidemiological data are not adjusted for important differences in patient demographics, such as age and comorbidities, our data provide more detailed insights.
Since data from other countries regarding the second wave, particularly as observed in Europe, are only slowly becoming available, an international comparison is difficult. A study from Japan, where SARS-CoV-2 infection cases rose again during June and July 2020, reported lower mortality for patients admitted during their second wave (1.2% vs 7.3%) [24]. Similarly, two different database studies from the US reported 22.8% mortality based on data from spring 2020 and 13.6% for data from April to October 2020 [25, 26]. More easily comparable data from Europe can be found in a Spanish study that reported slightly lower mortality (17% vs 15%) and a significantly lower risk for death in the second wave (aOR 0.52, 95% CI 0.31–0.85) [27]. However, their adjustment model was based on factors very different from ours, namely diabetes, age, lymphocytes, oxygen saturation and pH [27]. In contrast, figures from French ICU patients showed the same lack of change in mortality as our own data (50% vs 52%) while also noting that treatment regimens differed between waves, particularly regarding anticoagulation and glucocorticoid use [28].
The analysis of prognostic indicators in our sample showed ACCI and age as strong predictors of in-hospital mortality. However, they do not represent life expectancy and quality of life accurately. Thus, when, during a crisis such as the current pandemic, resources are limited and decisions have to be made on which patients profit the most from intensive care, more factors should be considered. This has already been recognised by the Swiss Academy of Medical Sciences (SAMS) and the Swiss Society of Intensive Care Medicine, which developed and revised the national guidelines for ICU triage. These guidelines do not include age as a direct decision criterion. Instead, frailty (as measured by the CFS) was added as an important criterion for risk prediction in November 2020 [17, 29]. This recommendation is reflected in our data, as patients with a higher frailty score were less likely to be admitted to the ICU, especially during the second wave. However, we found no significant association between the CFS and in-hospital mortality, and its predictive accuracy was noticeably lower than that of age or ACCI. If validated in larger studies, the use of frailty instead of age for making decisions regarding the most effective allocation of resources may be challenged.
Patient management is another important area where efficacy is key. In this regard, our results show a substantial decrease in LOS during the second wave (9 vs 6.5 days), indicating improved discharge processes. There are several possible reasons for this reduction. First, more patients were discharged to rehabilitation care during the second wave, allowing shorter hospital stays as many rehabilitation clinics changed their admission criteria over the course of the pandemic. At the same time, the number of patients needing rehabilitation care after elective surgery decreased markedly during the pandemic, opening up rehabilitation beds for other patients. Second, the use of high-dose glucocorticoids may have blunted the inflammatory response in some patients, allowing earlier discharge. Similar findings have already been observed in our trial investigating community-acquired pneumonia [30]. Third, fewer patients were enrolled in therapeutic trials, which might have prevented discharge until study-drug administration was completed. Finally, the increased experience of healthcare teams regarding the management of COVID-19 patients may have translated into earlier discharge decisions.
Other recent studies report median LOS ranging from 3 days in Iran during spring 2020 [31] to 8 days in Germany (spring-summer 2020) [32] and 8.9 days in the US (spring 2020). A different study from the US using data from April to October 2020 found a median LOS of 5 days, suggesting that other regions also see a reduction in LOS similar to ours [25]. More recently, a Spanish report also found a shorter LOS during the second wave (10 vs 9 days, p <0.01) [27]. However, their LOS was noticeably longer than ours and unadjusted. Further data regarding LOS in the second wave are scarce. Recently, a Swiss-wide surveillance study of patients hospitalised between February and September 2020 was published but did not include data on LOS [19]. Hence, further research on patient characteristics, predictors and outcomes is urgently needed, so we do not miss the opportunity to adjust and improve treatment and management accordingly.
There are certain limitations to our study. First, our findings are limited to hospitalised patients in a single centre. Our analysis might have also missed factors that are responsible for both COVID-19-related mortality and prevention of hospitalisation at our clinic. Another important limitation is missing data in our data set, which mostly concerned vital signs and were not available for up to a third of patients. Further data was missing for symptom start and the CFS (24% and 13%, respectively), two important factors featured in our adjusted regression models. Thus, as observations were dropped for the multiple logistic regression models, power was reduced and representativeness of the results might be biased. However, we deemed both factors too important to exclude them from our analysis. Furthermore, we had to exclude four patients who were still hospitalised when data collection closed, thus possibly introducing a bias based on disease severity. Finally, our analysis was not adjusted for multiple comparisons, which may have increased the risk for type I errors and our results in this regard should be considered hypothesis-generating and not final.
This analysis provides insights into consecutively hospitalised patients with confirmed COVID-19 at a Swiss tertiary care hospital during the first and second wave of the pandemic. While treatment regimens clearly differed, mortality and ICU admission remained largely unchanged. However, the reduced LOS and increased discharge rate to rehabilitation clinics suggest patient management became more efficient over the course of the pandemic.
Table S1 Outcomes overall and stratified by wave. Odds ratios and regression coefficients for wave (base = first wave).
|
Overall
(n = 486) |
First wave
(n = 100) |
Second wave
(n = 386 |
p-value* | OR/coefficient† (95% CI), p-value | |||
|---|---|---|---|---|---|---|---|
| Unadjusted | Model 1 | Model 2 | |||||
| All-cause in-hospital mortality, n (%) | 92 (18.9%) | 19 (19.0%) | 73 (18.9%) | 0.98 | 0.99 (0.57 to 1.74), 0.98 | 1.27 (0.60 to 2.67), 0.53 | 1.18 (0.49 to 2.80), 0.71 |
| Time to death (days), median (IQR) | 10.0 (4.0–19.0) | 15.0 (5.0–24.0) | 9.0 (4.0–17.0) | 0.07 | −3.86* (−8.50 to 0.79), 0.10 | −0.55* (−6.50 to 5.40), 0.85 | −0.68* (−6.14 to 4.77), 0.80 |
| ICU admission, n (%) | 92 (18.9%) | 24 (24.0%) | 68 (17.6%) | 0.15 | 0.68 (0.40 to 1.15), 0.15 | 0.70 (0.36 to 1.35), 0.29 | 0.98 (0.46 to 2.06), 0.95 |
| Time to ICU (days), median (IQR) | 1.0 (0.0–3.0) | 0.5 (0.0–3.0) | 1.0 (0.0–4.0) | 0.70 | 0.34* (−1.81 to 2.50), 0.75 | −0.16* (−3.02 to 2.69), 0.91 | −0.10* (−2.12 to 1.92), 0.92 |
| ICU LOS (days), median (IQR) | 9.0 (4.0–15.0) | 9.0 (4.0–19.0) | 9.0 (4.0–14.0) | 0.59 | −2.92* (−7.00 to 1.16), 0.16 | −1.36* (−5.50 to 2.78), 0.51 | −1.78* (−6.45 to 2.89), 0.45 |
| Invasive ventilation, n (%) | 65 (13.4%) | 19 (19.0%) | 46 (11.9%) | 0.06 | 0.58 (0.32 to 1.04), 0.07 | 0.61 (0.29 to 1.31), 0.21 | 0.73 (0.33 to 1.64), 0.44 |
| Hospital LOS (days), median (IQR) | 7.0 (4.0–13.0) | 9.0 (4.5–15.0) | 6.5 (3.0–13.0) | 0.03 | −1.91* (−4.05 to 0.23), 0.08 | −1.28* (−3.70 to 1.13), 0.30 | −2.53* (−4.51 to −0.54), 0.01 |
| Discharge status‡ | |||||||
| – Home care, n (%) | 185 (38.1%) | 47 (47.0%) | 138 (35.8%) | 0.04 | 0.63 (0.40 to 0.98), 0.04 | 0.60 (0.33 to 1.07), 0.08 | 0.55 (0.29 to 1.03), 0.06 |
| – Rehabilitation care, n (%) | 137 (28.2%) | 18 (18.0%) | 119 (30.8%) | 0.01 | 2.03 (1.17 to 3.53), 0.01 | 1.56 (0.87 to 2.80), 0.14 | 2.06 (1.04 to 4.07), 0.04 |
| – Other hospital, n (%) | 51 (10.5%) | 16 (16.0%) | 35 (9.1%) | 0.04 | 0.52 (0.28 to 0.99), 0.05 | 0.53 (0.24 to 1.17), 0.12 | 0.58 (0.24 to 1.37), 0.21 |
| – Nursing facility | 20 (4.1%) | 0 (0.0%) | 20 (5.2%) | 0.02 | n.a. | n.a. | n.a. |
| – Unknown | 1 (0.2%) | 0 (0.0%) | 1 (0.3%) | 0.61 | n.a. | n.a. | n.a. |
ACCI = age-adjusted Charlson comorbidity index; CFS = clinical frailty scale; CI = confidence interval; ICU = intensive care unit; IQR = interquartile range; LOS = length of stay; n.a. = not applicable; OR = odds ratio Bold values denote statistical significance at the p ≤0.05 level. * Wilcoxon rank-sum test for continuous variables, Pearson's chi-square test for binary variables † Regression coefficients for continuous dependent variables ‡ Other than death Model 1 adjusted for sex, ACCI, CFS, immunomodulating home medication Model 2 adjusted for sex, ACCI, CFS, immunomodulating home medication, time from symptom onset to admission, transfer from other hospital.
Table S2 Association of baseline characteristics and vital signs upon admission stratified by all-cause in-hospital mortality.
| Factor |
Survivors
(n = 394) |
Non-Survivors
(n = 92) |
p-value* | AUC (95%-CI) | OR (95% CI), p-value | aOR (95% CI), p-value | |
|---|---|---|---|---|---|---|---|
| Unadjusted | Model 1 | Model 2 | |||||
| Pre-admission history | |||||||
| Age (years), mean ± SD | 64.0 ± 15.0 | 74.2 ± 9.8 | <0.01 | 0.71 (0.66–0.76) | 1.06 (1.04–1.08), <0.01 | 1.03 (1.00–1.06), 0.09 | 1.07 (1.02–1.12), <0.01 |
| Age ≥65 years, n (%) | 197 (50.0%) | 79 (85.9%) | <0.01 | 0.68 (0.64–0.72) | 6.08 (3.27–11.29), <0.01 | 2.99 (1.31–6.85), <0.01 | 4.47 (1.63–12.26), <0.01 |
| Sex, male, n (%) | 249 (63.2%) | 68 (73.9%) | 0.05 | 0.55 (0.50–0.60) | 1.65 (0.99–2.74), 0.05 | 1.92 (1.02–3.63), 0.04 | 2.35 (1.02–5.42), 0.04 |
| Transfer from other hospital, n (%) | 86 (21.8%) | 24 (26.1%) | 0.38 | 0.52 (0.47–0.57) | 1.26 (0.75–2.13), 0.38 | 1.09 (0.55–2.16), 0.80 | 1.06 (0.44–2.53), 0.90 |
| Time from symptom onset to admission (days), median (IQR) | 7.0 (4.0–10.0) | 7.0 (3.0–9.0) | 0.27 | 0.46 (0.38–0.54) | 0.99 (0.94–1.05), 0.74 | 0.97 (0.91–1.04), 0.38 | 0.97 (0.91–1.04), 0.37 |
| Pre-existing home medication, n (%) | 319 (81.2%) | 87 (94.6%) | <0.01 | 0.57 (0.54–0.60) | 4.04 (1.58–10.29), <0.01 | 1.10 (0.39–3.16), 0.85 | 1.38 (0.37–5.12), 0.63 |
| – Immunomodulating medication, n (%) | 33 (8.4%) | 11 (12.0%) | 0.28 | 0.52 (0.48–0.55) | 1.49 (0.72–3.06), 0.28 | 1.05 (0.43–2.54), 0.92 | 1.44 (0.51–4.04), 0.49 |
| Presentation to emergency department | |||||||
| Supplemental oxygen administered, n (%) | 66 (16.8%) | 45 (48.9%) | <0.01 | 0.66 (0.61–0.72) | 4.76 (2.92–7.74), <0.01 | 4.08 (2.22–7.49), <0.01 | 7.33 (3.28–16.38), <0.01 |
| FiO2 (%), mean ± SD | 59.0 ± 28.5 | 72.0 ± 26.7 | 0.02 | 0.64 (0.54–0.74) | 1.02 (1.00–1.03), 0.02 | 1.02 (1.00–1.04), 0.05 | 1.05 (1.01–1.08), 0.01 |
| Heart rate (bpm), mean ± SD | 88.9 ± 16.4 | 93.2 ± 22.9 | 0.06 | 0.57 (0.50–0.64) | 1.01 (1.00–1.03), 0.06 | 1.01 (0.99–1.02), 0.42 | 1.01 (0.99–1.03), 0.20 |
| Respiratory rate (rpm), mean ± SD | 20.7 ± 7.2 | 21.0 ± 11.0 | 0.80 | 0.53 (0.44–0.62) | 1.00 (0.97–1.04), 0.80 | 1.02 (0.98–1.07), 0.27 | 1.04 (0.99–1.09), 0.10 |
| Temperature (°C), mean ± SD | 37.7 ± 0.9 | 37.6 ± 1.0 | 0.52 | 0.48 (0.41–0.56) | 0.92 (0.71–1.19), 0.52 | 0.90 (0.65–1.23), 0.51 | 0.96 (0.64–1.43), 0.83 |
| Comorbidities | |||||||
| ACCI, median (IQR) | 3.0 (2.0–5.0) | 5.0 (4.0–7.0) | <0.01 | 0.73 (0.69–0.78) | 1.33 (1.22–1.46), <0.01 | 1.25 (1.11–1.41), <0.01 | 1.27 (1.09–1.48), <0.01 |
| ACCI ≥4 points, n (%) | 158 (40.1%) | 74 (80.4%) | <0.01 | 0.70 (0.65–0.75) | 6.14 (3.53–10.68), <0.01 | 3.35 (1.29–8.67), 0.01 | 2.94 (0.94–9.24), 0.07 |
| CFS, median (IQR) | 3.0 (2.0–4.0) | 4.0 (3.0–6.0) | <0.01 | 0.67 (0.60–0.73) | 1.39 (1.20–1.61), <0.01 | 1.20 (1.00–1.45), 0.05 | 1.18 (0.90–1.55), 0.23 |
| CFS ≥4 points, n (%) | 169 (42.9%) | 66 (71.7%) | <0.01 | 0.64 (0.59–0.70) | 3.38 (2.06–5.55), <0.01 | 0.88 (0.33–2.33), 0.80 | 1.02 (0.29–3.62), 0.98 |
| Smoker, n (%) | 33 (12.6%) | 7 (10.8%) | 0.69 | 0.49 (0.45–0.53) | 0.84 (0.35–1.99), 0.69 | 0.88 (0.32–2.44), 0.81 | 0.80 (0.21–3.01), 0.74 |
| Obesity (BMI >30 kg/m2), n (%) | 118 (30.6%) | 24 (28.2%) | 0.66 | 0.49 (0.43–0.54) | 0.89 (0.53–1.50), 0.66 | 0.87 (0.46–1.64), 0.66 | 0.62 (0.28–1.39), 0.25 |
| Diabetes, n (%) | 109 (27.7%) | 32 (34.8%) | 0.18 | 0.54 (0.48–0.59) | 1.39 (0.86–2.26), 0.18 | 0.83 (0.45–1.53), 0.55 | 1.05 (0.49–2.22), 0.90 |
| Hypertension, n (%) | 220 (55.8%) | 62 (67.4%) | 0.04 | 0.56 (0.50–0.61) | 1.63 (1.01–2.64), 0.04 | 0.60 (0.33–1.11), 0.11 | 0.58 (0.27–1.25), 0.16 |
| Coronary artery disease, n (%) | 61 (15.5%) | 32 (34.8%) | <0.01 | 0.60 (0.54–0.65) | 2.91 (1.75–4.84), <0.01 | 1.31 (0.67–2.58), 0.43 | 1.09 (0.47–2.50), 0.85 |
| Chronic heart failure (LVEF<40%), n (%) | 11 (2.8%) | 3 (3.3%) | 0.80 | 0.50 (0.48–0.52) | 1.19 (0.32–4.34), 0.80 | 0.72 (0.19–2.80), 0.64 | 0.56 (0.06–5.37), 0.61 |
| Bronchial asthma, n (%) | 24 (6.1%) | 5 (5.4%) | 0.81 | 0.50 (0.47–0.52) | 0.89 (0.33–2.39), 0.81 | 1.55 (0.48–5.01), 0.47 | 1.34 (0.34–5.21), 0.67 |
| COPD, n (%) | 25 (6.3%) | 10 (10.9%) | 0.13 | 0.52 (0.49–0.56) | 1.80 (0.83–3.89), 0.14 | 1.30 (0.56–3.00), 0.54 | 1.80 (0.61–5.34), 0.29 |
| OSAS, n (%) | 31 (7.9%) | 15 (16.3%) | 0.01 | 0.54 (0.50–0.58) | 2.28 (1.17–4.43), 0.01 | 1.34 (0.57–3.11), 0.50 | 1.28 (0.46–3.57), 0.63 |
| Solid organ transplant, n (%) | 9 (2.3%) | 1 (1.1%) | 0.47 | 0.49 (0.48–0.51) | 0.47 (0.06–3.76), 0.48 | 0.23 (0.02–2.33), 0.22 | 0.20 (0.02–2.31), 0.20 |
| Active rheumatic disease, n (%) | 8 (2.0%) | 5 (5.4%) | 0.07 | 0.52 (0.49–0.54) | 2.77 (0.89–8.68), 0.08 | 4.5 (0.97–20.94), 0.05 | 4.33 (0.85–22.17), 0.08 |
| Cancer, n (%) | 38 (9.6%) | 19 (20.7%) | <0.01 | 0.56 (0.51–0.60) | 2.44 (1.33–4.47), <0.01 | 1.00 (0.46–2.20), 1.00 | 0.47 (0.15–1.43), 0.18 |
| Liver cirrhosis, n (%) | 2 (0.5%) | 2 (2.2%) | 0.11 | 0.51 (0.49–0.52) | 4.36 (0.61–31.34), 0.14 | 2.45 (0.33–18.27), 0.38 | n.a. |
| Chronic kidney disease, n (%) | 68 (17.3%) | 38 (41.3%) | <0.01 | 0.62 (0.57–0.67) | 3.37 (2.07–5.51), <0.01 | 2.16 (1.16–4.01), 0.01 | 2.25 (1.02–4.96), 0.04 |
ACCI = age-adjusted Charlson comorbidity index; aOR = adjusted odds ratio; AUC = area under the receiver operating characteristic curve; BMI = body mass index; bpm = beats per minute; CFS = clinical frailty scale; COPD = chronic obstructive pulmonary disease; CRP = C-reactive protein; FiO2 = fraction of inspired oxygen; IQR = interquartile range; LVEF = left ventricular ejection fraction; OR = odds ratio; OSAS = obstructive sleep apnoea syndrome; rpm = respirations per minute; SD = standard deviation; n.a. = not applicable Bold values denote statistical significance at the p ≤0.05 level. * Wilcoxon rank-sum test for continuous variables, Pearson’s chi-square test for binary variables Model 1 adjusted for sex, ACCI, CFS, immunomodulating home medication Model 2 adjusted for sex, ACCI, CFS, immunomodulating home medication, time from symptom onset to admission, transfer from other hospital
Table S3 Association and discrimination of baseline characteristics and vital signs upon admission stratified by ICU admission.
| Factor |
No ICU
(n = 394) |
ICU admission
(n = 92) |
p-value* | AUC (95% CI) | OR (95% CI), p-value | aOR (95% CI), p-value | |
|---|---|---|---|---|---|---|---|
| Unadjusted | Model 1 | Model 2 | |||||
| Pre-admission history | |||||||
| Age (years), mean ± SD | 66.6 ± 15.4 | 63.2 ± 11.0 | 0.05 | 0.41 (0.35–0.46) | 0.98 (0.97–1.00), 0.05 | 1.01 (0.98–1.04), 0.49 | 1.00 (0.97–1.03), 0.88 |
| Age ≥65 years, n (%) | 233 (59.1%) | 43 (46.7%) | 0.03 | 0.44 (0.38–0.50) | 0.61 (0.38–0.96), 0.03 | 1.07 (0.52–2.19), 0.86 | 0.84 (0.38–1.84), 0.66 |
| Sex, male, n (%) | 245 (62.2%) | 72 (78.3%) | <0.01 | 0.58 (0.53–0.63) | 2.19 (1.28–3.74), <0.01 | 2.34 (1.18–4.63), 0.02 | 2.96 (1.33–6.59), 0.01 |
| Transfer from other hospital, n (%) | 68 (17.3%) | 42 (45.7%) | <0.01 | 0.64 (0.59–0.70) | 4.03 (2.48–6.55), <0.01 | 4.04 (2.22–7.36), <0.01 | 4.43 (2.28–8.63), <0.01 |
| Time from symptom onset to admission (days), median (IQR) | 7.0 (4.0–9.0) | 8.0 (5.0–10.0) | 0.04 | 0.57 (0.51–0.64) | 1.06 (1.01–1.10), 0.02 | 1.02 (0.97–1.08), 0.40 | 1.02 (0.96–1.08), 0.56 |
| Pre-existing home medication, n (%) | 327 (83.0%) | 79 (86.8%) | 0.37 | 0.52 (0.48–0.56) | 1.35 (0.70–2.61), 0.38 | 2.66 (1.18–6.00), 0.02 | 2.94 (1.19–7.29), 0.02 |
| – Immunomodulating medication, n (%) | 37 (9.4%) | 7 (7.6%) | 0.59 | 0.49 (0.46–0.52) | 0.79 (0.34–1.84), 0.59 | 0.67 (0.22–2.01), 0.47 | 0.51 (0.14–1.86), 0.31 |
| Presentation to emergency department | |||||||
| Supplemental oxygen administered, n (%) | 62 (15.7%) | 49 (53.3%) | <0.01 | 0.69 (0.63–0.74) | 6.10 (3.73–9.97), <0.01 | 6.10 (3.35–11.09), <0.01 | 5.71 (2.83–11.53), <0.01 |
| FiO2 (%), mean ± SD | 53.3 ± 25.8 | 78.3 ± 25.3 | <0.01 | 0.75 (0.66–0.84) | 1.04 (1.02–1.05), <0.01 | 1.05 (1.02–1.08), <0.01 | 1.06 (1.02–1.09), <0.01 |
| Heart rate (bpm), mean ± SD | 89.5 ± 17.9 | 91.1 ± 18.5 | 0.51 | 0.52 (0.44–0.59) | 1.00 (0.99–1.02), 0.51 | 0.99 (0.98–1.01), 0.61 | 1.00 (0.98–1.02), 0.81 |
| Respiratory rate (rpm), mean ± SD | 20.9 ± 7.0 | 20.6 ± 11.4 | 0.85 | 0.54 (0.45–0.64) | 1.00 (0.96–1.03), 0.85 | 1.02 (0.98–1.07), 0.28 | 1.02 (0.98–1.07), 0.31 |
| Temperature (°C), mean ± SD | 37.6 ± 1.0 | 37.8 ± 0.7 | 0.24 | 0.55 (0.49–0.62) | 1.17 (0.90–1.53), 0.24 | 1.01 (0.73–1.39), 0.97 | 1.00 (0.69–1.44), 0.99 |
| Comorbidities | |||||||
| ACCI, median (IQR) | 4.0 (2.0–6.0) | 3.0 (2.0–4.0) | <0.01 | 0.41 (0.36–0.47) | 0.86 (0.78–0.95), <0.01 | 0.96 (0.84–1.11), 0.61 | 1.03 (0.87–1.22), 0.72 |
| ACCI ≥4 points, n (%) | 201 (51.0%) | 31 (33.7%) | <0.01 | 0.41 (0.36–0.47) | 0.49 (0.30–0.79), <0.01 | 0.47 (0.17–1.32), 0.15 | 0.42 (0.13–1.36), 0.15 |
| CFS, median (IQR) | 3.0 (2.0–5.0) | 3.0 (2.0–3.0) | <0.01 | 0.34 (0.28–0.40) | 0.61 (0.48–0.76), <0.01 | 0.67 (0.51–0.88), <0.01 | 0.66 (0.46–0.92), 0.02 |
| CFS ≥4 points, n (%) | 198 (50.3%) | 37 (40.2%) | 0.08 | 0.45 (0.39–0.51) | 0.67 (0.42–1.06), 0.08 | 1.23 (0.38–4.02), 0.73 | 1.34 (0.35–5.18), 0.67 |
| Smoker, n (%) | 32 (12.3%) | 8 (11.9%) | 0.93 | 0.50 (0.45–0.54) | 0.97 (0.42–2.21), 0.93 | 1.03 (0.41–2.57), 0.95 | 1.54 (0.57–4.17), 0.39 |
| Obesity (BMI >30 kg/m2), n (%) | 108 (28.1%) | 34 (40.0%) | 0.03 | 0.56 (0.50–0.62) | 1.71 (1.05–2.78), 0.03 | 1.61 (0.90–2.89), 0.11 | 1.99 (1.03–3.85), 0.04 |
| Diabetes, n (%) | 113 (28.7%) | 28 (30.4%) | 0.74 | 0.51 (0.46–0.56) | 1.09 (0.66–1.78), 0.74 | 1.25 (0.63–2.47), 0.52 | 1.47 (0.68–3.16), 0.33 |
| Hypertension, n (%) | 233 (59.1%) | 49 (53.3%) | 0.30 | 0.47 (0.41–0.53) | 0.79 (0.50–1.24), 0.30 | 0.91 (0.51–1.64), 0.75 | 0.94 (0.49–1.80), 0.85 |
| Coronary artery disease, n (%) | 75 (19.0%) | 18 (19.6%) | 0.91 | 0.50 (0.46–0.55) | 1.03 (0.58–1.84), 0.91 | 1.14 (0.52–2.51), 0.74 | 1.30 (0.56–3.05), 0.54 |
| Chronic heart failure (LVEF<40%), n (%) | 13 (3.3%) | 1 (1.1%) | 0.26 | 0.49 (0.48–0.50) | 0.33 (0.04–2.52), 0.28 | 0.79 (0.09–6.60), 0.83 | 1.30 (0.13–13.03), 0.82 |
| Bronchial asthma, n (%) | 23 (5.8%) | 6 (6.5%) | 0.80 | 0.50 (0.48–0.53) | 1.13 (0.44–2.85), 0.80 | 0.95 (0.30–3.02), 0.94 | 0.94 (0.28–3.17), 0.92 |
| COPD, n (%) | 31 (7.9%) | 4 (4.3%) | 0.24 | 0.48 (0.46–0.51) | 0.53 (0.18–1.55), 0.25 | 1.16 (0.36–3.75), 0.80 | 1.06 (0.26–4.33), 0.93 |
| OSAS, n (%) | 35 (8.9%) | 11 (12.0%) | 0.36 | 0.52 (0.48–0.55) | 1.39 (0.68–2.86), 0.37 | 1.36 (0.54–3.44), 0.51 | 1.68 (0.63–4.53), 0.30 |
| Solid organ transplant, n (%) | 9 (2.3%) | 1 (1.1%) | 0.47 | 0.49 (0.48–0.51) | 0.47 (0.06–3.76), 0.48 | 0.96 (0.08–11.07), 0.98 | 0.79 (0.06–11.3), 0.86 |
| Active rheumatic disease, n (%) | 9 (2.3%) | 4 (4.3%) | 0.27 | 0.51 (0.49–0.53) | 1.94 (0.59–6.46), 0.28 | 4.52 (0.86–23.72), 0.07 | 3.81 (0.66–22.12), 0.14 |
| Cancer, n (%) | 50 (12.7%) | 7 (7.6%) | 0.17 | 0.47 (0.44–0.51) | 0.57 (0.25–1.29), 0.18 | 1.53 (0.56–4.16), 0.40 | 1.13 (0.33–3.86), 0.85 |
| Liver cirrhosis, n (%) | 4 (1.0%) | 0 (0.0%) | 0.33 | 0.49 (0.49–0.50) | n.a. | n.a. | n.a. |
| Chronic kidney disease, n (%) | 93 (23.6%) | 13 (14.1%) | 0.05 | 0.45 (0.41–0.49) | 0.53 (0.28–1.00), 0.05 | 1.16 (0.52–2.58), 0.72 | 1.50 (0.59–3.77), 0.39 |
ACCI = age-adjusted Charlson comorbidity index; aOR = adjusted odds ratio; AUC = area under the receiver operating characteristic curve; BMI = body mass index; bpm = beats per minute; CFS = clinical frailty scale; COPD = chronic obstructive pulmonary disease; CRP = C-reactive protein; FiO2 = fraction of inspired oxygen; IQR = interquartile range; LVEF = left ventricular ejection fraction; OR = odds ratio; OSAS = obstructive sleep apnoea syndrome; rpm = respirations per minute; SD = standard deviation; n.a. = not applicable Bold values denote statistical significance at the p ≤0.05 level. * Wilcoxon rank-sum test for continuous variables, Pearson’s chi-square test for binary variables Model 1: adjusted for sex, ACCI, CFS, immunomodulating home medication Model 2 adjusted for sex, ACCI, CFS, immunomodulating home medication, time from symptom onset to admission, transfer from other hospital
We thank all participating patients, their families and all healthcare workers at the Cantonal Hospital Aarau for their help and dedication to reduce the burden of the ongoing pandemic.
This study was funded by the Research Council KSA (Kantonsspital Aarau). The funding agency had no bearing on the study design, data collection and analysis or writing of the manuscript. No other potential conflict of interest relevant to this article was reported.
1 Lu H , Stratton CW , Tang YW . Outbreak of pneumonia of unknown etiology in Wuhan, China: The mystery and the miracle. J Med Virol. 2020;92(4):401–2. doi:.https://doi.org/10.1002/jmv.25678
2 Hui DS , I Azhar E , Madani TA , Ntoumi F , Kock R , Dar O , et al. The continuing 2019-nCoV epidemic threat of novel coronaviruses to global health - The latest 2019 novel coronavirus outbreak in Wuhan, China. Int J Infect Dis. 2020;91:264–6. doi:.https://doi.org/10.1016/j.ijid.2020.01.009
3 Dong E , Du H , Gardner L . An interactive web-based dashboard to track COVID-19 in real time. Lancet Infect Dis. 2020;20(5):533–4. doi:.https://doi.org/10.1016/S1473-3099(20)30120-1
4World Health Organization. WHO Coronavirus Disease (COVID-19) Dashboard. [cited 2021 July 7]; Available from: https://covid19.who.int/.
5 De Natale G , De Natale L , Troise C , Marchitelli V , Coviello A , Holmberg KG , et al. The Evolution of Covid-19 in Italy after the Spring of 2020: An Unpredicted Summer Respite Followed by a Second Wave. Int J Environ Res Public Health. 2020;17(23):8708. doi:.https://doi.org/10.3390/ijerph17238708
6Bundesamt für Gesundheit BAG. Covid-19 Schweiz: Informationen zur aktuellen Lage, Stand 24. Dezember 2020. 2020 [cited 2021 July 7]; Available from: https://www.covid19.admin.ch/de/overview.
7 Pan H , Peto R , Henao-Restrepo AM , Preziosi MP , Sathiyamoorthy V , Abdool Karim Q , et al., WHO Solidarity Trial Consortium. Repurposed Antiviral Drugs for Covid-19 - Interim WHO Solidarity Trial Results. N Engl J Med. 2021;384(6):497–511. doi:.https://doi.org/10.1056/NEJMoa2023184
8World Health Organization. Clinical management of COVID-19: interim guidance, 27 May 2020. 2020 [cited 2021 July 7]; Available from: https://apps.who.int/iris/handle/10665/332196.
9World Health Organization. Corticosteroids for COVID-19, Living Guidance 2 September 2020. 2020 [cited 2021 July 7]; Available from: https://www.who.int/publications/i/item/WHO-2019-nCoV-Corticosteroids-2020.1.
10Schweizerische Gesellschaft für Infektionskrankheiten. SARS-CoV-2/COVID-19: Antiviral and immunomodulatory treatment considerations (continually updated). 2020 [cited 2021 July 7]; Available from: https://www.who.int/publications/i/item/WHO-2019-nCoV-Corticosteroids-2020.1.
11 Horby P , Lim WS , Emberson JR , Mafham M , Bell JL , Linsell L , et al., RECOVERY Collaborative Group. Dexamethasone in Hospitalized Patients with Covid-19. N Engl J Med. 2021;384(8):693–704. doi:.https://doi.org/10.1056/NEJMoa2021436
12 Tomazini BM , Maia IS , Cavalcanti AB , Berwanger O , Rosa RG , Veiga VC , et al.; COALITION COVID-19 Brazil III Investigators. Effect of Dexamethasone on Days Alive and Ventilator-Free in Patients With Moderate or Severe Acute Respiratory Distress Syndrome and COVID-19: The CoDEX Randomized Clinical Trial. JAMA. 2020;324(13):1307–16. doi:.https://doi.org/10.1001/jama.2020.17021
13National Institutes of Health. Coronavirus Disease 2019 (COVID-19) Treatment Guidelines. 2020 [cited 2021 July 7]; Available from: https://www.covid19treatmentguidelines.nih.gov/.
14 Gregoriano C , Koch D , Haubitz S , Conen A , Fux CA , Mueller B , et al. Characteristics, predictors and outcomes among 99 patients hospitalised with COVID-19 in a tertiary care centre in Switzerland: an observational analysis. Swiss Med Wkly. 2020;150:w20316.
15 Looi MK . Covid-19: Is a second wave hitting Europe? BMJ. 2020;371:m4113. doi:.https://doi.org/10.1136/bmj.m4113
16 Griffin S . Covid-19: Second wave death rate is doubling fortnightly but is lower and slower than in March. BMJ. 2020;371:m4092. doi:.https://doi.org/10.1136/bmj.m4092
17 Suter P , Pargger H . Strong second COVID-19 wave calls for a second look at ICU triage guidelines. Swiss Med Wkly. 2020;150:w20407. doi:.https://doi.org/10.4414/smw.2020.20407
18 Lampl BMJ , Salzberger B . Changing epidemiology of COVID-19. GMS Hyg Infect Control. 2020;15:Doc27.
19 Thiabaud A , Iten A , Balmelli C , Senn L , Troillet N , Widmer A , et al. Cohort profile: SARS-CoV-2/COVID-19 hospitalised patients in Switzerland. Swiss Med Wkly. 2021;151:w20475.
20 Salyer SJ , Maeda J , Sembuche S , Kebede Y , Tshangela A , Moussif M , et al. The first and second waves of the COVID-19 pandemic in Africa: a cross-sectional study. Lancet. 2021;397(10281):1265–75. doi:.https://doi.org/10.1016/S0140-6736(21)00632-2
21World Health Organization. Clinical management of severe acute respiratory infection when novel coronavirus (nCoV) infection is suspected: interim guidance, 25 January 2020. 2020 [cited 2021 July 7]; Available from: https://apps.who.int/iris/handle/10665/330854.
22 Charlson M , Szatrowski TP , Peterson J , Gold J . Validation of a combined comorbidity index. J Clin Epidemiol. 1994;47(11):1245–51. doi:.https://doi.org/10.1016/0895-4356(94)90129-5
23 Juma S , Taabazuing MM , Montero-Odasso M . Clinical Frailty Scale in an Acute Medicine Unit: a Simple Tool That Predicts Length of Stay. Can Geriatr J. 2016;19(2):34–9. doi:.https://doi.org/10.5770/cgj.19.196
24 Saito S , Asai Y , Matsunaga N , Hayakawa K , Terada M , Ohtsu H , et al. First and second COVID-19 waves in Japan: A comparison of disease severity and characteristics. J Infect. 2021;82(4):84–123. doi:.https://doi.org/10.1016/j.jinf.2020.10.033
25 Di Fusco M , Shea KM , Lin J , Nguyen JL , Angulo FJ , Benigno M , et al. Health outcomes and economic burden of hospitalized COVID-19 patients in the United States. J Med Econ. 2021;24(1):308–17. doi:.https://doi.org/10.1080/13696998.2021.1886109
26 Mallow PJ , Belk KW , Topmiller M , Hooker EA . Outcomes of Hospitalized COVID-19 Patients by Risk Factors: Results from a United States Hospital Claims Database. J Health Econ Outcomes Res. 2020;7(2):165–74. doi:.https://doi.org/10.36469/jheor.2020.17331
27 Rodríguez-Núñez N , Gude F , Lama A , Rábade C , Varela A , Abelleira R , et al. Health Indicators in Hospitalized Patients With SARS-CoV-2 Pneumonia: A Comparison Between the First and Second Wave. Arch Bronconeumol (Engl Ed). 2021;S0300-2896(21)00110-1.
28 Contou D , Fraissé M , Pajot O , Tirolien JA , Mentec H , Plantefève G . Comparison between first and second wave among critically ill COVID-19 patients admitted to a French ICU: no prognostic improvement during the second wave? Crit Care. 2021;25(1):3. doi:.https://doi.org/10.1186/s13054-020-03449-6
29 Stocker R , Berner M , Binet I , Bürgi U , Fischer J , Gardaz V , et al.; Swiss Academy Of Medical Sciences. Medical ethical guidelines: Intensive-care interventions. Swiss Med Wkly. 2015;145:w14109. doi:.https://doi.org/10.4414/smw.2015.14109
30 Blum CA , Nigro N , Briel M , Schuetz P , Ullmer E , Suter-Widmer I , et al. Adjunct prednisone therapy for patients with community-acquired pneumonia: a multicentre, double-blind, randomised, placebo-controlled trial. Lancet. 2015;385(9977):1511–8. doi:.https://doi.org/10.1016/S0140-6736(14)62447-8
31 Allameh SF , Nemati S , Ghalehtaki R , Mohammadnejad E , Aghili SM , Khajavirad N , et al. Clinical Characteristics and Outcomes of 905 COVID-19 Patients Admitted to Imam Khomeini Hospital Complex in the Capital City of Tehran, Iran. Arch Iran Med. 2020;23(11):766–75. doi:.https://doi.org/10.34172/aim.2020.102
32 Ludwig M , Jacob J , Basedow F , Andersohn F , Walker J . Clinical outcomes and characteristics of patients hospitalized for Influenza or COVID-19 in Germany. Int J Infect Dis. 2021;103:316–22. doi:.https://doi.org/10.1016/j.ijid.2020.11.204
This study was funded by the Research Council KSA (Kantonsspital Aarau). The funding agency had no bearing on the study design, data collection and analysis or writing of the manuscript. No other potential conflict of interest relevant to this article was reported.