Time trends in general practitioners’ home visits for older patients: a retrospective cross-sectional study from Switzerland
DOI: https://doi.org/10.4414/smw.2021.20539
Stefan
Neuner-Jehlea, Sereina M.
Graberb, Ellen
Keizera, Carola A.
Huberab, Eva
Blozikab, Thomas
Rosemanna, Oliver
Senna
a Institute of Primary Care, University Hospital Zurich, University of Zurich, Switzerland
b Department Health Sciences, Helsana Insurance Company, Zurich, Switzerland
Summary
WHAT IS KNOWN ON THE SUBJECT, AND WHAT THE STUDY ADDS: The number of home visits by general practitioners (GPs) has decreased in recent years, in contrast to the increasing number of frail and older patients in western countries. Current data on GP home visit numbers and rates are lacking for Switzerland. Our study provides new data on GP home visit numbers and rates, and their associations with patient characteristics.
AIM
Our study aimed at investigating the time trend of GP home visits to older patients from 2014 to 2018 in Switzerland, and associations between GP home visits and patient characteristics including healthcare utilisation and living situation.
METHODS
Retrospective cross-sectional study of insurance claims data from 2014 to 2018 among patients aged ≥65 years (Nextrapolated = 2,095,102; Nraw = 339,301). We compared patient characteristics between patients with and without GP home visits using descriptive statistics. We performed logistic regression analyses to detect associations between patient characteristics and GP home visits, including subgroups of patients aged ≥80 and patients living in a nursing home. Regression models were adjusted for age and sex.
RESULTS
The yearly GP home visit rate declined from 10.7% to 9.3% from 2014 to 2018 (p <0.0001). Among patients aged ≥80, the rate declined from 26.1% to 23.1% (p <0.0001), and among patients living in a nursing home from 68.7% to 65.8% (p <0.0001). Regression analyses revealed increased health care utilisation and a higher burden of morbidity and mortality in patients receiving GP home visits.
CONCLUSION
There is an ongoing decline of GP home visits over the past years, with a potentially negative impact on the quality of care for older and frail patients.
Introduction
Home visits by general practitioners (GPs) are an important component of home care and highly valued by patients in terms of care quality, continuity of care and trust [1, 2]. Demand for home visits by GPs is associated with several patient factors, such as higher age [3, 4], lower social class [4], female sex [5], living in a rural area [6–8], the number of comorbidities and frailty [5, 9, 10]. Because of demographic changes, with increasing age, multimorbidity, frailty and impaired mobility of the population, we have to face an increasing demand for home visits in the future [11]. In contrast, the number of home visits by GPs has continuously decreased in western countries during past decades, for a variety of reasons at the GP level as well as at the healthcare system level [1, 4, 12–15]. In Switzerland, there are only few studies available, which showed a similar decline as in other western countries in the past decades (until 2015) [14, 15]. To our knowledge, current data on time trends in GP home visits representative for Switzerland, including the association with patient characteristics, are lacking. Thus, the aim of our study was first to measure GP home visit rates for the years 2014 to 2018, in a representative Swiss population at older age, and second to investigate associations between GP home visits and patient characteristics, including healthcare utilisation measures, multimorbidity and living situation (at home or in a nursing home).
Materials and methods
Study design and data source
We performed a retrospective cross-sectional study using health insurance claims data from individuals with mandatory health insurance (1 January 2014 to 31 December 2018). The health insurance company involved (Helsana) is one of the largest in Switzerland, covering 1.1 million individuals from all geographic regions (cantons) (15% of the Swiss population). The database comprises information on individuals’ sociodemographics (age, sex, geographic region), inpatient and outpatient healthcare utilisation including dispensed medications (including active substances in the form of ATC [anatomical therapeutic chemical] codes) and their corresponding costs. Additionally, the database provides the type of practicing physician, which allows services performed by GPs to be identified. We included in our analysis all patients aged 65 or older who were continuously insured at Helsana in the given calendar year. Persons who died or changed basic insurance provider were excluded from the corresponding year. In order to draw conclusions about the general population of Switzerland, all descriptive statistics (including absolute numbers of the population and subpopulations, rates, means and standard deviations) were extrapolated to the total Swiss population. Regression models were based on the raw data.
Main objectives
- To measure the time trend in GP home visit rates per year. These rates were defined as the annual proportion of patients with at least one GP home visit relative to the total number of insured individuals aged 65 years or older.
- To explore the association between patient characteristics and GP home visits (year 2018), defined as a binary coded variable indicating whether an individual had received at least one GP home visit per year, per patient.
Patient characteristics
Sociodemographic characteristics of the patients included age and sex. For the number of chronic conditions, we assessed pharmaceutical cost groups (PCGs), which is the most reliable proxy available in Swiss ambulatory healthcare claims data, and which is based on specific medication classes (each medication class is defined based on the ATC classification system) [16]. Other characteristics were mortality (died in a given year), number of GPs caring for the patient, number of GP consultations per year, number of specialists caring for the patient, number of specialist consultations per year, number and length of in-hospital stays (including emergency admissions), number of GP telephone consultations per year, in- and outpatient costs, and stay in a nursing home as a proxy for frailty.
Ethics approval and consent to participate
According to the national ethical and legal regulation, ethics approval was not needed. Permission to access the study data was provided by the Helsana Group. Since data were anonymised, no consent of patients was required.
Statistical analysis
First, we calculated descriptive statistics for the total study population (age, sex) and for the subgroups of interest (i.e., age 80 years or older, living in a nursing home), comparing patients with at least one home visit in the entire observation period (2014–2018) to patients receiving none. Extrapolated absolute numbers as well as weighted means and standard deviations (SDs) were calculated. The weighted mean of age, and its corresponding weighting factor, corresponds to the median age in the given years of observation per patient.
Second, to examine the time trend in GP home visits, we compared the number of patients receiving at least one GP home visit with the number of all patients in the extrapolated study population, and thereof we calculated the rate (in percentage). Additionally, multiple logistic regression models were used to statistically test for changes in the likelihood of GP home visits over time. The model included getting at least one GP home visit per year per patient as the dependent variable and time (5 years of observation) as the independent variable, additionally controlled for the composition of the study population using age and sex as covariates. With a yearly cross-sectional design, some patients are observed over multiple years, resulting in non-independent observations over the course of time. However, since taking into account the clustering of patients would result in model outputs identical to the non-adjusted logistic regression, the latter approach was used.
Third, we investigated the association between GP home visits and the level of healthcare utilisation for the most recent year, 2018. We performed separate multiple logistic regression models with a binary indicator of having at least one GP home visit in 2018 as the response variable, and the multiple dimensions of level of health care and morbidity as independent variables. Because of the problem of multicollinearity, each of the independent variables of interest were tested in a separate logistic regression model, additionally controlled for age and sex.
Since age and sex were used as covariates to control for the demography of the study population, the effects are not explicitly shown in the result tables of the regression models.
Extrapolation
We extrapolated the given results to the entire Swiss population to reduce potentially small differences between the study and Swiss population regarding the distribution of age, sex, and region of residence.
We used the following standard procedure for extrapolation: For each observation, a weighting factor was determined based on stratification by year, canton, sex and age. The weighting factors represent the inverse of the sampling probabilities with the number of the entire Swiss population (census data) relative to the number of individuals insured with Helsana in a given stratum (NSwitzerland, i / NHelsana, j ; i = stratum). The strata consisting of the combination of year, canton, sex and age, and the corresponding numbers of the Helsana collective and the entire Swiss population were based on risk equalisation statistics [17]. The corresponding weighting factors were used to calculate weighted sums (extrapolated absolute numbers), means and SDs representing the estimates of the extrapolated population.
All the analyses described above were repeated for patients aged 80 years or older and for patients with at least one stay in a nursing home in a given year. P-values equal to or below 0.05 were considered as statistically significant. We used the statistical software R (version 4.0.2) for the analyses [18].
Analyses based on raw (not extrapolated) data are provided in the appendix (supplementary tables S3, S4 and S5
).
Results
Population and GP home visit rates
Between 2014 and 2018, the total extrapolated population resulted in 2,095,102 patients aged 65 years or older (raw study population [Helsana] ≥65: Nraw = 339,301). During the entire observation period, 413,234 (19.7%) (Nraw = 73,576) patients received at least one GP home visit, of whom 63.7% were women (table 1). The GP home visit rates per year were between 9.3% and 10.7% (fig. 1a).
Table 1 Descriptive statistics of the extrapolated population for patients without vs with at least one GP home visit during the entire observation period (2014–2018), for the entire population (≥65 years) as well as for the two subgroups including patients ≥80years and patients living in a nursing home.
| |
Without GP home visit
|
With at least one GP home visit
|
(a) All patients ≥65 years
(N = 2,095,102)
|
| n (overall) |
1,681,868 (80.3%) |
413,234 (19.7%) |
| n women (%) |
886,105 (52.7%) |
263,326 (63.7%) |
| Age, mean ± SD) |
73.6 ± 6.8 |
82.5 ± 8.0 |
(b) Subgroup ≥80 years
(N = 695,136)
|
| n (≥80 years) |
398,921 (57.4%) |
296,215 (42.6%) |
| n women (%) |
225,854 (56.6%) |
198,835 (67.1%) |
| Age, mean ± SD) |
84.3 ± 3.8 |
87.2 ± 4.8 |
(c) Subgroup with a stay in a nursing home
(N = 305,982)
|
| n (nursing home) |
68,235 (22.3%) |
237,747 (77.7%) |
| n women (%) |
43,185 (63.3%) |
160,576 (67.5%) |
| Age, mean ± SD) |
82.0 ± 8.0 |
84.9 ± 7.4 |
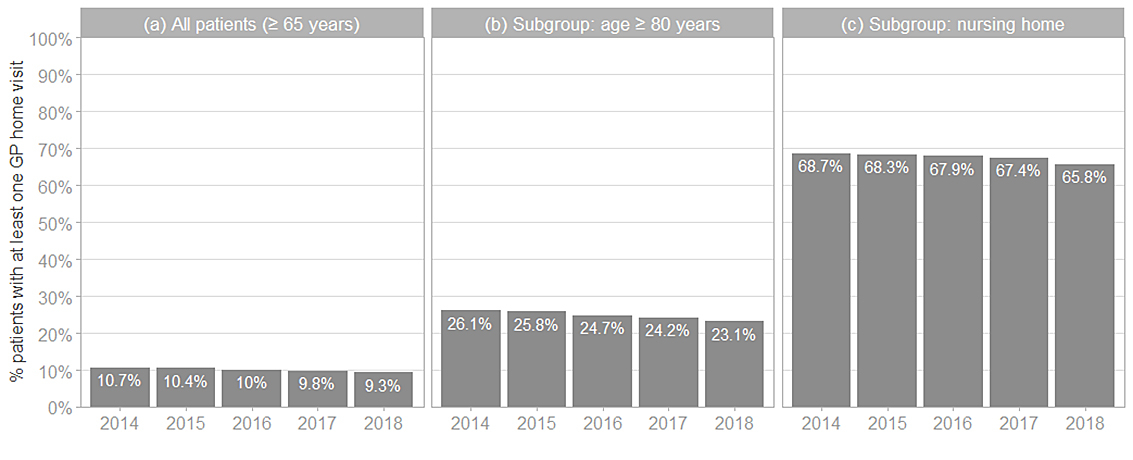
Figure 1 The proportion (%) of patients with at least one GP home visit relative to the total number of patients per year. (a) Overall patients (aged ≥65 years). (b) Subgroup including only patients aged ≥80 years. (c) Subgroup including only patients with a stay at a nursing home in the same year. A significant decrease in GP home visit rates was been observed in all patient groups (p <0.001, controlled for age and sex) (table S1).
The subgroup including patients aged 80 years or older (Nextrapolated = 695,136; Nraw = 127,237) showed an overall proportion of 42.6% patients with at least one GP home visit between 2014 and 2018 (table 1), and GP home visit rates per year were between 23.1% and 26.1% (fig. 1b). In the subgroup of patients with at least one stay in a nursing home in the given period (Nextrapolated = 305,982; Nraw = 56,155), 77.7% had at least one GP home visit (table 1), and GP home visit rates per year were between 65.8% and 68.7% (fig. 1c).
Time trend
Between 2014 and 2018 the number of patients receiving at least one GP home visit per year declined by 6.3%, from 160,792 to 150,717, whereas the total number of patients aged ≥65 years increased (by 7%, from 1,505,379 to 1,618,958) (fig. 1a). This is equivalent to a decrease in the GP home visit rate from 10.7% to 9.3% (fig. 1a), which is a relative decrease of 13.1% between 2014 and 2018, or 3.3% per year. (p <0.001, controlled for age and sex, supplementary table S1a in the Appendix).
The decreasing trend of the GP home visit rate between 2014 and 2018 remained significant for the subgroups of patients ≥80 years (p <0.001, controlled for age and sex) (fig. 1b, table S1b) and patients living in a nursing home (p <0.001, controlled for age and sex) (fig. 1c, table S1c). For absolute extrapolated numbers, see table S2.
Patient characteristics associated with GP home visits
The numbers of patients with GP home visits were generally higher among women and older patients (tables 1–3
). In the year 2018, patients with GP home visits were more often hospitalised (odd ratio [OR] 1.87, 95% confidence interval [CI] 1.85–1.89), had a higher probability of living in a nursing home (OR 19.7, 95% CI 19.0–20.4), a higher number of GPs (OR 2.67, 95% CI 2.62–2.72) and a lower number of specialists as care providers (OR 0.85, 95% CI 0.84–0.86), and had a higher mortality rate (OR 6.93, 95% CI 6.12–7.26), as compared with patients with no GP home visits (tables 2 and 3
). Very similar effects were found in the subgroup of patients aged 80 years or older. In the subgroup of patients living in a nursing home, the effect of hospitalisations becomes less relevant (OR 1.05, 95% CI 1.04–1.07) (tables 2 and 3
).
Table 2 Patient characteristics with regard to health conditions and healthcare utilisation (year 2018) for (a) overall patients in the Swiss population (extrapolated) (aged ≥65 years); (b) subgroup of patients ≥80 years; (c) subgroup of patients living in a nursing home in the same year, 2018.
|
2018
|
(a) All patients
(N = 1,618,958) (extrapolated)
|
(b) Subgroup ≥80years
(N = 480,109) (extrapolated)
|
(c) Subgroup living in a nursing home
(N = 135,559) (extrapolated)
|
|
With GP home visit
|
Without GP home visit
|
With GP home visit
|
Without GP home visit
|
With GP home visit
|
Without GP home visit
|
| No. patients (%) |
150,717 (9.3%) |
1,468,241 (90.7%) |
111,115 (23.1%) |
368,994 (76.9%) |
89,181 (65.8%) |
46,378 (34.2%) |
| % women |
67.7% |
54.2% |
71.1% |
59.1% |
70.2% |
67.0% |
| Age |
84.4 |
74.8 |
88.3 |
84.9 |
86.2 |
84.0 |
|
Inpatient characteristics
|
|
|
|
|
| Inpatient costs |
13,927.5 |
2206.9 |
13,734.9 |
3424.2 |
19,056.1 |
17,057.8 |
| Number of stays |
1.8 |
0.4 |
1.8 |
0.6 |
2.3 |
2.3 |
| Total length of stays (days) |
158.2 |
9.5 |
172.6 |
23.7 |
258.0 |
217.1 |
| % patients in nursing home |
59.2% |
3.2% |
65.3% |
9.1% |
100% |
100% |
|
Outpatient characteristics
|
|
|
|
|
| Outpatient costs |
11,148.8 |
5977.7 |
9853.5 |
6813.2 |
8612.9 |
8854.2 |
| No. of GPs |
1.7 |
1.0 |
1.7 |
1.1 |
1.7 |
0.9 |
| No. of specialists |
1.4 |
2.2 |
1.3 |
2.1 |
1.0 |
1.3 |
| No. of GP consultations |
11.2 |
5.2 |
11.0 |
6.3 |
11.0 |
5.3 |
| No. of specialist consultations |
3.6 |
5.1 |
3.0 |
5.3 |
2.6 |
5.6 |
| No. of GP telephone consultations |
1.6 |
0.3 |
1.6 |
0.4 |
1.5 |
0.5 |
|
Other characteristics
|
|
|
|
|
| Home nursing service costs |
2674.1 |
326.4 |
2685.7 |
832.5 |
1372.8 |
1456.4 |
| No. of PCGs |
4.2 |
2.5 |
4.1 |
3.1 |
4.4 |
3.9 |
| % patients died |
21.3% |
1.9% |
23.0% |
4.4% |
25.6% |
18.7% |
Table 3 Multiple logistic regression analyses testing the effects of patient characteristics regarding health conditions and healthcare utilisation on the likelihood of receiving at least one GP home visit for 2018 for (a) overall patients in the Swiss population (extrapolated) (aged ≥65 years); (b) subgroup of patients ≥80 years; (c) subgroup of patients living in a nursing home in the same year, 2018.
|
Independent variable
|
Odds ratio
|
95% CI
|
p-value
|
|
(a) All patients (≥65 years)
|
| Inpatient costs |
1.0001 |
1.0001–1.0001 |
<0.001
|
| Number of stays |
1.8714 |
1.8526–1.8904 |
<0.001
|
| Total length of stays |
1.0093 |
1.0092–1.0095 |
<0.001
|
| Stay in a nursing home |
19.7114 |
19.0345–20.4136 |
<0.001
|
| Outpatient costs |
1.000031 |
1.00003–1.000032 |
<0.001
|
| No. of GPs |
2.6686 |
2.6221–2.7161 |
<0.001
|
| No. of specialists |
0.8481 |
0.841–0.8552 |
<0.001
|
| No. of GP consultations |
1.0942 |
1.0922–1.0961 |
<0.001
|
| No. of specialist consultations |
0.9647 |
0.9622–0.9671 |
<0.001
|
| No. of GP telephone consultations |
1.3894 |
1.3783–1.4005 |
<0.001
|
| Home nursing service costs |
1.0001 |
1.0001–1.0001 |
<0.001
|
| No. of PCGs*
|
1.3673 |
1.3581–1.3766 |
<0.001
|
| Died |
6.9267 |
6.612–7.2568 |
<0.001
|
|
(b) Subgroup: age ≥80 years
|
| Inpatient costs |
1.0001 |
1.0001–1.0001 |
<0.001
|
| Number of stays |
1.8134 |
1.7899–1.8373 |
<0.001
|
| Total length of stays |
1.008 |
1.0078–1.0081 |
<0.001
|
| Stay in a nursing home |
13.9133 |
13.3759–14.4738 |
<0.001
|
| Outpatient costs |
1.00003 |
1.000029–1.000032 |
<0.001
|
| No. of GPs |
2.7766 |
2.713–2.8421 |
<0.001
|
| No. of specialists |
0.8125 |
0.8038–0.8213 |
<0.001
|
| No. of GP consultations |
1.0916 |
1.0891–1.0941 |
<0.001
|
| No. of specialist consultations |
0.9455 |
0.9423–0.9486 |
<0.001
|
| No. of GP telephone consultations |
1.4077 |
1.3923–1.4234 |
<0.001
|
| Home nursing service costs |
1.00007 |
1.00006–1.00007 |
<0.001
|
| No. of PCGs†
|
1.3187 |
1.3075–1.33 |
<0.001
|
| Died |
5.0472 |
4.7928–5.3158 |
<0.001
|
|
(c) Subgroup: living in a nursing home
|
| Inpatient costs |
1.00002 |
1.000013–1.000018 |
<0.001
|
| Number of stays |
1.0526 |
1.0373–1.0682 |
<0.001
|
| Total length of stays |
1.0019 |
1.0017–1.0021 |
<0.001
|
| Outpatient costs |
1.000004 |
1.000002–1.000007 |
0.001
|
| No. of GPs |
4.0419 |
3.8609–4.2339 |
<0.001
|
| No. of specialists |
0.8945 |
0.879–0.9102 |
<0.001
|
| No. of GP consultations |
1.1224 |
1.1172–1.1277 |
<0.001
|
| No. of specialist consultations |
0.948 |
0.9443–0.9517 |
<0.001
|
| No. of GP telephone consultations |
1.3089 |
1.2838–1.3351 |
<0.001
|
| Home nursing service costs |
0.999999 |
0.999993–1.000005 |
0.822 |
| No. of PCGs‡
|
1.1429 |
1.1279–1.1582 |
<0.001
|
| Died |
1.4403 |
1.3498–1.5373 |
<0.001
|
Discussion
During a given year in the study period from 2014 to 2018, one out of ten patients aged 65 years or older received a home visit by a GP. This rate doubled among patients aged 80 years or older and reached over 65% in patients living in a nursing home. Between 2014 and 2018, the GP home visit rate declined from 10.7% to 9.3%, corresponding to an average GP home visit rate decline of 3.3% per year for this study period (relative reduction). Our data show that patients with GP home visits have more comorbidities, more and longer hospital stays, are more likely to live in a nursing home, have higher costs and have a higher mortality. This reflects a higher burden of disease and frailty, which may result in a higher demand by these patients for home-based medical care.
Compared with the literature, the decline in GP home visits during our study period seems slightly smaller than in previous years. For example, a Dutch study reported a relative GP home visit rate reduction of 3.5% per year between 1987 and 2001 [3], and an Australian study reported a relative GP home visit rate reduction of 5.1% per year for the years 1997 to 2007 [19]. In Switzerland, the mean number of GP home visits per week decreased from 7.7 (median 5.0) in 1993 to 3.2 (median 2.0) in 2012, translating into a relative reduction of 4.5% per year [14]. Another Swiss study, restricted to the area of the canton of Vaud, reported an annual decrease of home visits per GP by 4% during the time period from 2006 to 2015 [15]. However, comparisons should be made with caution as study populations differ in age, living situation and healthcare systems. As potential reasons for the decline in GP home visit rates, qualitative studies have identified barriers such time constraints, inadequate remuneration, lack of equipment, and concerns about safety and perceptions of a risk of violence [1, 12]. Recent organisational development in patient care, such as improved transport facilities (to overcome impaired mobility) or telemedical advice, may be further reasons for the decline.
As to be expected, the strongest indicator for the provision of a GP home visit in our study was the living situation: staying in a nursing home translated to an almost 20-fold increase of the probability for a GP home visit compared with community-dwelling individuals. This is in line with a recent Swiss study including almost 230,000 individuals aged 65 or older, where patients with more GP home visits were significantly more often dependent on home care nursing, and had more and longer hospitalisations [10].
Another strong effect on GP home visits was co-morbidity, with an increase by one third for every additional PCG. This is in line with the literature: Moth et al. reported significantly higher home visit rates if patients had three or more chronic conditions as compared with none [9]. Similarly, in the Swiss study mentioned above, the home visit rates among patients with two or more chronic conditions were significantly higher than in patients with only one or no chronic condition [10]. A Danish study among hospitalised patients with chronic obstructive pulmonary disease found that patients with a Charlson comorbidity index of 1 or higher than 1 versus 0 had ORs of 1.63 and 2.02, respectively, for having a GP home visit in the previous year [20].
GP home visit rates are clearly higher in older patients, especially among those aged 80 years or older [3, 20]. Regarding sex, other studies reported an association with female sex [5, 20], which may partially be explained by the higher age of female patients as compared with men.
Finally, our results showed a positive association between the number of different GPs and GP home visits, with the strongest association in the nursing home subgroup. As an explanation, we assume that frail patients at high need for GP home visits require this service regardless of whether their GP is available or not (e.g., out-of-hours situation, vacancy). Furthermore, the number of different specialists was negatively associated with GP home visits. Both findings demonstrate that these vulnerable patients demand more home-based care, and that the specialised provider of this longitudinal medical care is the GP [1].
Regarding effectiveness, an older meta-analysis showed a reduction of mortality and admission to institutional care by planned home visits, but no effect for function, health change and hospital admission, whereas other studies of house call programmes reported a reduction of hospitalisation rates and emergency room visits [21, 22]. Another recent systematic review found no evidence for a reduction of hospital admission or other clinical events by primary care-led home visits for acute medical emergencies [23]. Beyond clinical events, there are some beneficial effects of GP home visits to mention: for example, visiting the patient allows a discussion of options and shared decision making regarding next steps in a trusted and comfortable environment, thus encouraging better adherence of the patient [23, 24]. This may be particularly true for people who have complex care needs, where the GP is gaining a better knowledge of coping capacities of patients and caregivers during the visit [23]. Another population at high need for home-based care are patients requiring a palliative care, where GPs provide visits in collaboration with specialised services. Many patients, especially older patients, consider home visits to be essential for their well-being and for the GP–patient relationship, and subsequently for better care [2]. However, more research is needed to explore the expectations of patients and their benefits from GP home visits, in order to evaluate if the high demand is mirroring a real need of patients, beyond convenience.
In the light of the decline of GP home visits, we have to think about potential solutions. The integration of other health professionals into home-based medical care for older, multimorbid patients seems justified [22]. For example, nurses in advanced roles may successfully provide home visits for chronically ill patients, at a similar care quality as GPs [25], and may dedicate a substantial part of their working time to this task [26, 27]. Additionally, organisational factors on a practice level and on the healthcare system level (e.g., salary or gatekeeping systems) are associated with GP home visit rates and should be considered [13]. The debate is ongoing and deserves careful attention [28, 29]. More research data on these barriers and innovative solutions are urgently needed to provide more insight for informing political stakeholders.
Strengths and limitations
One strength of our study was the huge study population covering one eighth of the Swiss population in a nationwide sample, which we assume to be representative for the Swiss population according to previous studies [30, 31], although this has not been proven yet. Another strength is the up-to-date analysis of time trends in home visits over a recent time period of 5 years. Lastly, our study is unique in stratifying results according to vulnerable subgroups and investigating patient determinants with a focus on healthcare utilisation, in order to investigate how rates and time trends differ between subgroups and the entire study sample.
As a limitation, the observational design does not allow for causality or clinical diagnosis. Therefore, we cannot explore decisional procedures and reasons for home visits, nor further factors influencing healthcare utilisation such as educational level, socioeconomic status, or social support of patients. Another limitation is the lack of information about GPs’ characteristics (such as age, sex, educational level, working place), which hinders exploration of associations between these characteristics and the provision of home care.
Availability of data and materials
On request, source data and materials are available from the authors.
Appendix: Supplementary tables
Table S1 Multiple logistic regression analyses testing for the effect of time for (a) all patients included in the study, (b) patients aged 80 or older, (c) patients living in a nursing home.
|
Predictor
|
Estimate
|
SE
|
p-value
|
|
(a) All patients (≥ 65 years)
|
| (Intercept) |
−14.32553 |
0.03453 |
<0.001
|
| Age |
0.15261 |
0.00041 |
<0.001
|
| Sex (f) |
0.32211 |
0.00652 |
<0.001
|
| Time (years) |
−0.05481 |
0.00216 |
<0.001
|
|
(b) Patients ≥80 years
|
| (Intercept) |
−14.81275 |
0.07048 |
<0.001
|
| Age |
0.15777 |
0.00081 |
<0.001
|
| Sex (f) |
0.37908 |
0.00803 |
<0.001
|
| Time (years) |
−0.05288 |
0.00260 |
<0.001
|
|
(c) Patients living in a nursing home
|
| (Intercept) |
−2.12529 |
0.07041 |
<0.001
|
| Age |
0.03447 |
0.00082 |
<0.001
|
| Sex (f) |
0.04164 |
0.01363 |
0.022
|
| Time (years) |
−0.03729 |
0.00430 |
<0.001
|
Table S2 The weighted total numbers of patients per year and the weighted number of patients with at least one GP home visit per year for (a) overall patients in the Swiss population (extrapolated) (aged ≥65 years); (b) subgroup of patients ≥80 years; (c) subgroup of patients living in a nursing home in the same year. A significant decrease in GP home visit rates was observed in all patient groups (p <0.0001, controlled for age and sex) (table S1).
| |
2014
|
2015
|
2016
|
2017
|
2018
|
|
(a) All patients (≥65 years)
|
| Patients, total |
1,,505,,379 |
1,539,800 |
1,562,664 |
1,591,730 |
1,618,958 |
| Patients with GP home visit |
160,792 |
160,936 |
155,908 |
155,471 |
150,717 |
|
(b) Patients ≥80 years
|
| Patients, total |
444,247 |
455,990 |
462,145 |
470,753 |
480,109 |
| Patients with GP home visit |
115,870 |
117,527 |
113,967 |
114,036 |
111,115 |
|
(c) Patients living in a nursing home
|
| Patients, total |
127,406 |
132,197 |
130,834 |
133,724 |
135,559 |
| Patients with GP home visit |
87,534 |
90,330 |
88,860 |
90,131 |
89,181 |
Table S3 Descriptive statistics of the raw data (Helsana sample) for patients without vs with at least one GP home visit during the entire observation period (2014–2018), for the entire population (≥65 years) as well as for the two subgroups including patients ≥80years and patients living in a nursing home.
| |
Without GP home visit
|
With at least one GP home visit
|
(a) All patients ≥65 years
(N = 339,301)
|
| n (overall) |
265,725 (78.32%) |
73,576 (21.68%) |
| n women (%) |
145,603 (54.8%) |
48,784 (66.3%) |
| Age, mean ± SD |
74.4 ± 6.9 |
83.1 ± 7.9 |
(b) Subgroup ≥80 years
(N = 127,237)
|
| n (≥80 years) |
71,818 (56.44%) |
55,419 (43.56%) |
| n women (%) |
42,330 (58.9%) |
38,405 (69.3%) |
| Age, mean ± SD |
84.4 ± 3.8 |
87.4 ± 4.8 |
(c) Subgroup with a stay in a nursing home
(N = 56,155)
|
| n (nursing home) |
12,396 (22.07%) |
43,759 (77.93%) |
| n women (%) |
8181 (66%) |
30,598 (69.9%) |
| Age, mean ± SD |
82.2 ± 7.7 |
85.3 ± 7.2 |
| Age is given as the weighted mean ± standard deviation (SD). |
Table S4 Patient characteristics with regard to health conditions and healthcare utilization (year 2018) for (a) overall patients in the Helsana sample (aged ≥65 years); (b) subgroup of patients ≥80 years; (c) subgroup of patients living in a nursing home in the same year, 2018
|
2018
|
(a) All patients
(N = 266,867) (raw)
|
(b) Subgroup ≥80 years
(N = 90,116) (raw)
|
(c) Subgroup living in a nursing home
(N = 25,565) (raw)
|
|
With GP home visit
|
Without GP home visit
|
With GP home visit
|
Without GP home visit
|
With GP home visit
|
Without GP home visit
|
| No. patients (%) |
27,602 (10.34%) |
23,9265 (89.66%) |
21,380 (23.72%) |
68,736 (76.28%) |
16,818 (65.79%) |
8747 (34.21%) |
| % women |
70.25% |
56.53% |
73.19% |
61.49% |
72.65% |
69.68% |
| Age |
85.2 |
75.5 |
88.5 |
85.0 |
86.8 |
84.7 |
|
Inpatient characteristics
|
|
|
|
|
| Inpatient costs |
13,625.9 |
2260.0 |
13,444.4 |
3424.9 |
18,423.5 |
16,543.8 |
| Number of stays |
1.8 |
0.4 |
1.8 |
0.6 |
2.3 |
2.2 |
| Total length of stays (days) |
161.5 |
10.7 |
174.0 |
24.8 |
256.8 |
218.5 |
| % patients in nursing home |
60.93% |
3.66% |
66.21% |
9.64% |
100% |
100% |
|
Outpatient characteristics
|
|
|
|
|
| Outpatient costs |
10,762.3 |
5976.8 |
9680.0 |
6781.1 |
8358.0 |
8562.9 |
| No. of GPs |
1.7 |
1.0 |
1.7 |
1.1 |
1.7 |
0.9 |
| No. of specialists |
1.4 |
2.2 |
1.2 |
2.1 |
1.0 |
1.3 |
| No. of GP consultations |
11.3 |
5.3 |
11.2 |
6.3 |
11.1 |
5.1 |
| No. of specialist consultations |
3.5 |
5.1 |
3.0 |
5.3 |
2.6 |
6.1 |
| No. of GP telephone consultations |
1.6 |
0.3 |
1.6 |
0.4 |
1.5 |
0.5 |
|
Other characteristics
|
|
|
|
|
| Home nursing service costs |
2636.8 |
351.9 |
2662.9 |
841.9 |
1358.6 |
1412.7 |
| No. of PCGs |
4.2 |
2.6 |
4.1 |
3.1 |
4.3 |
3.8 |
| % patients died |
21.62% |
2.04% |
23.03% |
4.44% |
25.8% |
18.54% |
PCG = pharmaceutical cost group
If not stated otherwise, weighted mean values are given. Costs are presented in Swiss francs (CHF); 1 CHF is equivalent to EUR 0.93, GBP 0.84 or USD 1.12 (as of end 2020) |
Table S5 The total numbers of patients per year and the number of patients with at least one GP home visit per year, in the Helsana sample for (a) overall patients (aged ≥65 years); (b) subgroup of patients ≥80 years; (c) subgroup of patients living in a nursing home in the same year A significant decrease in GP home visit rates was been observed in all patient groups (p <0.0001, controlled for age and sex).
| |
2014
|
2015
|
2016
|
2017
|
2018
|
|
(a) All patients (≥65 years)
|
| Patients, total |
265,828 |
268,368 |
266,693 |
264,617 |
266,867 |
| Patients with GP home visit |
30,561 |
30,510 |
29,198 |
28,635 |
27,602 |
|
(b) Patients ≥80 years
|
| Patients, total |
85,986 |
87,915 |
88,399 |
88,946 |
90,116 |
| Patients with GP home visit |
22,828 |
23,165 |
22,327 |
22,107 |
21,380 |
|
(c) Patients living in a nursing home
|
| Patients, total |
24,594 |
25,448 |
24,997 |
25,295 |
25,565 |
| Patients with GP home visit |
16,931 |
17,474 |
16,992 |
17,059 |
16,818 |
Author contributions
SNJ and OS conceived the study design. EK reviewed the background literature. SG described the methods, organised data and performed the statistical analysis. CH, EB, TR and OS gave inputs to the further study development and interpretation of findings. SNJ drafted the manuscript. All authors reviewed the manuscript and contributed significantly to the final paper version. SNJ is guarantor for the integrity of data. All authors confirm consent for the publication of the paper in the current version.
References
1
Theile
G
,
Kruschinski
C
,
Buck
M
,
Müller
CA
,
Hummers-Pradier
E
. Home visits - central to primary care, tradition or an obligation? A qualitative study. BMC Fam Pract. 2011;12(1):24. doi:.https://doi.org/10.1186/1471-2296-12-24
2
van Kempen
JA
,
Robben
SH
,
Zuidema
SU
,
Olde Rikkert
MG
,
Melis
RJ
,
Schers
HJ
. Home visits for frail older people: a qualitative study on the needs and preferences of frail older people and their informal caregivers. Br J Gen Pract. 2012;62(601):e554–60. doi:.https://doi.org/10.3399/bjgp12X653606
3
van den Berg
MJ
,
Cardol
M
,
Bongers
FJ
,
de Bakker
DH
. Changing patterns of home visiting in general practice: an analysis of electronic medical records. BMC Fam Pract. 2006;7(1):58. doi:.https://doi.org/10.1186/1471-2296-7-58
4
Aylin
P
,
Majeed
FA
,
Cook
DG
. Home visiting by general practitioners in England and Wales. BMJ. 1996;313(7051):207–10. doi:.https://doi.org/10.1136/bmj.313.7051.207
5
Snijder
EA
,
Kersting
M
,
Theile
G
,
Kruschinski
C
,
Koschak
J
,
Hummers-Pradier
E
, et al.
Hausbesuche: Versorgungsforschung mit hausärztlichen Routinedaten von 158.000 Patienten [Home visits in German general practice: findings from routinely collected computer data of 158,000 patients]. Gesundheitswesen. 2007;69(12):679–85. doi:.https://doi.org/10.1055/s-2007-993181
6
Heymann
R
,
Weitmann
K
,
Weiss
S
,
Thierfelder
D
,
Flessa
S
,
Hoffmann
W
. Bevölkerungsdichte, Altersverteilung und Urbanität als Einflussfaktoren der Hausbesuchshäufigkeit – eine Analyse für Mecklenburg-Vorpommern [Population density, age distribution and urbanisation as factors influencing the frequency of home visits--an analysis for Mecklenburg-West Pomerania]. Gesundheitswesen. 2009;71(7):423–8. doi:.https://doi.org/10.1055/s-0029-1202798
7
Schäfer
I
,
Hansen
H
,
Ruppel
T
,
Lühmann
D
,
Wagner
HO
,
Kazek
A
, et al.
Regional differences in reasons for consultation and general practitioners’ spectrum of services in northern Germany - results of a cross-sectional observational study. BMC Fam Pract. 2020;21(1):22. doi:.https://doi.org/10.1186/s12875-020-1093-6
8
Pochert
M
,
Voigt
K
,
Bortz
M
,
Sattler
A
,
Schübel
J
,
Bergmann
A
. The workload for home visits by German family practitioners: an analysis of regional variation in a cross-sectional study. BMC Fam Pract. 2019;20(1):3. doi:.https://doi.org/10.1186/s12875-018-0891-6
9
Moth
G
,
Vestergaard
M
,
Vedsted
P
. Chronic care management in Danish general practice--a cross-sectional study of workload and multimorbidity. BMC Fam Pract. 2012;13(1):52. doi:.https://doi.org/10.1186/1471-2296-13-52
10
Bähler
C
,
Huber
CA
,
Brüngger
B
,
Reich
O
. Multimorbidity, health care utilization and costs in an elderly community-dwelling population: a claims data based observational study. BMC Health Serv Res. 2015;15(1):23. doi:.https://doi.org/10.1186/s12913-015-0698-2
11
Barnett
K
,
Mercer
SW
,
Norbury
M
,
Watt
G
,
Wyke
S
,
Guthrie
B
. Epidemiology of multimorbidity and implications for health care, research, and medical education: a cross-sectional study. Lancet. 2012;380(9836):37–43. doi:.https://doi.org/10.1016/S0140-6736(12)60240-2
12
Campion
EW
. Can house calls survive?
N Engl J Med. 1997;337(25):1840–1. doi:.https://doi.org/10.1056/NEJM199712183372511
13
Boerma
WGW
,
Groenewegen
PP
. GP home visiting in 18 European countries. Eur J Gen Pract. 2001;7(4):132–7. doi:.https://doi.org/10.3109/13814780109094331
14
Cohidon
C
,
Cornuz
J
,
Senn
N
. Primary care in Switzerland: evolution of physicians’ profile and activities in twenty years (1993-2012). BMC Fam Pract. 2015;16(1):107. doi:.https://doi.org/10.1186/s12875-015-0321-y
15
Mueller
Y
,
David
S
,
Cohidon
C
,
Locatelli
I
,
Senn
N
. Home visits made by general practitioners in the canton of Vaud between 2006 and 2015. Swiss Med Wkly. 2019;149:w20037. doi:.https://doi.org/10.4414/smw.2019.20037
16
Lamers
LM
,
Vliet
RCJA
. Health-based risk adjustment Improving the pharmacy-based cost group model to reduce gaming possibilities. Eur J Health Econ. 2003;4(2):107–14. doi:.https://doi.org/10.1007/s10198-002-0159-9
17Common Institution of Health Insurance Law. 2012. Gemeinsame Einrichtung Krankenversicherungsgesetz, KVG. https://www.kvg.org/de/risikoausgleich-_content---1--1047.html (last accessed 2021 April 16)
18R Core Team. R: A language and environment for statistical computing. In: Computing RFfS, editor. Vienna, Austria 2018.
19
Joyce
C
,
Piterman
L
. Trends in GP home visits. Aust Fam Physician. 2008;37(12):1039–42.
20
Lykkegaard
J
,
Larsen
PV
,
Paulsen
MS
,
Søndergaard
J
. General practitioners’ home visit tendency and readmission-free survival after COPD hospitalisation: a Danish nationwide cohort study. NPJ Prim Care Respir Med. 2014;24(1):14100. doi:.https://doi.org/10.1038/npjpcrm.2014.100
21
Elkan
R
,
Kendrick
D
,
Dewey
M
,
Hewitt
M
,
Robinson
J
,
Blair
M
, et al.
Effectiveness of home based support for older people: systematic review and meta-analysis. BMJ. 2001;323(7315):719–25. doi:.https://doi.org/10.1136/bmj.323.7315.719
22
Cornwell
T
. House calls are reaching the tipping point – now we need the workforce. J Patient Cent Res Rev. 2019;6(3):188–91. doi:.https://doi.org/10.17294/2330-0698.1719
23National Institute for Health and Care Excellence (NICE). Chapter 6 GP-led home visits. Emergency and acute medical care in over 16s: service delivery and organisation. NICE guideline 94. NICE; 2018
24
Saultz
JW
. Defining and measuring interpersonal continuity of care. Ann Fam Med. 2003;1(3):134–43. doi:.https://doi.org/10.1370/afm.23
25
Martínez-González
NA
,
Rosemann
T
,
Tandjung
R
,
Djalali
S
. The effect of physician-nurse substitution in primary care in chronic diseases: a systematic review. Swiss Med Wkly. 2015;145:w14031. doi:.https://doi.org/10.4414/smw.2015.14031
26
Yao
NA
,
Rose
K
,
LeBaron
V
,
Camacho
F
,
Boling
P
. Increasing role of nurse practitioners in house call programs. J Am Geriatr Soc. 2017;65(4):847–52. doi:.https://doi.org/10.1111/jgs.14698
27
Gysin
S
,
Bischofsberger
I
,
Meier
R
,
van Vught
A
,
Merlo
Ch
,
Essig
S
. Nurse Practitioners in Swiss Family Practices as Potentially Autonomous Poviders of Home Visits: An Exploratory Study of Two Cases. Home Health Care Manage Pract. 2021;3:1–6.
28
Macdonald
G
,
Vernon
G
,
McNab
D
,
Murdoch
JC
. Home visits for vulnerable older people: journeys to the ‘Far End’. Br J Gen Pract. 2020;70(699):479–80. doi:.https://doi.org/10.3399/bjgp20X712685
29
Mitchell
S
,
Hillman
S
,
Rapley
D
,
Gray
SDP
,
Dale
J
. GP home visits: essential patient care or disposable relic?
Br J Gen Pract. 2020;70(695):306–7. doi:.https://doi.org/10.3399/bjgp20X710345
30
Huber
CA
,
Schwenkglenks
M
,
Rapold
R
,
Reich
O
. Epidemiology and costs of diabetes mellitus in Switzerland: an analysis of health care claims data, 2006 and 2011. BMC Endocr Disord. 2014;14(1):44. doi:.https://doi.org/10.1186/1472-6823-14-44
31
Haller
E
,
Watzke
B
,
Blozik
E
,
Rosemann
T
,
Reich
O
,
Huber
CA
, et al.
Antidepressant prescription practice and related factors in Switzerland: a cross-sectional analysis of health claims data. BMC Psychiatry. 2019;19(1):196. doi:.https://doi.org/10.1186/s12888-019-2178-4