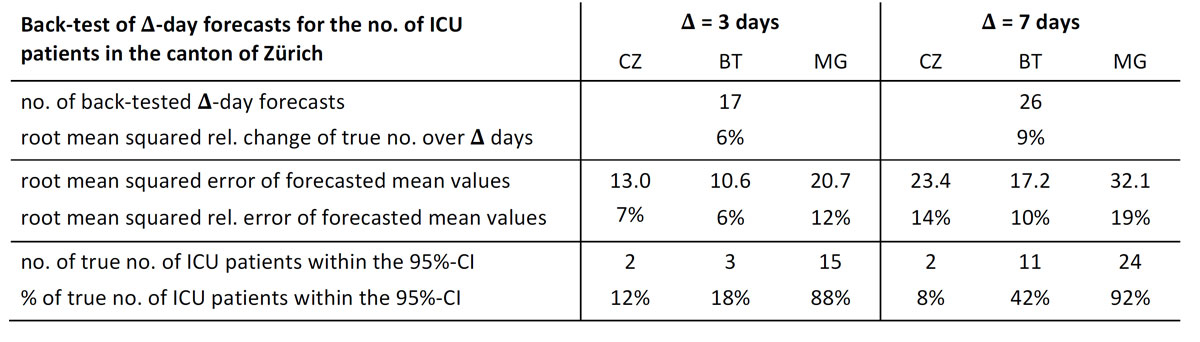
Figure 1 Summary of the comparison of the true numbers of ICU patients in the canton of Zürich versus the 3-day and 7-day forecasts according to models CZ, BT and MG. The data cover the period from 1 November to 23 December 2020 (reporting date).
DOI: https://doi.org/10.4414/smw.2021.20524
Compartmental models, such as the well-known SEIR model, which divides the population into Susceptible (to the infection), Exposed, Infectious and Recovered persons, and mathematically models their interdependence, are paradigms of mathematical epidemiology. It is therefore natural that epidemiologists attempt to use appropriate variations of such models to forecast quantities of interest and importance to policymakers during the COVID-19 pandemic. Common to all these models and variations is that they are based on the complex mathematics of differential equations.
Although differential equations prove appropriate to model a great variety of processes in very different fields, this is not granted in every single case and for every task. To appreciate more easily possible problems or weaknesses in their use for forecasting, we do not argue on a purely abstract level, but in the context of representative models and their evolution equations.
Two examples of models that are presently used are described in [1] and called there BT and CZ. They are implemented on icumonitoring.ch, a platform developed for short-term forecasting of intensive care unit (ICU) occupancy in Switzerland during the present pandemic. Currently, the platform provides forecasts derived by yet one further model, termed the MG model, which implements forecasting based on data-driven time series [2]. As far as we know, this model has not been published yet.
In the following, we briefly sketch the mathematical content of model BT. Readers not familiar with ordinary differential equations may skip this material and proceed directly to the section “Performance of icumonitoring.ch” where we show that the performance of the models used by icumonitoring.ch has been poor in the past.
In the third section, we discuss conceptual shortcomings of models BT and CZ that are likely to contribute to their poor performance. In the next section, we argue on general grounds that differential equations are neither well suited, nor actually needed for short-term forecasting of the impact of infectious diseases. In the last section, we propose a very simple hands-on method for short-term forecasting (in the spirit of recent proposals described in [3]).
We now turn to Model BT. This model consists of systems of ordinary differential equations describing the time evolution of the following quantities: The number of susceptible individuals, S(t), the number of exposed individuals, E(t), and the number of infected individuals, I(t), at time t. The relevant equations are:
dS/dt = ‒ SβI,
dE/dt = SβI ‒ τE,
dI/dt = τE ‒ γI.
In writing these equations we have replaced S(t) by S, etc. for ease of notation. This system of equations is extended by the following two equations for the numbers of hospitalised patients, H(t), and of ICU patients, U(t):
dH/dt = ϵH γI ‒ γHH,
dU/dt = γH ϵH21 H ‒ γU U.
The (posterior) distributions of the parameters β, τ, γ, γH, γU, ϵH, and ϵH21 are determined at a cantonal level, using standard techniques and tools; but this is of no importance in the following. For details, as well as for a similar system of deterministic ordinary differential equations, corresponding to the model CZ, and parameters appearing in the equations, we refer the reader to [1].
Forecasting the number of ICU patients is then done as follows. If, on a day t = t0 , the true numbers Strue (t0 ), Etrue (t0 ), Itrue (t0 ), Htrue (t0 ) and Utrue (t0 ) are known from direct observation or inferred from other, directly observable quantities, and assuming the distribution of the above parameters is known, we can calculate the distribution of U(t0 + Δ), for Δ > 0, by solving the above system of differential equations with initial values S(t0 ) = Strue (t0 ), etc. Among the forecasts provided by icumonitoring.ch are the mean values and the 95% confidence intervals of U(t0 + Δ), for Δ equal to 3 and 7 days.
For definiteness, we have restricted the quantitative analysis of the performance of icumonitoring.ch to the canton of Zürich. Moreover, as the platform does not provide possibilities to download past forecasts, our data only cover the period from 1 November to 23 December 2020 (reporting date). During this period, we took screenshots of data whenever we found updated results on the platform.
Back-testing, i.e., comparing forecasted data with true, observed data on ICU patients, reveals that the forecasting of icumonitoring.ch did not perform satisfactorily.
Whereas the true numbers of ICU patients changed on average by about 6% (9%) over a 3-day (7-day) period, the relative deviation of the 3-day (7-day) forecasts from the true numbers was 7% (14%) for model CZ, 6% (10%) for BT and 12% (19%) for MG (figure 1). Hence, the forecasted mean values were not more accurate than if one had simply predicted that the number of ICU patients would remain constant for the following 3 (7) days.
Figure 1 Summary of the comparison of the true numbers of ICU patients in the canton of Zürich versus the 3-day and 7-day forecasts according to models CZ, BT and MG. The data cover the period from 1 November to 23 December 2020 (reporting date).
Moreover, the true numbers of ICU patients seldom lay within the 95% confidence intervals (CIs) of the numbers forecasted by models CZ and BT. Although the number of days for which we know the true and the forecasted numbers is rather small (17 days for 3-day forecasts and 26 for 7-day forecasts), it is improbable that only 2 (2) of the 3-day (7-day) forecasts fall into the 95% CIs of model CZ. The values for model BT are 3 (11). The 95% CIs of model MG are very broad, and include all but two of the true numbers.
We also note that the CIs differ significantly between the three models: the average of the widths of the 3-day (7-day) CIs was 3 (3) for model CT, 34 (62) for model BT, and 64 (126) for model MG. (From the CIs of model MG displayed in figure 2 we conclude that, apparently, the calculation of the CIs of model MG has changed since mid-November. Taking into account only the CIs after the change, we obtain an average width of the CIs of 29 [56] for the 3-day [7-day] forecasts.) Moreover, for certain predictions, the CIs of two models turned out to be disjointed; e.g., the CI of the 3-day forecast for7 December 2020, is 184–187 for model CZ, and 188–270 for model BT.
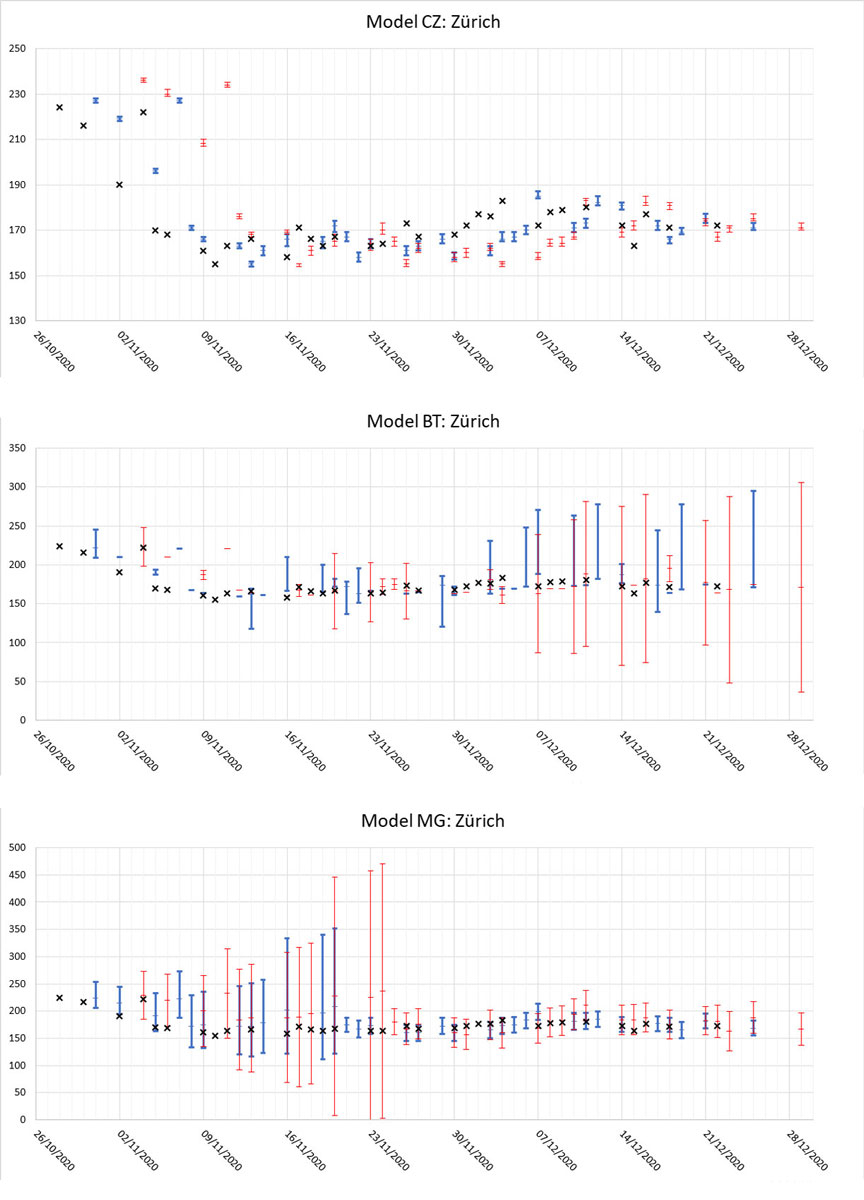
Figure 2 Comparison of true numbers of ICU patients in the canton of Zürich (black crosses) versus its 3-day (blue) and 7-day (red) forecasted mean values and 95% confidence intervals according to models CZ, BT and MG [4].
To conclude this section, we point out that there are no credibility weights assigned to the three models. As a consequence, the interpretation of such contradictory results is left to the user.
A reason for the poor performance of icumonitoring.ch may most likely be found in systematic errors caused by conceptual shortcomings of models CZ and BT.
One such shortcoming lies in the use of purely deterministic evolution equations to model a process that is inherently stochastic. This leads to an underestimation of the true width of CIs. To remedy this flaw, one might attempt to complement the deterministic differential equations by some stochastic perturbation terms. (Actually, one also has to take into account systematic errors due to model uncertainties to get appropriate confidence intervals.) This would require an estimation of the distributions of such terms, a task we expect to be difficult.
Another shortcoming of those models lies in the use of ordinary differential equations of first order. This implies that the past of the trajectory traced out by the numbers of susceptible, exposed, infectious … individuals to arrive at their initial values Strue (t0 ), Etrue (t0 ), … has no impact on the predicted numbers, whereas in reality, it clearly has. As a remedy for this problem, one might resort to age-structured models (sometimes called delay- or integro-differential equations), which in a natural way extend the SEIR-type models (see e.g., [5], section 4).
A third shortcoming of the models is that there is no differentiation between age groups, leading to generally unreliable forecasts as soon as the age structure of the infected individuals changes significantly over time. This has been remarked in [1], and it was announced that a remedy would appear in “a future iteration of our models”, which, however, has not been implemented so far. An appropriate extension of models CZ and BT is possible without any difficulties. It results in an enlarged system of equations (the enlargement factor being given by the number of age groups). This renders estimates of the numerous parameters appearing in the equations very challenging.
Thus, if the conceptual shortcomings of models CZ and BT were to be addressed in the framework of differential equations, one would end up with a complicated system of stochastic integro-differential equations. The question then arises whether such complex and sophisticated mathematical tools are efficient (and necessary) for short-term forecasting.
More fundamentally, one may ask why one would at all consider using differential equations in coping with the task of short-term forecasting. In this case, one is not interested in modelling the spread of the virus and its consequences in continuous time. Inter-day variations are very big and, moreover, are of minor interest when attempting to understand the spread of the disease. The natural time unit in monitoring and modelling the spread of a contagious disease is one day or several days. If we resort to models such as SEIR, which are formulated in continuous time, then we have to bear in mind that using models with a continuous time parameter is just an approximation to more reliable models with discrete time steps. The approximation is often made because, typically, the analysis of solutions of differential equations with continuous time more easily yields interesting qualitative insights into properties of the dynamics than the analysis of finite-difference equations with discrete time. Thus, while fundamental laws of physics are usually written in the language of differential equations, and discretizing time is merely used to solve them numerically, natural models of the spread of contagious diseases should be formulated in a discrete time framework, and we might then resort to continuous-time differential equations as approximations to the discrete-time models in order to gain qualitative insights in the dynamics of the disease more easily.
Short-term forecasting is, however, not a qualitative task. In order to be relevant, it has to be quantitative. The numerical calculations needed for the short-term forecasting can be performed on present-day computers. Abstract qualitative reasoning is of no interest, and hence approximations based on the use of differential equations might be quite irrelevant.
As a hands-on alternative, we suggest simply fitting a small number of curves f(t) to the observed numbers of ICU patients of the most recent 10 or so days. The curves should be parametrized by two or at most three parameters to avoid overfitting. Examples are polynomials of order 1 and 2, exponentials of the form f(t) = a + bexp(c(t0 ‒ t)) and maybe logarithms of the form f(t) = a + blog(c + t). The parameters can be determined using the method of least squares. The exact period over which the fitting is made is selected by visual inspection to exclude outliers, etc. Finally, the best estimate 3- and 7-day forecasts are made by expert judgement based on the values that the fitted curves attain at t = t0 + 3 and t = t0 + 7, respectively.
As for the uncertainty of these best estimate forecasts, we propose considering how the best estimates would have performed in the past.
Based on the example of the models implemented on icumonitoring.ch, and on general theoretical considerations, we argue that the framework of continuous-time differential equations is not suited to making reliable short-term predictions on quantities such as ICU occupancy in Swiss hospitals. Instead, we propose the use of very simple, hands-on forecasting based on fitting parameters of suitably chosen curves to the observed data, and making the forecast by expert judgement based on the results of the fitted curves.
We thank Hans Rudolf Künsch for a very concise private crash course on some aspects of mathematical statistics used in epidemiology.
The authors had no financial support nor any other potential conflict of interest relevant to this article.
1 Zhao C , Tepekule B , Criscuolo NG , Wendel Garcia PD , Hilty MP , Fumeaux T , et al.; Risc-Icu Consortium Investigators In Switzerland. icumonitoring.ch: a platform for short-term forecasting of intensive care unit occupancy during the COVID-19 epidemic in Switzerland. Swiss Med Wkly. 2020;150:w20277. doi:.https://doi.org/10.4414/smw.2020.20277
2icumonitoring.ch/About [Internet]. Available from: https://icumonitoring.ch/ [cited 2020 December 5].
3Fröhlich J, Wyler D. Epidemiology in the force field of mathematics and politics. VSH-Bulletin Nr. 3/4, November 2020
4Data from screenshots of icumonitoring.ch [Internet]. Available from: https://icumonitoring.ch/ [Site visited regularly between 1 November and 23 December 2020].
5Luckhaus S. Mathematical Epidemiology, SIR Models and COVID-19. Preprint. Available from www.mis.mpg.de/preprints/2020/preprint2020_60.pdf
The authors had no financial support nor any other potential conflict of interest relevant to this article.