Two-dimensional transthoracic echocardiography at rest for the diagnosis, screening and management of pulmonary hypertension
DOI: https://doi.org/10.4414/smw.2021.20486
Nicolas
Bruggera, Mona
Lichtblaub, Micha T.
Maederc, Hajo
Müllerd, Cyril
Pellatone, Patrick
Yerlyf
on behalf of the Swiss Society for Pulmonary Hypertension (SSPH)
a Cardiology Department, Bern University Hospital (Inselspital), Bern, Switzerland
b Pulmonology Department, Zurich University Hospital (USZ), Zurich, Switzerland
c Cardiology Department, Kantonspital St Gallen, St Gallen, Switzerland
d Cardiology Department, Geneva University hospital (HUG), Geneva, Switzerland
e Cardiology Department, Neuchâtel hospital network, site de Pourtalès, Neuchâtel, Switzerland
f Cardiology Department, Lausanne University Hospital (CHUV), Lausanne, Switzerland
Summary
Doppler echocardiography is widely used in everyday clinical practice for the detection of pulmonary hypertension (PH) in symptomatic patients and in populations particularly at risk of pulmonary arterial hypertension (PAH). It allows accurate estimation of systolic pulmonary arterial pressure but may lack precision in particular situations. In addition, echocardiography can help to distinguish between pre- and post-capillary PH and is a very good tool to evaluate right ventricular systolic function, which is of great prognostic interest in PAH. This article reviews the current knowledge about methodologic aspects of assessing pulmonary pressure and PH origin by echo, including a discussion about abnormal thresholds. It also details advanced techniques like right ventricular strain imaging and new concepts like right ventricle – pulmonary artery coupling evaluation that have become “matured” enough to be definitely brought to routine evaluation.
Abbreviations
- A4C
-
apical four-chamber view
- CMR
-
cardiac magnetic resonance imaging
- CTEPH
-
chronic thromboembolic pulmonary hypertension
- CW
-
continuous wave Doppler
- FAC
-
fractional area change
- HIV
-
human immunodeficiency virus
- IVS
-
interventricular septum
- LA
-
left atrium
- LV
-
left ventricle
- LVEF
-
left ventricular ejection fraction
- mPAP
-
mean PA pressure
- MPI
-
myocardial performance index
- NTproBNP
-
N-terminal pro-B-type natriuretic peptide
- PA
-
pulmonary artery
- PAH
-
pulmonary arterial hypertension
- PAWP
-
PA wedge pressure
- PH
-
pulmonary hypertension
- PVR
-
pulmonary vascular resistance
- PW
-
pulsed wave Doppler
- RA
-
right atrium
- RAA
-
RA area
- RAP
-
right atrial pressure
- RV
-
right ventricle
- RVGLS
-
right ventricle global longitudinal strain
- RVF-A4C
-
RV-focused four-chamber view
- RVEDA
-
right ventricular end-diastolic area
- RVESA
-
right ventricular end-systolic area
- RVESRI
-
RV end-systolic remodelling index
- sPAP
-
systolic pulmonary arterial pressure
- TA
-
tricuspid annulus
- TAPSE
-
tricuspid annular plane systolic excursion
- TDI
-
tissue Doppler imaging
- TTE
-
transthoracic echocardiography
- TRV
-
tricuspid regurgitation velocity
Introduction
Despite advances in other techniques, resting two-dimensional transthoracic echocardiography (TTE) remains key in the diagnosis, screening and follow-up of pulmonary hypertension (PH) [1]. Whereas TTE was used at first to estimate PH probability, it can also be used to determine the possible cause of PH and to evaluate right ventricular (RV) morphology and function. Nevertheless, in recent years, the reliability of TTE to estimate pulmonary pressure has been challenged [2–4] and recent algorithms proposing serial noninvasive risk assessment in pulmonary arterial hypertension (PAH) dismissed TTE [5, 6]. On the other hand, advanced techniques such as right ventricular strain assessment by speckle tracking imaging and new concepts like indirect right ventricle – pulmonary artery (PA) coupling evaluation improved the ability of TTE to predict outcome and to further understand the intimate relationship between the heart and pulmonary circulation.
With this review, the goal of the Swiss Society of Pulmonary Hypertension is to provide an update on current strengths and limitations of 2-D TTE in PH for sonographers and to encourage the implementation of convincing new findings in everyday practice. This review is also an attempt to gather sonographers from different PH expert centres of the country in order to define a consensus on TTE realisation. The authors hope that enhanced TTE standardisation will help PH physicians to get all the information they need to manage their patients at the highest quality level.
Echocardiography to assess pulmonary hypertension probability
TTE should be performed in all patients with suspected PH or unexplained dyspnoea, and in those at high risk of PAH with the aim of assessing PH probability [1]. Systolic pulmonary artery pressure (sPAP) can be assessed in 80–90% of cases and PH (sPAP >36 mm Hg) can be detected with 80–85% sensitivity-specificity by experienced sonographers [7]. In practice, sPAP is usually measured by applying the simplified Bernoulli equation to peak tricuspid regurgitation velocity (TRV) measured with continuous wave Doppler (CW), where sPAP = 4·(TRV)2 + right atrial pressure (RAP) (fig. 1). Importantly, RAP is not measured but estimated from inferior vena cava diameter and inspiratory collapse [8]. TRV must be obtained from multiple views (parasternal long and short axis, apical four-chambers view), finally taking into account the maximum value obtained from the best quality TR jet envelope [9]. If peak TRV is hard to define, agitated saline can be injected to improve definition, but with the risk of overestimation due to contrast artefacts. Of note, TRV is not the only technique to estimate PAP by echo and alternatives based on pulmonary acceleration time and pulmonary regurgitation have been described; however, all have limitations [10].

Figure 1 A. Incomplete continuous wave (CW) Doppler spectral wave envelope leading to peak tricuspid regurgitation velocity (TRV) underestimation (3.69 m/s). B. same patient after correct adjustment of CW Doppler in TR jet with correct TRV estimation (4.15 m/s). C. Inadequate CW gain with “fringes” and peak TRV overestimation (pink cross: 5.62 m/s); correct peak TRV estimation in modal frequency (4.69 m/s). D and E. Inferior vena cava (IVC) size during expiration and “sniff” in the same patient. SPAP = systolic pulmonary arterial pressure
Because of worries about overdiagnosis of PH, European guidelines conservatively set the maximum upper limit of normal peak TRV at 2.8 m/s, corresponding to an RV/RA pressure gradient of 31.3 mm Hg and to sPAP of 36.3 mm Hg if 5 mm Hg RAP is assumed [1]. On the other hand, the “classification” task force of the 2018 World Symposium on PH considered that the definition of PH should be strictly set according to epidemiological evidence and hence that the threshold for invasively measured abnormal mPAP should be reduced from 25 mm Hg (current guideline definition) to 21 mm Hg [11]. On the basis of epidemiological data for TTE, the upper limit of normal TRV can be considered to be 2.55 m/s, according to a recent meta-analysis pooling authors’ original data with 16 published studies [12]. According to the Bernoulli formula and assuming 5 mm Hg for RAP, a normal sPAP value would then not exceed 31 mm Hg, which is very near to the 29.6 mm Hg found by right heart catheterisation in healthy people [13]. Harmonising TTE thresholds for PH detection with the new invasive PH definition will be a task for the next European guidelines.
Despite adequate predictive values for PH detection, TTE may still lack precision for sPAP estimation [2–4, 7, 14], suggesting that it is reliable for disease screening, but that sPAP estimates can be falsely high or low under particular conditions. Importantly, TTE is accurate, meaning that there is no systematic bias for under- or overestimation [3, 4], although underestimation is probably more frequent [2, 3]. In everyday practice, imprecision should lessen if echocardiographers are aware of the pitfalls linked to sPAP evaluation [14]. Furthermore, obvious imprecision should be adequately recorded on TTE reports. The commonest causes of sPAP underestimation are incomplete spectral wave envelopes (fig. 1) and substantial angulation between CW and TR jet direction (maximum acceptable angle = 30°) [7]. Both pitfalls can often be resolved by a multiplane approach to TRV, including atypical views [9]. A less frequent reason for underestimation is severe TR, which rapidly abolishes the RV/RA pressure gradient and is typically recognisable by a dense triangular early peaking jet [7]. Furthermore, severe TR implies a non-stenotic orifice, where the simplified Bernouli equation does not apply. Common causes of sPAP overestimation are mistaking a TV closure artefact for the TR jet and incorrect assignment of a peak TRV out of the modal frequency (the frequency at which most red blood cells are moving, represented by the dense part of CW signal) in the case of maximum velocity boundary artefacts (“fringes”; fig. 1). This pitfall is avoided by carefully decreasing Doppler gain to improve the signal-to-noise ratio [7, 14]. Finally, RAP estimation according to inferior vena cava size and collapsibility is a major source of imprecision and very weakly correlates with invasive measurement [2, 3]. Very elevated RAPs are systematically underestimated with a TTE algorithm considering 15 mm Hg as the maximum achievable value, and up to 50% of overestimated sPAP can be attributed to RAP overestimation [2]. Consequently, current European PH guidelines removed RAP from their algorithm of PH probability estimation and concentrated only on TRV [1].
In order to improve the positive predictive value of TTE and given the possibility of missing PH if TRV-based sPAP is underestimated, guidelines recommend looking for indirect signs of PH in the case of normal or moderately elevated TRV [1]. Indirect signs are detailed and illustrated in figure 2 and must be looked for at the levels of the ventricles, PA, inferior vena cava and RA. In all situations except low PH probability, patients should be referred to PH expert centres for further investigations including right heart catheterisation unless they present evident heart or lung disease (suggesting group 2 or 3 PH) compatible with TTE findings (fig. 3) [1, 15].

Figure 2 Indirect signs of pulmonary hypertension at the levels of the ventricles, pulmonary valve / pulmonary artery and inferior vena cava / right atrium. Adapted from Galiè 2016 [1].

Figure 3 Evaluation of the echocardiographic probability of pulmonary hypertension and further management in a 4 steps approach. For management, consider if the patient has risk factors (RF) or associated conditions for pulmonary artery hypertension (PAH), or chronic thromboembolic pulmonary hypertension (CTEPH). Adapted from Galiè 2016 [1]. Other TTE signs are considered if ≥2 indices from ≥2 classes are present.
* Low peak TRV = ≤2.8 m/s according to guidelines and ≤2.55 m/s according to epidemiological data (cf text). ** Intermediate peak TRV = 2.8–3.4 m/s according to guidelines; lower limit >2.55 m/s according to epidemiological data (cf text). *** High peak TRV = >3.4 m/s according to guidelines.
Echocardiography to evaluate the cause of pulmonary hypertension
Although right heart catheterisation is required to definitely differentiate precapillary (pulmonary artery wedge pressure [PAWP] ≤15 mm Hg) from postcapillary (PAWP >15 mm Hg) PH, TTE can fairly well predict the likelihood of both conditions [16–19]. This task can be challenging or sometimes impossible, particularly in patients with combined pre- and postcapillary PH, which shares features of both disorders [20, 21]. The general approach is to systematically look at parameters favouring either pre- or postcapillary PH and to develop a working diagnosis based on the predominant echo findings and the global clinical context. Referring patients to PH expert centres for right heart catheterisation and further investigations will finally be required only in unclear situations, when PAH or chronic thromboembolic pulmonary hypertension (CTEPH) is suspected or in the case of severe PH or RV dysfunction (fig. 3) [1, 15].
Table 1 gives an overview of clinical and TTE arguments favouring each condition. If left ventricular ejection fraction (LVEF) is clearly impaired or if there is severe aortic or mitral valve disease, postcapillary PH is very likely. Of note, heart failure and severe left-sided valvular heart disease can sometimes present without PH or alternatively with combined pre- and postcapillary PH. If LVEF is preserved or mildly reduced with no significant valve disease, attention must be paid to markers of elevated left-sided filling pressures. In this context, the ratio of the peak early mitral inflow velocity to peak early mitral annular velocity (E/e′) is important. Even though E/e′ was found to be only mildly correlated to LV end-diastolic pressure and PAWP in patients with preserved LVEF [22], elevated E/e′ turned out to be a useful marker of a postcapillary disorder in PH [17, 18]. Given that e′ at the septal annulus may be influenced by right ventricular dysfunction, only e′ measured at the lateral annulus should be used to calculate E/e′. The measurement of left atrial (LA) size (LA anteroposterior diameter in parasternal long axis view, LA area in apical four-chamber view or preferably biplane LA volume index) is also important as it mirrors PAWP and LV filling pressure. LA dilatation is therefore a strong argument in favour of postcapillary PH. In addition, comparing the size of the left and right atria (RA) can give a feeling of the predominant problem, i.e., postcapillary PH if LA > RA and vice versa.
Table 1 Clinical features and non-invasive findings favouring precapillary or postcapillary pulmonary hypertension (PH).
| |
Pre-capillary PH
|
Post-capillary PH
|
|
Clinical features
|
|
|
| Atrial fibrillation*
|
No |
Yes |
| Obesity/diabetes*
|
No |
Yes |
| Coronary artery disease |
No |
Yes |
|
Chest X-ray
|
No pulmonary congestion |
Pulmonary congestion |
|
ECG
|
RV hypertrophy/strain |
LV hypertrophy/strain |
|
Echocardiography
|
|
|
| LV+LA area <RV+RA area†
|
Yes |
No |
| Apex-forming RV†
|
Yes |
No |
| RV end-diastolic area*
|
↑ |
↓ |
| LV mass*
|
↓ |
↑ |
| LV eccentricity index (degree of LV “D-shape”)†
|
↑ |
~1.0 |
| E/e′†,‡
|
↓ |
↑ |
| LA area (apical for chamber view)*
|
↓ |
↑ |
| LA anteroposterior diameter (parasternal long axis view)‡
|
<3.2 cm |
>4.2 cm |
| Mitral regurgitation |
No/little |
Little to severe |
| Peak TRV / VTI RVOT |
↑ |
Normal/↓ |
| Mid-systolic notch in pulmonary artery PW Doppler signal or acceleration time <80 ms‡
|
Yes |
No |
| IVC diameter >20 mm without inspiratory collapse (≤50%)†
|
Yes |
No |
Given that no single parameter can differentiate pre- from postcapillary PH, several echo scores combining the most important parameters have been developed [17–19]. Table 1 shows the components of the three most important scores. Overall, the best predictors of precapillary PH include a small LA [17, 19], a dilated RV [18, 19], a clear septal D-shape [18], a notch in the pulsed wave Doppler (PW) signal of the pulmonary artery or a short acceleration time (<80 ms) [17]. The areas under the curves for these scores to predict precapillary PH range from 0.76 [18] to 0.93 [19]. Although these scores are not perfect and cannot replace right heart catheterisation in general, they can identify patients with clear postcapillary PH who will not require invasive assessment. For example, a patient with E/e′ >10, LA diameter >4.2 cm and no notch in the PA PW signal is very unlikely to have precapillary PH [17].
Finally, TTE is also useful in identifying congenital heart disease. Shunts must be suspected in cases of high pulmonary blood flow (PW Doppler), but may remain anatomically hidden as in the case of sinus venosus atrial septal defects or anomalous pulmonary venous return. Transoesophageal echo or cardiac magnetic resonance imaging (CMR) is warranted to define anatomical structures in such situations [1, 15].
Echocardiography to assess right ventricular remodelling
With its thin wall and relatively nonmuscular structure, the RV is branched to the low resistance pulmonary vascular tree and faces low afterload in physiological conditions. With PH, hydraulic load increases and forces the RV to adapt itself in order to maintain stroke volume and cardiac output, or, in other words, to remain “coupled” to the pulmonary circulation. At first, RV contractility increases by a factor of 4 to 5 by the mean of increased sympathetic tone, hypertrophy and changes in muscle properties. This process is usually insufficient in severe PH and further stroke volume preservation can only be attempted through the Franck-Starling mechanism with an increase in RV end-diastolic volume [23–25]. To some extent, this adjustment is unavoidable in idiopathic PAH [26] and is considered maladaptive because RV dilation inevitably increases wall tension, which results in turn in increased oxygen demand, increased wall stiffness and increased ventricular interaction leading to further decreased cardiac output and eventually death [23]. As a clinical correlate, RV end-diastolic volume assessed by CMR is a very strong predictor of mortality in idiopathic PAH [27]. Unfortunately, RV 3-D geometry is too complex to allow volume modelling by simple geometrical assumptions on 2-D echo, but surrogates overcome this issue.
Assessment of right ventricular dimensions
On TTE, the RV appears to be wrapped around the left ventricle (LV) like a crescent in parasternal short axis view and appears with a triangular cavity from apical four-chamber view (A4C). RV cavity area can be measured from this view at end-diastole and serve as a substitute for RV volume (table 2) (RV end-diastolic area = RVEDA). RVEDA reference values vary according to gender, ethnicity and body surface area, and are higher in athletes than in sedentary subjects [28]. In PH, RVEDA is closely related to RV pump function [29] and responds to therapy in PAH and CTEPH [30]. On the other hand, well-defined RVEDA prognostic values are lacking in PH and RVEDA is mildly reproducible [31, 32]. Indeed, RV pronounced trabeculations and retrosternal location challenge echocardiographic evaluation and RV size may significantly fluctuate according to small plane variations in A4C [8]. Nevertheless, interobserver variability seemed to refine with time [33], possibly thanks to improved echocardiographic guidelines regarding RV imaging [8]. Typically, the RV-focused A4C (RVF-A4C) used to assess RVEDA differs from standard A4C view. It is obtained by moving the transducer more laterally in order to visualise the maximum basal RV width as well as the RV apex, which avoids RV foreshortening and usually brings the LV apex at the top of the scanning sector [8]. Of importance, the issue of RVEDA variability according to scanning plane can be attenuated by expressing RV dimensions in relation to LV metrics. Goda et al. recently showed that RV to LV end-diastolic area ratio ≥0.93 predicted lower survival in PAH and added incremental value to age, gender and functional class in risk prediction [33]. Although imperfect, RVEDA and RV to LV EDA ratio remain the proper ways to assess RV remodelling by 2-D TTE, the option of measuring RV diameter or RV to LV diameter ratio being poorly validated (table 2).
Table 2 Echocardiographic assessment of right ventricular size and systolic function (see text for references).
|
Parameter
|
Assessment / technique
|
Advantages
|
Limitations
|
Abnormality thresholds
|
Prognostic value in PH
|
|
RV dimensions
|
| RV basal diameter |
RV focused 4-ch view at end-diastole
Distance from lateral endocardial border to IVS right border parallel to TA plane
Max transversal dimension of the basal one third |
Easy and fast
Assessed from univoqual anatomical reference (unlike mid-diameter) |
Not indexed to BSA and gender
Not validated as a prognostic factor in PH
Dependent on probe rotation. May be underestimated. |
>41 mm |
Unknown |
| RV end-diastolic area |
RV focused 4-ch view
Manual tracing of RV endocardial border from lateral TA to apex back to medial TA along IVS at end-diastole and end-systole. |
Relatively easy and fast
No geometrical assumptions needed
Normal values well established
Correlated to RV pump function
Sensitive marker to reverse remodelling on therapy |
Mildly reproducible
Incomplete visualisation of RV cavity with severe enlargement
Suboptimal endocardial definition (trabeculations to be included in the cavity)
Sensitive to minor plane variations (attenuated if RVEDA related to LVEDA)
May under- or overestimate RV size |
Men >24 cm2
Women >20 cm2
RVEDA indexed for BSA
Men >12.5 cm2/m2
Women >11.5 cm2/m2
Normal right/left ventricle ratio <0.66 |
RVEDA prognostic values poorly defined
RVEDA/LVEDA >0.93 |
| RV end-systolic remodelling index |
RV focused 4-ch view
ratio of end-systolic RV free wall length to end-systolic septal height.
free wall length from lateral TA RV insertion of IVS. Septal height as a straight line from septal TA to RV insertion on IVS |
Less dependent on image acquisition
Corrects for apical foreshortening
Improved Intra-/interobserver variability
No need for endocardial border definition |
Derived from a single centre observation, not validated by others
Incomplete visualisation of RV free wall in the case of severe enlargement |
RVESRI <1.35: adapted
RVESRI 1.35–1.7: adverse remodelling
RVESRI >1.7: severe remodelling |
RVESRI >1.35 |
|
Direct indices of RV systolic function
|
| RV FAC |
RV focused 4-ch view
Manual tracing of RV endocardial border from lateral TA to apex and back to medial TA along IVS at end-diastole and end-systole.
(RVEDA − RVESA) / RVEDA |
Incudes longitudinal and radial systolic function (global RV systolic function)
Well correlated to RVEF
Not angle-dependent |
Same limitations as RVEDA
Does not consider outflow |
<35% |
Threshold values for prognosis poorly defined |
| TAPSE |
RV-modified 4-ch view. Cursor aligned on TA displacement axis
M-mode |
Quick and easy
Highly reproducible |
Not indexed to BSA and gender
Angle dependent
Load dependent
Sensitive to passive translational motions
Transversal shortening and outflow tract not accounted |
Normal: >21 mm
Mild/moderate/severe dysfunction:
18–20/16–17/≤15 mm |
Conflicting data
≤15 mm |
PW-TDI
S′ wave |
RV-modified 4-ch view. Cursor aligned on TA displacement axis
S′ velocity on lateral TA or basal RV free wall |
Quick and easy
Highly reproducible
Less dependent on image quality than TAPSE |
Similar to TAPSE |
<9.5–10 cm/s |
No specific data in PH |
RV-MPI
By PW-TDI |
Tissue Doppler on TA in RV-focused 4-ch view
End of a′ to onset of e′(= a′–e′) waves interval and onset to end of S′ wave (= S′)
MPI = [(a′-e′) − S′] / S′ |
Single beat acquisition |
Not a “pure” systolic function index
Unreliable in elevated RA pressure
Highly load dependent |
Normal: <0.38
Upper reference limit
<0.54–0.55 |
>0.64 |
| RV MPI by PW Doppler |
Conventional RV inflow and outflow Doppler
End of A to onset of E waves interval on inflow (=A–E); onset to end of S wave on outflow (=S)
MPI = [(A–E) − S] / S |
|
Requires 2 different heartbeats with possibly different cycle lengths
Unreliable in atrial fibrillation
Other limitations similar to RV-MPI by PW-TDI |
Normal: <0.28
Upper reference limit: <0.43 |
>0.83 |
| RV longitudinal free wall strain |
RV-focused 4-ch view
Sector depth and size adjusted to visualise RV apex and obtain frame rate >50–60 Hz
Region of interest defined from lateral TA to RV apex (exclude RA and pericardium) |
Angle independent
Translational motion independent.
Reproducible |
Radial function not considered
outflow tract not considered
Load dependent
Software originally created for left ventricle
Inter-vendor variability.
Limited by image quality |
Normal <−25%
Associated with low RVEF from <−20% |
Worse prognosis: <−20%
Worst prognosis: <−15% |
| RV dyssynchrony |
Same technique as for RVLSFreewall
Standard deviation of time to peak strain across 4 (basal + mid IVS and free wall) segments |
Similar to RVLSFreewall
|
Similar to RVLSFreewall
|
Dyssynchrony = RV-SD4 <18–19 ms |
RV-SD4 >23 ms |
|
Indirect indices of RV systolic function
|
| Pericardial effusion |
Measurement in diastole where PEF appears the biggest |
Easy and fast |
Not sensitive for RV dysfunction
Not specific of RV dysfunction |
No effusion normally visualised |
<1 cm intermediate outcome
>1 cm poor outcome |
| Right atrial area |
RV-focused 4-ch view
Planimetry by endocardial border tracing at end-systole; exclude area between leaflets and annulus; exclude right appendage |
Relatively easy and fast
No geometrical assumptions needed |
Indirect measure of RV function
Accounts for dimension change in a single plane
Interobserver variability not well reported |
Men: 15.8–16.6 cm2
Women: 14.7–15.7 cm2
|
Worse prognosis: >18 cm2
Worst prognosis: >27 cm2
|
| Eccentricity index |
Parasternal short axis view
Papillary muscle level
End of systole (es) and/or end of diastole (ed)
LV diameter 1 parallel to IVS (LVD1) and LV diameter 2 perpendicular to LVD1 (LVD2)
EI = LVD1/LVD2 |
Reproducible |
Relatively cumbersome
Inaccurate if measured in oblique sections
Not independently associated with outcome in most studies |
Normal value ~1 |
EIed >1.56 and EIes >1.81 whatever RV function
Worst outcome with EIed >1.7 if TAPSE <15 mm |
| Tricuspid regurgitation |
Multiple views
Severe TR: vena contracta >7 mm, PISA radius >9 mm (Nyquist limit 28 cm/s) and systolic hepatic vein flow reversal |
Reproducible |
Moderate to severe TR associated with later stages of RV dilatation/dysfunction |
Mild TR usual with PH, does not affect prognosis |
Moderate to severe TR |
Alternatively, Amsallem et al. proposed an index of RV end-systolic dimension seemingly less influenced by image acquisition with low intra-/interobserver variability. Their RV end-systolic remodelling index (RVESRI) is derived by dividing RV free wall longitudinal length by septal height taken in RVF-A4C, which partially corrects for apical foreshortening and integrates both dimensional and functional aspects of RV adaptation to PH. In a collective of 228 PAH patients, baseline RVESRI was strongly and independently associated with death, transplantation or hospitalisation and was incremental to the REVEAL score to predict outcome (table 2) [34].
Echocardiography to assess right ventricular systolic function: direct indices
After size and volume, RV dysfunction is the most powerful predictor of death in PH [35], making RV systolic function assessment another essential aspect of TTE in PH. Systolic function can be regarded as the interplay between intrinsic factors such as contractility and heart rate, extrinsic factors such as preload and afterload, and inter-ventricular interaction [36]. Mechanistically, it results in RV emptying by three mechanisms: radial displacement of the free wall towards the interventricular septum (IVS), IVS bulging into the cavity, and shortening of the long axis with descent of the tricuspid annulus (TA) towards the apex. Practically, RV function is often first assessed qualitatively by visual evaluation, but quantitative measurements should always be preferred when possible.
Two-dimensional surrogates of right ventricular ejection fraction
Right ventricular ejection fraction (RVEF) assessed with CMR is an aggregate of longitudinal and radial components of RV emptying and is a strong outcome predictor in PAH [37]. However, it again refers to volume variations not assessable by 2-D echo. Instead, TTE can measure the percent change in RV area between end-diastole and end-systole RV fractional area change [FAC]), which is also an integration of longitudinal and radial shortenings (table 2, fig. 4). It is important to consider indices accounting for both RV radial and longitudinal shortening in PH because both components appear to be differently affected by afterload [38]. Indeed, CMR-based RVFAC is closely linked to RVEF whatever the PVR, whereas longitudinal function variables such as tricuspid annular plane systolic excursion (TAPSE) become weakly correlated to RVEF at high PVR [38, 39]. This finding may reflect a plateauing (“floor effect”) of longitudinal shortening after an initial parallel decline in both planes, further loss of systolic function being essentially generated by further leftward IVS bowing. Consequently, relying only on longitudinal shortening variables may create a false perception of stability in patients with severe PH and low but constant measurements, whereas consideration of changes in more integrative variables such as RVFAC may better reflect clinical evolution in these patients [40].
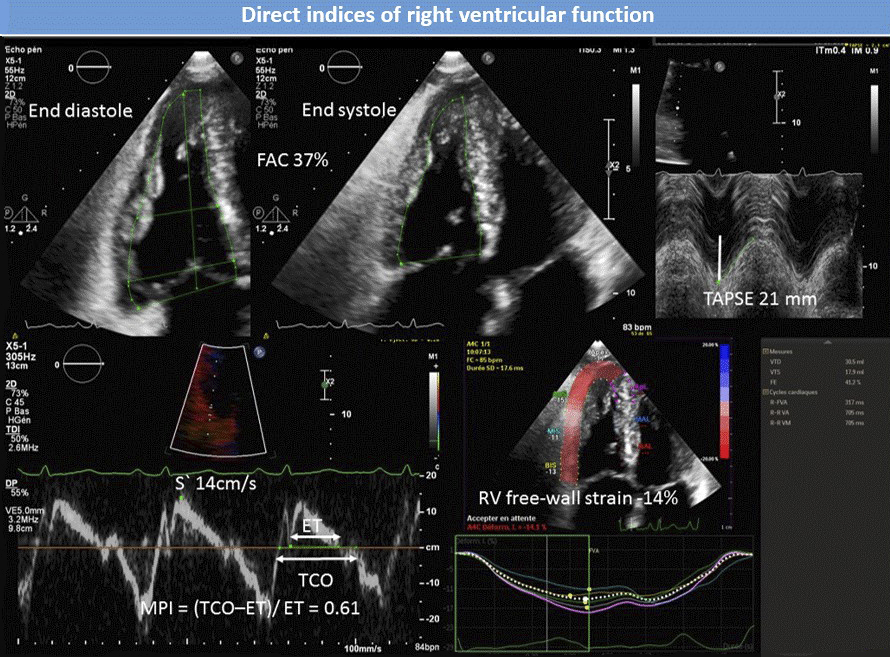
Figure 4 76-year-old male with pulmonary arterial hypertension. Normal TAPSE, S′ velocity and FAC with abnormal MPI and right ventricular free-wall strain. FAC = fractional area change; TAPSE = tricuspid annular plane systolic excursion; S′ = TA tissue Doppler velocity; MPI = Tei index; TCO = tricuspid valve closure to opening time; ET = ejection time.
When measured by echo, RVFAC correlates fairly well with RVEF on CMR (R = 0.71–0.8) [38, 41–43] and consistently predicts outcome in different PAH populations [44–46], including after adjustment for numerous other TTE and haemodynamic variables [46]. In everyday practice, RVFAC is, however, limited by low accuracy and reproducibility in the case of suboptimal endocardial definition and remains inconvenient because of poorly defined prognostic values.
Longitudinal displacement parameters
Owing to predominantly deep longitudinal fibres, long axis shortening plays a significant role in RV emptying [47]. An easy and quick way to assess longitudinal function is to measure TAPSE, which considers RV base displacement towards the apex during systole. TAPSE is assessed by M-mode on an RV-modified apical 4-chamber view focused to align the cursor parallel to lateral TA excursion (table 2, fig. 4) [8]. As already mentioned, TAPSE is variably correlated with RVEF depending on PH severity but also because an angle is sometimes inevitable between the M-mode reference point located outside the heart and TA excursion axis [41, 48]. Moreover, this angle can change during systole because of a “rocking” leftward displacement of the apex. As an LV contribution to RV emptying, this translational motion is independent from RV free wall contraction, but it can still account for an important part of TAPSE [49].
In precapillary PH, TAPSE <18 mm was associated with lower stroke volume, dilated right atrium and reduced survival [32], whereas TAPSE ≤15 mm was associated with a nearly 3-fold rise of mortality or emergent lung transplantation in PAH [45]. However, TAPSE seems to lose predictive power in populations with severe PH and a dilated RV, where a “floor effect” can appear in addition to paradoxical improvement due to afterload decrease on worsening tricuspid regurgitation (TR), like for any other load-dependent variable [46, 50].
Another means to quantify longitudinal function is to measure lateral TA systolic excursion velocity (S′) by pulsed wave tissue Doppler imaging (PW-TDI). As opposed to TAPSE, S′ can still be acquired on images of suboptimal quality. As both indices highly correlate (R >0.9), they basically convey similar information (table 2, fig. 4) [36].
Analysis of time intervals
RV myocardial performance index (MPI), or Tei index, globally reflects RV systolic and diastolic performance. It is defined as the sum of isovolumic contraction and relaxation times divided by ejection time [51], higher values indicating poorer function. RV-MPI can be assessed by conventional PW-Doppler from two different views (ejection time at the pulmonary valve from the short axis view and isovolumic intervals derived from tricuspid flow in in any view), and hence from two heartbeats with possibly different cycle lengths. Alternatively, RVMPI can be acquired by PW-TDI on the lateral TA during a single beat to circumvent this issue (table 2, fig. 4). Correlation between both techniques is surprisingly modest and normal values differ from one method to the other [8]. Although several factors such as pseudo-normalisation with increasing RAP (reduction of isovolumic relaxation time) [52] and dependence on loading conditions [53] significantly limit RV-MPI, this variable was consistently associated with outcome in PAH and mixed PAH/CTEPH populations, including after adjustment for numerous other TTE and haemodynamic variables [46, 51, 54].
Right ventricular deformation imaging (strain)
Strain refers to the magnitude of myocardial deformation occurring in a given segment during systole and is calculated as the percent change of length separating two points during movement [(end-systole − end-diastole) / end-diastole lengths × 100]. Global strain is the average of all segments and negative values represent shortening. Strain is nowadays assessed by speckle tracking imaging, using an algorithm tracking constant pattern of black and white spots, i.e., speckles produced by ultrasound in the acoustically inhomogeneous myocardium within a user-defined region of interest. Speckles are tracked in any direction, making strain an angle-independent variable, with the additional strength of being mainly dependent on local shortening and less influenced by external traction due to displacement of neighbouring segments [55].
At the RV level, global longitudinal strain is assessed on RVF-A4C with 85–95% feasibility [50, 56] and low intra/interobserver variability [57], and can include (RVGLSTotal) or exclude the IVS (RVGLSFreewall). Image acquisition must be optimised in order to obtain a frame rate ≥50–60 Hz, avoid reverberation and visualise the RV apex throughout the complete cardiac cycle [8]. Reference points and regions of interest should be defined with care, the inclusion of atrial wall or pericardium in the region of interest producing falsely low strain (table 2, fig. 4).
Unfortunately, consensus about the best algorithm for strain analysis is lacking, and software show a low inter-vendor agreement [55]. Consequently, longitudinal patient follow-up should be performed with similar equipment and software for comparison. Nevertheless, both RVGLSTotal and RVGLSFreewall correlate better with CMR-derived RVEF than conventional indices (R = −0.77 to −0.86) [43, 58, 59]. A recent meta-analysis proposed −27% ± 2% as normal range for RVGLSFreewall [60] with detection thresholds for abnormal RVEF at −20% [61]. Focardi et al. reported sensitivity and specificity of 96% and 93% for RVGLSFreewall ≥−17% to predict RVEF <45% [43].
In the largest prospective study conducted so far (406 precapillary PH and 169 non-PH subjects), RVGLSFreewall was the only direct RV function index to predict mortality after adjustment for functional class, N-terminal pro-B-type natriuretic peptide (NTproBNP) and 6-minute walking distance [56]. Others found similar results and two recent meta-analyses reported a pooled unadjusted hazard ratio (HR) of 3.67 (95% confidence interval [CI] 2.88–4.77) for mortality using binary RVGLSFreewall cut-off values in precapillary PH (76% PAH) [62], and a HR of 2.96 (95% CI 2.0–4.38) for all-cause mortality with a 22% relative reduction of RVGLSFreewall [63].
Beside global strain, speckle tracking imaging can assess RV dyssynchrony. In PH, electrophysiological remodelling creates zones of slow conduction and prolonged action potential in the RV with delayed peak myocardial shortening resulting in regional contraction inhomogeneity and finally in intraventricular dyssynchrony [64]. With speckle tracking imaging, dyssynchrony is assessed by measuring standard deviations (SDs) of time to peak strain across a chosen number of segments (models with four and six segments including the IVS). In PAH, RV dyssynchrony (RV-SD4 >18–19 ms) is frequent and affects haemodynamics, RVEF, functional class and functional capacity [65, 66]. With a 23-ms cut-off, RV-SD4 predicts 1-year event-free survival with negative and positive predictive values of 95% and 57% (table 2) [67].
Echocardiography to assess right ventricular systolic function: indirect indices
Right atrial size
RA size and pericardial effusion (PEF) are the only two TTE variables recommended for risk stratification in the current European Respiratory Society (ERS) / European Society of Cardiology (ESC) guidelines on PH [1]. Although international guidelines on TTE advocate volume assessment for RA size quantification [8], orthogonal views of the RA cannot be obtained for biplane calculation and minor axes of the RA may not be equal, particularly in the event of RA dilatation. As far as PH is concerned, RA size should be alternatively quantified by single plane assessment of its area (RAA) on A4C (table 2, fig. 2). Indeed, RAA correlates with RV function in PH patients and larger RAA has been associated with lower cardiac index reserve at exercise in PAH patients [29]. Of note, normal RAA values differ between men and women, and rise with high endurance training [68]. In addition, RA may also dilate because of TR and atrial fibrillation, and the reproducibility of RAA measurement is not well defined.
In PAH, RAA has been consistently reported as a strong prognostic factor, also after adjustment for relevant clinical, biological, haemodynamic and usual TTE variables [69–72]. However, it has not been adjusted for modern robust direct RV function variables such as RVGLSFreewall.
Tricuspid regurgitation
In PH, tricuspid regurgitation occurs as a consequence of RV remodelling, with tricuspid annular dilation, valve tenting and normal leaflets. Whereas virtually all newly diagnosed PAH patients display TR, severe regurgitation is rare (<20%) and reflects late-stage RV maladaptation [73] with poor outcome in PAH [46, 73].
Pericardial effusion
Pericardial effusion is common (20–50%) on initial imaging in PAH [26] and its volume correlates with RA pressure and size, RV size and function, and TR severity [74, 75]. Physiologically, it is caused by increased central venous pressure, which impairs both venous and lymphatic drainage of the heart, with swollen lymphatic subepicardial pre-collectors suffusing in the pericardial space [76]. Of note, pericardial effusion is not specific to RV dysfunction and may also reflect serositis in connective tissue disease-associated PAH [36, 74]. the presence and severity of pericardial effusion nevertheless remain correlated with poor outcome in PAH after adjustment for PAH aetiology and right atrial pressure [74, 77].
Left ventricular eccentricity index
As the IVS and the pericardium are shared by both ventricles, events occurring on one side influence the contralateral one, a phenomenon called right-left ventricular interaction [78, 79].
With a flat configuration in the unloaded human heart [80], the IVS displays a concave shape during systole in physiological conditions because of a positive left to right trans-septal pressure gradient. With PH, systolic interventricular gradient decreases, increasing in turn the IVS curvature (flattening) in a linear relationship [81]. During early diastole, interference occurs in PH through persisting RV free wall shortening, while IVS and LV free wall already relax. This results in a transient inverted trans-septal pressure gradient and in a rapid leftward septal motion (“early diastolic bounce”), with possible short reverse septal curvature in severe PH [82–84]. RV and LV pressures may finally equalise at end-diastole if RV dilatation is significant enough to induce pericardial constraint [78, 82]. Importantly, IVS mediated ventricular interactions reduce LV size, impair LV filling and may deeply reduce stroke volume in PAH [83, 85].
IVS flattening can be qualitatively assessed or quantified by measuring LV eccentricity index (EI) in parasternal short axis view (table 2, fig. 2). Systolic EI correlates with PVR and with RV function indices, and both end-systolic and end-diastolic EI predict outcome in PAH in univariate analysis. However, the association of EI with outcome may disappear after adjustment for clinical, haemodynamic and TTE variables such RV dyssynchrony [45, 46, 67, 69].
Overall, standard TTE assessment of the right heart should include several complementary indices of RV remodelling and systolic function, providing a cluster of direct and indirect evidence of RV adaptation or maladaptation to PH. Key variables exploring longitudinal function (TAPSE, S′, RVGLSFreewall, and RV dyssynchrony), global motion (RVFAC, MPI), ventricular interaction, right atrium, pericardium and tricuspid valve should be assessed, highlighting the strengths and limitation of each of them according to the particular clinical situation.
Evaluation of right ventricle-pulmonary arterial coupling
Right ventricle-pulmonary arterial (RV-PA) coupling refers to the concept of RV contractility adaptation to the afterload conditions provided by pulmonary arteries. The only validated way to assess RV-PA coupling is the invasive generation of pressure-volume loops with conductance catheters at different preloads in order to determine RV end-systolic elastance (Ees = slope of the line joining the end-systolic pressure values acquired at different preloads) as a load-free determinant of contractility, and arterial elastance (Ea = end-systolic pressure / stroke volume), as an index aggregating both resistive and pulsatile components of afterload. RV-PA coupling can then be determined as the Ees/Ea ratio, with normal values between 1.5 and 2.0 [86].
In PH, RV volume increases when Ees/Ea is ≤0.8 [87] and RV-PA coupling was shown to be a main determinant of outcome [88]. As pressure-volume curves cannot be constructed with TTE, surrogates have been explored, such TAPSE for Ees and sPAP for Ea. Although the assumptions that both terms hold for contractility and afterload, respectively, are far from perfect, TAPSE/sPAP was shown to correlate independently with Ees/Ea, and values <0.31 mm/mm Hg identified Ees/Ea <0.805 with good sensitivity and specificity [89]. Furthermore, trials showed a strong association between TAPSE/sPAP and outcomes in PH on left heart disease and PAH populations [89–91]. Of importance, TAPSE/sPAP appeared to be a stronger event predictor than RV systolic function variables such as TAPSE, RAA, S′ and MPI taken per se. Also, TAPSE/sPAP showed a clear pattern of distribution across the total PA compliance versus PVR curve, meaning that populations with a high TAPSE/sPAP value have high TAC and low PVR, and conversely. Of course, the above-described limitations of TAPSE taken in isolation remain true when associated with sPAP. Consequently, authors attempted to replace it by RVLSglobal and RVLSFreewaal and found RVLS/sPAP to be superior than TAPSE/sPAP to predict 1-year mortality in PH associated with chronic stable heart failure [92]. Like that of other experts in the field, the authors’ opinion is that TTE-evaluated RV-PA coupling allows a better understanding of RV adaptation to afterload and that TAPSE/sPAP is a “ready to use surrogate of RV to afterload coupling at the bedside” and should be routinely reported by sonographers [93].
Echocardiography for the follow-up of pulmonary hypertension
As PAH and other forms of precapillary PH such as CTEPH are progressive diseases and because response to therapies and interventions are not predictable on an individual basis, periodic risk stratification is of utmost importance in patients’ care [94]. For this purpose, current ESC/ERS guidelines recommend the use of multidimensional variables including TTE parameters (RAA and pericardial effusion) besides other modifiable factors [1]. This approach has been retrospectively validated in the Swedish PAH registry [95], but further analyses of the German and French registries did not consider TTE for risk assessment, mainly because echo variables were not captured in these databases [5, 6]. Nevertheless, PAH and CTEPH outcomes remain closely related to changes in RV size and function on therapy [27, 37], which can be typically assessed by TTE.
Once medical therapy for PAH is established, sPAP does not change significantly enough to be reliably detected by TTE, but RV systolic function variables and size of the right cavities usually improve [37, 44]. As most RV-related TTE indices are afterload dependent, their changes reflect both treatment-induced afterload decrease and systolic function improvement. However, the proportion of RV function variation attributed to PVR change is quite small and RV function may still deteriorate in spite of decreased PVR in some patients, reflecting progressive RV failure and eventually poor outcome [37, 96].
Reverse remodelling of the right cavities (size reduction) on PH therapy affects both RA and RV. Because RA size is related to RV function [29], RA reverse remodelling is thought to reflect decreased RV filling pressure and volume overload, and hence improved RV systolic function. In patients on riociguat for PAH or CTEPH for 12 months, Marra et al. found that 31% of patients could recover normal RA size and Sano et al. showed that mid-term RA reverse remodelling (RAA decrease ≥15%) predicted long-term survival in PAH [30, 97]. At RV level, treatment-induced remodelling can be monitored by following RVEDA and RVESA. In their study, Sano et al. reported larger mid-term RVEDA and RVESA increases in patients with eventual events and excellent outcome in patients with reverse remodelling (RVEDA or RVESA decrease ≥15%) [97]. More recently, Badagliaca et al. showed that a score including RVEDA, LVEI and RAA reduction after 1 year of treatment independently predicted outcome in idiopathic PAH and improved prognostic models based on clinical and haemodynamic factors [96].
Following RVESRI change at 1 year also appeared to reflect RV adaptation vs maladaptation in PAH. Although a minority of patients (24%) had significantly changed RVESRI (>10%) on therapy, those with improvement had a good outcome and those with deterioration a poor prognosis. Of importance, RVESRI change seemed incremental to the REVEAL score for risk prediction [34].
Follow up of TTE indices of RV function on therapy is also of interest in PAH. For example, complete recovery of TAPSE (≥2 cm) at 1 year is an independent predictor of 3-year survival [98], and improvement of RVGLSFreewall by ≥5% after 6 months independently predicts 4-year survival after adjustment for age, PAH cause and functional class [99].
Finally, following up pericardial effusion is also important in PAH because the emergence of a new pericardial effusion was recently found to be predictive of bad prognosis in two single centre studies [100, 101], whereas resolution pericardial effusion conferred a prognosis similar to no pericardial effusion at all and pericardial effusion persistence an even worse one than new pericardial effusion [101].
Echocardiographic screening for populations at high risk for PH
Several populations are at high risk of developing PH, including patients with connective tissue disease (scleroderma and scleroderma spectrum), congenital heart disease, human immunodeficiency virus (HIV), porto-pulmonary hypertension and relatives of patients with heritable PAH . Recommendations for screening modalities were reported at the 6th World Symposium for PH [15] and are endorsed by the Swiss Society for Pulmonary Hypertension. Most of them include TTE and are summarised hereafter.
Most data regarding screening for PAH in connective tissues diseases are based on patients with scleroderma [102], where the prevalence of PAH is ~10–12% (19% in patients with DLCO <60%). Screening is meaningful in scleroderma because PAH is one of the leading causes of death and outcome may improve with early PAH-specific therapy [103]. Multiple algorithms can be proposed: annual TTE [1], conditional TTE (DETECT algorithm [104]), and pulmonary function tests (FVC/DLCO ratio) associated with NTproBNP. If any of the tests is positive, right heart catheterisation should be undertaken.
In congenital heart disease, PH is present by definition in patients with Eisenmenger Syndrome. In other cases, such as persistent open systemic-to-pulmonary shunt or after defect correction, PH screening should be part of the regular follow-up TTE. Postoperative PAH screening is recommended after 3–6 months and then annually in patients with increased PVR at baseline [15].
In HIV, PH screening is recommended only in patients with risk factors such as female sex, intravenous drug or cocaine use, chronic hepatitis C infection, origin from high-prevalence countries, known Nef (negative regulatory factor) or Tat (transactivator of transcription) proteins and in US African-American patients [15].
PH screening with TTE is recommended for all patients with portal hypertension (0.5–5% prevalence) and in all patients before liver transplantation (prevalence ~10%). However, given the high incidence of hyperkinetic PH with liver disease, right heart catheterisation should be performed only if TRV is >3.4 m/s or if RA or RV enlargement is found [15].
Genetic screening in the French registry found PAH-associated mutations in 16.9% patients with sporadic PAH and in 89% of patients with a family history (heritable PAH) [105]. The risk of developing PAH being 14% for male and 42% for female mutation carriers [106], annual TTE and genetic counselling are recommended for all asymptomatic mutation carriers [15].
Finally, patients with hereditary haemorrhagic telangiectasia (HHT) have an increased risk of developing PH (TTE prevalence 4.23%). In most cases, PH is related to high-output heart failure, but PAH is possible and associated with poor survival [107]. TTE screening is recommended in all patients with HHT or family history of HHT with symptoms, heart failure or hepatic arteriovenous malformations [15].
Conclusion
Although right heart catheterisation remains unconditionally mandatory for a definite PH diagnosis, TTE can reliably detect abnormal haemodynamics and sPAP can be estimated with acceptable precision given adequate TRV envelope and experienced sonographers. SPAP, TRV and RAP should be reported separately and commented on if necessary. In addition, TTE can discriminate fairly well between pre- and postcapillary PH in many situations, avoiding unnecessary right heart catheterisation.
Although the main weakness of 2-D TTE remains its inability to explore the complex 3-D RV morphology, the assessment of modern direct and indirect indices of RV remodelling and systolic function enable a comprehensive view of RV adaptation to PH, helping clinicians to estimate the outcome of their patients and their response to therapy. In the future, 3-D echo may circumvent this limitation. Currently, 3-D echo is not widely available and cannot be considered as part of a routine examination of the RV because it needs expensive matrix-array transducers, dedicated software for post-processing and specific learning to avoid pitfalls such sternal shadowing or incomplete RV volume acquisition. In experienced hands, however, it demonstrates good agreement with CMR, which is the gold standard regarding RV and RA volumes as well as RVEF in PH patients [108]. Asthe advantages of 3-D echo will probably appear more and more evident with time, the authors guess that it will soon be part of the complex pathways of PH diagnosis and follow-up.
References
1
Galiè
N
Humbert
M
Vachiery
JL
Gibbs
S
Lang
I
Torbicki
A
ESC Scientific Document Group
. 2015 ESC/ERS Guidelines for the diagnosis and treatment of pulmonary hypertension: The Joint Task Force for the Diagnosis and Treatment of Pulmonary Hypertension of the European Society of Cardiology (ESC) and the European Respiratory Society (ERS): Endorsed by: Association for European Paediatric and Congenital Cardiology (AEPC), International Society for Heart and Lung Transplantation (ISHLT). Eur Heart J. 2016;37(1):67–119. doi:.https://doi.org/10.1093/eurheartj/ehv317
2
Fisher
MR
Forfia
PR
Chamera
E
Housten-Harris
T
Champion
HC
Girgis
RE
Accuracy of Doppler echocardiography in the hemodynamic assessment of pulmonary hypertension. Am J Respir Crit Care Med. 2009;179(7):615–21. doi:.https://doi.org/10.1164/rccm.200811-1691OC
3
Rich
JD
Shah
SJ
Swamy
RS
Kamp
A
Rich
S
. Inaccuracy of Doppler echocardiographic estimates of pulmonary artery pressures in patients with pulmonary hypertension: implications for clinical practice. Chest. 2011;139(5):988–93. doi:.https://doi.org/10.1378/chest.10-1269
4
D’Alto
M
Romeo
E
Argiento
P
D’Andrea
A
Vanderpool
R
Correra
A
Accuracy and precision of echocardiography versus right heart catheterization for the assessment of pulmonary hypertension. Int J Cardiol. 2013;168(4):4058–62. doi:.https://doi.org/10.1016/j.ijcard.2013.07.005
5
Boucly
A
Weatherald
J
Savale
L
Jaïs
X
Cottin
V
Prevot
G
Risk assessment, prognosis and guideline implementation in pulmonary arterial hypertension. Eur Respir J. 2017;50(2):1700889. doi:.https://doi.org/10.1183/13993003.00889-2017
6
Hoeper
MM
Kramer
T
Pan
Z
Eichstaedt
CA
Spiesshoefer
J
Benjamin
N
Mortality in pulmonary arterial hypertension: prediction by the 2015 European pulmonary hypertension guidelines risk stratification model. Eur Respir J. 2017;50(2):1700740. doi:.https://doi.org/10.1183/13993003.00740-2017
7
Greiner
S
Jud
A
Aurich
M
Hess
A
Hilbel
T
Hardt
S
Reliability of noninvasive assessment of systolic pulmonary artery pressure by Doppler echocardiography compared to right heart catheterization: analysis in a large patient population. J Am Heart Assoc. 2014;3(4):e001103. doi:.https://doi.org/10.1161/JAHA.114.001103
8
Lang
RM
Badano
LP
Mor-Avi
V
Afilalo
J
Armstrong
A
Ernande
L
Recommendations for cardiac chamber quantification by echocardiography in adults: an update from the American Society of Echocardiography and the European Association of Cardiovascular Imaging. Eur Heart J Cardiovasc Imaging. 2015;16(3):233–71. doi:.https://doi.org/10.1093/ehjci/jev014
9
Schneider
M
Pistritto
AM
Gerges
C
Gerges
M
Binder
C
Lang
I
Multi-view approach for the diagnosis of pulmonary hypertension using transthoracic echocardiography. Int J Cardiovasc Imaging. 2018;34(5):695–700.
10
D’Alto
M
Bossone
E
Opotowsky
AR
Ghio
S
Rudski
LG
Naeije
R
. Strengths and weaknesses of echocardiography for the diagnosis of pulmonary hypertension. Int J Cardiol. 2018;263:177–83. doi:.https://doi.org/10.1016/j.ijcard.2018.04.024
11
Simonneau
G
Montani
D
Celermajer
DS
Denton
CP
Gatzoulis
MA
Krowka
M
Haemodynamic definitions and updated clinical classification of pulmonary hypertension. Eur Respir J. 2019;53(1):1801913. doi:.https://doi.org/10.1183/13993003.01913-2018
12
Marra
AM
Naeije
R
Ferrara
F
Vriz
O
Stanziola
AA
D’Alto
M
Reference Ranges and Determinants of Tricuspid Regurgitation Velocity in Healthy Adults Assessed by Two-Dimensional Doppler-Echocardiography. Respiration. 2018;96(5):425–33. doi:.https://doi.org/10.1159/000490191
13
Kovacs
G
Berghold
A
Scheidl
S
Olschewski
H
. Pulmonary arterial pressure during rest and exercise in healthy subjects: a systematic review. Eur Respir J. 2009;34(4):888–94. doi:.https://doi.org/10.1183/09031936.00145608
14
Amsallem
M
Sternbach
JM
Adigopula
S
Kobayashi
Y
Vu
TA
Zamanian
R
Addressing the Controversy of Estimating Pulmonary Arterial Pressure by Echocardiography. J Am Soc Echocardiogr. 2016;29(2):93–102. doi:.https://doi.org/10.1016/j.echo.2015.11.001
15
Frost
A
Badesch
D
Gibbs
JSR
Gopalan
D
Khanna
D
Manes
A
Diagnosis of pulmonary hypertension. Eur Respir J. 2019;53(1):1801904. doi:.https://doi.org/10.1183/13993003.01904-2018
16
Maeder
MT
Schoch
OD
Kleiner
R
Joerg
L
Weilenmann
D
Swiss Society For Pulmonary Hypertension
. Pulmonary hypertension associated with left-sided heart disease. Swiss Med Wkly. 2017;147:w14395.
17
Opotowsky
AR
Ojeda
J
Rogers
F
Prasanna
V
Clair
M
Moko
L
A simple echocardiographic prediction rule for hemodynamics in pulmonary hypertension. Circ Cardiovasc Imaging. 2012;5(6):765–75. doi:.https://doi.org/10.1161/CIRCIMAGING.112.976654
18
D’Alto
M
Romeo
E
Argiento
P
Pavelescu
A
Mélot
C
D’Andrea
A
Echocardiographic prediction of pre- versus postcapillary pulmonary hypertension. J Am Soc Echocardiogr. 2015;28(1):108–15. doi:.https://doi.org/10.1016/j.echo.2014.09.004
19
Berthelot
E
Montani
D
Algalarrondo
V
Dreyfuss
C
Rifai
R
Benmalek
A
A Clinical and Echocardiographic Score to Identify Pulmonary Hypertension Due to HFpEF. J Card Fail. 2017;23(1):29–35. doi:.https://doi.org/10.1016/j.cardfail.2016.10.002
20
Naeije
R
Gerges
M
Vachiery
JL
Caravita
S
Gerges
C
Lang
IM
. Hemodynamic Phenotyping of Pulmonary Hypertension in Left Heart Failure. Circ Heart Fail. 2017;10(9):10. doi:.https://doi.org/10.1161/CIRCHEARTFAILURE.117.004082
21
Rosenkranz
S
Gibbs
JS
Wachter
R
De Marco
T
Vonk-Noordegraaf
A
Vachiéry
JL
. Left ventricular heart failure and pulmonary hypertension. Eur Heart J. 2016;37(12):942–54. doi:.https://doi.org/10.1093/eurheartj/ehv512
22
Nauta
JF
Hummel
YM
van der Meer
P
Lam
CSP
Voors
AA
van Melle
JP
. Correlation with invasive left ventricular filling pressures and prognostic relevance of the echocardiographic diastolic parameters used in the 2016 ESC heart failure guidelines and in the 2016 ASE/EACVI recommendations: a systematic review in patients with heart failure with preserved ejection fraction. Eur J Heart Fail. 2018;20(9):1303–11. doi:.https://doi.org/10.1002/ejhf.1220
23
Vonk Noordegraaf
A
Westerhof
BE
Westerhof
N
. The Relationship Between the Right Ventricle and its Load in Pulmonary Hypertension. J Am Coll Cardiol. 2017;69(2):236–43. doi:.https://doi.org/10.1016/j.jacc.2016.10.047
24
Vonk-Noordegraaf
A
Haddad
F
Chin
KM
Forfia
PR
Kawut
SM
Lumens
J
Right heart adaptation to pulmonary arterial hypertension: physiology and pathobiology. J Am Coll Cardiol. 2013;62(25, Suppl):D22–33. doi:.https://doi.org/10.1016/j.jacc.2013.10.027
25
Vonk Noordegraaf
A
Chin
KM
Haddad
F
Hassoun
PM
Hemnes
AR
Hopkins
SR
Pathophysiology of the right ventricle and of the pulmonary circulation in pulmonary hypertension: an update. Eur Respir J. 2019;53(1):1801900. doi:.https://doi.org/10.1183/13993003.01900-2018
26
Bossone
E
Duong-Wagner
TH
Paciocco
G
Oral
H
Ricciardi
M
Bach
DS
Echocardiographic features of primary pulmonary hypertension. J Am Soc Echocardiogr. 1999;12(8):655–62. doi:.https://doi.org/10.1053/je.1999.v12.a99069
27
van Wolferen
SA
Marcus
JT
Boonstra
A
Marques
KM
Bronzwaer
JG
Spreeuwenberg
MD
Prognostic value of right ventricular mass, volume, and function in idiopathic pulmonary arterial hypertension. Eur Heart J. 2007;28(10):1250–7. doi:.https://doi.org/10.1093/eurheartj/ehl477
28
Grünig
E
Biskupek
J
D’Andrea
A
Ehlken
N
Egenlauf
B
Weidenhammer
J
Reference ranges for and determinants of right ventricular area in healthy adults by two-dimensional echocardiography. Respiration. 2015;89(4):284–93. doi:.https://doi.org/10.1159/000371472
29
Fischer
L
Benjamin
N
Blank
N
Egenlauf
B
Fischer
C
Harutyunova
S
Right heart size and function significantly correlate in patients with pulmonary arterial hypertension - a cross-sectional study. Respir Res. 2018;19(1):216. doi:.https://doi.org/10.1186/s12931-018-0913-x
30
Marra
AM
Halank
M
Benjamin
N
Bossone
E
Cittadini
A
Eichstaedt
CA
Right ventricular size and function under riociguat in pulmonary arterial hypertension and chronic thromboembolic pulmonary hypertension (the RIVER study). Respir Res. 2018;19(1):258. doi:.https://doi.org/10.1186/s12931-018-0957-y
31
Ghio
S
Recusani
F
Klersy
C
Sebastiani
R
Laudisa
ML
Campana
C
Prognostic usefulness of the tricuspid annular plane systolic excursion in patients with congestive heart failure secondary to idiopathic or ischemic dilated cardiomyopathy. Am J Cardiol. 2000;85(7):837–42. doi:.https://doi.org/10.1016/S0002-9149(99)00877-2
32
Forfia
PR
Fisher
MR
Mathai
SC
Housten-Harris
T
Hemnes
AR
Borlaug
BA
Tricuspid annular displacement predicts survival in pulmonary hypertension. Am J Respir Crit Care Med. 2006;174(9):1034–41. doi:.https://doi.org/10.1164/rccm.200604-547OC
33
Goda
A
Ryo
K
Delgado-Montero
A
Tayal
B
Handa
R
Simon
MA
The Prognostic Utility of a Simplified Biventricular Echocardiographic Index of Cardiac Remodeling in Patients with Pulmonary Hypertension. J Am Soc Echocardiogr. 2016;29(6):554–60. doi:.https://doi.org/10.1016/j.echo.2016.02.013
34
Amsallem
M
Sweatt
AJ
Aymami
MC
Kuznetsova
T
Selej
M
Lu
H
Right Heart End-Systolic Remodeling Index Strongly Predicts Outcomes in Pulmonary Arterial Hypertension: Comparison With Validated Models. Circ Cardiovasc Imaging. 2017;10(6):e005771. doi:.https://doi.org/10.1161/CIRCIMAGING.116.005771
35
Benza
RL
Miller
DP
Gomberg-Maitland
M
Frantz
RP
Foreman
AJ
Coffey
CS
Predicting survival in pulmonary arterial hypertension: insights from the Registry to Evaluate Early and Long-Term Pulmonary Arterial Hypertension Disease Management (REVEAL). Circulation. 2010;122(2):164–72. doi:.https://doi.org/10.1161/CIRCULATIONAHA.109.898122
36
Forfia
PR
Vachiéry
JL
. Echocardiography in pulmonary arterial hypertension. Am J Cardiol. 2012;110(6, Suppl):S16–S24. doi:.https://doi.org/10.1016/j.amjcard.2012.06.012
37
van de Veerdonk
MC
Kind
T
Marcus
JT
Mauritz
GJ
Heymans
MW
Bogaard
HJ
Progressive right ventricular dysfunction in patients with pulmonary arterial hypertension responding to therapy. J Am Coll Cardiol. 2011;58(24):2511–9. doi:.https://doi.org/10.1016/j.jacc.2011.06.068
38
Hoette
S
Creuzé
N
Günther
S
Montani
D
Savale
L
Jaïs
X
RV Fractional Area Change and TAPSE as Predictors of Severe Right Ventricular Dysfunction in Pulmonary Hypertension: A CMR Study. Lung. 2018;196(2):157–64. doi:.https://doi.org/10.1007/s00408-018-0089-7
39
Kind
T
Mauritz
GJ
Marcus
JT
van de Veerdonk
M
Westerhof
N
Vonk-Noordegraaf
A
. Right ventricular ejection fraction is better reflected by transverse rather than longitudinal wall motion in pulmonary hypertension. J Cardiovasc Magn Reson. 2010;12(1):35. doi:.https://doi.org/10.1186/1532-429X-12-35
40
Mauritz
GJ
Kind
T
Marcus
JT
Bogaard
HJ
van de Veerdonk
M
Postmus
PE
Progressive changes in right ventricular geometric shortening and long-term survival in pulmonary arterial hypertension. Chest. 2012;141(4):935–43. doi:.https://doi.org/10.1378/chest.10-3277
41
Anavekar
NS
Gerson
D
Skali
H
Kwong
RY
Yucel
EK
Solomon
SD
. Two-dimensional assessment of right ventricular function: an echocardiographic-MRI correlative study. Echocardiography. 2007;24(5):452–6. doi:.https://doi.org/10.1111/j.1540-8175.2007.00424.x
42
Leong
DP
Grover
S
Molaee
P
Chakrabarty
A
Shirazi
M
Cheng
YH
Nonvolumetric echocardiographic indices of right ventricular systolic function: validation with cardiovascular magnetic resonance and relationship with functional capacity. Echocardiography. 2012;29(4):455–63. doi:.https://doi.org/10.1111/j.1540-8175.2011.01594.x
43
Focardi
M
Cameli
M
Carbone
SF
Massoni
A
De Vito
R
Lisi
M
Traditional and innovative echocardiographic parameters for the analysis of right ventricular performance in comparison with cardiac magnetic resonance. Eur Heart J Cardiovasc Imaging. 2015;16(1):47–52. doi:.https://doi.org/10.1093/ehjci/jeu156
44
Galiè
N
Hinderliter
AL
Torbicki
A
Fourme
T
Simonneau
G
Pulido
T
Effects of the oral endothelin-receptor antagonist bosentan on echocardiographic and doppler measures in patients with pulmonary arterial hypertension. J Am Coll Cardiol. 2003;41(8):1380–6. doi:.https://doi.org/10.1016/S0735-1097(03)00121-9
45
Ghio
S
Klersy
C
Magrini
G
D’Armini
AM
Scelsi
L
Raineri
C
Prognostic relevance of the echocardiographic assessment of right ventricular function in patients with idiopathic pulmonary arterial hypertension. Int J Cardiol. 2010;140(3):272–8. doi:.https://doi.org/10.1016/j.ijcard.2008.11.051
46
Grapsa
J
Pereira Nunes
MC
Tan
TC
Cabrita
IZ
Coulter
T
Smith
BC
Echocardiographic and Hemodynamic Predictors of Survival in Precapillary Pulmonary Hypertension: Seven-Year Follow-Up. Circ Cardiovasc Imaging. 2015;8(6):e002107. doi:.https://doi.org/10.1161/CIRCIMAGING.114.002107
47
Brown
SB
Raina
A
Katz
D
Szerlip
M
Wiegers
SE
Forfia
PR
. Longitudinal shortening accounts for the majority of right ventricular contraction and improves after pulmonary vasodilator therapy in normal subjects and patients with pulmonary arterial hypertension. Chest. 2011;140(1):27–33. doi:.https://doi.org/10.1378/chest.10-1136
48
Kaul
S
Tei
C
Hopkins
JM
Shah
PM
. Assessment of right ventricular function using two-dimensional echocardiography. Am Heart J. 1984;107(3):526–31. doi:.https://doi.org/10.1016/0002-8703(84)90095-4
49
Giusca
S
Dambrauskaite
V
Scheurwegs
C
D’hooge
J
Claus
P
Herbots
L
Deformation imaging describes right ventricular function better than longitudinal displacement of the tricuspid ring. Heart. 2010;96(4):281–8. doi:.https://doi.org/10.1136/hrt.2009.171728
50
van Kessel
M
Seaton
D
Chan
J
Yamada
A
Kermeen
F
Hamilton-Craig
C
Prognostic value of right ventricular free wall strain in pulmonary hypertension patients with pseudo-normalized tricuspid annular plane systolic excursion values. Int J Cardiovasc Imaging. 2016;32(6):905–12. doi:.https://doi.org/10.1007/s10554-016-0862-8
51
Tei
C
Dujardin
KS
Hodge
DO
Bailey
KR
McGoon
MD
Tajik
AJ
Doppler echocardiographic index for assessment of global right ventricular function. J Am Soc Echocardiogr. 1996;9(6):838–47. doi:.https://doi.org/10.1016/S0894-7317(96)90476-9
52
Yoshifuku
S
Otsuji
Y
Takasaki
K
Yuge
K
Kisanuki
A
Toyonaga
K
Pseudonormalized Doppler total ejection isovolume (Tei) index in patients with right ventricular acute myocardial infarction. Am J Cardiol. 2003;91(5):527–31. doi:.https://doi.org/10.1016/S0002-9149(02)03299-X
53
Cheung
MM
Smallhorn
JF
Redington
AN
Vogel
M
. The effects of changes in loading conditions and modulation of inotropic state on the myocardial performance index: comparison with conductance catheter measurements. Eur Heart J. 2004;25(24):2238–42. doi:.https://doi.org/10.1016/j.ehj.2004.07.034
54
Yeo
TC
Dujardin
KS
Tei
C
Mahoney
DW
McGoon
MD
Seward
JB
. Value of a Doppler-derived index combining systolic and diastolic time intervals in predicting outcome in primary pulmonary hypertension. Am J Cardiol. 1998;81(9):1157–61. doi:.https://doi.org/10.1016/S0002-9149(98)00140-4
55
Voigt
JU
Cvijic
M
. 2- and 3-Dimensional Myocardial Strain in Cardiac Health and Disease. JACC Cardiovasc Imaging. 2019;12(9):1849–63. doi:.https://doi.org/10.1016/j.jcmg.2019.01.044
56
Fine
NM
Chen
L
Bastiansen
PM
Frantz
RP
Pellikka
PA
Oh
JK
Outcome prediction by quantitative right ventricular function assessment in 575 subjects evaluated for pulmonary hypertension. Circ Cardiovasc Imaging. 2013;6(5):711–21. doi:.https://doi.org/10.1161/CIRCIMAGING.113.000640
57
Park
JH
Park
MM
Farha
S
Sharp
J
Lundgrin
E
Comhair
S
Impaired Global Right Ventricular Longitudinal Strain Predicts Long-Term Adverse Outcomes in Patients with Pulmonary Arterial Hypertension. J Cardiovasc Ultrasound. 2015;23(2):91–9. doi:.https://doi.org/10.4250/jcu.2015.23.2.91
58
Vizzardi
E
Bonadei
I
Sciatti
E
Pezzali
N
Farina
D
D’Aloia
A
Quantitative analysis of right ventricular (RV) function with echocardiography in chronic heart failure with no or mild RV dysfunction: comparison with cardiac magnetic resonance imaging. J Ultrasound Med. 2015;34(2):247–55. doi:.https://doi.org/10.7863/ultra.34.2.247
59
Park
JH
Negishi
K
Kwon
DH
Popovic
ZB
Grimm
RA
Marwick
TH
. Validation of global longitudinal strain and strain rate as reliable markers of right ventricular dysfunction: comparison with cardiac magnetic resonance and outcome. J Cardiovasc Ultrasound. 2014;22(3):113–20. doi:.https://doi.org/10.4250/jcu.2014.22.3.113
60
Fine
NM
Chen
L
Bastiansen
PM
Frantz
RP
Pellikka
PA
Oh
JK
Reference values for right ventricular strain in patients without cardiopulmonary disease: a prospective evaluation and meta-analysis. Echocardiography. 2015;32(5):787–96. doi:.https://doi.org/10.1111/echo.12806
61
Longobardo
L
Suma
V
Jain
R
Carerj
S
Zito
C
Zwicke
DL
Role of Two-Dimensional Speckle-Tracking Echocardiography Strain in the Assessment of Right Ventricular Systolic Function and Comparison with Conventional Parameters. J Am Soc Echocardiogr. 2017;30(10):937–946.e6. doi:.https://doi.org/10.1016/j.echo.2017.06.016
62
Shukla
M
Park
JH
Thomas
JD
Delgado
V
Bax
JJ
Kane
GC
Prognostic Value of Right Ventricular Strain Using Speckle-Tracking Echocardiography in Pulmonary Hypertension: A Systematic Review and Meta-analysis. Can J Cardiol. 2018;34(8):1069–78. doi:.https://doi.org/10.1016/j.cjca.2018.04.016
63
Hulshof
HG
Eijsvogels
TMH
Kleinnibbelink
G
van Dijk
AP
George
KP
Oxborough
DL
Prognostic value of right ventricular longitudinal strain in patients with pulmonary hypertension: a systematic review and meta-analysis. Eur Heart J Cardiovasc Imaging. 2019;20(4):475–84. doi:.https://doi.org/10.1093/ehjci/jey120
64
Hardziyenka
M
Campian
ME
Bouma
BJ
Linnenbank
AC
de Bruin-Bon
HA
Kloek
JJ
Right-to-left ventricular diastolic delay in chronic thromboembolic pulmonary hypertension is associated with activation delay and action potential prolongation in right ventricle. Circ Arrhythm Electrophysiol. 2009;2(5):555–61. doi:.https://doi.org/10.1161/CIRCEP.109.856021
65
Badagliacca
R
Poscia
R
Pezzuto
B
Nocioni
M
Mezzapesa
M
Francone
M
Right ventricular remodeling in idiopathic pulmonary arterial hypertension: adaptive versus maladaptive morphology. J Heart Lung Transplant. 2015;34(3):395–403. doi:.https://doi.org/10.1016/j.healun.2014.11.002
66
Badagliacca
R
Papa
S
Valli
G
Pezzuto
B
Poscia
R
Reali
M
Right ventricular dyssynchrony and exercise capacity in idiopathic pulmonary arterial hypertension. Eur Respir J. 2017;49(6):1601419. doi:.https://doi.org/10.1183/13993003.01419-2016
67
Badagliacca
R
Reali
M
Poscia
R
Pezzuto
B
Papa
S
Mezzapesa
M
Right Intraventricular Dyssynchrony in Idiopathic, Heritable, and Anorexigen-Induced Pulmonary Arterial Hypertension: Clinical Impact and Reversibility. JACC Cardiovasc Imaging. 2015;8(6):642–52. doi:.https://doi.org/10.1016/j.jcmg.2015.02.009
68
Grünig
E
Henn
P
D’Andrea
A
Claussen
M
Ehlken
N
Maier
F
Reference values for and determinants of right atrial area in healthy adults by 2-dimensional echocardiography. Circ Cardiovasc Imaging. 2013;6(1):117–24. doi:.https://doi.org/10.1161/CIRCIMAGING.112.978031
69
Raymond
RJ
Hinderliter
AL
Willis
PW
IV
Ralph
D
Caldwell
EJ
Williams
W
Echocardiographic predictors of adverse outcomes in primary pulmonary hypertension. J Am Coll Cardiol. 2002;39(7):1214–9. doi:.https://doi.org/10.1016/S0735-1097(02)01744-8
70
Bustamante-Labarta
M
Perrone
S
De La Fuente
RL
Stutzbach
P
De La Hoz
RP
Torino
A
Right atrial size and tricuspid regurgitation severity predict mortality or transplantation in primary pulmonary hypertension. J Am Soc Echocardiogr. 2002;15(10):1160–4. doi:.https://doi.org/10.1067/mje.2002.123962
71
Austin
C
Alassas
K
Burger
C
Safford
R
Pagan
R
Duello
K
Echocardiographic assessment of estimated right atrial pressure and size predicts mortality in pulmonary arterial hypertension. Chest. 2015;147(1):198–208. doi:.https://doi.org/10.1378/chest.13-3035
72
Stepnowska
E
Lewicka
E
Dąbrowska-Kugacka
A
Daniłowicz-Szymanowicz
L
Zagożdżon
P
Kamiński
R
Predictors of poor outcome in patients with pulmonary arterial hypertension: A single center study. PLoS One. 2018;13(4):e0193245. doi:.https://doi.org/10.1371/journal.pone.0193245
73
Chen
L
Larsen
CM
Le
RJ
Connolly
HM
Pislaru
SV
Murphy
JG
The prognostic significance of tricuspid valve regurgitation in pulmonary arterial hypertension. Clin Respir J. 2018;12(4):1572–80. doi:.https://doi.org/10.1111/crj.12713
74
Fenstad
ER
Le
RJ
Sinak
LJ
Maradit-Kremers
H
Ammash
NM
Ayalew
AM
Pericardial effusions in pulmonary arterial hypertension: characteristics, prognosis, and role of drainage. Chest. 2013;144(5):1530–8. doi:.https://doi.org/10.1378/chest.12-3033
75
Batal
O
Dardari
Z
Costabile
C
Gorcsan
J
Arena
VC
Mathier
MA
. Prognostic Value of Pericardial Effusion on Serial Echocardiograms in Pulmonary Arterial Hypertension. Echocardiography. 2015;32(10):1471–6. doi:.https://doi.org/10.1111/echo.12909
76
Stewart
RH
Rohn
DA
Allen
SJ
Laine
GA
. Basic determinants of epicardial transudation. Am J Physiol. 1997;273(3 Pt 2):H1408–14.
77
Eysmann
SB
Palevsky
HI
Reichek
N
Hackney
K
Douglas
PS
. Two-dimensional and Doppler-echocardiographic and cardiac catheterization correlates of survival in primary pulmonary hypertension. Circulation. 1989;80(2):353–60. doi:.https://doi.org/10.1161/01.CIR.80.2.353
78
Naeije
R
Badagliacca
R
. The overloaded right heart and ventricular interdependence. Cardiovasc Res. 2017;113(12):1474–85. doi:.https://doi.org/10.1093/cvr/cvx160
79
Friedberg
MK
. Imaging right-left ventricular interactions. JACC Cardiovasc Imaging. 2018;11(5):755–71. doi:.https://doi.org/10.1016/j.jcmg.2018.01.028
80
Lima
JA
Guzman
PA
Yin
FC
Brawley
RK
Humphrey
L
Traill
TA
Septal geometry in the unloaded living human heart. Circulation. 1986;74(3):463–8. doi:.https://doi.org/10.1161/01.CIR.74.3.463
81
Dellegrottaglie
S
Sanz
J
Poon
M
Viles-Gonzalez
JF
Sulica
R
Goyenechea
M
Pulmonary hypertension: accuracy of detection with left ventricular septal-to-free wall curvature ratio measured at cardiac MR. Radiology. 2007;243(1):63–9. doi:.https://doi.org/10.1148/radiol.2431060067
82
Roeleveld
RJ
Marcus
JT
Faes
TJ
Gan
TJ
Boonstra
A
Postmus
PE
Interventricular septal configuration at mr imaging and pulmonary arterial pressure in pulmonary hypertension. Radiology. 2005;234(3):710–7. doi:.https://doi.org/10.1148/radiol.2343040151
83
Marcus
JT
Gan
CT
Zwanenburg
JJ
Boonstra
A
Allaart
CP
Götte
MJ
Interventricular mechanical asynchrony in pulmonary arterial hypertension: left-to-right delay in peak shortening is related to right ventricular overload and left ventricular underfilling. J Am Coll Cardiol. 2008;51(7):750–7. doi:.https://doi.org/10.1016/j.jacc.2007.10.041
84
Palau-Caballero
G
Walmsley
J
Van Empel
V
Lumens
J
Delhaas
T
. Why septal motion is a marker of right ventricular failure in pulmonary arterial hypertension: mechanistic analysis using a computer model. Am J Physiol Heart Circ Physiol. 2017;312(4):H691–700. doi:.https://doi.org/10.1152/ajpheart.00596.2016
85
Gan
CT
Lankhaar
JW
Marcus
JT
Westerhof
N
Marques
KM
Bronzwaer
JG
Impaired left ventricular filling due to right-to-left ventricular interaction in patients with pulmonary arterial hypertension. Am J Physiol Heart Circ Physiol. 2006;290(4):H1528–33. doi:.https://doi.org/10.1152/ajpheart.01031.2005
86
Tello
K
Seeger
W
Naeije
R
Vanderpool
R
Ghofrani
H
Richter
M
Right heart failure in pulmonary hypertension: Diagnosis and new perspectives on vascular and direct right ventricular treatment. Br J Pharmacol. 2021;178(1):90–107. doi:.https://doi.org/10.1111/bph.14866
87
Tello
K
Dalmer
A
Axmann
J
Vanderpool
R
Ghofrani
HA
Naeije
R
Reserve of right ventricular-arterial coupling in the setting of chronic overload. Circ Heart Fail. 2019;12(1):e005512. doi:.https://doi.org/10.1161/CIRCHEARTFAILURE.118.005512
88
Vanderpool
RR
Pinsky
MR
Naeije
R
Deible
C
Kosaraju
V
Bunner
C
RV-pulmonary arterial coupling predicts outcome in patients referred for pulmonary hypertension. Heart. 2015;101(1):37–43. doi:.https://doi.org/10.1136/heartjnl-2014-306142
89
Tello
K
Wan
J
Dalmer
A
Vanderpool
R
Ghofrani
HA
Naeije
R
Validation of the Tricuspid Annular Plane Systolic Excursion/Systolic Pulmonary Artery Pressure Ratio for the Assessment of Right Ventricular-Arterial Coupling in Severe Pulmonary Hypertension. Circ Cardiovasc Imaging. 2019;12(9):e009047. doi:.https://doi.org/10.1161/CIRCIMAGING.119.009047
90
Guazzi
M
Naeije
R
Arena
R
Corrà
U
Ghio
S
Forfia
P
Echocardiography of right ventriculoarterial coupling combined with cardiopulmonary exercise testing to predict outcome in heart failure. Chest. 2015;148(1):226–34. doi:.https://doi.org/10.1378/chest.14-2065
91
Tello
K
Axmann
J
Ghofrani
HA
Naeije
R
Narcin
N
Rieth
A
Relevance of the TAPSE/PASP ratio in pulmonary arterial hypertension. Int J Cardiol. 2018;266:229–35. doi:.https://doi.org/10.1016/j.ijcard.2018.01.053
92
Iacoviello
M
Monitillo
F
Citarelli
G
Leone
M
Grande
D
Antoncecchi
V
Right ventriculo-arterial coupling assessed by two-dimensional strain: A new parameter of right ventricular function independently associated with prognosis in chronic heart failure patients. Int J Cardiol. 2017;241:318–21. doi:.https://doi.org/10.1016/j.ijcard.2017.04.051
93
Guazzi
M
. Use of TAPSE/PASP ratio in pulmonary arterial hypertension: An easy shortcut in a congested road. Int J Cardiol. 2018;266:242–4. doi:.https://doi.org/10.1016/j.ijcard.2018.04.053
94
Galiè
N
Channick
RN
Frantz
RP
Grünig
E
Jing
ZC
Moiseeva
O
Risk stratification and medical therapy of pulmonary arterial hypertension. Eur Respir J. 2019;53(1):1801889. doi:.https://doi.org/10.1183/13993003.01889-2018
95
Kylhammar
D
Kjellström
B
Hjalmarsson
C
Jansson
K
Nisell
M
Söderberg
S
A comprehensive risk stratification at early follow-up determines prognosis in pulmonary arterial hypertension. Eur Heart J. 2018;39(47):4175–81. doi:.https://doi.org/10.1093/eurheartj/ehx257
96
Badagliacca
R
Poscia
R
Pezzuto
B
Papa
S
Reali
M
Pesce
F
Prognostic relevance of right heart reverse remodeling in idiopathic pulmonary arterial hypertension. J Heart Lung Transplant. 2018;37(2):195–205. doi:.https://doi.org/10.1016/j.healun.2017.09.026
97
Sano
H
Tanaka
H
Motoji
Y
Fukuda
Y
Sawa
T
Mochizuki
Y
Right ventricular function and right-heart echocardiographic response to therapy predict long-term outcome in patients with pulmonary hypertension. Can J Cardiol. 2015;31(4):529–36. doi:.https://doi.org/10.1016/j.cjca.2015.01.027
98
Mazurek
JA
Vaidya
A
Mathai
SC
Roberts
JD
Forfia
PR
. Follow-up tricuspid annular plane systolic excursion predicts survival in pulmonary arterial hypertension. Pulm Circ. 2017;7(2):361–71. doi:.https://doi.org/10.1177/2045893217694175
99
Hardegree
EL
Sachdev
A
Villarraga
HR
Frantz
RP
McGoon
MD
Kushwaha
SS
Role of serial quantitative assessment of right ventricular function by strain in pulmonary arterial hypertension. Am J Cardiol. 2013;111(1):143–8. doi:.https://doi.org/10.1016/j.amjcard.2012.08.061
100
Shimony
A
Fox
BD
Langleben
D
Rudski
LG
. Incidence and significance of pericardial effusion in patients with pulmonary arterial hypertension. Can J Cardiol. 2013;29(6):678–82. doi:.https://doi.org/10.1016/j.cjca.2012.04.009
101
Batal
O
Dardari
Z
Costabile
C
Gorcsan
J
Arena
VC
Mathier
MA
. Prognostic Value of Pericardial Effusion on Serial Echocardiograms in Pulmonary Arterial Hypertension. Echocardiography. 2015;32(10):1471–6. doi:.https://doi.org/10.1111/echo.12909
102
Young
A
Nagaraja
V
Basilious
M
Habib
M
Townsend
W
Gladue
H
Update of screening and diagnostic modalities for connective tissue disease-associated pulmonary arterial hypertension. Semin Arthritis Rheum. 2019;48(6):1059–67. doi:.https://doi.org/10.1016/j.semarthrit.2018.10.010
103
Humbert
M
Yaici
A
de Groote
P
Montani
D
Sitbon
O
Launay
D
Screening for pulmonary arterial hypertension in patients with systemic sclerosis: clinical characteristics at diagnosis and long-term survival. Arthritis Rheum. 2011;63(11):3522–30. doi:.https://doi.org/10.1002/art.30541
104
Coghlan
JG
Denton
CP
Grünig
E
Bonderman
D
Distler
O
Khanna
D
DETECT study group
. Evidence-based detection of pulmonary arterial hypertension in systemic sclerosis: the DETECT study. Ann Rheum Dis. 2014;73(7):1340–9. doi:.https://doi.org/10.1136/annrheumdis-2013-203301
105
Girerd
B
Montani
D
Jaïs
X
Eyries
M
Yaici
A
Sztrymf
B
Genetic counselling in a national referral centre for pulmonary hypertension. Eur Respir J. 2016;47(2):541–52. doi:.https://doi.org/10.1183/13993003.00717-2015
106
Larkin
EK
Newman
JH
Austin
ED
Hemnes
AR
Wheeler
L
Robbins
IM
Longitudinal analysis casts doubt on the presence of genetic anticipation in heritable pulmonary arterial hypertension. Am J Respir Crit Care Med. 2012;186(9):892–6. doi:.https://doi.org/10.1164/rccm.201205-0886OC
107
Revuz
S
Decullier
E
Ginon
I
Lamblin
N
Hatron
PY
Kaminsky
P
Pulmonary hypertension subtypes associated with hereditary haemorrhagic telangiectasia: Haemodynamic profiles and survival probability. PLoS One. 2017;12(10):e0184227. doi:.https://doi.org/10.1371/journal.pone.0184227
108
Grapsa
J
Gibbs
JS
Dawson
D
Watson
G
Patni
R
Athanasiou
T
Morphologic and functional remodeling of the right ventricle in pulmonary hypertension by real time three dimensional echocardiography. Am J Cardiol. 2012;109(6):906–13. doi:.https://doi.org/10.1016/j.amjcard.2011.10.054