Efficacy of non-invasive intelligent volume assured pressure support (iVAPS) and pressure support ventilation (PSV) in clinical practice
DOI: https://doi.org/10.4414/smw.2021.20506
Christian M.
Horvathab, Anne-Kathrin
Brilla, Florent
Batyb, Martin H.
Brutscheb
a Department of Pulmonary Medicine, Inselspital, University Hospital and University of Bern, Switzerland
b Lung Centre, Kantonsspital St Gallen, Switzerland
Summary
AIMS OF THE STUDY
Noninvasive ventilation (NIV) is a well-established treatment option for hypercapnic respiratory failure; however, the best mode of ventilation remains unknown. The aim of this retrospective study was to compare patients’ adherence to NIV using either pressure support ventilation (PSV) or intelligent volume-assured pressure support (iVAPS).
PATIENTS AND METHODS
In this retrospective cohort study, we assessed in- and outpatients suffering from hypercapnic respiratory failure of various aetiologies (chronic obstructive pulmonary disease [COPD], obese COPD [body mass index >30 kg/m2], obesity hypoventilation syndrome and other diseases such as amyotrophic lateral sclerosis or interstitial lung disease) after NIV initiation with PSV or iVAPS. Adherence to treatment was compared between these modes using the Wilcoxon test. Within-group differences were tested using linear regression models. Mortality and emergency hospital readmission rates were modelled using Kaplan-Meier estimates and Cox proportional hazards models.
RESULTS
Adherence to treatment was similar in both groups throughout the observation period – after 6 weeks: PSV 363 min/night (interquartile range [IQR] 200–448), iVAPS 369 min/night (IQR 310–468) (p = 0.619); after 1 year: PSV 423 (323–500), iVAPS 429 (298–475) (p = 0.901); at the last follow up: PSV 481 (395–586), iVAPS 426 (391–565) (p = 0.284). NIV reduced PaCO2 significantly compared with baseline at all follow-ups: PSV −1.29/−1.49/−1.49 kPa, iVAPS −1.47/−1.23/−1.24 kPa, p <0.001 each, PSV vs iVAPS: p = 0.250, 0.756 and 0.352, respectively. Median survival time (PSV 5.06 years, iVAPS median not reached; p = 0.800) and time to first readmission (PSV 3.6 years, iVAPS 7.33 years, p = 0.200) did not differ between groups. Obese COPD patients had a longer time to hospital readmission than lean COPD patients (3.8 vs 1.5 years, hazard ratio (HR) 0.39, 95% confidence interval [CI] 0.16–0. 74; p = 0.007). Good adherence (>4 h/night and >80% nightly usage) was associated with a lower mortality rate (HR 0.34, 95% CI 0.15–0.77; p = 0.010).
CONCLUSION
In a real-world setting of a mixed population with hypercapnic respiratory failure, iVAPS and PSV seem to be similarly effective in improving gas exchange and demonstrate excellent adherence to treatment. A longer survival was noted in NIV-adherent patients. Randomised controlled studies are necessary to identify patients who might benefit more from hybrid ventilation modes.
Introduction
Noninvasive ventilation (NIV) is a well-established treatment for acute and chronic respiratory failure caused by various underlying pathophysiologies [1–4]. Volume- or pressure-pre-set ventilation modes (PSV) are commonly used, but technical developments in ventilators have provided new hybrid modes that combine both features of ventilation and focus on a target volume (e.g., average volume assured pressure support [AVAPS], Philips, Murrysville, USA; intelligent volume assured pressure support [iVAPS], ResMed, Bella Vista, Australia) [5]. These hybrid modes are based on algorithms that enable the ventilator to adapt the pressure support and, to a lesser degree, also back-up rates to the patient’s requirements [6]. In theory, these modes should thereby be able to maintain normal ventilation even if respiratory conditions change (e.g., positional changes during sleep, rapid eye movement sleep).
Studies comparing volume-assured modes of NIV with PSV revealed that volume-assured modes can be at least as effective as conventional PSV in reducing CO2 in different diseases [7–12]. Recent NIV studies showed similar frequencies of sleep disturbances with ventilators using volume-assured modes or PSV [11, 13–18]. Adherence to iVAPS over 1 month was better in one prospective study [18].
To the best of our knowledge only one recent study reported long-term treatment data (>3 months) for hybrid modes [19], but this did not focus on comparison between PSV and iVAPS. Several long-term studies in patients using different NIV modes showed a reduction in PaCO2 and good compliance (>4 h/night) [18–24]. Longer usage during the night-time (>4 h/night) was associated with a greater reduction of PaCO2 [25]. A relevant reduction of PaCO2 was associated with a survival benefit in non-obese and obese patients with chronic obstructive pulmonary disease (COPD) [22, 26].
The aim of this study was to compare adherence to NIV of patients suffering from hypercapnic respiratory failure of different aetiologies using either pressure support ventilation (PSV) or intelligent volume-assured pressure support (iVAPS) in a real-world setting.
Material and methods
Study setting and participants
In a retrospective single centre study, we searched the institutional database (Kantonsspital St. Gallen, Department of Pulmonary and Sleep Medicine, Switzerland) for patients who were started on mechanical home ventilation for the first time or were restarted after a period without NIV between 1 January 1 2012 and 30 October 2015. Follow-up ended on 31 August 2019. The inclusion criteria were age >18 years, ventilation with PSV or iVAPS, at least one inpatient or outpatient follow-up visit in the ventilator clinic and the usage of a Stellar™ 100 or Stellar™ 150 ventilator (ResMed, Bella Vista, Australia), a VPAP ST™ (ResMed, Bella Vista, Australia), or a S9VPAP ST™ (ResMed, Bella Vista, Australia). Only Stellar™ 150 and S9VPAP ST™ provided the iVAPS mode at that time. Patients were included regardless of sex, underlying disease, or whether NIV was started in acute or chronic respiratory failure. Patients who discontinued the treatment were included in the analysis until the point when no further data were available. Exclusion criterion was a refusal of a general informed consent allowing anonymised collection of the patient’s data.
Included patients were categorised into those using PSV or iVAPS mode and subclassified into disease-specific groups as follows: (1) lean COPD with body mass index (BMI) <30 kg/m2 (forced expiratory volume in 1 second / forced vital capacity [FEV1/FVC] <0.7, current or ex-smoker) and daytime hypercapnia (PaCO2 >6 kPa) and/or ≥2 COPD exacerbations/year, (2) obese COPD with BMI >30 kg/m2 (FEV1/FVC <0.7, current or ex-smoker) and daytime hypercapnia, (3) obesity hypoventilation syndrome (OHS) (BMI >30 kg/m2 and daytime hypercapnia) either with or without obstructive sleep apnoea (OSA) with an apnoea-hypopnoea index (AHI) ≥5/h, or (4) other disease (amyotrophic lateral sclerosis, interstitial lung disease, diaphragm paralysis) [27].
Outcomes
The primary outcome was adherence to NIV, which was a composite of average usage per night in hours and % of nights with usage between follow-up visits. The follow-up appointments were ordered by the treating physician with the first usually being within 6 weeks (±3 weeks) after starting NIV and thereafter at least annually (52 ± 12 weeks).
Good adherence was arbitrarily defined as usage on >80% of nights and >4 h/night. Secondary outcomes were ventilation parameters measured by the ventilator, emergency hospital admissions due to cardiac and pulmonary illness, all-cause mortality and reduction of PaCO2.
Data collection
We collected demographics, anthropometric data, pulmonary function test results, arterial blood gas results, the number of hospitalisations due to cardiac and pulmonary illnesses, death (institutional system with reporting to the hospital if patients on NIV die who are not treated anymore in our institution) and continued use of NIV from the medical records up to 31 August 2019. Data on the ventilator usage and detailed ventilation parameters (usage in days, mean usage in min/night, expiratory positive airway pressure (EPAP), inspiratory positive airway pressure (IPAP), tidal volume, AHI and unintentional leak [calculated by the software as total leak minus intentional leak from the utilised mask CO2 washout]) were collected from the routine downloads (ResScan™ software, ResMed, Bella Vista, Australia).
Ventilator and ventilator settings
NIV was initiated according to clinical routine by a dedicated NIV team [28]. Detailed information on settings and set-up of NIV can be found in the appendix.
Statistics
This is an exploratory analysis. Data were reported descriptively as percentage or median and interquartile range (IQR). Between-group differences for proportions were tested using the Wilcoxon test or using two-sided chi-square tests or Fisher’s exact tests. For within-group differences, a two-sided paired t-test was used. Time to event data (time to emergency hospital readmission, death) were analysed using Kaplan-Meier estimates and Cox proportional hazards models in order to adjust for confounding effects and other variables. Patients who were lost to follow-up were included until the last follow-up. PSV was considered as reference for the survival analysis. The significance level was set to 0.05 for all analyses. All analyses were done using the R statistical software, version 3.5 [29].
Ethics
This study was approved by the local ethics committee (EKOS 2017-00278). Written informed patient consent was waived because of the retrospective nature of the study.
Results
Patients
We included 98 patients. Fifty-four patients were started on home NIV for hypercapnic respiratory failure in PSV mode, 44 on iVAPS. Baseline data are shown in table 1. There were no statistically significant differences between the two treatment groups in the parameters. Patient flow is depicted in figure 1.
Table 1 Patients’ baseline characteristics.
|
Patient group according to mode of ventilation
|
PSV
|
iVAPS
|
| Female/male (n) |
16/38 |
21/23 |
| Age |
64 (58–69) (n = 54) |
69 (61–73) (n = 44) |
| BMI (kg/m2) |
31.4 (25.3–39.1) (n = 51) |
37.0 (26.1–43.0) (n = 36) |
| Lean COPD (BMI <30 kg/m2) (n) |
14 |
8 |
| Obese COPD (BMI >30 kg/m2) (n) |
18 |
16 |
| OHS/OSA (n) |
11 |
11 |
| Other (n) |
11 |
9 |
| FEV1 (l) |
1.09 (0.60–1.62) (n = 39) |
1.33 (0.96–1.64) (n = 33) |
| FEV1 (%) |
39 (24–59) (n = 37) |
53 (39–61) (n = 31) |
| FVC (l) |
2.18 (1.56–2.73) (n = 39) |
2.09 (1.71–2.58) (n = 33) |
| FVC (%) |
58 (46–74) (n = 37) |
66 (54–74) (n = 32) |
| pH |
7.41 (7.37–7.43) (n = 50) |
7.40 (7.34–7.43) (n = 42) |
| PaO2 (kPa) |
8.1 (6.5–9.3) (n = 50) |
7.5 (6.7–8.9) (n = 43) |
| PaCO2 (kPa) |
7.0 (6.3–7.8) (n = 50) |
6.6 (5.8–8.0) (n = 43) |
| HCO3
− (mmol/l) |
30.6 (28.2–33.5) (n = 50) |
29.5 (27.9–32.0) (n = 38) |
| Oxygen supplementation (l/min) |
1 (0–2) (n = 48) |
1 (0–2) (n = 42) |
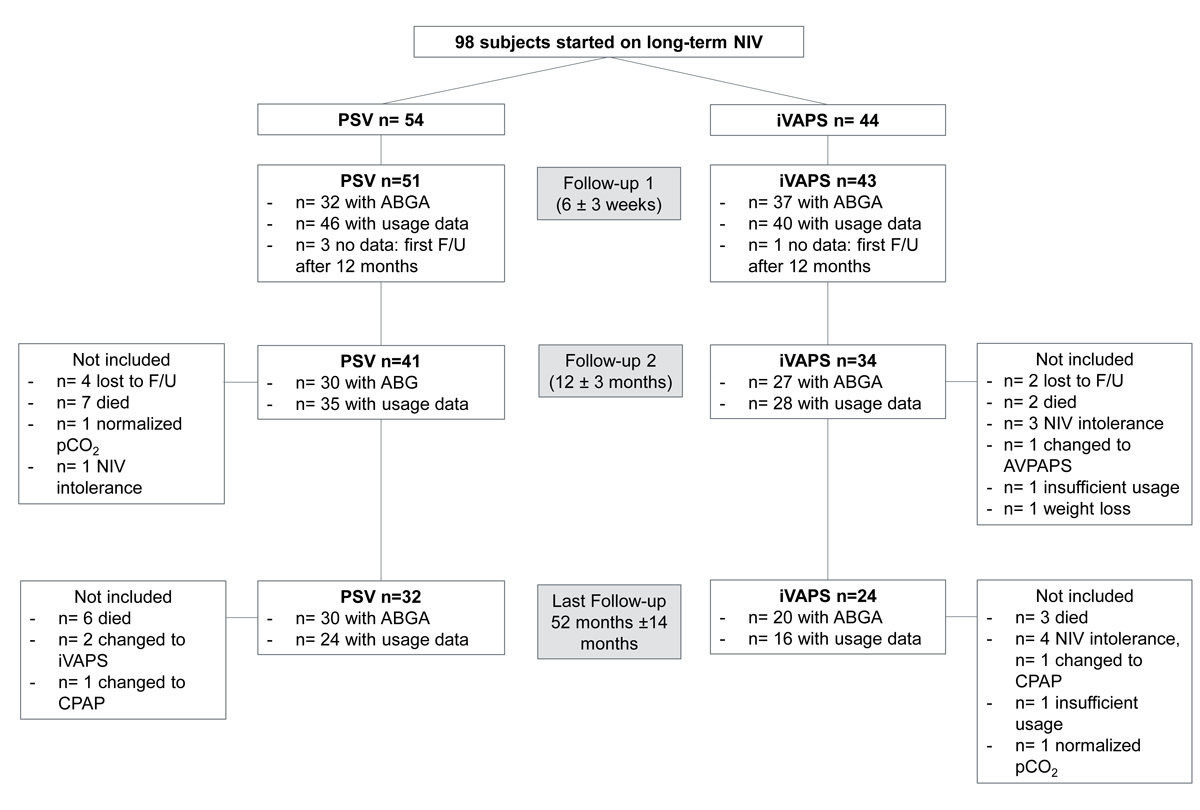
Figure 1 Patient flow chart. ABGA = arterial blood gas analysis; AVAPS = average volume assured pressure support; CPAP = continuous positive airway pressure; F/U = follow-up; iVAPS = intelligent volume assured pressure support; NIV = noninvasive ventilation; PSV = pressure support ventilation;
Adherence to NIV
At the first follow-up (median 42 days, IQR 32–59), ventilator data were available for 86 patients (PSV n = 46, iVAPS n = 40). After 1 year (358 days, 306–417) 63 data sets were available (PSV n = 35, iVAPS n = 28) and 46 (PSV n = 30, iVAPS n = 16) were available for the last follow-up (1584 days, 1182–1933). The composite endpoint did not differ significantly between both modes at any follow-up visit. The overall usage per night and the number of nights with usage were good and did not significantly differ between the modes at any follow-up visit (table 2).
Table 2 Ventilator data, blood gas values and lung function at follow-up 1, after 1 year and at the last follow-up.
|
Follow-up 1
42 days (32–59)
|
1 year
(0.84–1.14 yrs)
|
Last follow-up
4.3 yrs (3.2–5.3)
|
|
Mode of ventilation
|
PSV
|
iVAPS
|
PSV
|
iVAPS
|
PSV
|
iVAPS
|
| Usage per night (min) |
363 (200–448)
(n = 46) |
369 (310–468)
(n = 40) |
423 (323–500)
(n = 35) |
429 (298–475)
(n = 28) |
481 (395–586)
(n = 30) |
426 (391–565)
(n = 16) |
| Nights used (%) |
98 (85–100)
(n = 46) |
97 (88–100)
(n = 40) |
90 (77–99)
(n = 34) |
96 (40–99)
(n = 28) |
99 (92–100)
(n = 29) |
98 (82–99)
(n = 16) |
| Good usage (%) |
70
(n = 46) |
75
(n = 40) |
65
(n = 34) |
61
(n = 28) |
90
(n = 29) |
75
(n = 16) |
| Apnoea/hypopnoea index/h |
2.7 (0.9–5.3)
(n = 43) |
3.0 (1.6–5.9)
(n = 37) |
3.4 (1.0–5.7.)
(n = 35) |
3.3 (1.5–8.6)
(n = 27) |
3 (2–5)
(n = 30) |
3 (1–5)
(n = 16) |
| IPAP (hPa) |
18 (16–21)
(n = 51) |
20 (17–22)
(n = 33) |
19 (17–21)
(n = 40) |
20 (16–22)
(n = 25) |
19 (16–22)
(n = 24) |
20 (16 –21)
(n = 16) |
| EPAP (hPa) |
8 (6–12)
(n = 51) |
9 (6–10)
(n = 42) |
9 (6–11)
(n = 40) |
9 (7–11)
(n = 34) |
8 (7–11)
(n = 24) |
9 (7–12)
(n = 17) |
| Leakage (l/min) |
0 (0–0)
(n = 38) |
0 (0–8)
(n = 34) |
0 (0–1)
(n = 30) |
0 (0–6)
(n = 28) |
0 (0–3)
(n = 23)
*
|
7 (2–16)
(n = 15) |
| Tidal volume (ml) |
500 (480–650)
(n = 45) |
540 (480–650)
(n = 38) |
440 (380–540)
(n = 35) |
555 (458–625)
(n = 28)
*
|
490 (425–610)
(n = 24) |
560 (475–635)
(n = 16) |
| Minute ventilation (l) |
8.5 (6.9–10.6)
(n = 45) |
9.4 (7.9–10.9)
(n = 38) |
8.1 (6.5–10.7)
(n = 34) |
10.3 (7.9–11.1)
(n = 28) |
9.8 (7.9–11.8)
(n = 24) |
9.3 (8.2–11.4)
(n = 16) |
| BMI (kg/m2) |
31.4 (23.3–39.0)
(n = 38) |
38.6 (29.4–42.3)
(n = 29) |
34.2 (30.0–42.0)
(n = 34) |
38.5 (29.7–45.4)
(n = 24) |
32.5 (27.8–38.7)
(n = 26) |
39.0 (28.8–47.0)
(n = 17) |
| FEV1 (l) |
1.11 (0.64–1.42)
(n = 20) |
1.12 (0.84–1.47)
(n = 22) |
1.27 (0.98–1.55)
(n = 26) |
1.33 (1.02–1.54)
(n = 25) |
1.15 (0.81–1.61)
(n = 23) |
1.37 (1.15–1.74)
(n = 17) |
| FEV1 (%) |
44 (29–61)
(n = 18) |
56 (39–71)
(n = 20) |
45 (33–58)
(n = 26) |
53 (40–70)
(n = 25) |
40 (36–60)
(n = 23) |
59 (42–75)
(n = 17) |
| FVC (l) |
2.23 (1.48–2.87)
(n = 20) |
1.93 (1.56–2.62)
(n = 22) |
2.60 (2.03–2.88)
(n = 26) |
2.27 (1.63–2.78)
(n = 25) |
2.56 (1.73–2.98)
(n = 23) |
2.59 (1.96–2.90)
(n = 17) |
| FVC (%) |
69 (60–79)
(n = 18) |
74 (60–80)
(n = 20) |
75 (60–83)
(n = 26) |
70 (63–93)
(n = 24) |
72 (60–85)
(n = 23) |
88 (73–102)
(n = 17) |
| pH |
7.41 (7.40–7.43)
(n = 33) |
7.42 (7.39–7.44)
(n = 34) |
7.41 (7.40–7.44)
(n = 29) |
7.42 (7.40–7.43)
(n = 25) |
7.42 (7.40–7.44)
(n = 23) |
7.42 (7.39–7.43)
(n = 20) |
| PaO2 (kPa) |
8.10 (7.00–9.35)
(n = 32) |
8.55 (7.33–9.10)
(n = 37) |
8.04 (6.93–9.54)
(n = 30) |
7.67 (7.01–9.43)
(n = 27) |
8.89 (7.46–10.00)
(n = 24) |
8.48 (7.71–9.42)
(n = 20) |
| PaCO2 (kPa) |
5.82 (5.14–6.38)
(n = 33) |
5.53 (5.12–5.98)
(n = 37) |
5.50 (4.84–6.39)
(n = 30) |
5.33 (5.03–5.871)
(n = 27) |
5.30 (4.95–5.91)
(n = 24) |
5.51 (5.15–6.20)
(n = 20) |
| ΔCO2 (kPa) |
–1.29†
|
–1.47†
|
–1.49
†
|
–1.23†
|
–1.46†
|
–1.24†
|
| HCO3
-(mmol/l) |
27.0 (25.0–30.1)
(n = 33) |
26.1 (25–29.3)
(n = 36) |
26.5 (24.4–29.2)
(n = 28) |
25.8 (24.1–27.5)
(n = 27) |
26.6 (24.4–28.4)
(n = 23) |
26.4 (24.9–27.4)
(n = 20) |
| Oxygen (l/min) |
0 (0–1.5)
(n = 39) |
0 (0–2)
(n = 35) |
0 (0–2)
(n = 32) |
0 (0–0)
(n = 28) |
0 (0–0)
(n = 23) |
0 (0–0)
(n = 20) |
In the disease-specific subgroups, there were no differences for the composite endpoint (table S1 in the appendix). A higher usage per night was noted in the group of patients with other diseases using PSV as compared with iVAPS (96%, 90–100%, n = 4 vs 69%, 9–86%, n = 6; p = 0.042) after 1 year and in the obese COPD group at the last follow-up (PSV 99% 95–100%, n = 12 vs iVAPS 96%, 82–98%, n = 8; p = 0.049) (table S1). At the last follow-up, the subgroup analysis was limited to other disease, obese COPD and OHS/OSA because of small sample sizes (table S1).
Twenty-seven patients (15 female, 12 male) stopped the treatment mode initially chosen: seven in the PSV group (change to iVAPS n = 3 or continuous positive airway pressure [CPAP] n = 1, after bariatric surgery n = 1, did not tolerate PSV n = 1, PaCO2 normalisation n = 1) after a median of 790 days (IQR 200–950) and 20 patients in the iVAPS group (change to PSV n = 2, average volume assured pressure support [AVAPS] n = 1 or CPAP n = 1, insufficient usage n = 2, intolerance n = 7, extensive weight loss n = 4, palliative setting n = 1, improvement of the lung disease n = 1, unclear n = 1) after 466 (240–1166) days. At baseline there were no differences between these subjects and those who continued the allocated treatment throughout the study, regarding age (68 years, 58–74 vs 65 years, 60–71; p = 0.882), BMI (36.8 kg/m2, 25.8–41.2 vs 32.3 kg/m2, 24.3–40.1, p = 0.445), FEV1 (1.04 l, 0.64–1.64 vs 1.30 l, 0.69–1.63; p = 0.787), FVC (2.09 l, 1.58–2.46 vs 2.10 l, 1.67–2.73; p = 0.952), PaO2 (7.1 kPa, 6.4–9.6 vs 7.9 kPa, 6.8–9.0; p = 0.510), PaCO2 (7.0 kPa, 6.1–7.7 vs 6.7 kPa, 6.1–8.0; p = 0.921) or oxygen supplementation (2 l, 0.0–2.0 vs 0, 0–2; p = 0.174).
Four patients restarted NIV. Six patients were lost to follow-up, two in the iVAPS and four in the PSV group.
Data from the ventilator
The AHI measured by the built-in ventilator software was below 5 events/h in both groups and no statistically significant differences were found throughout the follow-up period.
After 1 year, tidal volume was lower with PSV (430 ml, 380–540, n = 28 vs iVAPS 555 ml, 458–625, n = 28; p = 0.008). Unintentional air leak was low overall and even lower with PSV at the last follow-up (0 l/min, 0–3, n = 23 vs 7 l/min, 2–16, n = 15; p = 0.006). For further details see table 2.
In the subgroup analysis, IPAP was lower in the OHS/OSA patients treated with PSV (19 hPa, 17–20, n = 10 vs iVAPS 23 hPa, 20–28, n = 8; p = 0.044) at the first follow-up. The AHI was lower in obese COPD patients using PSV (3, 0–5, n = 16 vs iVAPS 8, 2–9, n = 9; p = 0.029) after one year. Tidal volume was lower in the obese COPD group and OHS/OSA patients using PSV after 1 year (PSV 505 ml, 400–605, n = 16 vs iVAPS 595 ml, 570–670, n = 10; p = 0.037, and 395 ml, 310–495, n = 8 vs 515 ml, 458–685, n = 9, respectively; p = 0.040). Unintentional air leak was lower in the obese COPD group using PSV at the last follow-up (PSV 0 l/min, 0–6, n = 8 vs iVAPS 11 l/min, 4–45, n = 8; p = 0.035). The other parameters were similar for both modes in the disease-specific subgroups. Further details are shown in table S1.
Blood gas analyses
Blood gas analyses revealed a marked reduction in PaCO2 by more than 1 kPa accompanied by an improvement of HCO3
− at all checks, irrespective of ventilation mode (table 2, p >0.05 between groups; p-values between groups for PaCO2 in chronological order: 0.251, 0.592, 0.352; for HCO3
− 0.512, 0.419, 0.903) or subgroup (table S1).
Hospitalisations and mortality
During the observation period 40 patients died, 14 who were initially allocated to iVAPS and 26 initially allocated to PSV. There were no differences in survival between groups (HR 0.91, 95% confidence interval [CI] 0.47–1.76; p = 0.80) (fig. 2A). Median survival time in the PSV group was 5.06 years, a median survival time for the iVAPS mode could not be calculated since <50% died. Median time to hospital readmission was 3.6 years in the PSV group and 7.3 years in the iVAPS group (HR 0.63, 95% CI 0.33–1.21; p = 0.164) (fig. 2B). Median time to any event (emergency hospital readmission or death) was 3.4 years in the PSV group. The median could not be calculated in the iVAPS group (HR 0.58, 95% CI 0.31–1.1; p = 0.092) (fig. 2C), since not enough events had occurred at the end of follow-up.

Figure 2 Kaplan-Meier curves for survival (A), emergency hospital readmission (B) and time to any event (death, readmission) (C) according to ventilator mode. iVAPS = intelligent volume assured pressure support; PSV = pressure support ventilation
If subjects were not adherent to NIV (PSV or iVAPS), the median time to death was 2.68 years. A median was not reached in the adherent group (HR 0.34, 0.15–0.77; p = 0.010) (fig. 3A). Median time to emergency hospital readmission was 4.8 years in the adherent group and 4.7 years in the non-adherent group (HR 0.54, 0.24–1.22; p = 0.200) (fig. 3B). For any event there was a risk reduction in the adherent group (HR 0.44, 0.21–0.92; p = 0.040) (fig. 3C).
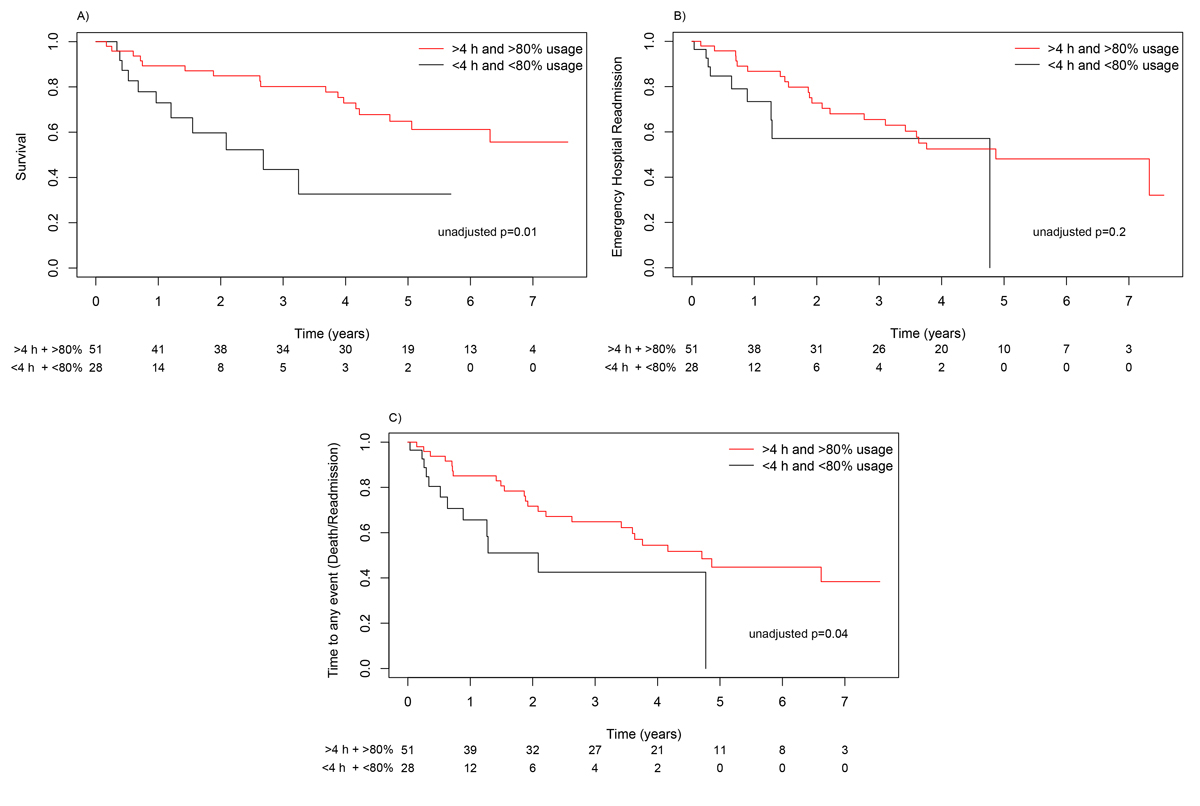
Figure 3 Kaplan-Meier curves for survival (A), emergency hospital readmission (B) and time to any event (death, readmission) (C) according to usage of the ventilator.
A subgroup analysis of obese and lean COPD patients revealed no impact of BMI on the median time to death (obese COPD 6.1 years vs lean COPD 3.9 years; HR 0.45, 0.20–1.15; p = 0.100). Median time to emergency hospital readmission was significantly longer in obese COPD patients (3.8 years) than in lean COPD patients (1.5 years) HR 0.39, (0.16–0.74; p = 0.007). A risk reduction was also seen in median time to any event in obese compared with lean COPD patients (3.8 years vs 1.5 years, HR 0.38, 0.18–0.77; p = 0.010).
Discussion
To the best of our knowledge, this is the largest study comparing patients using an iVAPS mode to a PSV mode with an observational period longer than 3 months. In this retrospective analysis, NIV was effective in improving alveolar ventilation within the first 6 weeks, which was maintained throughout the study period. The adherence to NIV with the iVAPS mode was similar to PSV mode and good in both groups. Furthermore, there were no differences in mortality or time to the first emergency hospital readmission after the initiation of NIV.
The overall usage of NIV on a nightly basis was similar irrespective of the ventilation mode. The length of NIV per night (6–8 hours) was comparable to other NIV studies with and without hybrid modes, including the largest available study done in long–term NIV [9, 11, 15, 19, 30, 31]. The similar length of nightly usage with both ventilation modes differs from the result of a short-term study in a mixed population with chronic respiratory failure, which reported a longer duration of NIV usage per night with iVAPS than with PSV [18]. In contrast, a recent Swiss study found similar usage irrespective of ventilation mode, comparable to our findings [19]. We speculate that the earlier findings might be related to the study design, a longer observation period and thus potentially better habituation to NIV, or differences in the cohorts [18].
Sleep quality has been addressed by several studies, all without suggestion of a decreased sleep quality with iVAPS [9, 14, 17, 18]. We did not perform sleep studies, but the regular and long nightly usage of the ventilator in our data supports the notion that sleep quality might have been acceptable with both ventilation modes.
The improvement of arterial blood gases is in line with recent studies [15, 19, 32]. Compared with other study populations, we noticed an even more profound reduction of PaCO2, especially in the OSA/OHS subgroup [2, 10, 31]. These differences could be related to a lower BMI in our population, a longer observation period, newer ventilators, different ventilator settings and a smaller sample size [2, 10, 31].
The mortality rate of about 15% after 1 year (median time to death 5.06 years) with the PSV mode is comparable to earlier studies of home mechanical ventilation [2, 33]. A good adherence (>4 h/night and >80% nightly usage) resulted in a lower mortality rate, which has been described in obese COPD patients [26]. Obese COPD patients had a longer time to emergency hospital readmission than lean COPD patients. The hospital readmission rate after 1 year of approximately 15% in our study was higher than in an earlier Swiss study [2]. This might be explained by differences in the study populations, with a smaller proportion of OHS/OSA patients in our cohort, as OHS/OSA patients seem to have low rates of hospital admissions when using NIV or CPAP [32].
The strengths of this study are the length of the observation period, the usage of the ventilators from the same manufacturer, which limits algorithm bias, the marked reduction of PaCO2 similar to published data from randomised controlled trials, and the mixed cohort of patients, probably resembling the patient populations of many NIV centres.
This study has certain limitations that have to be considered and that mainly come with the retrospective study design. Complete datasets were not available for all patients, which may have biased our findings. Furthermore, this was a single-centre study and the higher number of subjects who stopped treatment because of intolerance in the iVAPS group could have led to a selection bias. The small number of patients in the subgroups somewhat limits the interpretation of the subgroup data.
Conclusion
In a real-world setting of a mixed population with hypercapnic respiratory failure, iVAPS and PSV seem to be similarly effective in improving gas exchange and demonstrate excellent adherence to treatment. Longer survival was noted in patients with good adherence to NIV. Randomised controlled studies are necessary to identify patients who might benefit more from hybrid ventilation modes.
Appendix Supplementary data
Ventilator and ventilator settings
NIV was initiated within clinical routine by a dedicated NIV team (described in detail in [1]). The choice of the ventilation mode was up to the treating physician’s discretion. We usually treated the patient with NIV during the day for a short period to acclimatise them to the interface (orofacial or nasal mask) and the ventilator. Heating and humidifying devices were used according to patient’s preferences.
During the night, patients were observed using real-time continuous PtCO2 measurements (SenTec AG, Therwil, Switzerland) and a Tx Link box (ResMed, Bella Vista, Australia) in order to receive real-time-volume curves from the ventilator. The NIV team titrated the settings during the night in the PSV group to achieve optimal oxygenation (saturation of oxygen [SpO2] >92%), ventilation [PtCO2 <6.7 kPa] and suppression of hypopnoea and apnoea [oxygen desaturation index <15/h] and to encourage maximum patient cooperation [usage of the ventilator >4 h per night].
We always used the spontaneous/timed mode (ST) with backup rates set at 10–15/min, IPAP and EPAP were set individually to achieve optimal ventilation. Cycling and triggering sensitivity were usually modulated to medium. In the iVAPS group pressure support was initially set from 5–20 hPa, target alveolar ventilation was set according to the manufacturer’s guidelines [2], and the backup rate was set to 10–18/min; EPAP was set in the same manner as in the PSV group.
The treating physicians adapted ventilator settings according to symptoms, ventilator data, and blood gas analysis during the follow-up period.
References
1. Horvath CM, Brutsche MH, Schoch OD, Schillig B, Baty F, vonOw D, et al. NIV by an interdisciplinary respiratory care team in severe respiratory failure in the emergency department limited to day time hours. Intern Emerg Med. 2017;12: 1215–23. doi:https://doi.org/10.1007/s11739-016-1546-z.
2. ResMed. Sleep Lab Titration Guide. http://www.resmed.com/au/dam/documents/products/titration/s9-vpap-tx/user-guide/1013904r3_s9-vpap-tx-sleep-lab-titration_user-guide_glo_eng.pdf [accessed 2016 September 10].
Table S1 Subgroup ventilator data and blood gas values at follow-up 1, after 1 year and at the last follow-up.
|
Follow-up date
|
Follow-up 1 42 days (32–59)
|
|
Disease
|
COPD
|
Obese COPD
|
OSA/OHS
|
Other
|
|
Mode of ventilation
|
PSV
|
iVAPS
|
PSV
|
iVAPS
|
PSV
|
iVAPS
|
PSV
|
iVAPS
|
| Minutes/night |
337 (76–395)
(n = 13) |
338 (95–428)
(n = 8) |
348 (270–439)
(n = 15) |
381 (325–444)
(n = 15) |
425 (383–460)
(n = 9) |
443 (331–478)
(n = 9) |
408 (162–449)
(n = 9) |
346 (237–550)
(n = 8) |
| Percentage of nights used |
92 (38–100)
(n = 14) |
94 (26–97)
(n = 8) |
99 (89–100)
(n = 15) |
100 (92–100)
(n = 15) |
100 (94–100)
(n = 9) |
93 (92–100)
(n = 9) |
98 (88–100)
(n = 9) |
98 (87–100)
(n = 8) |
| Good usage (%) |
46 (n = 13) |
63 (n = 8) |
80 (n = 15) |
73 (n = 15) |
89 (n = 9) |
89 (n = 9) |
67 (n = 9) |
75 (n = 8) |
| Apnoea/hypopnea index/h |
3 (1–13)
(n = 10) |
2 (0–4)
(n = 6) |
2 (1–4)
(n = 15) |
3 (2–6)
(n = 15) |
4 (2–6)
(n = 9) |
4 (1–11)
(n = 9 = |
1 (1–4)
(n = 9) |
3 (2–3)
(n = 7) |
| IPAP (hPa) |
19 (16–21)
(n = 14) |
21 (20–22)
(n = 5) |
22 (18–25)
(n = 16) |
20 (17–21)
(n = 13) |
19 (17–20)
(n = 10) |
23 (20–28)
(n = 8)
|
14 (12–17)
(n = 11) |
18 (16–19)
(n = 7) |
| EPAP (hPa) |
7 (5–8)
(n = 14) |
6 (5–7)
(n = 8) |
11 (8–13)
(n = 16) |
11 (9–13)
(n = 15) |
12 (9–14)
(n = 10) |
10 (9–10)
(n = 10) |
5 (5–6)
(n = 11) |
7 (5–8)
(n = 9) |
| Leakage (l/min) |
0 (0–2)
(n = 11) |
0 (0–0)
(n = 5) |
0 (0–3)
(n = 10) |
0 (4–10)
(n = 14) |
7 (0–34)
(n = 8) |
0 (0–7)
(n = 8) |
0 (0–1)
(n = 9) |
0 (0–15)
(n = 7) |
| Tidal volume (ml) |
510 (450–603)
(n = 12) |
515 (500–550)
(n = 6) |
450 (360–560)
(n = 14) |
565 (480–635)
(n = 15) |
580 (420–620)
(n = 9) |
550 (500–670)
(n = 9) |
505 (340–530)
(n = 10) |
500 (465–610)
(n = 8) |
| pH |
7.42 (7.41–7.44)
(n = 9) |
7.39 (7.39–7.41)
(n = 7) |
7.41 (7.40–7.43)
(n = 11) |
7.42 (7.41–7.46)
(n = 12) |
7.41 (7.34–7.45)
(n = 4) |
7.43 (7.41–7.45)
(n = 9) |
7.42 (7.41–7.43)
(n = 9) |
7.42 (7.40–7.46)
(n = 6) |
| PaO2 (kPa) |
7.95 (7.39–8.62)
(n = 9) |
8.55 (7.35–9.83)
(n = 8) |
7.80 (6.96–8.60)
(n = 11) |
7.22 (6.57–8.60)
(n = 14) |
7.24 (5.81–8.75)
(n = 4) |
8.80 (8.55–8.95)
(n = 9) |
9.41 (8.23–9.83)
(n = 8) |
9.30 (8.42–9.54)
(n = 6) |
| PaCO2 (kPa) |
5.89 (5.60–5.95)
(n = 9) |
6.02 (5.81–7.10)
(n = 8) |
5.89 (5.56–6.34)
(n = 11) |
5.43 (5.08–5.99)
(n = 14) |
6.65 (5.70–6.84)
(n = 4) |
5.28 (4.95–5.30)
(n = 9) |
5.20 (4.93–5.79)
(n = 9) |
5.57 (5.30–5.70)
(n = 6) |
| HCO3
− (mmol/l) |
28.1 (27.0–30.1)
(n = 9) |
29.5 (27.0–30.6)
(n = 8) |
26.6 (25.6–30.0)
(n = 11) |
26.0 (24.6–27.7)
(n = 13) |
28.5 (25.0–31.1)
(n = 4) |
25.9 (24.9–26.9)
(n = 9) |
25.1 (24.7–28.3)
(n = 9) |
25.7 (24.2–28.7)
(n = 6) |
| Oxygen supplementation (l/min) |
1 (0–2)
(n = 11) |
2 (2–2)
(n = 7) |
0 (0–1)
(n = 11) |
0 (0–2)
(n = 12) |
1 (0–2)
(n = 7) |
0 (0–1)
(n = 9) |
0 (0–0)
(n = 10) |
0 (0–0)
(n = 7) |
|
Follow-up date
|
1 year (0.84–1.14 yrs)
|
|
Disease
|
COPD
|
Obese COPD
|
OSA/OHS
|
Other
|
|
Mode of ventilation
|
PSV
|
iVAPS
|
PSV
|
iVAPS
|
PSV
|
iVAPS
|
PSV
|
iVAPS
|
| Minutes/night |
379 (132–575)
(n = 6) |
412 (282–500)
(n = 4) |
367 (289–366)
(n = 16) |
411 (333–445)
(n = 10) |
428 (389–455)
(n = 8) |
461 (451–493)
(n = 8) |
538 (531–601)
(n = 5) |
316 (117–688)
(n = 6) |
| Percentage of nights used |
86 (77–90)
(n = 6) |
77 (43–77)
(n = 4) |
82 (65–92)
(n = 15) |
99 (41–100)
(n = 10) |
90 (80–99)
(n = 8) |
97 (59–100)
(n = 8) |
96 (90–100)
(n = 4)
|
69 (9–86)
(n = 6) |
| Good usage (%) |
50 (n = 6) |
25 (n = 4) |
53 (n = 15) |
70 (n = 10) |
75 (n = 8) |
75 (n = 8) |
100 (n = 5) |
50 (n = 6) |
| Apnoea/hypopnea index/h |
4 (1–8)
(n = 6) |
2 (0–3)
(n = 4) |
3 (0–5)
(n = 16)
|
8 (2–9)
(n = 9) |
6 (4–12)
(n = 8) |
4 (2–11)
(n = 8) |
1 (0–3)
(n = 5) |
3 (1–7)
(n = 6) |
| IPAP (hPa) |
17 (13–21)
(n = 8) |
15 (11–16)
(n = 3) |
21 (19–25)
(n = 17) |
22 (20–25)
(n = 9) |
19 (18–19)
(n = 9) |
21 (19–23)
(n = 8) |
18 (13–19)
(n = 6) |
15 (14–16)
(n = 5) |
| EPAP (hPa) |
6 (5–7)
(n = 8) |
6 (5–7)
(n = 5) |
10 (8–12)
(n = 17) |
11 (9–13)
(n = 14) |
11 (9–13)
(n = 9) |
10 (9–10)
(n = 8) |
7 (6–10)
(n = 6) |
7 (5–8)
(n = 7) |
| Leakage (l/min) |
0 (0–0)
(n = 5) |
0 (0–1)
(n = 4) |
0 (0–0)
(n = 13) |
3 (0–9)
(n = 10) |
11 (0–72)
(n = 7) |
0 (0–8)
(n = 8) |
0 (0–0)
(n = 5) |
0 (0–0)
(n = 6) |
| Tidal volume (ml) |
455 (360–540)
(n = 6) |
475 (345–515)
(n = 4) |
505 (400–605)
(n = 16) |
595 (570–670)
(n = 10)
|
395 (310–495)
(n = 8) |
515 (458–685)
(n = 8)
|
380 (360–470) |
465 (450–580)
(n = 6) |
| pH |
7.42 (7.40–7.44)
(n = 6) |
7.41 (7.37–7.41)
(n = 5) |
7.40 (7.40–7.45)
(n = 12) |
7.41 (7.40–7.44)
(n = 9) |
7.41 (7.30–7.42)
(n = 6) |
7.42 (7.40–4.44)
(n = 6) |
7.42 (7.41–7.45)
(n = 5) |
7.42 (7.42–7.43)
(n = 5) |
| PaO2 (kPa) |
9.57 (7.22–10.90)
(n = 6) |
7.41 (712–7.48)
(n = 5) |
7.51 (6.90–8.20)
(n = 13) |
7.15 (5.98–8.56)
(n = 10) |
7.20 (6.86–9.54)
(n = 6) |
9.09 (7.89–9.85)
(n = 7) |
9.03 (8.81–9.39)
(n = 5) |
10.38 (8.67–12.20)
(n = 6) |
| PaCO2 (kPa) |
5.51 (4.40–6.30)
(n = 6) |
7.21 (6.06–7.73)
(n = 5) |
5.59 (5.49–6.46)
(n = 13) |
5.38 (4.97–5.77)
(n = 10) |
5.83 (4.64–6.90)
(n = 6) |
5.13 (4.82–5.19)
n = 7) |
4.83 (4.74–4.84)
(n = 5) |
5.28 (4.80–5.58)
(n = 6) |
| HCO3
− (mmol/l) |
26.5 (24.5–28.3)
(n = 6) |
29.0 (27.5–34.0)
(n = 5) |
27.5 (25.8–30.4)
(n = 12) |
26.5 (25.3–27.4)
(n = 10) |
28.6 (21.4–29.7)
(n = 5) |
24.3 (22.9–24.7)
(n = 6) |
24.3 (22.8–24.6)
(n = 5) |
25.2 (24.0–25.9)
(n = 6) |
| Oxygen supplementation (l/min) |
2 (0–2)
(n = 7) |
2 (1–2)
(n = 5) |
0 (0–2)
(n = 13) |
0 (0–0)
(n = 10) |
0 (0–1)
(n = 6) |
0 (0–2)
(n = 7) |
0 (0–0)
(n = 6) |
0 (0–0)
(n = 6) |
|
Follow-up date
|
Last follow-up
4.3 yrs (3.2–5.3)
|
|
Disease
|
COPD
|
Obese COPD
|
OSA/OHS
|
Other
|
|
Mode of ventilation
|
PSV
|
iVAPS
|
PSV
|
iVAPS
|
PSV
|
iVAPS
|
PSV
|
iVAPS
|
| Minutes/night |
443 (427–467)
(n = 5) |
654 (654–654)
(n = 1) |
528 (428–583)
(n = 13) |
401 (373–432)
(n = 8) |
480 (350–534)
(n = 7) |
559 (492–655)
(n = 3) |
504 (464–694)
(n = 5) |
415 (279–533)
(n = 4) |
| Percentage of nights used |
99 (88–99)
(n = 5) |
99 (99–99)
(n = 1) |
99 (95–100)
(n = 12)
|
96 (82–98)
(n = 8) |
100 (91–100)
(n = 7) |
100 (98–100)
(n = 3) |
100 (85–100)
(n = 5) |
87 (73–99)
(n = 4) |
| Good usage (%) |
80 (n = 5) |
100 (n = 1) |
100 (n = 12) |
75 (n = 8) |
86 (n = 7) |
100 (n = 3) |
80 (n = 5) |
50 (n = 4) |
| Apnoea/hypopnoea index/h |
1 (0–3)
(n = 5) |
3 (3–3)
(n = 1) |
3 (1–6)
(n = 13) |
4 (2–9)
(n = 8) |
5 (3–6)
(n = 7) |
4 (2–5)
(n = 3) |
2 (0–2)
(n = 5) |
2 (1–3)
(n = 4) |
| IPAP (hPa) |
16 (15–19)
(n = 4) |
19 (9–27)
(n = 2) |
22 (20–23)
(n = 9) |
19 (17–22)
(n = 8) |
19 (18–20)
(n = 7) |
21 (17–23)
(n = 3) |
17 (13–20)
(n = 4) |
19 (17–20)
(n = 3) |
| EPAP (hPa) |
7 (7–7)
(n = 4) |
6 (5–7)
(n = 2) |
9 (8–12)
(n = 10) |
11 (10–12)
(n = 8) |
11 (10–12)
(n = 7) |
8 (10–12)
(n = 3) |
6 (6–7)
(n = 4) |
6 (5–8)
(n = 4) |
| Leakage (l/min) |
1 (0–3)
(n = 4) |
5 (5–5)
(n = 1) |
0 (0–6)
(n = 8)
|
11 (4–45)
(n = 8) |
1 (0–6)
(n = 7) |
8 (5–15)
(n = 3) |
0 (0–0)
(n = 4) |
0 (0–1.8)
(n = 3) |
| Tidal volume (ml) |
505 (450–595)
(n = 4) |
500 (500–500)
(n = 1) |
570 (490–850)
(n = 9) |
600 (560–695)
(n = 8) |
470 (370–510)
(n = 7) |
460 (455–630 (n = 3) |
420 (370–620)
(n = 4) |
465 (425–550)
(n = 4) |
| pH |
7.41 (7.41–7.42)
(n = 5) |
7.38 (7.37–7.41)
(n = 3) |
7.42 (7.38–7.43)
(n = 10) |
7.42 (7.39–7.44)
(n = 10) |
7.46 (7.46–7.47)
(n = 5) |
7.42 (7.40–7.42)
(n = 3) |
7.40 (7.39–7.40)
(n = 3) |
7.43 (7.41–7.48)
(n = 4) |
| PaO2 (kPa) |
7.21 (6.71–9.05)
(n = 5) |
8.90 (7.96–10.35)
(n = 3) |
8.50 (7.45–9.65)
(n = 11) |
8.12 (7.44–8.50)
(n = 10) |
9.85 (9.85––9.90)
(n = 5) |
8.95 (8.62–9.24)
(n = 3) |
10.00 (9.95–10.25)
(n = 3) |
9.95 (7.75–11.12)
(n = 4) |
| PaCO2 (kPa) |
5.96 (5.30–6.05)
(n = 5) |
6.35 (6.23–7.05)
(n = 3) |
5.30 (4.79–5.90)
(n = 11) |
5.51 (5.15–5.72)
(n = 10) |
5.17 (4.90–5.40)
(n = 5) |
5.39 (5.35–5.52)
(n = 3) |
5.00 (4.76–5.30)
(n = 3) |
4.92 (4.65–5.78)
(n = 4) |
| HCO3
− (mmol/l) |
27.8 (25.3–30.9)
(n = 4) |
31.6 (29.0–31.8)
(n = 3) |
25.7 (23.2–26.8)
(n = 11) |
26.1 (24.9–27.3)
(n = 10) |
28.4 (28.4–28.6)
(n = 5) |
25.7 (24.5–26.4)
(n = 3) |
25.0 (22.4–25.7)
(n = 3) |
25.7 (23.9–28.2)
(n = 4) |
| Oxygen supplementation (l/min) |
0 (0–0)
(n = 4) |
0 (0–1)
(n = 3) |
0 (0–0)
(n = 11) |
0 (0–0)
(n = 10) |
0 (0–0)
(n = 5) |
0 (0–0)
(n = 3) |
0 (0–0)
(n = 3) |
0 (0–0)
(n = 4) |
Acknowledgements
We thank Bernarde Schillig and the NIV-team of the Cantonal Hospital of St. Gallen for their help to provide ventilator data and the Lungenliga St. Gallen-Appenzell for supporting the study.
References
1
Shneerson
JM
Simonds
AK
. Noninvasive ventilation for chest wall and neuromuscular disorders. Eur Respir J. 2002;20(2):480–7. doi:.https://doi.org/10.1183/09031936.02.00404002
2
Janssens
J-P
Derivaz
S
Breitenstein
E
De Muralt
B
Fitting
J-W
Chevrolet
J-C
Changing patterns in long-term noninvasive ventilation: a 7-year prospective study in the Geneva Lake area. Chest. 2003;123(1):67–79. doi:.https://doi.org/10.1378/chest.123.1.67
3
Czell
D
Bauer
M
Binek
J
Schoch
OD
Weber
M
. Outcomes of percutaneous endoscopic gastrostomy tube insertion in respiratory impaired amyotrophic lateral sclerosis patients under noninvasive ventilation. Respir Care. 2013;58(5):838–44.
4
Murphy
PB
Rehal
S
Arbane
G
Bourke
S
Calverley
PMA
Crook
AM
Effect of home noninvasive ventilation with oxygen therapy vs oxygen therapy alone on hospital readmission or death after an acute COPD exacerbation. JAMA. 2017;317(21):2177–86. doi:.https://doi.org/10.1001/jama.2017.4451
5
Lloyd-Owen
SJ
Donaldson
GC
Ambrosino
N
Escarabill
J
Farre
R
Fauroux
B
Patterns of home mechanical ventilation use in Europe: results from the Eurovent survey. Eur Respir J. 2005;25(6):1025–31. doi:.https://doi.org/10.1183/09031936.05.00066704
6
Arellano-Maric
MP
Gregoretti
C
Duiveman
M
Windisch
W
. Long-term volume-targeted pressure-controlled ventilation: sense or nonsense?
Eur Respir J. 2017;49(6):1602193. doi:.https://doi.org/10.1183/13993003.02193-2016
7
Storre
JH
Seuthe
B
Fiechter
R
Milioglou
S
Dreher
M
Sorichter
S
Average volume-assured pressure support in obesity hypoventilation: A randomized crossover trial. Chest. 2006;130(3):815–21. doi:.https://doi.org/10.1378/chest.130.3.815
8
Janssens
J-P
Metzger
M
Sforza
E
. Impact of volume targeting on efficacy of bi-level non-invasive ventilation and sleep in obesity-hypoventilation. Respir Med. 2009;103(2):165–72. doi:.https://doi.org/10.1016/j.rmed.2008.03.013
9
Ekkernkamp
E
Storre
JH
Windisch
W
Dreher
M
. Impact of intelligent volume-assured pressure support on sleep quality in stable hypercapnic chronic obstructive pulmonary disease patients: a randomized, crossover study. Respiration. 2014;88(4):270–6. doi:.https://doi.org/10.1159/000364946
10
Murphy
PB
Davidson
C
Hind
MD
Simonds
A
Williams
AJ
Hopkinson
NS
Volume targeted versus pressure support non-invasive ventilation in patients with super obesity and chronic respiratory failure: a randomised controlled trial. Thorax. 2012;67(8):727–34. doi:.https://doi.org/10.1136/thoraxjnl-2011-201081
11
Storre
JH
Matrosovich
E
Ekkernkamp
E
Walker
DJ
Schmoor
C
Dreher
M
Home mechanical ventilation for COPD: high-intensity versus target volume noninvasive ventilation. Respir Care. 2014;59(9):1389–97. doi:.https://doi.org/10.4187/respcare.02941
12
Jaye
J
Chatwin
M
Dayer
M
Morrell
MJ
Simonds
AK
. Autotitrating versus standard noninvasive ventilation: a randomised crossover trial. Eur Respir J. 2009;33(3):566–71. doi:.https://doi.org/10.1183/09031936.00065008
13
Dreher
M
Krüger
S
Schulze-Olden
S
Keszei
A
Storre
JH
Woehrle
H
Sleep-disordered breathing in patients with newly diagnosed lung cancer. BMC Pulm Med. 2018;18(1):72. doi:.https://doi.org/10.1186/s12890-018-0645-1
14
Nilius
G
Katamadze
N
Domanski
U
Schroeder
M
Franke
K-J
. Non-invasive ventilation with intelligent volume-assured pressure support versus pressure-controlled ventilation: effects on the respiratory event rate and sleep quality in COPD with chronic hypercapnia. Int J Chron Obstruct Pulmon Dis. 2017;12:1039–45. doi:.https://doi.org/10.2147/COPD.S126970
15
Howard
ME
Piper
AJ
Stevens
B
Holland
AE
Yee
BJ
Dabscheck
E
A randomised controlled trial of CPAP versus non-invasive ventilation for initial treatment of obesity hypoventilation syndrome. Thorax. 2017;72(5):437–44. doi:.https://doi.org/10.1136/thoraxjnl-2016-208559
16
McArdle
N
Rea
C
King
S
Maddison
K
Ramanan
D
Ketheeswaran
S
Treating chronic hypoventilation with automatic adjustable versus fixed EPAP intelligent volume-assured positive airway pressure support (iVAPS): a randomized controlled trial. Sleep (Basel). 2017;40(10). doi:.https://doi.org/10.1093/sleep/zsx136
17
Orr
JE
Coleman
J
Criner
GJ
Sundar
KM
Tsai
SC
Benjafield
AV
Automatic EPAP intelligent volume-assured pressure support is effective in patients with chronic respiratory failure: A randomized trial. Respirology. 2019;24(12):1204–11. doi:.https://doi.org/10.1111/resp.13546
18
Kelly
JL
Jaye
J
Pickersgill
RE
Chatwin
M
Morrell
MJ
Simonds
AK
. Randomized trial of ‘intelligent’ autotitrating ventilation versus standard pressure support non-invasive ventilation: impact on adherence and physiological outcomes. Respirology. 2014;19(4):596–603. doi:.https://doi.org/10.1111/resp.12269
19
Cantero
C
Adler
D
Pasquina
P
Uldry
C
Egger
B
Prella
M
Long-term noninvasive ventilation in the Geneva lake area: indications, prevalence, and modalities. Chest. 2020;158(1):279–91. doi:.https://doi.org/10.1016/j.chest.2020.02.064
20
Masa
JF
Celli
BR
Riesco
JA
Hernández
M
Sánchez De Cos
J
Disdier
C
. The obesity hypoventilation syndrome can be treated with noninvasive mechanical ventilation. Chest. 2001;119(4):1102–7. doi:.https://doi.org/10.1378/chest.119.4.1102
21
Ojeda Castillejo
E
de Lucas Ramos
P
López Martin
S
Resano Barrios
P
Rodríguez Rodríguez
P
Morán Caicedo
L
Noninvasive mechanical ventilation in patients with obesity hypoventilation syndrome. Long-term outcome and prognostic factors. Arch Bronconeumol. 2015;51(2):61–8. doi:.https://doi.org/10.1016/j.arbr.2014.06.016
22
Köhnlein
T
Windisch
W
Köhler
D
Drabik
A
Geiseler
J
Hartl
S
Non-invasive positive pressure ventilation for the treatment of severe stable chronic obstructive pulmonary disease: a prospective, multicentre, randomised, controlled clinical trial. Lancet Respir Med. 2014;2(9):698–705. doi:.https://doi.org/10.1016/S2213-2600(14)70153-5
23
Simonds
AK
Elliott
MW
. Outcome of domiciliary nasal intermittent positive pressure ventilation in restrictive and obstructive disorders. Thorax. 1995;50(6):604–9. doi:.https://doi.org/10.1136/thx.50.6.604
24
Bach
JR
Alba
AS
Saporito
LR
. Intermittent positive pressure ventilation via the mouth as an alternative to tracheostomy for 257 ventilator users. Chest. 1993;103(1):174–82. doi:.https://doi.org/10.1378/chest.103.1.174
25
Nickol
AH
Hart
N
Hopkinson
NS
Moxham
J
Simonds
A
Polkey
MI
. Mechanisms of improvement of respiratory failure in patients with restrictive thoracic disease treated with non-invasive ventilation. Thorax. 2005;60(9):754–60. doi:.https://doi.org/10.1136/thx.2004.039388
26
Borel
JC
Pepin
JL
Pison
C
Vesin
A
Gonzalez-Bermejo
J
Court-Fortune
I
Long-term adherence with non-invasive ventilation improves prognosis in obese COPD patients. Respirology. 2014;19(6):857–65. doi:.https://doi.org/10.1111/resp.12327
27
Kapur
VK
Auckley
DH
Chowdhuri
S
Kuhlmann
DC
Mehra
R
Ramar
K
Clinical practice guideline for diagnostic testing for adult obstructive sleep apnea: an American Academy of Sleep Medicine clinical practice guideline. J Clin Sleep Med. 2017;13(3):479–504. doi:.https://doi.org/10.5664/jcsm.6506
28
Horvath
CM
Brutsche
MH
Schoch
OD
Schillig
B
Baty
F
vonOw
D
NIV by an interdisciplinary respiratory care team in severe respiratory failure in the emergency department limited to day time hours. Intern Emerg Med. 2017;12(8):1215–23. doi:.https://doi.org/10.1007/s11739-016-1546-z
29Urbanek S, Bibiko H-J, Stefano ML. R: a language and environment for statistical computing. The R Foundation for Statistical Computing; 2014.
30
Contal
O
Adler
D
Borel
J-C
Espa
F
Perrig
S
Rodenstein
D
Impact of different backup respiratory rates on the efficacy of noninvasive positive pressure ventilation in obesity hypoventilation syndrome: a randomized trial. Chest. 2013;143(1):37–46. doi:.https://doi.org/10.1378/chest.11-2848
31
Masa
JF
Corral
J
Caballero
C
Barrot
E
Terán-Santos
J
Alonso-Álvarez
ML
Spanish Sleep Network
. Non-invasive ventilation in obesity hypoventilation syndrome without severe obstructive sleep apnoea. Thorax. 2016;71(10):899–906. doi:.https://doi.org/10.1136/thoraxjnl-2016-208501
32
Masa
JF
Mokhlesi
B
Benítez
I
Gomez de Terreros
FJ
Sánchez-Quiroga
MÁ
Romero
A
Spanish Sleep Network
. Long-term clinical effectiveness of continuous positive airway pressure therapy versus non-invasive ventilation therapy in patients with obesity hypoventilation syndrome: a multicentre, open-label, randomised controlled trial. Lancet. 2019;393(10182):1721–32. doi:.https://doi.org/10.1016/S0140-6736(18)32978-7
33
Windisch
W
Quality of life in home mechanical ventilation study group
. Impact of home mechanical ventilation on health-related quality of life. Eur Respir J. 2008;32(5):1328–36. doi:.https://doi.org/10.1183/09031936.00066407