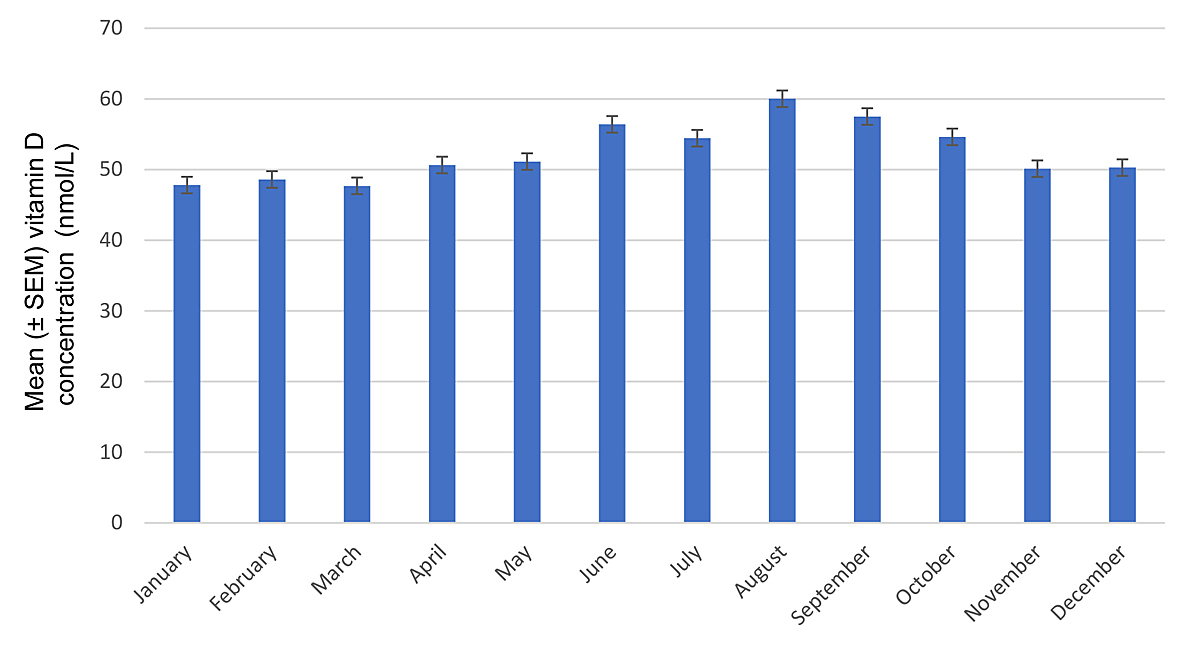
Figure 1 Vitamin D concentrations according to months. Error bars represent standard errors of the mean (SEM).
DOI: https://doi.org/10.4414/smw.2021.20470
Vitamin D deficiency has become a major, yet preventable, health concern [1]. Sufficient serum levels are necessary for proper bone metabolism and muscular function [2–4]; accordingly, elderly persons with hip fractures commonly have vitamin D deficiency [5]. Fatigue, chronic pain and many other conditions such as type 2 diabetes, parathyroid disease, rheumatoid arthritis, polymyalgia, inflammatory bowel disease, cardiovascular disease, hypertension, depression and even autism have been associated with vitamin D deficiency [6–17], but a causal relationship often has not been established. Vitamin D deficiency has also been linked with a higher mortality rate in malnourished inpatients [18]. A recent large randomised controlled trial reported a reduction in the incidence of advanced cancer by vitamin D supplementation [19].
Although dietary intake plays a minor role in vitamin D supply, insufficient exposure to sunlight represents the main risk for deficiency by reducing the amount of ultraviolet B (UVB) radiation that reaches and penetrates the skin [20–24].
Vitamin D3 (cholecalciferol), synthesised in the skin from 7-dehydrocholesterol under the influence of UVB, is hydroxylated to 25(OH)-vitamin D3 (calcidiol) in the liver and to 1,25(OH)2-vitamin D3 (calcitriol, the active form) in the kidney. Low blood calcium and phosphate concentrations, as well as parathyroid hormone (PTH), stimulate the hydroxylation to calcitriol, which increases serum calcium and phosphate levels by promoting intestinal absorption and mobilisation from the bone. Sufficient blood calcium and phosphate concentrations are key for proper skeletal mineralisation [20].
There is no consensus as to what serum concentration of vitamin D defines deficiency. An Australian study found that minimum effective serum levels were lower for skeletal than non-skeletal diseases. In that study, vitamin D3 concentration as low as 25 nmol/l was associated with a minimal risk for rickets and osteomalacia, whereas 50 nmol/l was necessary to prevent osteoporosis and fractures, 75 nmol/l to prevent premature mortality and depression, 80 nmol/l for prevention of diabetes and cardiovascular disease, 95 nmol/l to prevent falls and respiratory infections and 100 nmol/l for cancer prevention [25]. The Swiss Federal Commission for Nutrition defined serum levels <25 nmol/l and 25–50 mmol/l as severely deficient and deficient, respectively [26]. Target levels for the general population are >50 nmol/l, but individuals at risk should have vitamin D concentrations >75 nmol/l for optimal bone health and prevention of falls [26].
Our study aimed to examine the association of vitamin D serum concentration with gender, time of the year and age in a large inpatient population.
The study was a retrospective analysis evaluating anonymised data obtained from the central laboratory of the cantonal hospital Basel-Country (KSBL). Blood samples were drawn from patients hospitalised between January 2013 and August 2017 in the surgical, medical and geriatric departments of the KSBL at Liestal and Bruderholz. The decision to measure vitamin D levels remained entirely at the discretion of the treating physicians, except in the geriatric department, where vitamin D is routinely measured in all patients upon hospitalisation. This study included data from 8861 individuals between the ages of 18 and 102 years. Some patients had their serum vitamin D determined more than once over the course of the study. In these cases, only the first measurement was used for analysis. Our patient sample included 3848 males (43.4%) and 5013 females (56.6%). A total of 5536 (42.2%) vitamin D measurements were taken from men and 7583 (57.8%) from women.
The dataset included gender, age and time of the year when the vitamin D sample was taken. Vitamin D measurements were also stratified into eight age groups, as well as according to the month and season in which they were measured. Spring was defined as the period of April, May and June; summer as July, August and September; autumn as October, November and December; and winter as January, February and March.
Serum 25(OH)-vitamin D3 concentrations (generally referred to as “vitamin D” in this paper) were measured in the central laboratory of the KSBL using liquid chromatography coupled to tandem mass spectrometry (LC-MS/MS; Thermo Fisher), using a kit from Chromsystems™, München.
In accordance with recommendations by the Swiss Federal Commission for Nutrition [26], vitamin D deficiency was defined as serum concentrations <50 nmol/l, and severe deficiency as <25 nmol/l. Vitamin D levels were considered sufficient at >75 nmol/, as PTH is optimally suppressed at this concentration, leading to ideal bone and muscle health. Values between 50 and 75 nmol/l represent a grey area. Values <10 nmol/l were rounded up to 10 nmol/l and values >225 nmol/l were rounded down to 225 nmol/l.
Effects of sex, age (in years), year and season on vitamin D levels were assessed using multiple linear regression. Besides the exact date of the blood draws, these were the only available independent variables. Robust standard errors were computed to adjust for heteroskedasticity of residuals. In a second step, potential interactions between sex and age, sex and season, as well as between age and season were tested. Differences in relative frequencies were assessed using Fisher’s exact test. Model comparisons were performed using partial F-tests. Statistical significance was defined as p <0.05. Statistical analyses were conducted using R, version 1.2.1335.
An overview of the patients’ characteristics is shown in table 1. The mean ± standard deviation (SD) age was 69.2 ± 18.4 years, with females being slightly older than males. The mean ± SD vitamin D serum concentration was 52.2 ± 30.5 nmol/l, with women showing a higher mean of 55.5 ± 31.5 nmol/l, compared with 48.1 ± 28.6 nmol/ in men (p <10-5).
Table 1 Patient characteristics and vitamin D concentrations according to gender.
| Male | Female | Total | |
|---|---|---|---|
| Mean age ± SD (years) | 68.8 ± 17.2 | 69.5 ± 19.2 | 69.2 ± 18.4 |
| Number of patients (%) | 3848 (43.4) | 5013 (56.6) | 8861 (100) |
| Mean vitamin D level ± SD (nmol/l) | 48.1 ± 28.6 | 55.5 ± 31.5 | 52.2 ± 30.5 |
| Median vitamin D level (nmol/l) (IQR) | 44.0 (25.0–65.0) | 52.0 (29.0–76.0) | 49.0 (27.0–72.0) |
IQR = interquartile range; SD = standard deviation
As shown in table 2, 4527 (51%) of the 8861 patients had vitamin D levels <50 nmol/l, including 1860 (21.0%) with levels <25 nmol/l. A total of 1959 (22%) had values >75 nmol/l, and 2375 (27%) were in the grey zone between 50 and 75 nmol/l. Among males, vitamin D levels <50 nmol/l were seen in 57%, as compared with 47% in females (p <0.001).
Table 2 Distribution of vitamin D concentrations by gender.
| Vitamin D levels | |||||
|---|---|---|---|---|---|
| <25 nmol/l | 25–49 nmol/l | 50–75 nmol/L | >75 nmol/l | Total (%) | |
| Male (%) | 910 (23.6) | 1280 (33.3) | 1007 (26.2) | 651 (16.9) | 3848 (100) |
| Female (%) | 950 (18.9) | 1387 (27.7) | 1368 (27.3) | 1308 (26.1) | 5013 (100) |
As shown in table 3, the highest mean ± SD vitamin D concentration was found in the patients aged 90-102 years (53.6 ± 34.5 nmol/l), and the lowest in patients aged 30–39 years (50.6 ± 26.4 nmol/l). Women had higher mean vitamin D levels than men in each of the age groups, reaching a maximum value of 56.9 ± 35.4 nmol/l in the group aged 90–102 and a minimum of 52.2 ± 31.9 nmol/l in the group aged 50–59. The mean ± SD peak concentration in men was 50.3 ±31.9 nmol/l in 50–59-year-olds, the lowest value of 44.1 ± 23.5 nmol/l was observed in the age group 18–29. There was a positive, albeit not statistically significant, association between vitamin D concentrations and age (p = 0.06).
Table 3 Vitamin D concentrations by age groups and gender.
| Age group | Mean ± standard deviation vitamin D levels (nmol/l) | ||
|---|---|---|---|
| Male | Female | Total | |
| 18–29 years | 44.1 ± 23.5 | 54.4 ± 25.7 | 50.9 ± 25.4 |
| 30–39 years | 45.8 ± 24.8 | 53.6 ± 27.0 | 50.6 ± 26.4 |
| 40–49 years | 47.3 ± 27.8 | 55.1 ± 30.2 | 52.0 ± 29.4 |
| 50–59 years | 50.3 ± 31.9 | 52.2 ± 31.9 | 51.3 ± 31.9 |
| 60–69 years | 48.1 ± 29.6 | 55.8 ± 32.5 | 51.9 ± 31.2 |
| 70–79 years | 48.9 ± 27.7 | 55.3 ± 30.6 | 52.3 ± 29.4 |
| 80–89 years | 47.7 ± 28.0 | 56.5 ± 32.3 | 52.9 ± 30.9 |
| 90–102 years | 46.6 ± 31.3 | 56.9 ± 35.4 | 53.6 ± 34.5 |
As seen in figure 1, mean ± standard error (SEM) vitamin D concentrations over the whole observation period and across all age groups were highest during the summer, peaking at 60.0 ± 28.4 nmol/l in August. Figure 2 depicts vitamin D levels according to season across age groups. Mean ± SEM levels were 57.1 ± 29.5 nmol/l in the summer, 51.6 ± 29.6 nmol/l in the autumn, 48.0 ± 31.2 nmol/l in the winter and 52.7 ± 30.7 nmol/l in the spring (p <10−5). Analysis of seasonal differences showed that average vitamin D concentrations were similar in spring and autumn (p = 0.38) across all age groups. Vitamin D levels were higher in summer than in winter across all age groups (p <10-5). Differences across age groups were statistically significant in summer (p <0.001) and winter (p <0.001), but not in spring (p = 0.58) and autumn (p = 0.25). Patients younger than 80 years had mean serum levels below 50 nmol/l during winter months, with a minimum mean concentration of 42.2 ± 25.3 nmol/l in 18–29-year-olds; only the age group 80–102 years had mean serum vitamin D concentrations above 50 nmol/l in winter, reaching 54.6 ± 34.6 nmol/l in the age group 90–102. Conversely, in summer patients aged 18–49 had vitamin D levels above 60 nmol/l, with a maximum of 64.2 ± 26.3 nmol/– in the age group 18–29, whereas patients in the age groups 50–102 had mean vitamin D values below 60 nmol/l, with a minimum of 53.9 ± 29.4 nmol/l in patients aged 80–89.
Figure 1 Vitamin D concentrations according to months. Error bars represent standard errors of the mean (SEM).
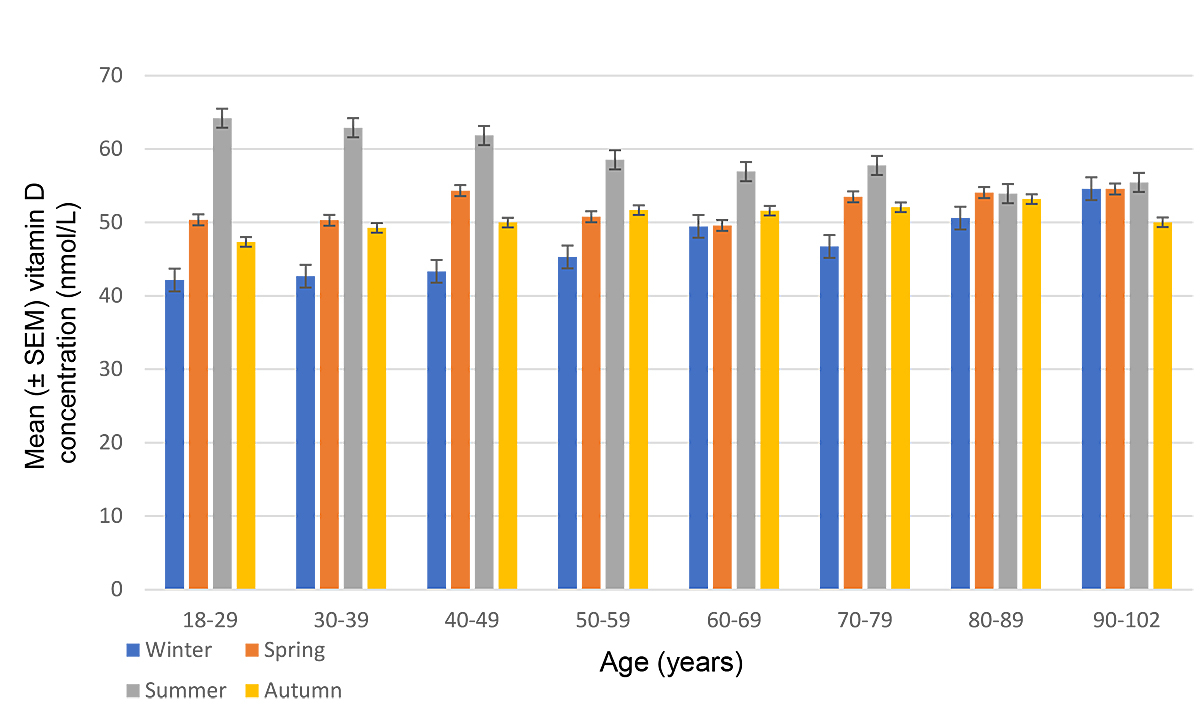
Figure 2 Mean concentrations of vitamin D by age group and season. Error bars represent standard errors of the mean (SEM).
We also analysed mean vitamin D levels for each year of the observation period. As shown in table 4, values increased continuously from 2013 to 2017 from a mean value of 47.8 nmol/l (95% confidence interval [CI] 46–49.6) in 2013 to 56.7 nmol/l (95% CI 55.1–58.4) in 2017.
Table 4 Vitamin D concentrations according to year.
| Year | Mean Vitamin D level (nmol/l) | 95% confidence interval |
|---|---|---|
| 2013 | 47.8 | 46–49.6 |
| 2014 | 48.3 | 47–49.6 |
| 2015 | 53.3 | 52.1–54.6 |
| 2016 | 53.6 | 52.4–54.8 |
| 2017 | 56.7 | 55.1–58.4 |
Mean values were adjusted for differences in the distribution of age, gender and season across years.
The results of the multivariable linear regression analysis of the effects of sex, age, year and season on vitamin D levels are shown in table 5.
Table 5 Results of multivariable linear regression model of Vitamin D level as a function of subject’s age, sex and year and season of measurement.
| N = 8861 | Effect estimate | 95% confidence interval | p-value | ||
|---|---|---|---|---|---|
| Intercept* | 50.77038 | 48.49 | 53.05066 | <0.0001 | |
| Sex | Women | 0 | |||
| Men | −7.459619 | −8.6998 | −6.219397 | <0.0001 | |
| Age | 0.0312929 | −0.0009 | 0.0634636 | 0.06 | |
| Year | 2013 | 0 | |||
| 2014 | 0.4794427 | −1.7686 | 2.727496 | 0.68 | |
| 2015 | 5.524834 | 3.3343 | 7.715413 | <0.0001 | |
| 2016 | 5.77482 | 3.5973 | 7.952372 | <0.0001 | |
| 2017 | 8.922963 | 6.3913 | 11.4546 | <0.0001 | |
| Season | Apr–June | 0 | |||
| Jul–Sep | 5.913223 | 4.125 | 7.701424 | <0.0001 | |
| Oct–Dec | 0.8211778 | −1.0219 | 2.664207 | 0.38 | |
| Jan–Mar | −4.71372 | −6.4547 | −2.972704 | <0.0001 | |
| * Estimate for 70-year-old women measured in Apr–Jun 2013 | |||||
In our sample of 8861 first measurements in hospitalised patients, only 22% were in the desired range of vitamin D sufficiency (>75 nmol/l), a figure comparable to that found in a population-based Swiss study [27]. Our findings are not entirely in line with recent studies done in Switzerland, which used the same cut-off values for vitamin D deficiency and sufficiency. One report of a Swiss rheumatology outpatient population had a lower sufficiency rate (14%), but also a lower rate of severe deficiency (7%) [28]. Another study including patients from Swiss primary care had a sufficiency rate of 8.4%, a deficiency rate of 59.2% and a severe deficiency rate of 12.3% [29]. The difference in sufficiency rate could be attributed to the fact that, on average, patients in this study were 10 years older than in the aforementioned reports (66.9 vs 52.6 and 55.0–56.7 years), and one can assume that older patients are more likely to receive vitamin D supplements. The high rate of severe vitamin D deficiency in our sample might result from measurements being made year-round, which was not done in the above-mentioned studies. Additionally, in non-geriatric patients, vitamin D measurements could have been motivated by clinical factors such as comorbidities or signs of malnutrition, potentially introducing a selection bias.
In our study population, women had higher mean serum vitamin D concentrations than men. It is known that gender plays a significant role in vitamin D concentrations, but with female sex being associated with lower levels, as shown in a worldwide review from 2009 [30]. A possible explanation for this unexpected difference is that women in our sample were more likely to receive supplementation earlier in their life than men for two main reasons: first, as recommended by the Central European guidelines for the supplementation of vitamin D [31], women are encouraged to maintain adequate vitamin D intake before and during pregnancy to prevent pregnancy and fetal development complications; and second, as shown in a review by the European Society for Clinical and Economic Aspects of Osteoporosis and Osteoarthritis (ESCEO) [32], postmenopausal women are at a high risk of developing osteoporosis and adequate vitamin D supplementation at levels <50 nmol/l is necessary for risk reduction. This may, in turn, lead to women receiving vitamin D supplementation at an earlier age than men, who are less at risk for osteoporosis. However, why this reasoning should not apply to females in other areas is unclear.
Another unexpected finding of our study was the very minimal fluctuation of vitamin D concentrations across different age groups. Even more surprising was that the mean vitamin D level was highest among patients aged 90–102 years (53.6 nmol/l). Several studies have shown that old age is associated with lower vitamin D levels, in part because of the decreased capacity of ageing skin to produce vitamin D3 [21] and because older people tend to spend less time in direct sunlight [5]. The most likely explanation for our results is that elderly people in our highly medicalised region are more likely to receive vitamin D supplementation than persons living elsewhere. Similarly, increased awareness of vitamin D deficiency among physicians and the general population might also explain our observation that mean levels increased steadily over the 5-year observation period.
As expected, vitamin D levels were at their minimum during winter months, since lower serum concentrations are associated with circumstances leading to decreased skin exposure to UVB [22]. Spring and autumn had similar mean concentrations of 52.7 ± 30.7 nmol/l and 51.7 ± 29.6 nmol/l, respectively, with summer having the highest mean value at 57.1 ± 29.5 nmol/l.
Our results show that older patients had less fluctuation in mean serum vitamin D concentrations over the course of the year than younger individuals. Weaker fluctuation in the older population could be explained by vitamin D substitution given throughout the whole year. Also, elderly and frail persons tend to stay indoor irrespective of the season. A possible explanation for the drop in vitamin D levels in autumn is that patients receive less supplementation after the summer, when exposure to sunlight is still deemed sufficient to reach adequate levels. Once concentrations begin to drop in the autumn, supplementation is restarted, which would explain the rise of vitamin D values in winter.
Although our results suggest that patients, especially the elderly, do indeed receive vitamin D supplements, mean vitamin D levels nevertheless remain lower than recommended in current guidelines. Vitamin D supplementation guidelines from 2017 recommend target concentrations >75 nmol/l, preferably in the range of 100–150 nmol/l, especially when the non-musculoskeletal effects of vitamin D are taken into account [33]. Recommended therapeutic doses for a treatment lasting between 1 and 3 months for adults and the elderly with vitamin D concentrations <50 nmol/l are 7000–10,000 IU/day followed by a maintenance dose, which is significantly higher than the amounts recommended by the Swiss Federal Commission for Nutrition [26, 31]. The Central European guidelines additionally recommend vitamin D supplementation of 800–2000 IU/day in the general population for adults aged 18–64 years between September and April and for the elderly (>65 years) throughout the whole year [31].
Our study has several strengths and limitations. Our cohort comprises a large inpatient population across a wide age range, offering valuable information about the current prevalence of vitamin D deficiency.
The main limitation is that only the influence of age, gender and season on vitamin D levels could be investigated. We had no information on the motivation of treating physicians to measure vitamin D levels; thus, the patient sample was not unselected, except for the geriatric population, where measurements are routinely performed in all patients. As opposed to comprehensive population-based studies [27], information on medical history, vitamin D supplementation status, comorbidities, life-style, body mass index, or menopausal status was lacking. If these additional factors could have been included in the regression models, the interpretation of our data would have been more precise. Also, because this study only includes hospitalised patients, it is unclear how well the results apply to the general population.
Vitamin D deficiency is a common finding in hospitalised patients, affecting all age groups. Over half (51%) of the values measured were below 50 nmol/l, reflecting a high prevalence of vitamin D deficiency. Only 22.1% of measurements showed recommended target values >75 nmol/l. Adherence to national and international guidelines on vitamin D supplementation may help improve overall quality of life and reduce medical costs [26, 33].
We are indebted to Dr Jürgen Muser, head of the central laboratory of the KSBL, for supplying the anonymised dataset of vitamin D concentrations.
There was no funding for this study. None of the authors have any conflict of interest.
1 Holick MF , Chen TC . Vitamin D deficiency: a worldwide problem with health consequences. Am J Clin Nutr. 2008;87(4):1080S–6S. doi:.https://doi.org/10.1093/ajcn/87.4.1080S
2 Tanner SB , Harwell SA . More than healthy bones: a review of vitamin D in muscle health. Ther Adv Musculoskelet Dis. 2015;7(4):152–9. doi:.https://doi.org/10.1177/1759720X15588521
3 Girgis CM , Clifton-Bligh RJ , Hamrick MW , Holick MF , Gunton JE . The roles of vitamin D in skeletal muscle: form, function, and metabolism. Endocr Rev. 2013;34(1):33–83. doi:.https://doi.org/10.1210/er.2012-1012
4 Bischoff-Ferrari HA , Willett WC , Wong JB , Stuck AE , Staehelin HB , Orav EJ , et al. Prevention of nonvertebral fractures with oral vitamin D and dose dependency: a meta-analysis of randomized controlled trials. Arch Intern Med. 2009;169(6):551–61. doi:.https://doi.org/10.1001/archinternmed.2008.600
5 Bischoff-Ferrari HA , Can U , Staehelin HB , Platz A , Henschkowski J , Michel BA , et al. Severe vitamin D deficiency in Swiss hip fracture patients. Bone. 2008;42(3):597–602. doi:.https://doi.org/10.1016/j.bone.2007.10.026
6 Schlögl M , Chocano-Bedoya P , Dawson-Hughes B , Orav EJ , Freystaetter G , Theiler R , et al. Effect of Monthly Vitamin D on Chronic Pain Among Community-Dwelling Seniors: A Randomized, Double-Blind Controlled Trial. J Am Med Dir Assoc. 2019;20(3):356–61. doi:.https://doi.org/10.1016/j.jamda.2018.09.004
7 Wu Z , Camargo CA, Jr , Sluyter JD , Khaw KT , Malihi Z , Waayer D , et al. Association between serum 25-hydroxyvitamin D levels and self-reported chronic pain in older adults: A cross-sectional analysis from the ViDA study. J Steroid Biochem Mol Biol. 2019;188:17–22. doi:.https://doi.org/10.1016/j.jsbmb.2018.11.018
8 Bischoff-Ferrari HA , Borchers M , Gudat F , Dürmüller U , Stähelin HB , Dick W . Vitamin D receptor expression in human muscle tissue decreases with age. J Bone Miner Res. 2004;19(2):265–9. doi:.https://doi.org/10.1359/jbmr.2004.19.2.265
9 Shinchuk LM , Holick MF . Vitamin d and rehabilitation: improving functional outcomes. Nutr Clin Pract. 2007;22(3):297–304. doi:.https://doi.org/10.1177/0115426507022003297
10 Wimalawansa SJ . Non-musculoskeletal benefits of vitamin D. J Steroid Biochem Mol Biol. 2018;175:60–81. doi:.https://doi.org/10.1016/j.jsbmb.2016.09.016
11 Pittas AG , Lau J , Hu FB , Dawson-Hughes B . The role of vitamin D and calcium in type 2 diabetes. A systematic review and meta-analysis. J Clin Endocrinol Metab. 2007;92(6):2017–29. doi:.https://doi.org/10.1210/jc.2007-0298
12 Vimaleswaran KS , Berry DJ , Lu C , Tikkanen E , Pilz S , Hiraki LT , et al.; Genetic Investigation of Anthropometric Traits-GIANT Consortium. Causal relationship between obesity and vitamin D status: bi-directional Mendelian randomization analysis of multiple cohorts. PLoS Med. 2013;10(2):e1001383. doi:.https://doi.org/10.1371/journal.pmed.1001383
13 Saneei P , Salehi-Abargouei A , Esmaillzadeh A . Serum 25-hydroxy vitamin D levels in relation to body mass index: a systematic review and meta-analysis. Obes Rev. 2013;14(5):393–404. doi:.https://doi.org/10.1111/obr.12016
14 Dobnig H , Pilz S , Scharnagl H , Renner W , Seelhorst U , Wellnitz B , et al. Independent association of low serum 25-hydroxyvitamin d and 1,25-dihydroxyvitamin d levels with all-cause and cardiovascular mortality. Arch Intern Med. 2008;168(12):1340–9. doi:.https://doi.org/10.1001/archinte.168.12.1340
15 Giovannucci E , Liu Y , Rimm EB , Hollis BW , Fuchs CS , Stampfer MJ , et al. Prospective study of predictors of vitamin D status and cancer incidence and mortality in men. J Natl Cancer Inst. 2006;98(7):451–9. doi:.https://doi.org/10.1093/jnci/djj101
16 Baeke F , Takiishi T , Korf H , Gysemans C , Mathieu C . Vitamin D: modulator of the immune system. Curr Opin Pharmacol. 2010;10(4):482–96. doi:.https://doi.org/10.1016/j.coph.2010.04.001
17 Plotnikoff GA , Quigley JM . Prevalence of severe hypovitaminosis D in patients with persistent, nonspecific musculoskeletal pain. Mayo Clin Proc. 2003;78(12):1463–70. doi:.https://doi.org/10.4065/78.12.1463
18 Merker M , Amsler A , Pereira R , Bolliger R , Tribolet P , Braun N , et al. Vitamin D deficiency is highly prevalent in malnourished inpatients and associated with higher mortality: A prospective cohort study. Medicine (Baltimore). 2019;98(48):e18113. doi:.https://doi.org/10.1097/MD.0000000000018113
19 Chandler PD , Chen WY , Ajala ON , Hazra A , Cook N , Bubes V , et al.; VITAL Research Group. Effect of Vitamin D3 Supplements on Development of Advanced Cancer: A Secondary Analysis of the VITAL Randomized Clinical Trial. JAMA Netw Open. 2020;3(11):e2025850. doi:.https://doi.org/10.1001/jamanetworkopen.2020.25850
20 Holick MF . Vitamin D deficiency. N Engl J Med. 2007;357(3):266–81. doi:.https://doi.org/10.1056/NEJMra070553
21 MacLaughlin J , Holick MF . Aging decreases the capacity of human skin to produce vitamin D3. J Clin Invest. 1985;76(4):1536–8. doi:.https://doi.org/10.1172/JCI112134
22 Webb AR . Who, what, where and when-influences on cutaneous vitamin D synthesis. Prog Biophys Mol Biol. 2006;92(1):17–25. doi:.https://doi.org/10.1016/j.pbiomolbio.2006.02.004
23 Mendes MM , Darling AL , Hart KH , Morse S , Murphy RJ , Lanham-New SA . Impact of high latitude, urban living and ethnicity on 25-hydroxyvitamin D status: A need for multidisciplinary action? J Steroid Biochem Mol Biol. 2019;188:95–102. doi:.https://doi.org/10.1016/j.jsbmb.2018.12.012
24 Chen TC , Chimeh F , Lu Z , Mathieu J , Person KS , Zhang A , et al. Factors that influence the cutaneous synthesis and dietary sources of vitamin D. Arch Biochem Biophys. 2007;460(2):213–7. doi:.https://doi.org/10.1016/j.abb.2006.12.017
25 Spedding S , Vanlint S , Morris H , Scragg R . Does vitamin D sufficiency equate to a single serum 25-hydroxyvitamin D level or are different levels required for non-skeletal diseases? Nutrients. 2013;5(12):5127–39. doi:.https://doi.org/10.3390/nu5125127
26 Bischoff-Ferrari HA , Keller U , Burckhardt P , Quack Lötscher KC , Gerber B , et al. Empfehlungen der Eidgenössischen Ernährungskommission zur Vitamin-D-Zufuhr für die Schweizer Bevölkerung. Swiss Med Forum. 2012;12(40):775–8. doi:.https://doi.org/10.4414/smf.2012.01279
27 Guessous I , Dudler V , Glatz N , Theler JM , Zoller O , Paccaud F , et al.; Swiss Survey on Salt Group. Vitamin D levels and associated factors: a population-based study in Switzerland. Swiss Med Wkly. 2012;142:0. Published online November 26, 2012. doi:.https://doi.org/10.4414/smw.2012.13719
28 Stoll D , Dudler J , Lamy O , Hans D , So A , Krieg MA , et al. High prevalence of hypovitaminosis D in a Swiss rheumatology outpatient population. Swiss Med Wkly. 2011;141:w13196. doi:.https://doi.org/10.4414/smw.2011.13196
29 Merlo C , Trummler M , Essig S , Zeller A . Vitamin D Deficiency in Unselected Patients from Swiss Primary Care: A Cross-Sectional Study in Two Seasons. PLoS One. 2015;10(9):e0138613. doi:.https://doi.org/10.1371/journal.pone.0138613
30 Mithal A , Wahl DA , Bonjour J-P , Burckhardt P , Dawson-Hughes B , Eisman JA , et al.; IOF Committee of Scientific Advisors (CSA) Nutrition Working Group. Global vitamin D status and determinants of hypovitaminosis D. Osteoporos Int. 2009;20(11):1807–20. doi:.https://doi.org/10.1007/s00198-009-0954-6
31 Płudowski P , Karczmarewicz E , Bayer M , Carter G , Chlebna-Sokół D , Czech-Kowalska J , et al. Practical guidelines for the supplementation of vitamin D and the treatment of deficits in Central Europe - recommended vitamin D intakes in the general population and groups at risk of vitamin D deficiency. Endokrynol Pol. 2013;64(4):319–27. doi:.https://doi.org/10.5603/EP.2013.0012
32 Rizzoli R , Boonen S , Brandi M-L , Bruyère O , Cooper C , Kanis JA , et al. Vitamin D supplementation in elderly or postmenopausal women: a 2013 update of the 2008 recommendations from the European Society for Clinical and Economic Aspects of Osteoporosis and Osteoarthritis (ESCEO). Curr Med Res Opin. 2013;29(4):305–13. doi:.https://doi.org/10.1185/03007995.2013.766162
33 Pludowski P , Holick MF , Grant WB , Konstantynowicz J , Mascarenhas MR , Haq A , et al. Vitamin D supplementation guidelines. J Steroid Biochem Mol Biol. 2018;175:125–35. doi:.https://doi.org/10.1016/j.jsbmb.2017.01.021
There was no funding for this study. None of the authors have any conflict of interest.